Allosteric fine-tuning of the conformational equilibrium poises the chaperone BiP for post-translational regulation
- University of Leeds, United Kingdom
Figures
Figure 1 with 1 supplement
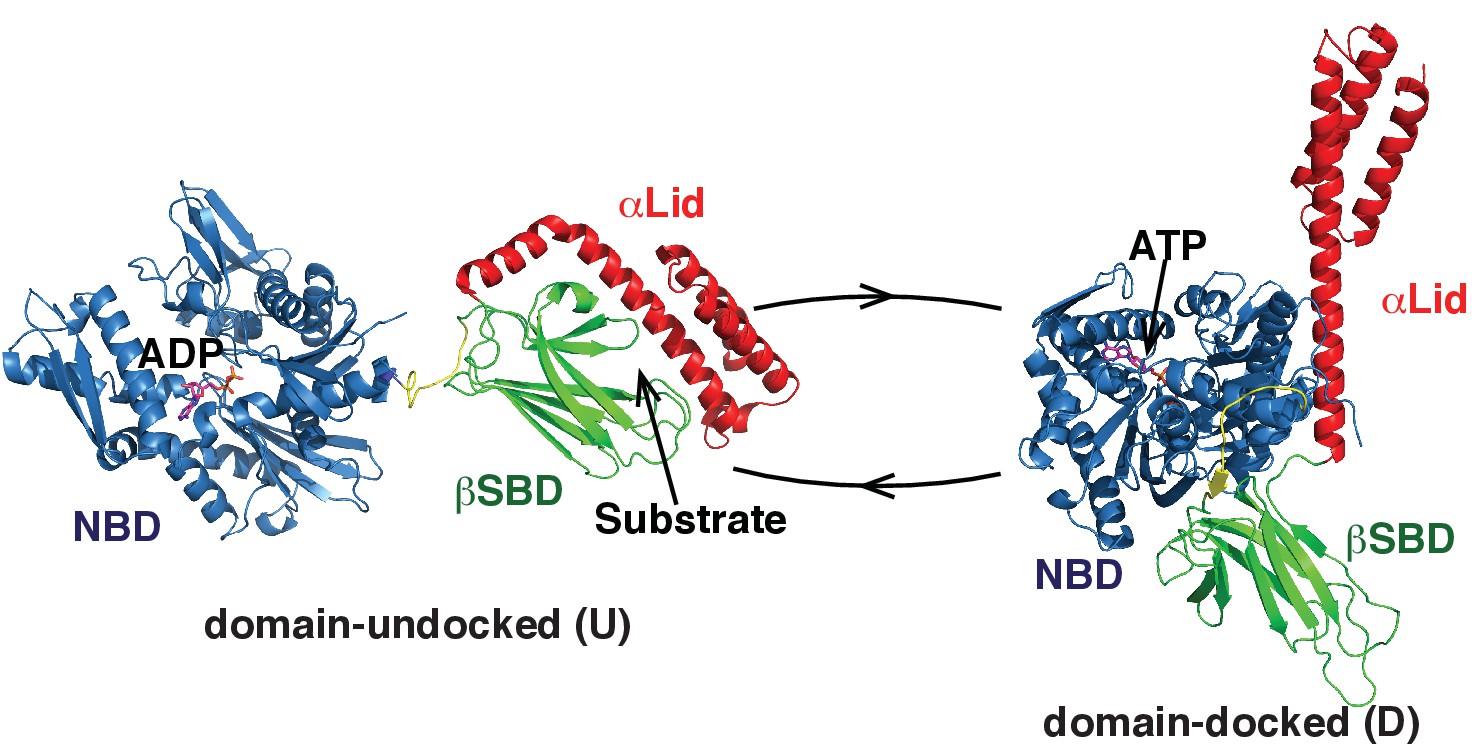
Two main functional conformations of BiP.
Ribbon representation of the structure of the ATP-bound BiP (PDB 5e84 [(Yang et al., 2015]), referred as the domain-docked conformation, and ADP-bound, which was modeled from the structures of the isolated NBD (PDB 5evz [Hughes et al., 2016]) and (D) SBD (PDB 5e85 [Yang et al., 2015]) and referred as the domain-undocked (U) conformation. The NBD (blue), βSBD (green), and αLid are highlighted by different colors and labeled.
Figure 1—figure supplement 1
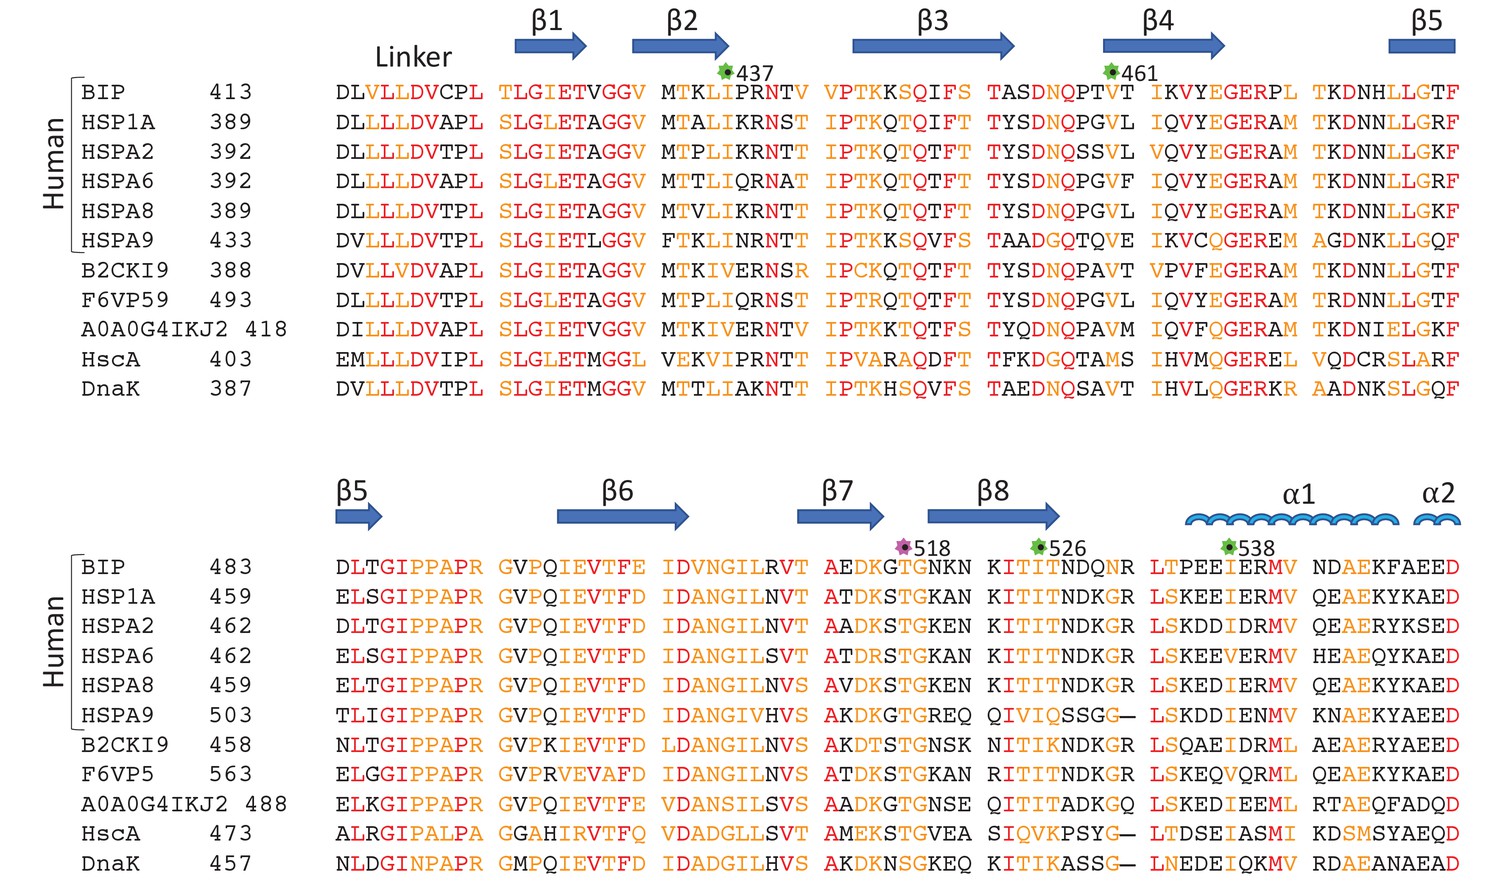
Sequence alignment of eukaryotic and bacterial Hsp70 proteins.
The aligned sequences of the βSBD, including human HSP70s: BiP (GRP78 or HSPA5), HSP70 (HSPA1A or HSP72), HSPA2, HSC70 (HSPA8 or HSP73), HSPA9 (GRP75, Mortalin-2 or MTHSP70), and HSPA6; Hsp70s from eukaryotes: Stratiomys singularior (UniProt: B2CKI9), Plasmodiophora brassicae (UniProt: A0A0G4IKJ2) and Monodelphis domestica (UniProt: F6VP59); and bacterial Hsp70s: HscA and DnaK from Escherichia coli. Secondary structure elements are indicated above the protein sequence. The highly conserved residues are coloured in red, less conserved in orange, non-conserved in black. The positions of ‘soft mutations’ used in this study are indicated by green asterisks; the AMPylation site (Thr 518) is highlighted by a magenta asterisk.
Figure 2 with 1 supplement
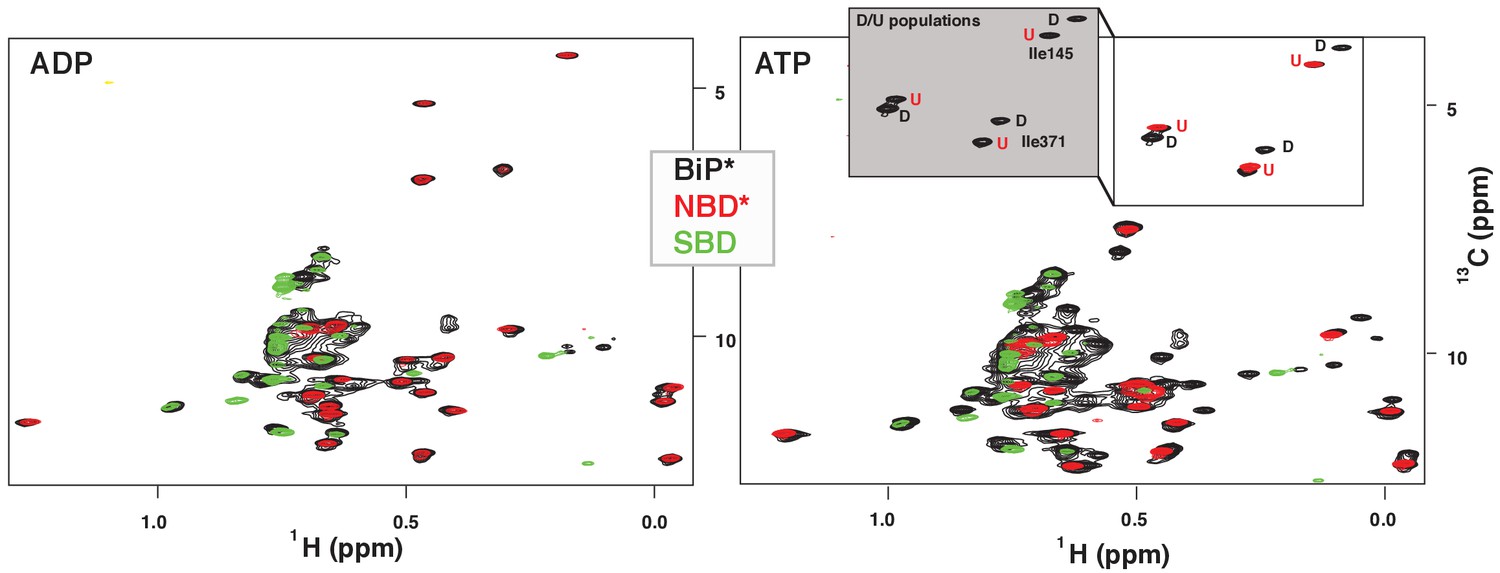
NMR fingerprints of two main functional conformations of BiP.
The isoleucine region of methyl-TROSY spectra of ADP-bound (left) and ATP-bound (right) BiP* (the full-length ATPase deficient T229G BiP construct, in black) overlaid with the spectra of corresponding nucleotide-bound state of isolated NBD* (the ATPase deficient NBD construct without the interdomain linker, residues 1–413, in red) and isolated SBD (in green). (Grey box, right) Blowup of the representative region of methyl-TROSY spectra of ATP-bound BiP*, showing three non-overlapping peak doublets, used to calculate the populations domain-docked (D) and -undocked (U) conformations. The U/D assignments details can be found in Materials and methods; briefly, FL BiP* peaks (black) that overlapping with peaks from the NBD*(1-413) spectrum (blue), were assigned to the domain-undocked conformation (labeled ‘U’; that is, for the corresponding conformation the isoleucine chemical environment is very similar in the FL protein and isolated NBD); the second peak from each doublet was assigned to the domain-docked conformation (labeled ‘D’, that is, for the corresponding conformation the isoleucine chemical environment in the FL protein is significantly different from the chemical environment in the isolated NBD).
Figure 2—figure supplement 1
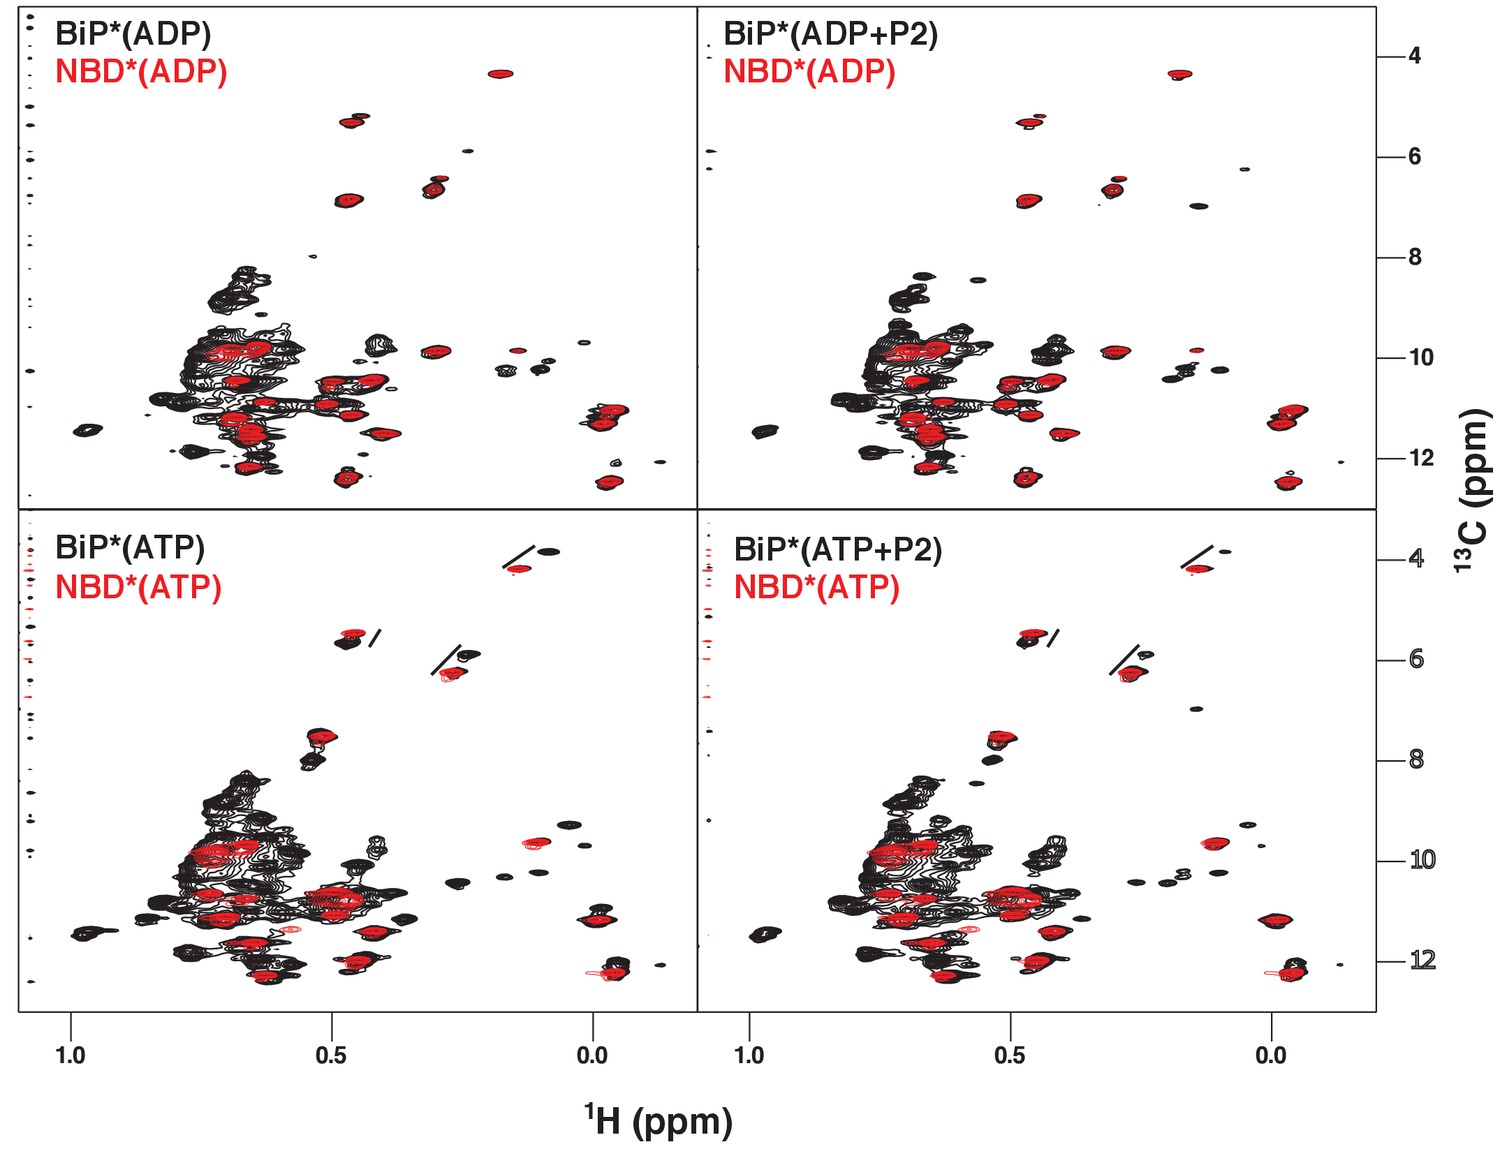
NMR fingerprints of the main steps of the BiP allosteric cycle.
The isoleucine region of methyl-TROSY spectra of BiP* (the full-length ATPase deficient T229G BiP construct, in black) overlaid with the spectra of corresponding nucleotide-bound state of NBD* (the ATPase deficient NBD construct without the interdomain linker, residues 1–413, in blue), including ADP-bound, ADP- and P2 (a model substrate peptide HTFPAVL [Marcinowski et al., 2011b])-bound, ATP-bound and ATP- and P2-bound.
Figure 3
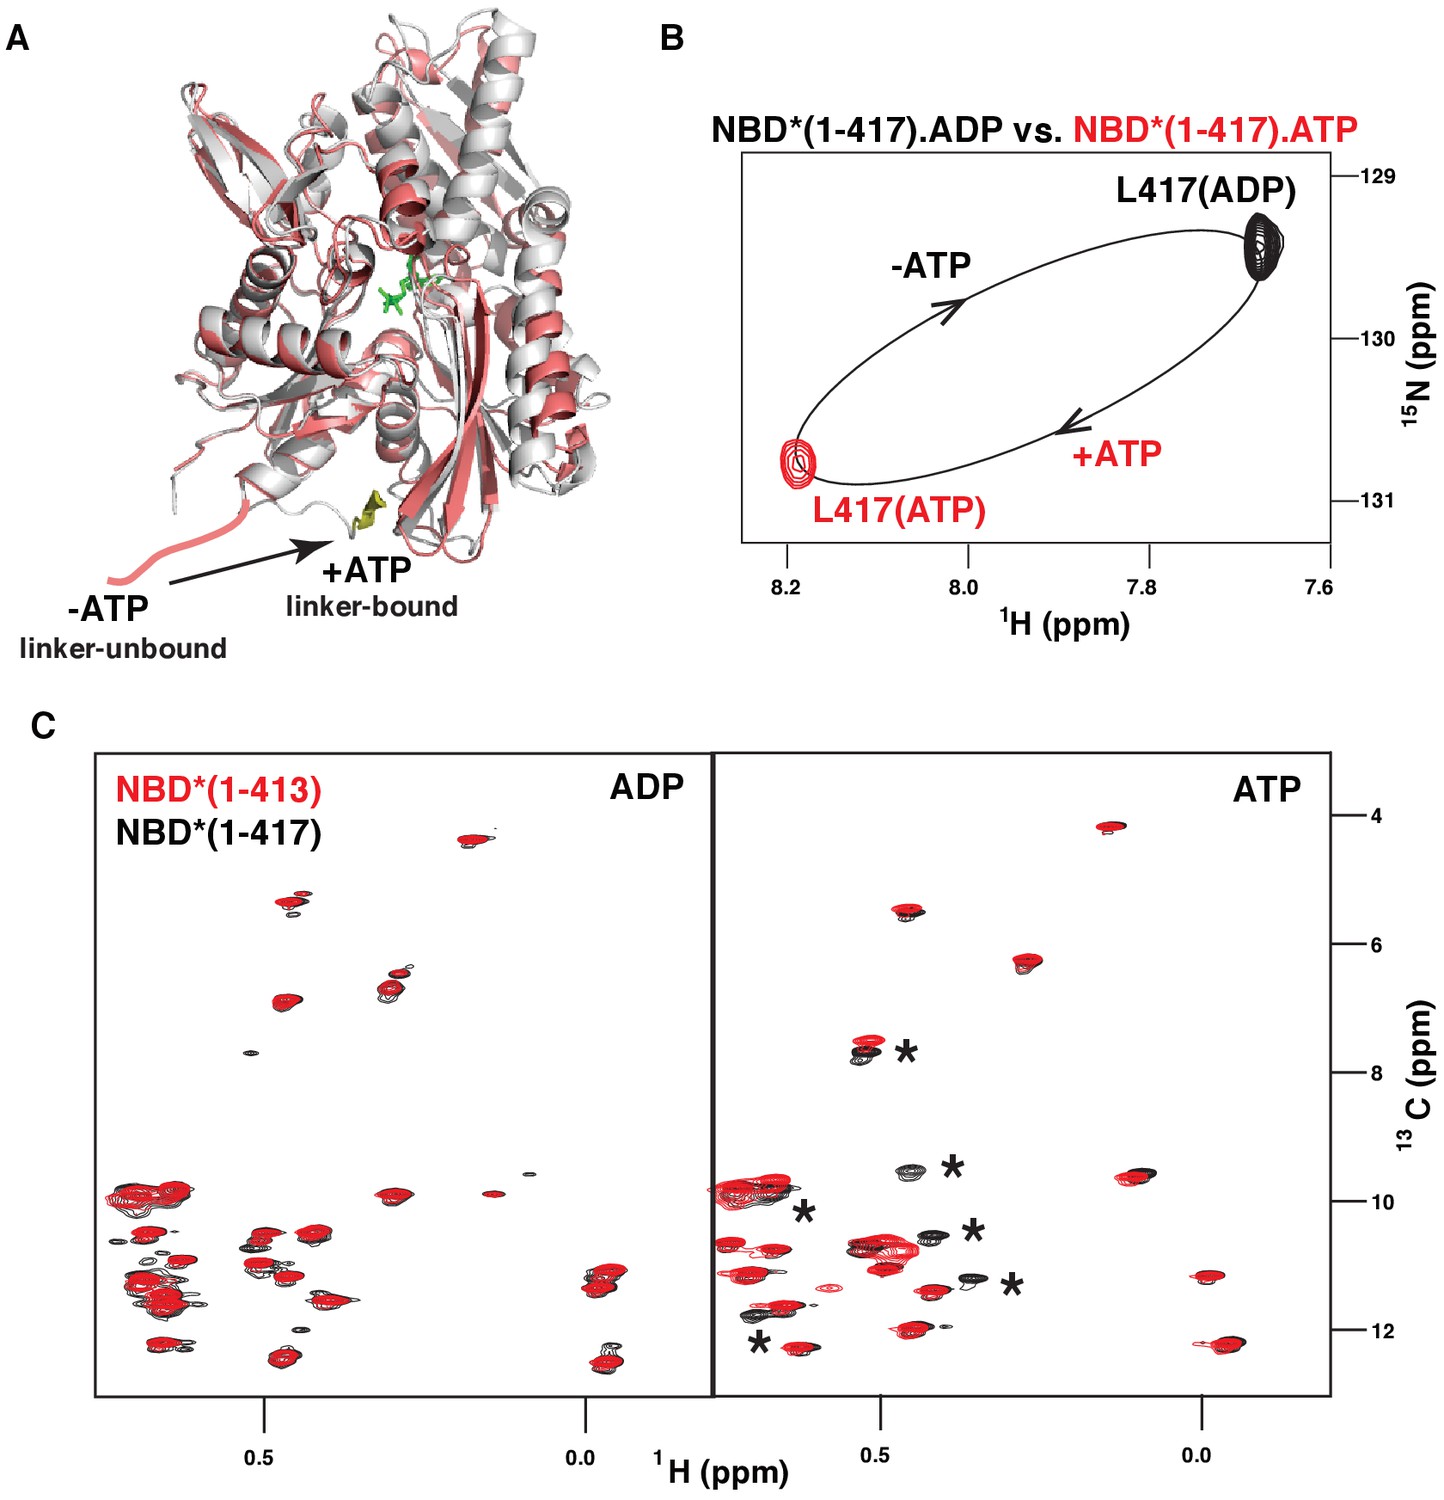
ATP-induced linker binding to the BiP NBD.
(A) Ribbon representation of the structures of two BiP NBD conformations: linker-bound and linker-unbound. The ATP-bound NBD structure (grey, linker bound; the linker is shown in yellow) is taken from the domain-docked structure of FL BiP (PDB 5e84 [Yang et al., 2015]); the ADP-bound structure (pink) is taken from the ADP-bound isolated BiP NBD (residues 1–407) PDB 5evz (Hughes et al., 2016); for ADP-bound conformation the linker region (after residue 407) is schematically shown in pink. (B) Blowup of the representative region of amide TROSY of the ADP-bound (black) and ATP-bound (red) NBD*(1-417) showing the peak corresponding the C-terminal linker residue Leu417. (C) The isoleucine region of the methyl-TROSY spectra of the ADP- and ATP-bound BiP NBD*(1-417) (in black) overlaid with the spectra of the corresponding nucleotide-bound state of BiP NBD*(1-413) (in red). Asterisks highlight changes observed in the presence of the linker.
Figure 4 with 5 supplements
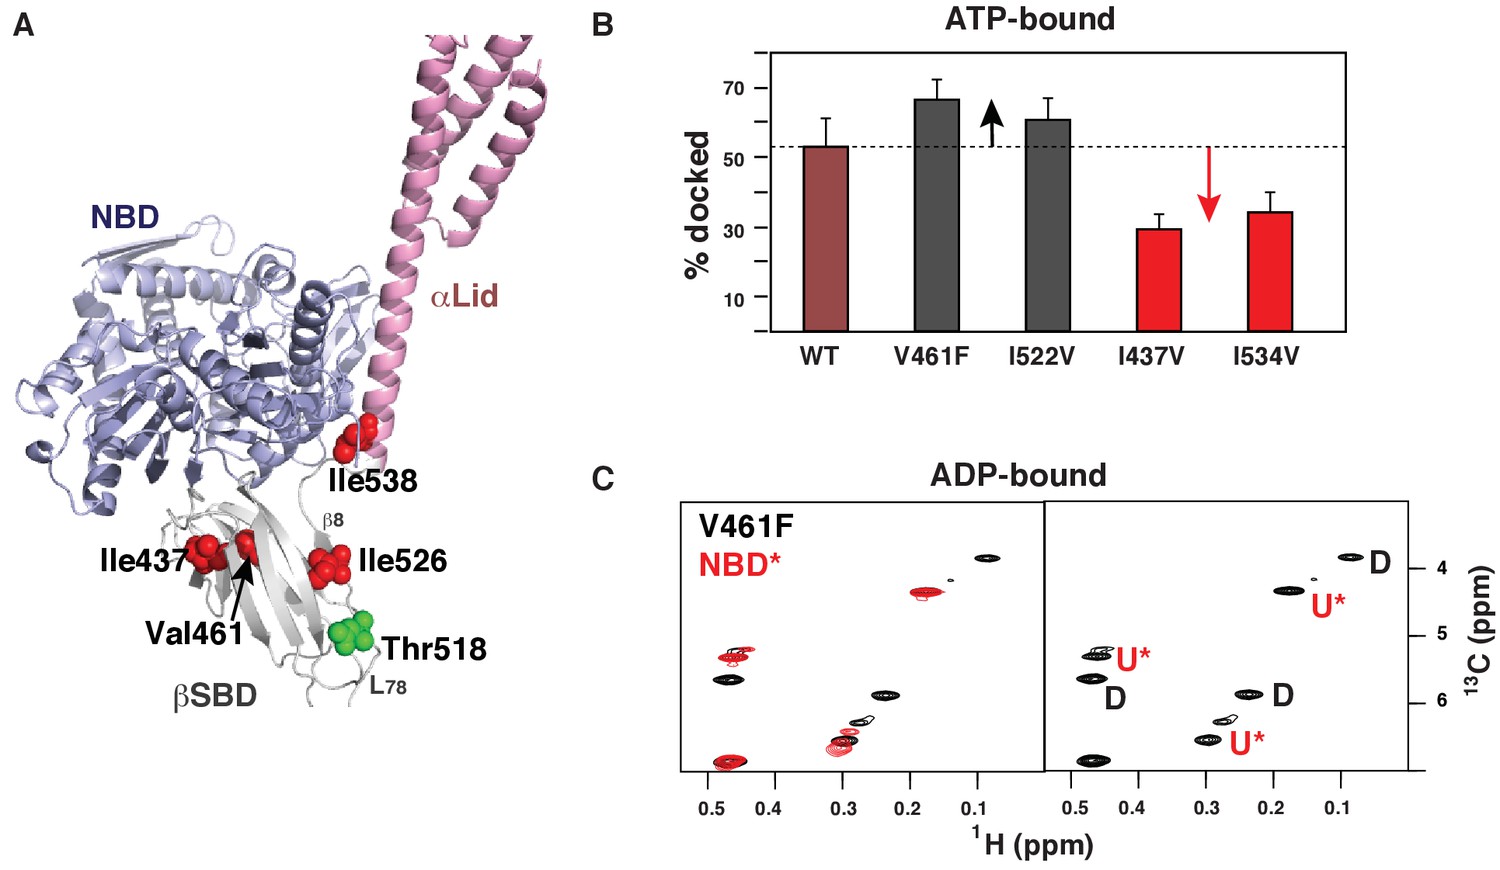
Allosteric regulation of the BiP conformational ensemble.
(A) Ribbon representation of the domain-docked conformations (PDB 5e84 [Yang et al., 2015]). Four ‘soft’ mutations are shown as red spheres. The AMPylation site (Thr 518) is shown in green. (B) Populations of the domain-docked conformation calculated from methyl-TROSY spectra of ATP-bound BiP* ‘soft’ mutants, V461F, I526V, I437V and I538V, using methyl peak intensities of the domain-docked and -undocked conformations. Error bars show SDs from the means for three peak doublets (Materials and methods, Figure 4—figure supplements 1–5 and Figure 4—source data 1). (C) Blowup of the representative region of the methyl-TROSY spectrum of ADP-bound BiP*-V461F (black) overlaid (left) with the spectrum of ADP-bound NBD*(1-413) (red). (Right) For each FL BiP* doublet, the peak overlapping with the ADP-bound NBD* peak is labeled as U* (ADP-bound, domain-undocked) and the second peak is labeled as D (ADP-bound, domain-docked).
-
Figure 4—source data 1
NMR analysis of populations for the domain-docked and -undocked conformations.
The percentage of the population of the domain-docked conformation was calculated from methyl peak intensities of three non-overlapping peak doublets (P1, P2 and P3), each containing peaks for the domain-docked (D) and -undocked (U) conformations, using the following equation: , where ID and IU are the intensities of peaks corresponding to the domain-docked and -undocked conformations, respectively. Errors were set as standard deviations (SDs) from the means for three doublets or uncertainties from the errors in peak intensities, whatever is larger. BiPT229G (ATP-bound): pD = 53 ± 6.6%.
- https://doi.org/10.7554/eLife.29430.014
Figure 4—figure supplement 1
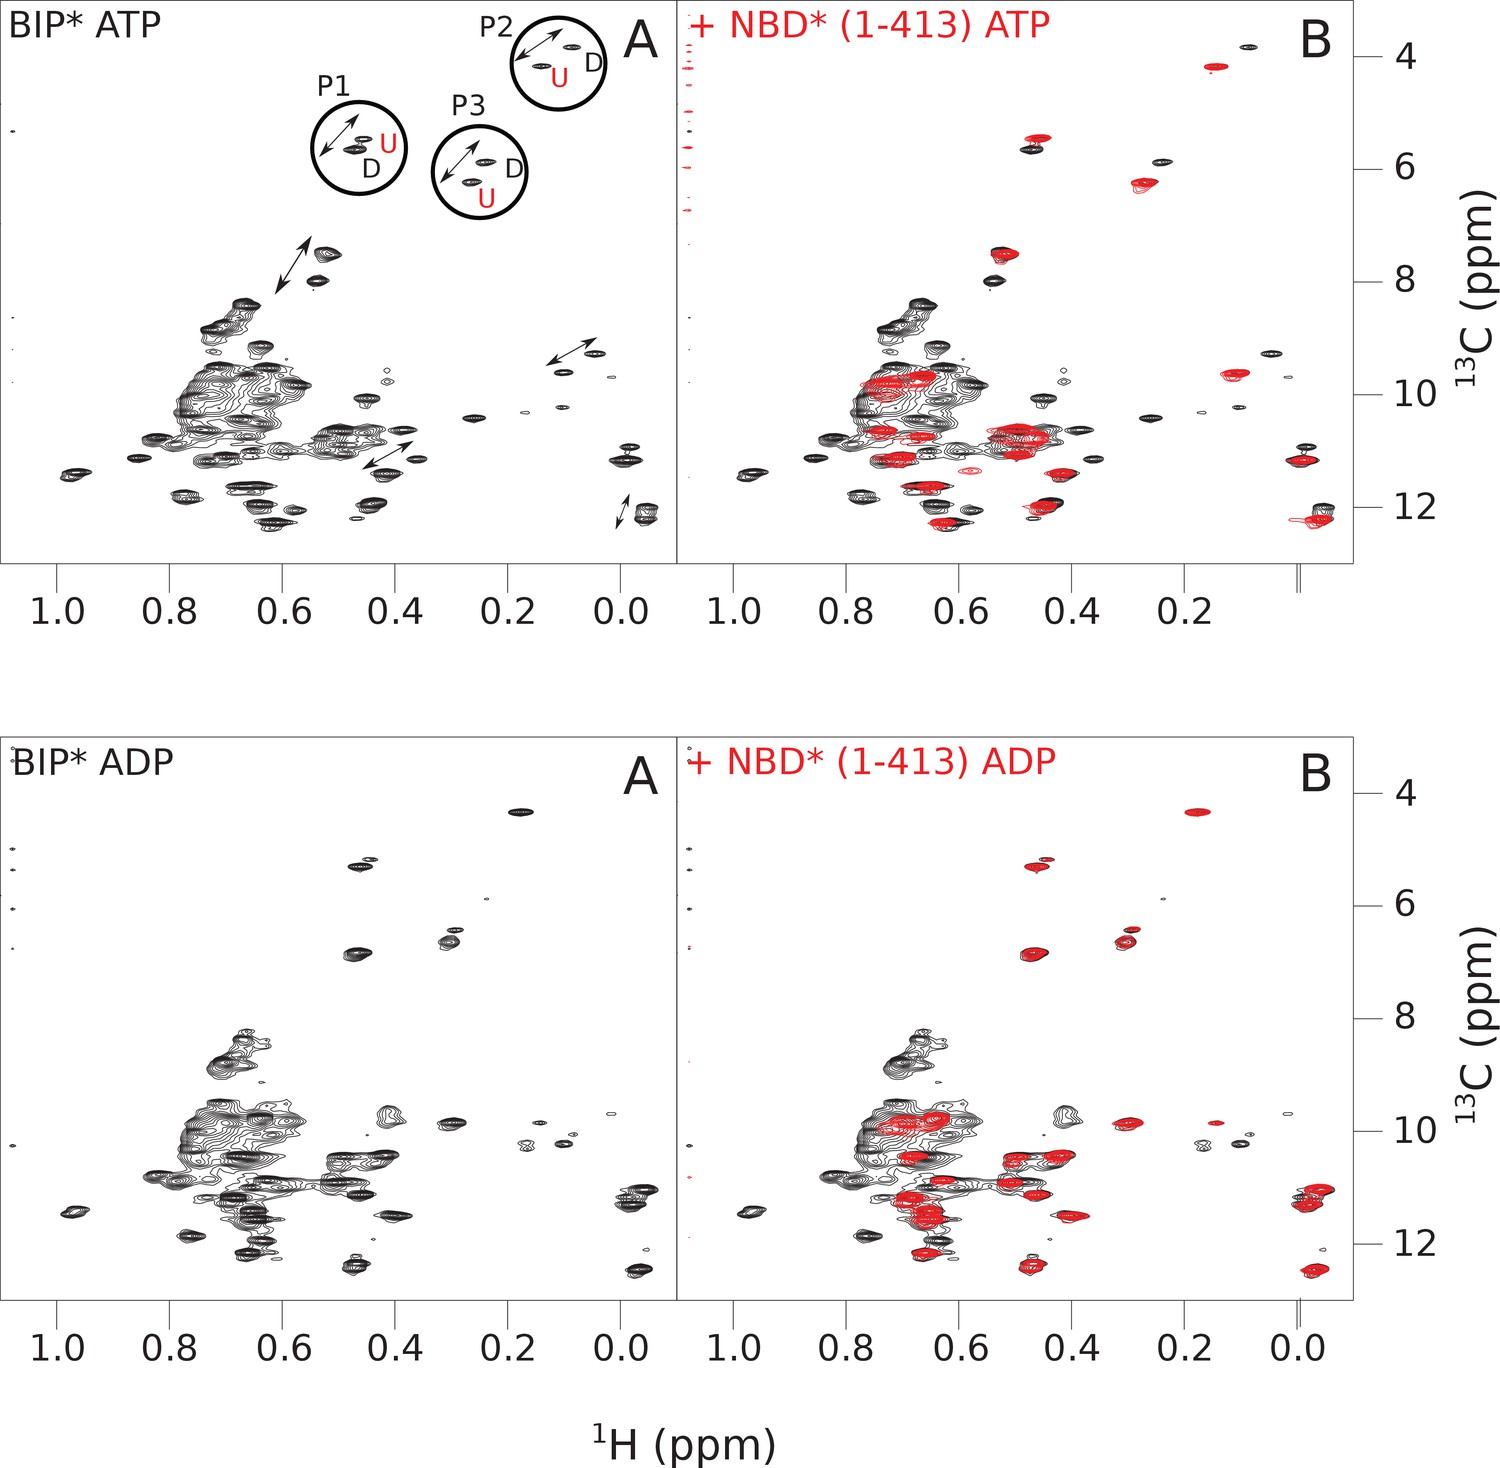
The isoleucine regions of methyl-TROSY spectra of ATP- and ADP-bound full-length (FL) BiP* (A, in black), overlaid with the spectra of a corresponding nucleotide-bound state of NBD*(1-413) (B, in red).
Peaks in the spectra of FL BiP* were assigned to the domain-undocked (U) conformation when they were overlapped with peaks in the spectrum of the isolated NBD*(1-413) in the corresponding nucleotide state (ADP or ATP-bound). When two sets of peaks were observed in the NMR methyl spectra of ATP-bound FL BiP*, the second peak with distinct chemical shifts from those observed for the isolated NBD*(1-413), was assigned to the domain-docked conformation (D). The three representative peak doublets used to calculate the population of the domain-docked conformation (Figure 4—source data 1) were labeled as P1 (an unassigned NBD Ile peak), P2 (Ile145) and P3 (Ile371).
Figure 4—figure supplement 2
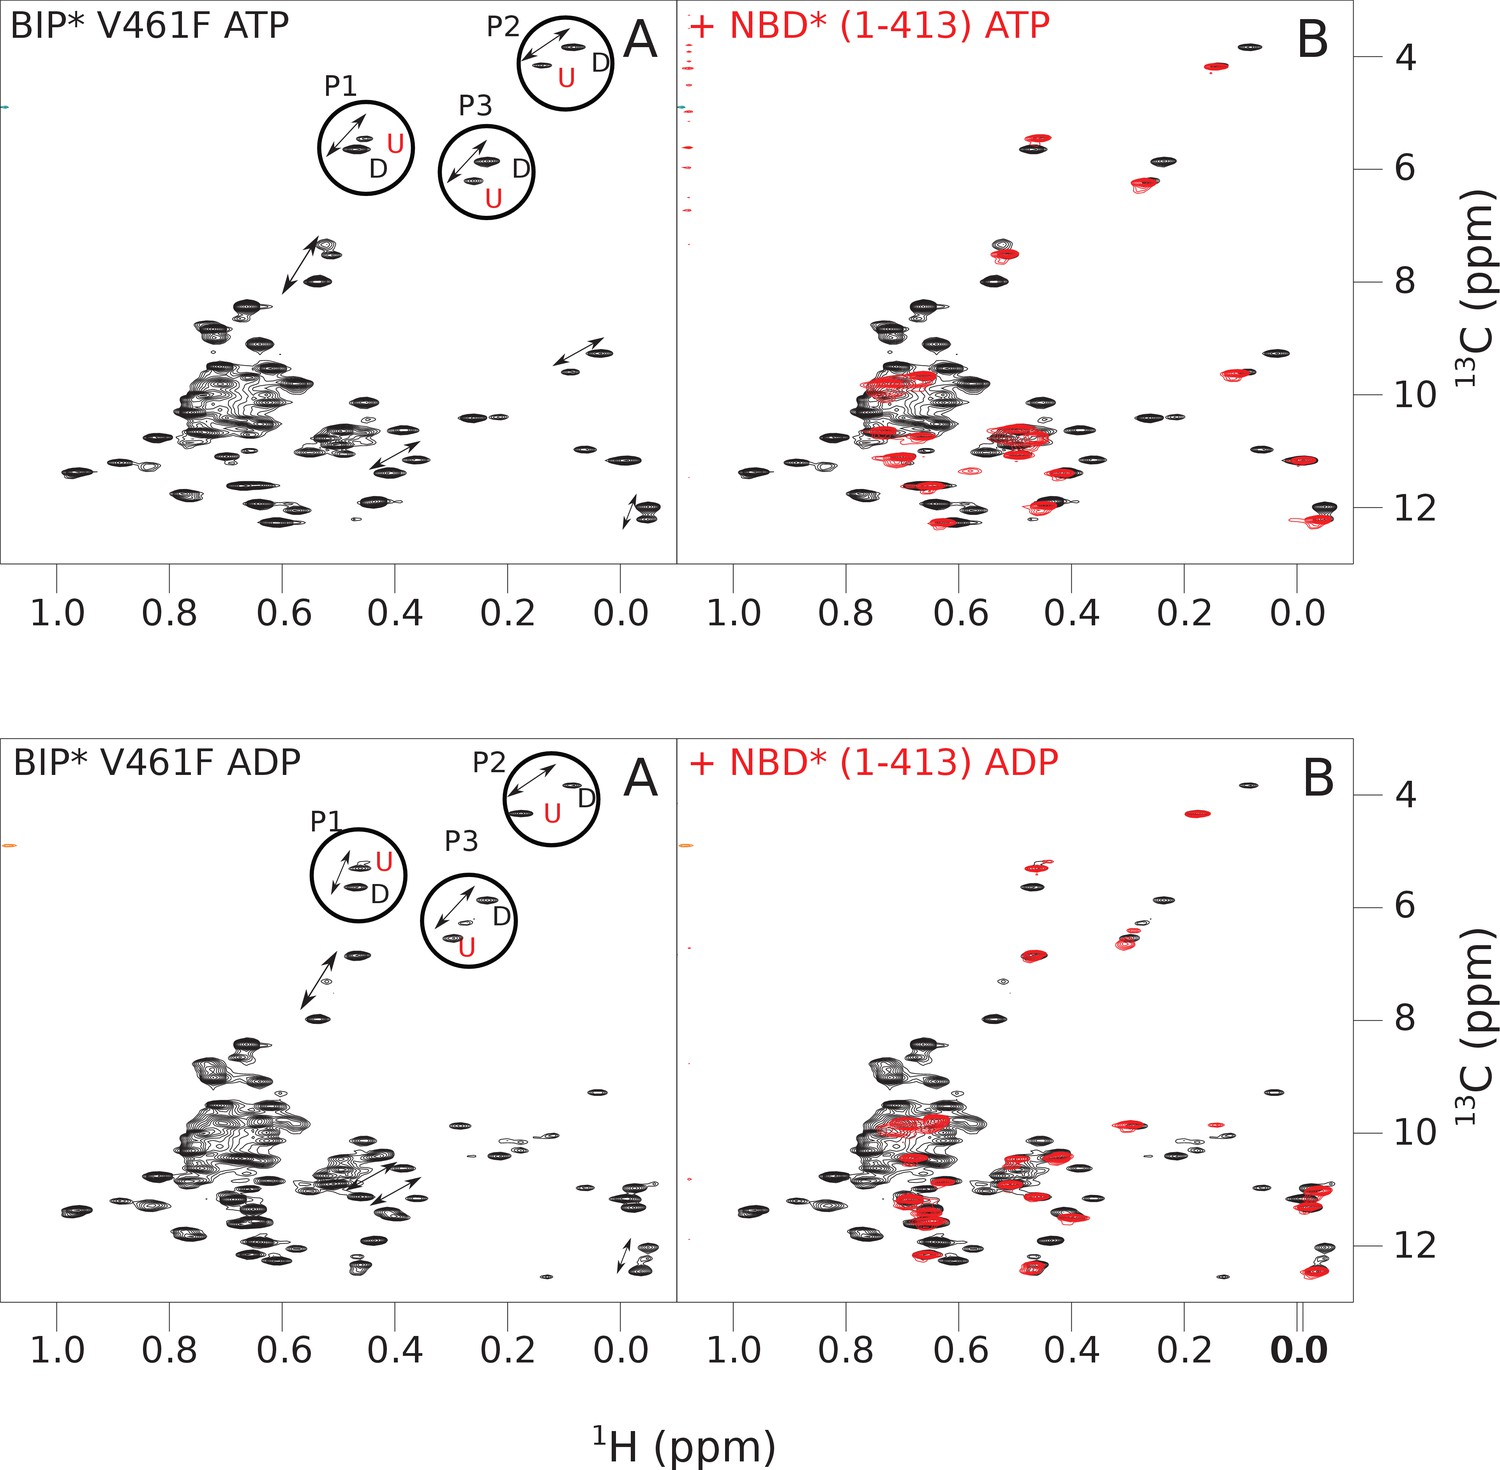
The isoleucine regions of methyl-TROSY spectra of ATP- and ADP-bound states of the V461F variant of full-length (FL) BiP* (A, in black), overlaid with the spectra of a corresponding nucleotide-bound state of NBD*(1-413) (B, in red).
Peaks in the spectra of the FL protein were assigned to the domain-undocked (U) conformation when they were overlapped with peaks in the spectrum of the isolated NBD*(1-413) in the corresponding nucleotide state (ADP or ATP-bound). When two sets of peaks were observed in the NMR methyl spectra of the FL protein, the second peak with distinct chemical shifts from those observed for the isolated NBD*(1-413), was assigned to the domain-docked conformation (D). The three representative peak doublets used to calculate the population of the domain-docked conformation (Figure 4—source data 1) were labeled as P1 (an unassigned NBD Ile peak), P2 (Ile145) and P3 (Ile371).
Figure 4—figure supplement 3
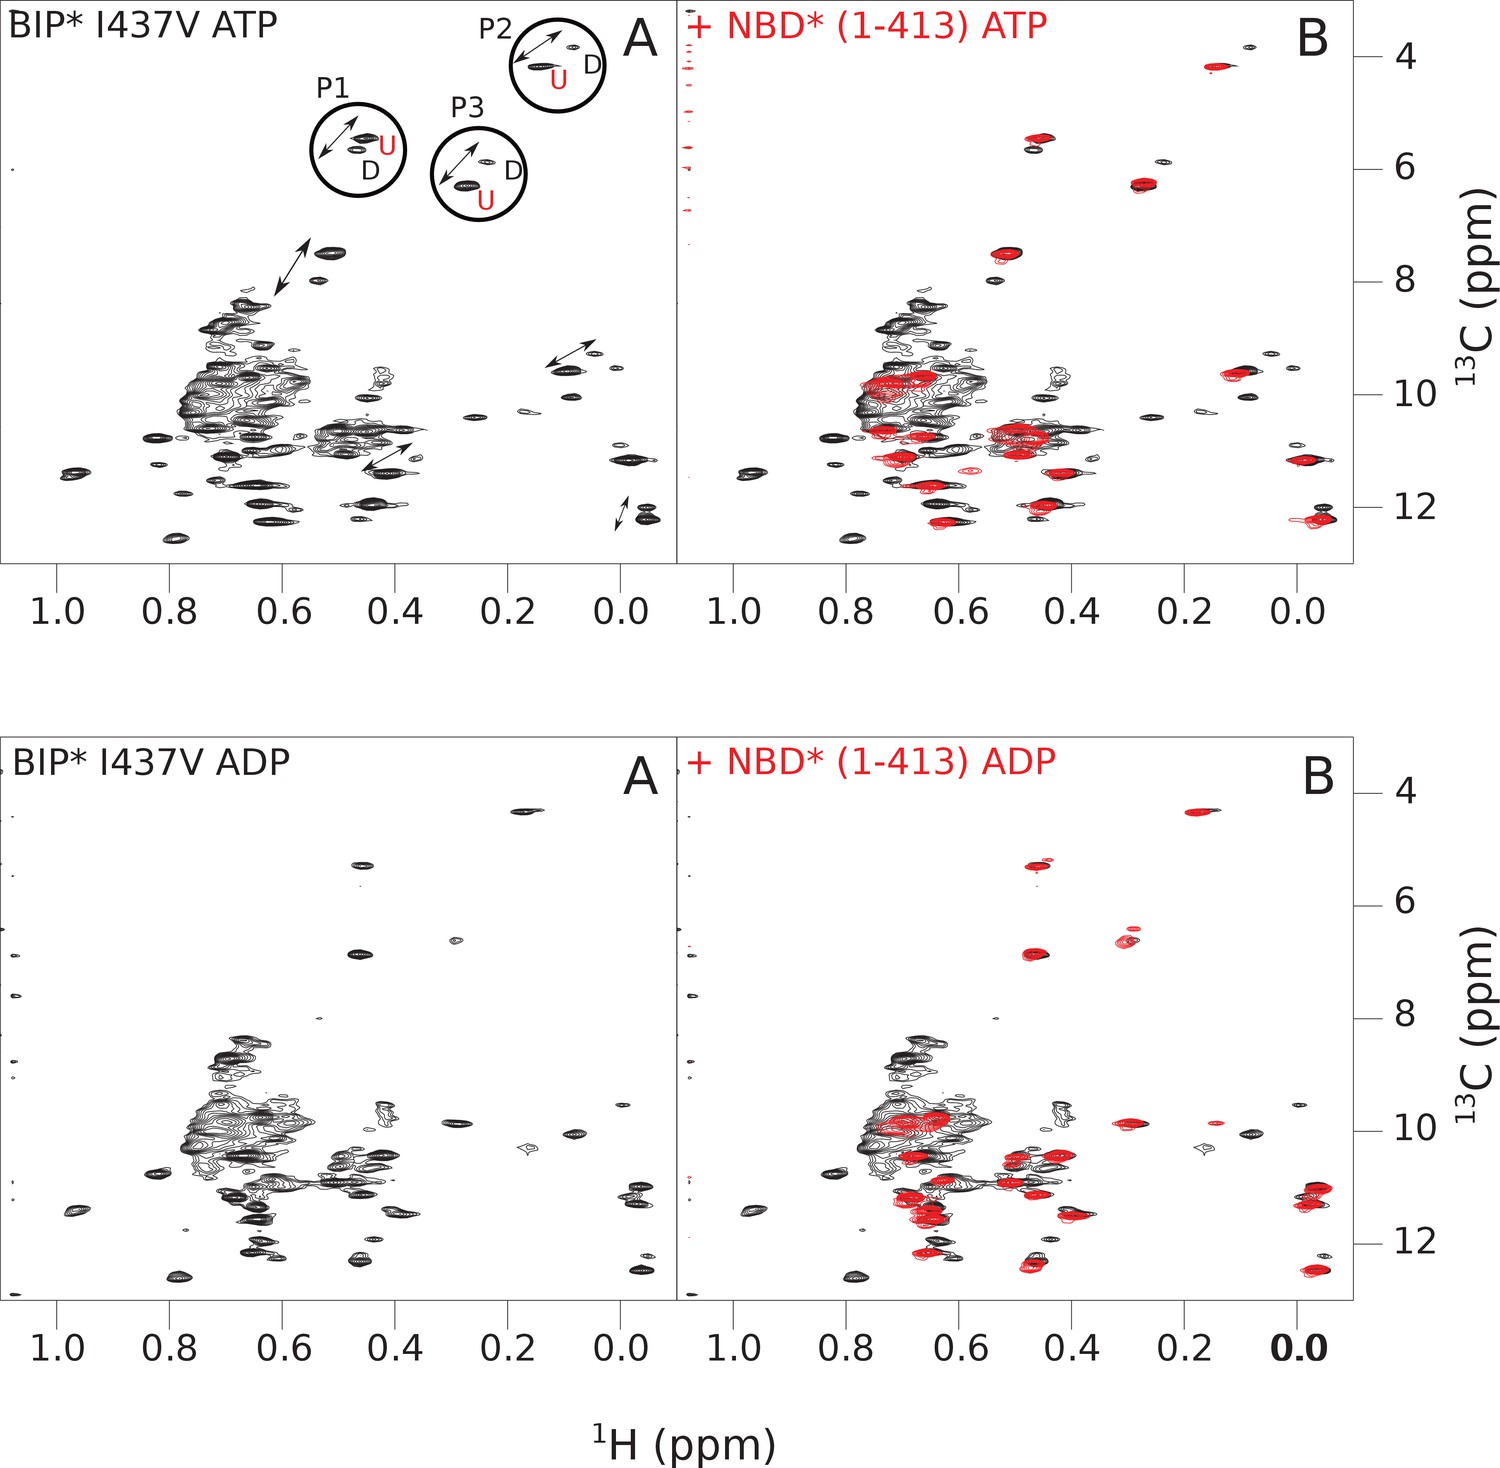
The isoleucine regions of methyl-TROSY spectra of ATP- and ADP-bound states of the I437V variant of full-length (FL) BiP* (A, in black), overlaid with the spectra of a corresponding nucleotide-bound state of NBD*(1-413) (B, in red).
Peaks in the spectra of the FL protein were assigned to the domain-undocked (U) conformation when they were overlapped with peaks in the spectrum of the isolated NBD*(1-413) in the corresponding nucleotide state (ADP or ATP-bound). When two sets of peaks were observed in the NMR methyl spectra of the FL protein, the second peak with distinct chemical shifts from those observed for the isolated NBD*(1-413), was assigned to the domain-docked conformation (D). The three representative peak doublets used to calculate the population of the domain-docked conformation (Figure 4—source data 1) were labeled as P1 (an unassigned NBD Ile peak), P2 (Ile145) and P3 (Ile371).
Figure 4—figure supplement 4
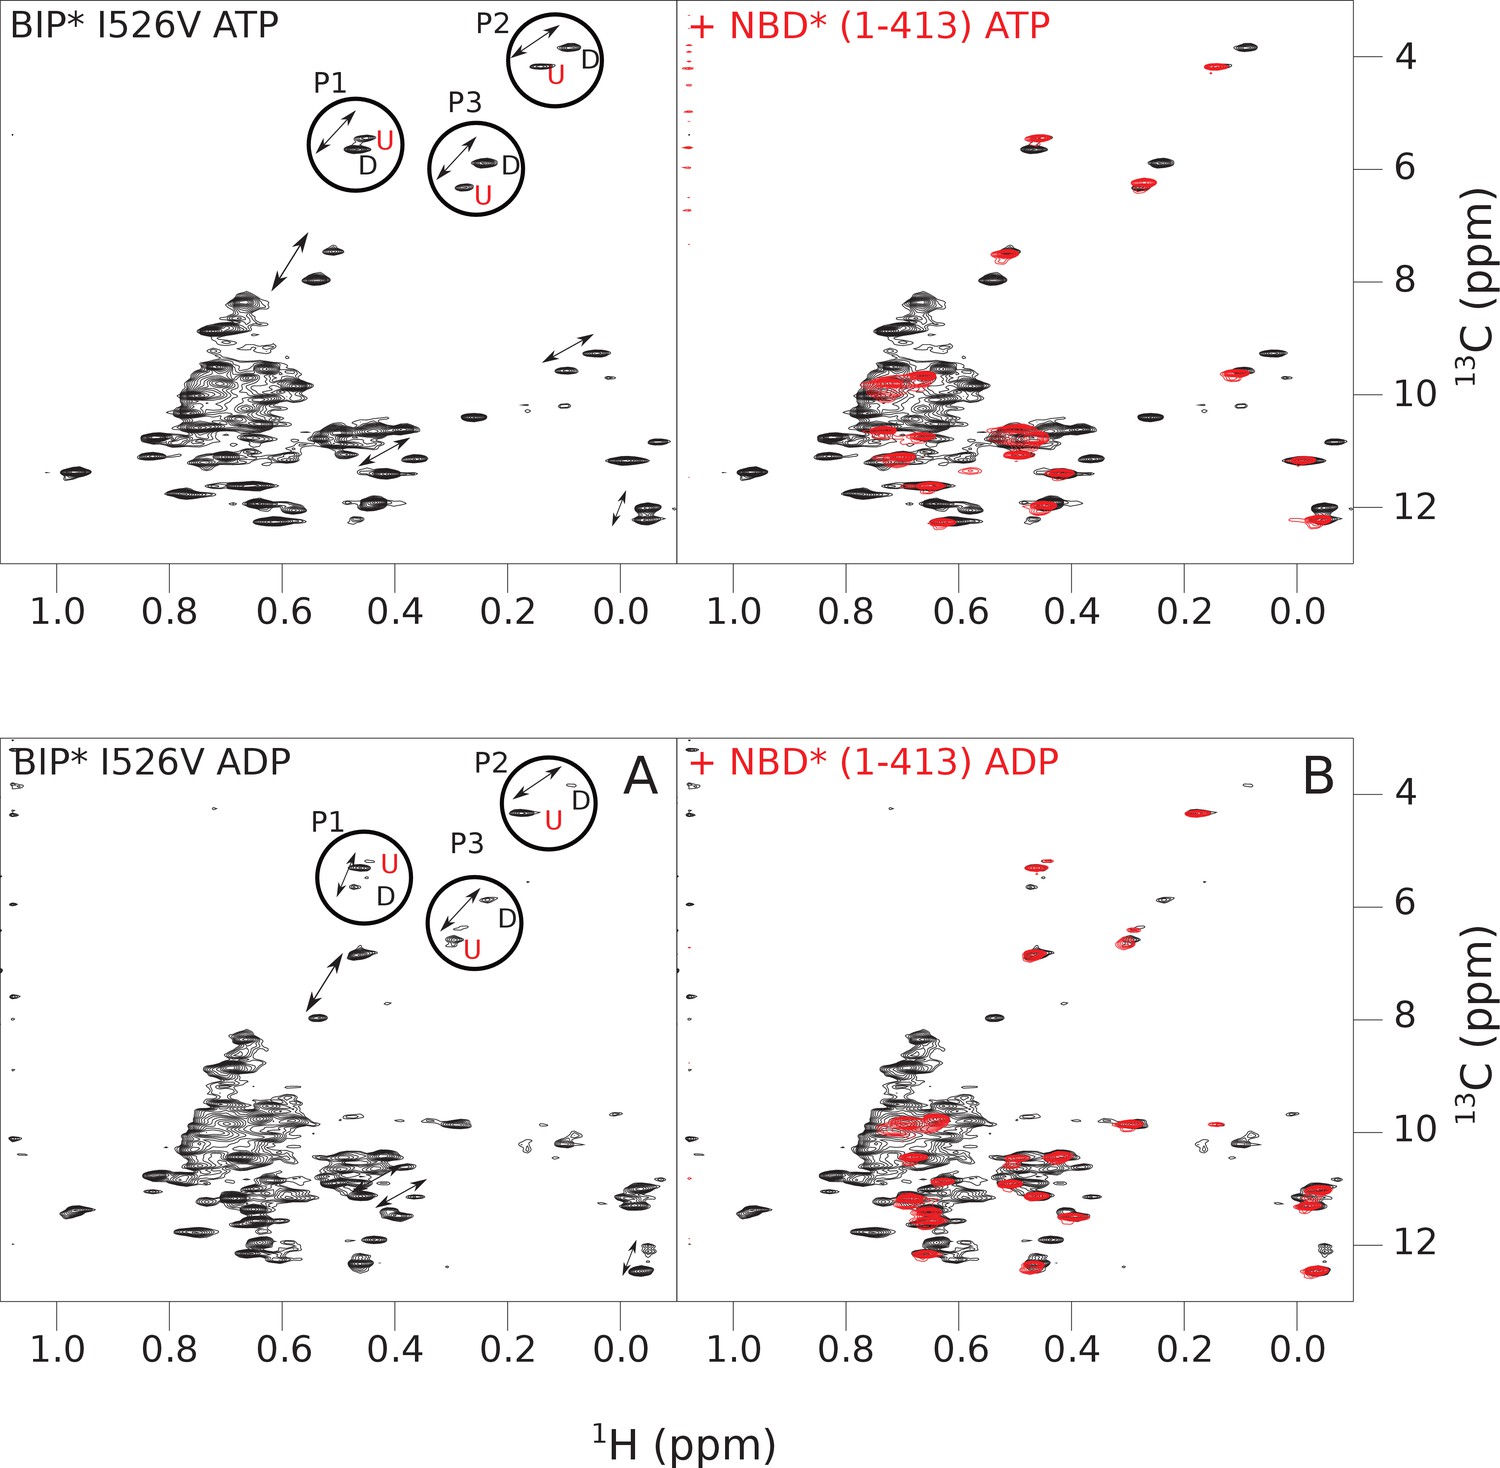
The isoleucine regions of methyl-TROSY spectra of ATP- and ADP-bound states of the I526V variant of full-length (FL) BiP* (A, in black), overlaid with the spectra of a corresponding nucleotide-bound state of NBD*(1-413) (B, in red).
Peaks in the spectra of the FL protein were assigned to the domain-undocked (U) conformation when they were overlapped with peaks in the spectrum of the isolated NBD*(1-413) in the corresponding nucleotide state (ADP or ATP-bound). When two sets of peaks were observed in the NMR methyl spectra of the FL protein, the second peak with distinct chemical shifts from those observed for the isolated NBD*(1-413), was assigned to the domain-docked conformation (D). The three representative peak doublets used to calculate the population of the domain-docked conformation (Figure 4—source data 1) were labeled as P1 (an unassigned NBD Ile peak), P2 (Ile145) and P3 (Ile371).
Figure 4—figure supplement 5
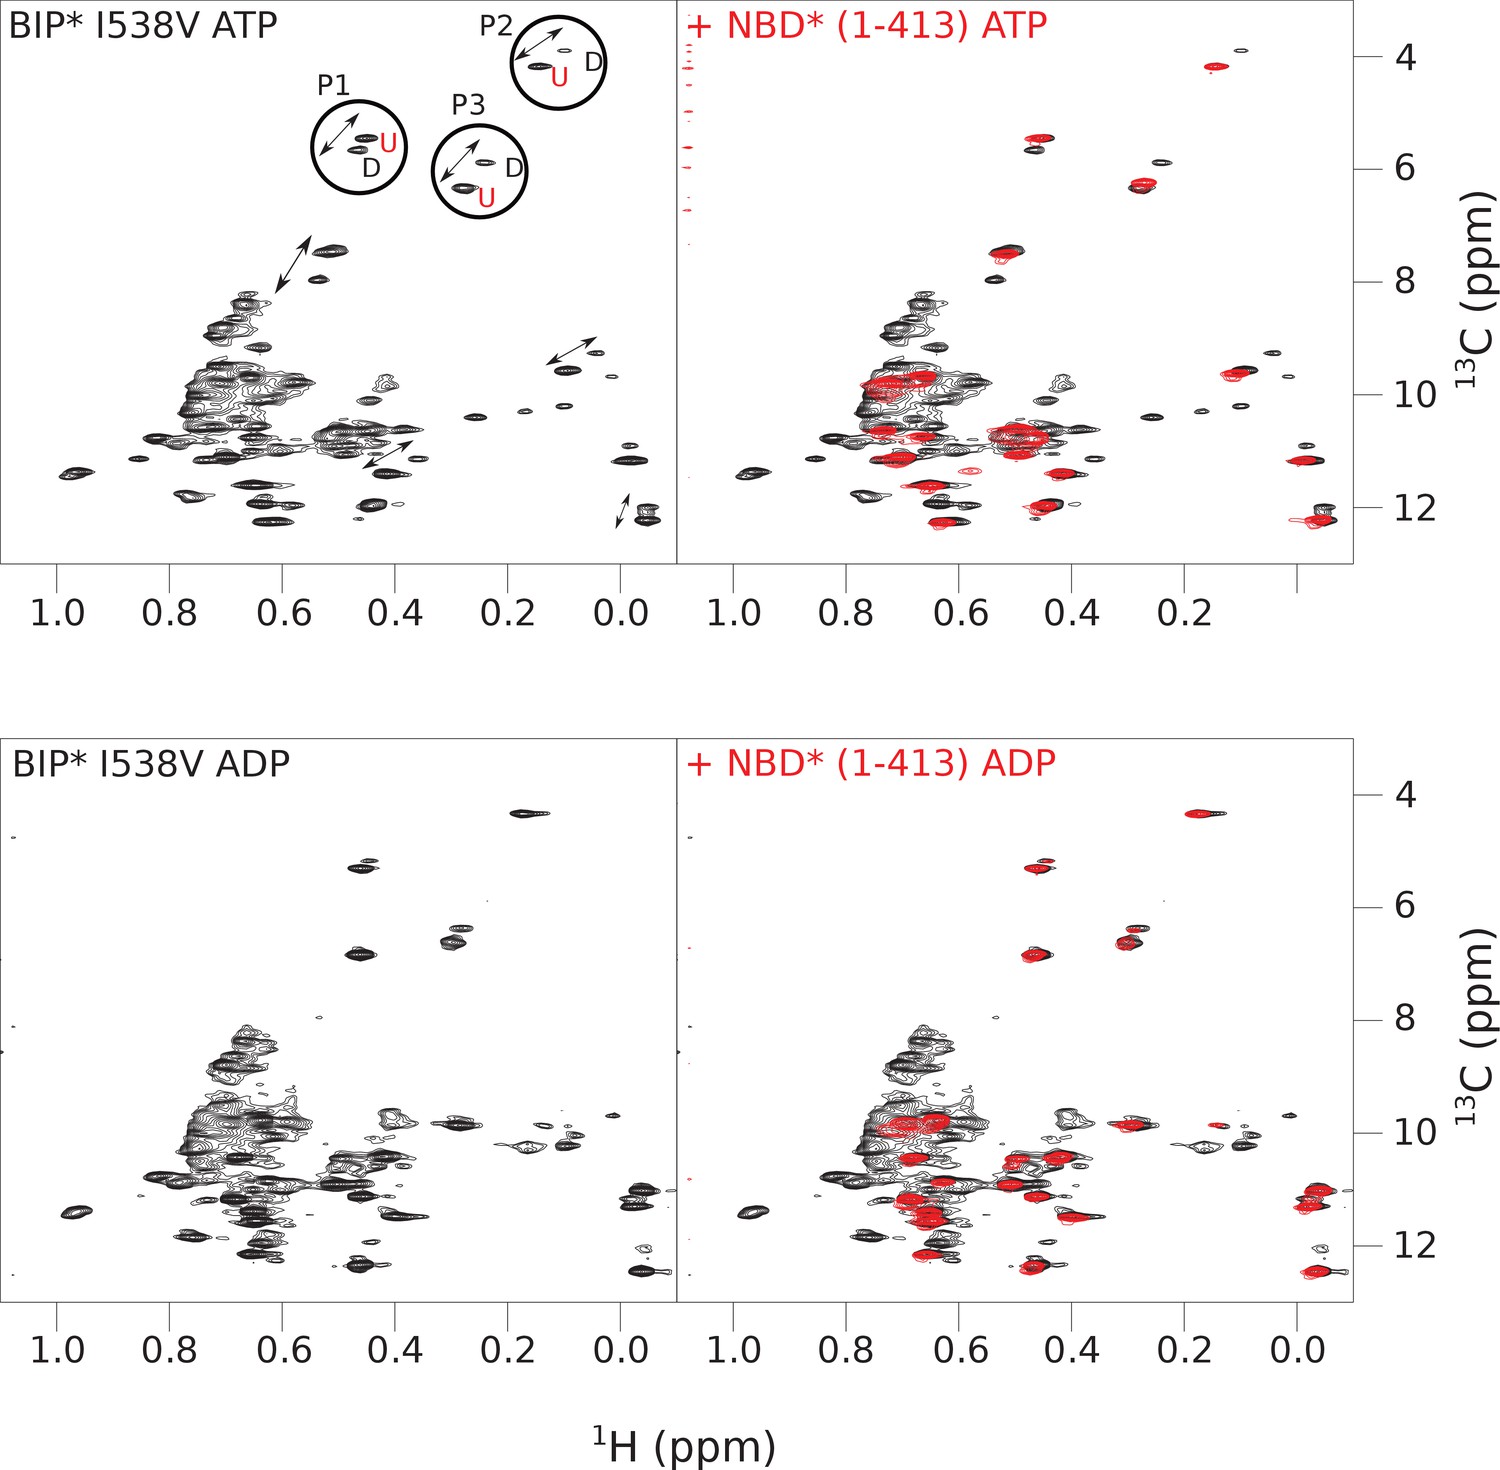
The isoleucine regions of methyl-TROSY spectra of ATP- and ADP-bound states of the I538V variant of full-length (FL) BiP* (A, in black), overlaid with the spectra of a corresponding nucleotide-bound state of NBD*(1-413) (B, in red).
Peaks in the spectra of the FL protein were assigned to the domain-undocked (U) conformation when they were overlapped with peaks in the spectrum of the isolated NBD*(1-413) in the corresponding nucleotide state (ADP or ATP-bound). When two sets of peaks were observed in the NMR methyl spectra of the FL protein, the second peak with distinct chemical shifts from those observed for the isolated NBD*(1-413), was assigned to the domain-docked conformation (D). The three representative peak doublets used to calculate the population of the domain-docked conformation (Figure 4—source data 1) were labeled as P1 (an unassigned NBD Ile peak), P2 (Ile145) and P3 (Ile371).
Figure 5 with 7 supplements
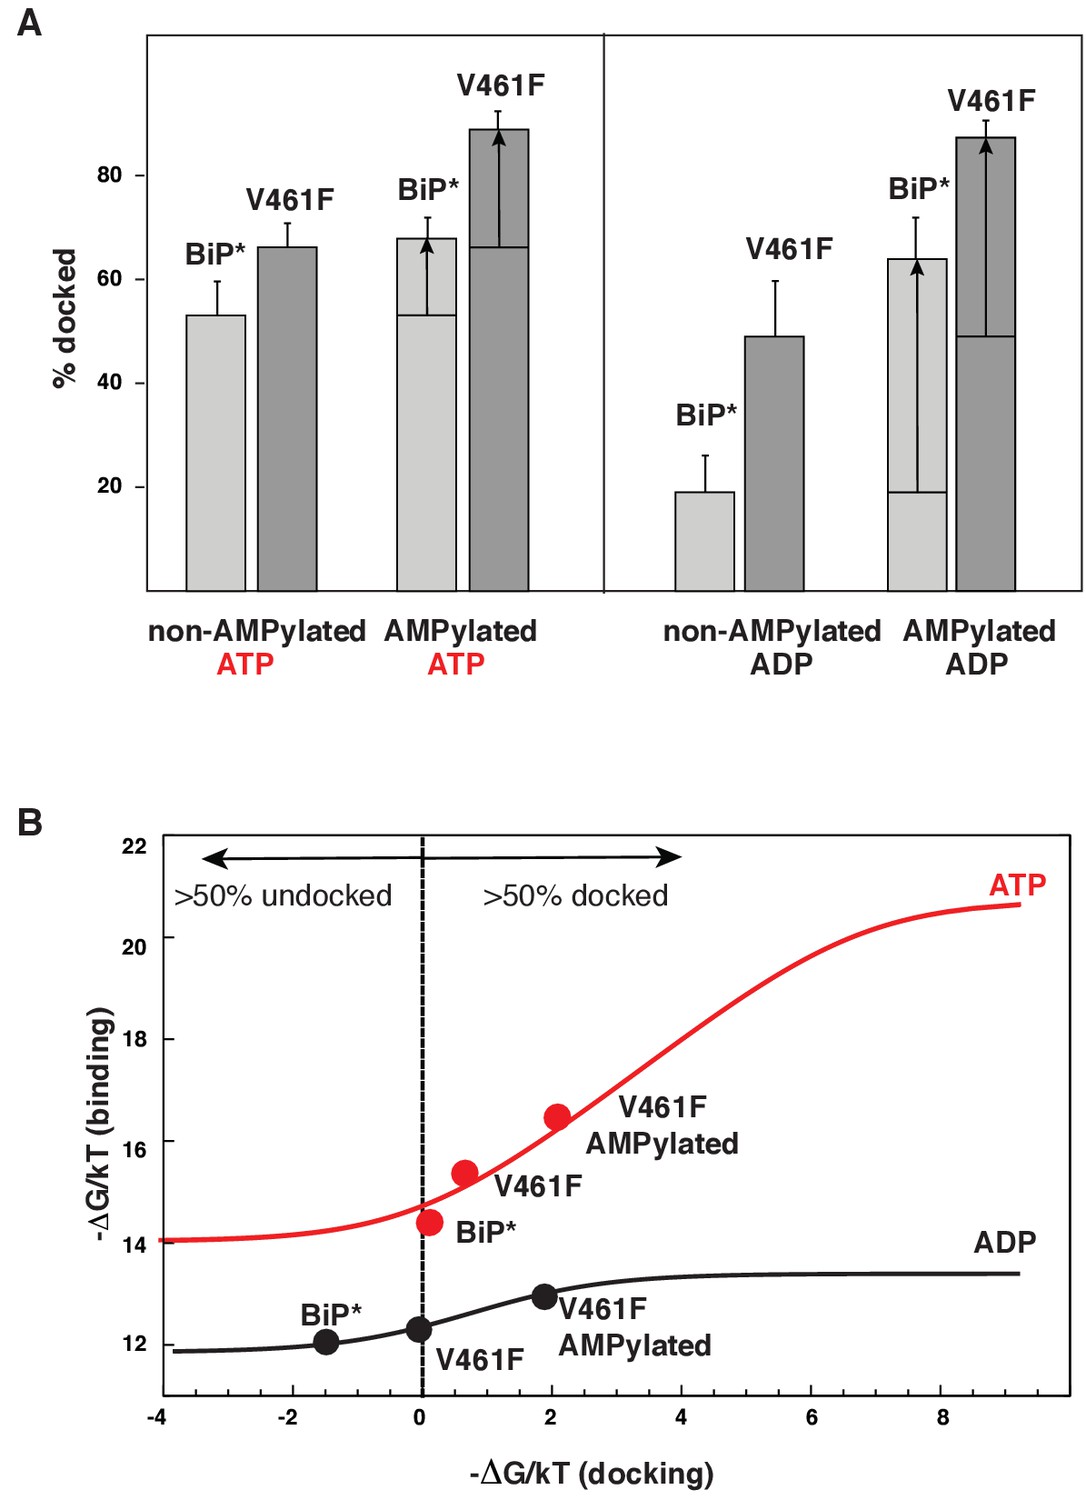
Allosteric regulation of the BiP by AMPylation.
(A) Populations of the domain-docked conformation for AMPylated and non-AMPylated BiP* and its V461F variant in the presence of ATP and ADP, calculated using methyl peak intensities of the domain-docked and -undocked conformations. Error bars show SDs from the means for three peak doublets (Materials and methods, Figure 5—figure supplements 1–2 and Figure 5—source data 1). (B) The thermodynamic linkage between domain docking and nucleotide binding: Plot of the experimental free energy of ATP (red dots) and ADP (black dots) binding against the experimental free energy of domain docking for BiP* and its non-AMPylated and AMPylated V461F variant. For each construct, the free energy of nucleotide binding was obtained from the ITC data and the free energy of domain docking was calculated from NMR peak intensities (see Figure 5—source data 2 and Materials and methods for details). The red (for ATP) and black (for ADP) curves show the theoretical plots of the free energy of ATP (red) and ADP (black) binding against the free energy of domain docking under assumption that BiP co-exists as an ensemble of the domain-undocked and -docked conformations (see Materials and methods).
-
Figure 5—source data 1
NMR analysis of populations for the domain-docked and -undocked conformations for AMPylated BiP.
The percentage of populations of the domain-docked conformation were calculated from methyl peak intensities of three non-overlapping peak doublets (P1, P2 and P3), each containing peaks for the domain-docked (D) and -undocked (U) conformations, using the following equation: , where ID and IU are the intensities of peaks corresponding to the domain-docked and -undocked conformations, respectively. Errors were set as standard deviations (SDs) from the means for three doublets or uncertainties from the errors in peak intensities, whatever is larger.
- https://doi.org/10.7554/eLife.29430.023
-
Figure 5—source data 2
Analysis of the thermodynamic linkage between domain docking and nucleotide binding.
(Top) Thermodynamic parameters of ATP and ADP binding obtained from ITC experiments for FL BiP* and its non-AMPylated and AMPylated V461F variant; the measurements were repeated three times and the standard deviations for all parameters were less than 10%. (Bottom) Ratio of populations of the domain-docked (pD) and undocked (pU) conformations obtained from the analysis of NMR peak intensities (Figure 4—source data 1 and Figure 5—source data 1). (Grey) The experimental free energy of nucleotide binding and domain docking plotted in Figure 5B. The free energy of binding was calculated as , where Kd is ADP or ATP binding constant obtained by ITC, R is the ideal gas constant, and T is the temperature in K; the free energy of domain docking was calculated from populations of the domain-undocked and -docked conformations obtained from the NMR analysis using the following equation: .
- https://doi.org/10.7554/eLife.29430.024
Figure 5—figure supplement 1
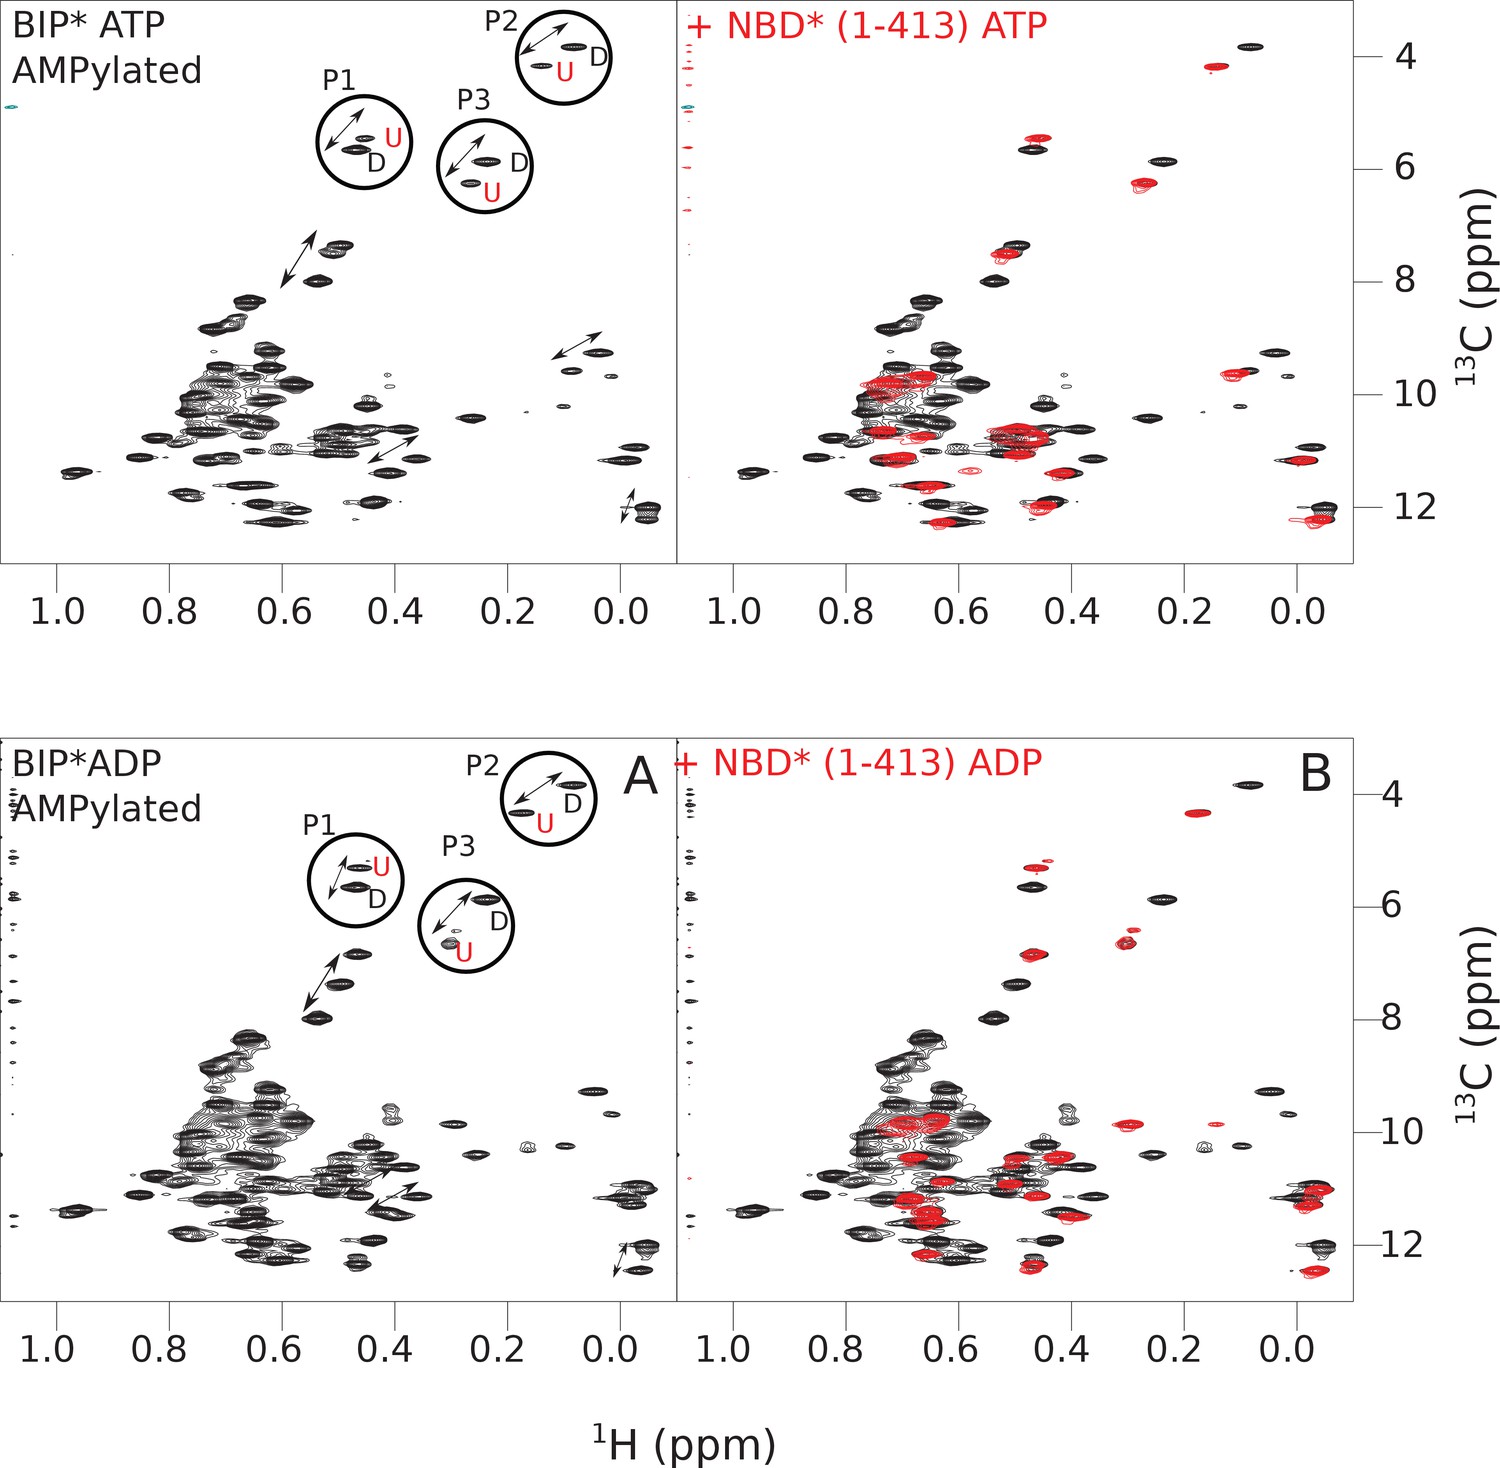
The isoleucine regions of methyl-TROSY spectra of ATP- and ADP-bound states of AMPylated full-length (FL) BiP* (A, in black), overlaid with the spectra of a corresponding nucleotide-bound state of NBD*(1-413) (B, in red).
Peaks in the spectra of the FL protein were assigned to the domain-undocked (U) conformation when they were overlapped with peaks in the spectrum of the isolated NBD*(1-413) in the corresponding nucleotide state (ADP or ATP-bound). When two sets of peaks were observed in the NMR methyl spectra of the FL protein, the second peak with distinct chemical shifts from those observed for the isolated NBD*(1-413), was assigned to the domain-docked conformation (D). The three representative peak doublets used to calculate the population of the domain-docked conformation (Figure 5—source data 1) were labeled as P1 (an unassigned NBD Ile peak), P2 (Ile145) and P3 (Ile371).
Figure 5—figure supplement 2
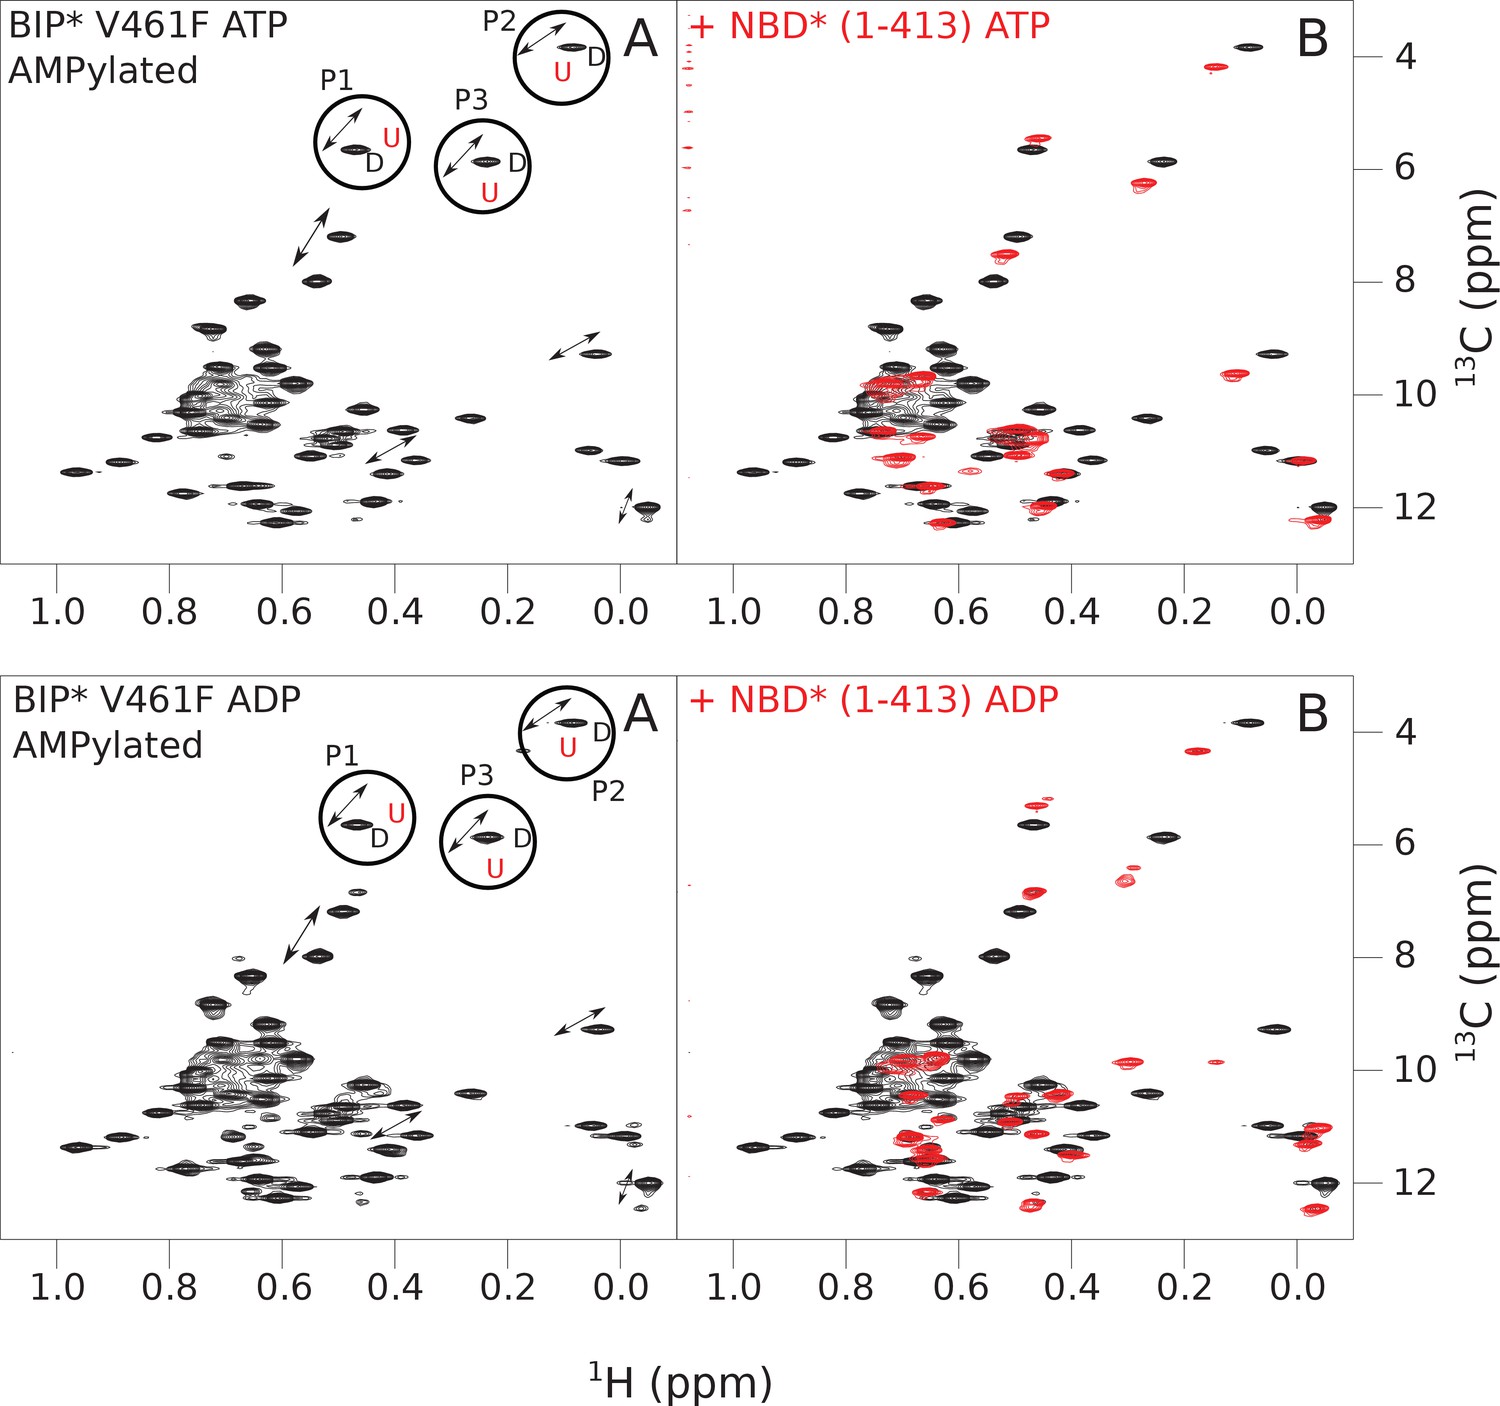
The isoleucine regions of methyl-TROSY spectra of ATP- and ADP-bound states of AMPylated full-length (FL) V461F BiP* (A, in black), overlaid with the spectra of a corresponding nucleotide-bound state of NBD*(1-413) (B, in red).
Peaks in the spectra of the FL protein were assigned to the domain-undocked (U) conformation when they were overlapped with peaks in the spectrum of the isolated NBD*(1-413) in the corresponding nucleotide state (ADP or ATP-bound). When two sets of peaks were observed in the NMR methyl spectra of the FL protein, the second peak with distinct chemical shifts from those observed for the isolated NBD*(1-413), was assigned to the domain-docked conformation (D). The three representative peak doublets used to calculate the population of the domain-docked conformation (Figure 5—source data 1) were labeled as P1 (an unassigned NBD Ile peak), P2 (Ile145) and P3 (Ile371).
Figure 5—figure supplement 3
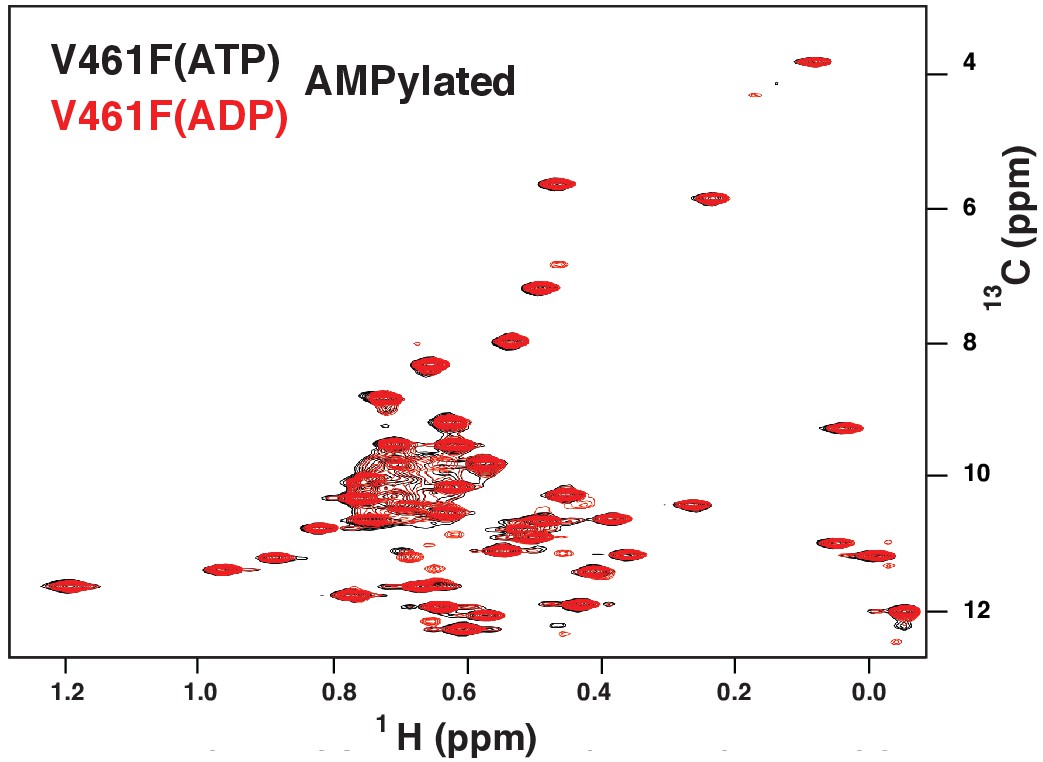
The methyl TROSY spectrum of ATP-bound AMPylated BiP*-V461F (black) overlaid with the spectrum of ADP-bound AMPylated BiP*-V461F (red).
https://doi.org/10.7554/eLife.29430.018
Figure 5—figure supplement 4
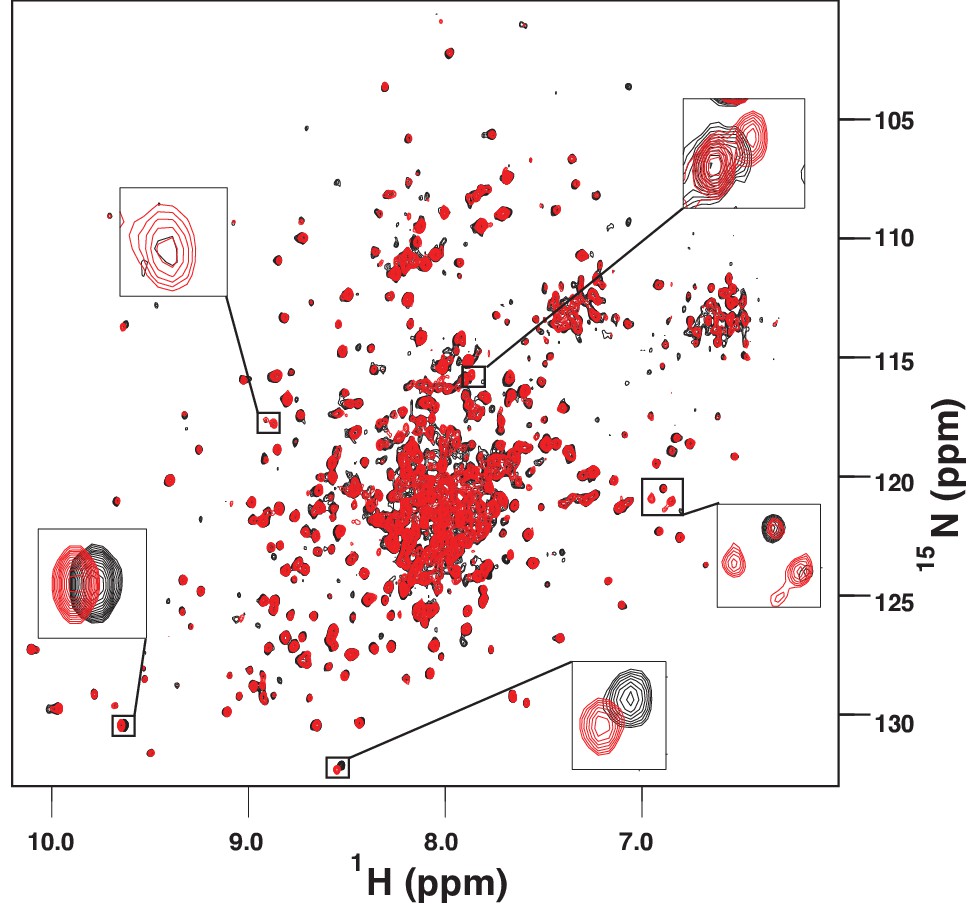
The amide TROSY spectrum of ATP-bound AMPylated BiP*-V461F (black) overlaid with the spectrum of ADP-bound AMPylated BiP*-V461F (red).
Blowups of the representative regions of the TROSY spectra highlighting local chemical shift perturbations between ADP- and ATP-bound states.
Figure 5—figure supplement 5
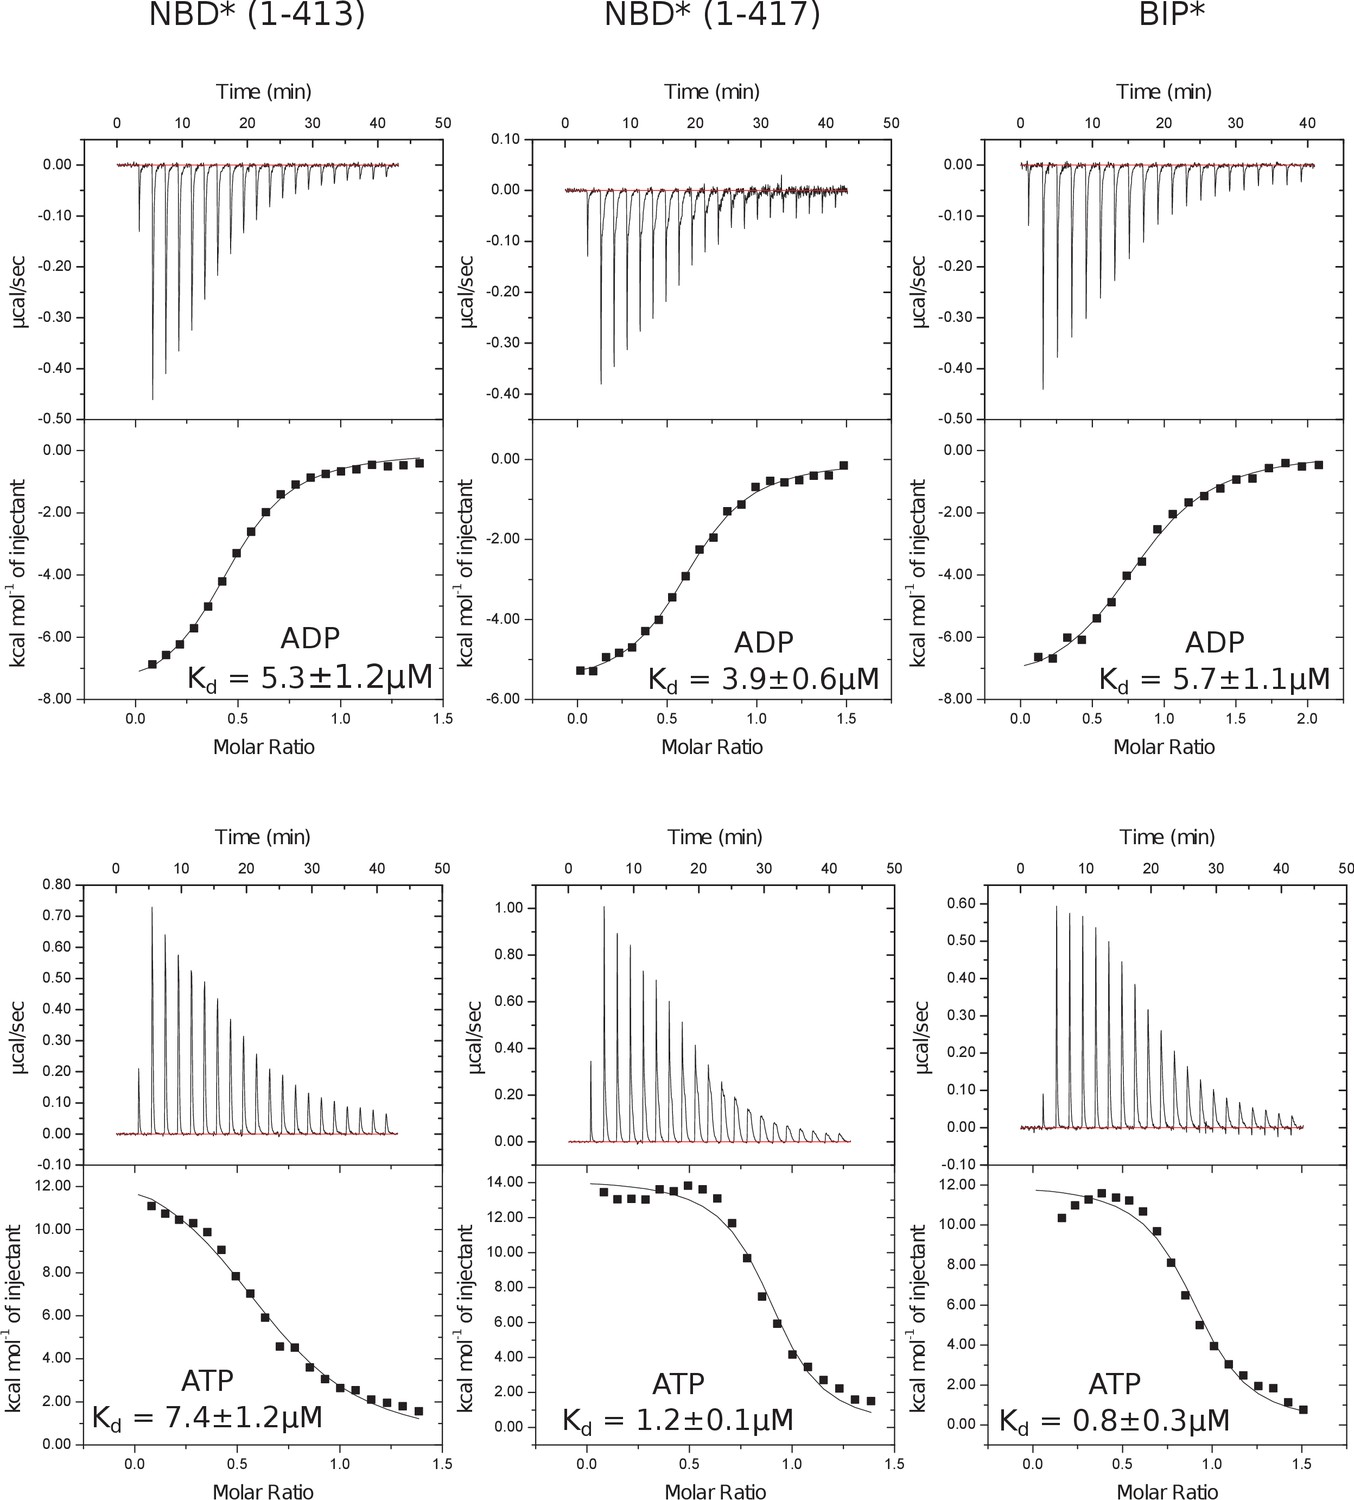
Representative panels showing nucleotide (ATP or ADP) binding to BiP* and isolated NBD*(1-413) and NBD*(1-417) measured by ITC.
Experiments were performed at 25°C using 20–80 μM protein in the cell and 0.1–0.4 mM ADP (or ATP) injected from the syringe. The top panels show raw data and the bottom panels show integrated normalized data.
Figure 5—figure supplement 6

Representative panels showing nucleotide (ATP or ADP) binding to non-AMPylated and AMPylated V461F BiP* measured by ITC.
Experiments were performed at 25°C using 30 μM protein in the cell and 0.25–0.35 mM ADP (or ATP) injected from the syringe. Top panels show raw data, and bottom panels show integrated normalized data.
Figure 5—figure supplement 7
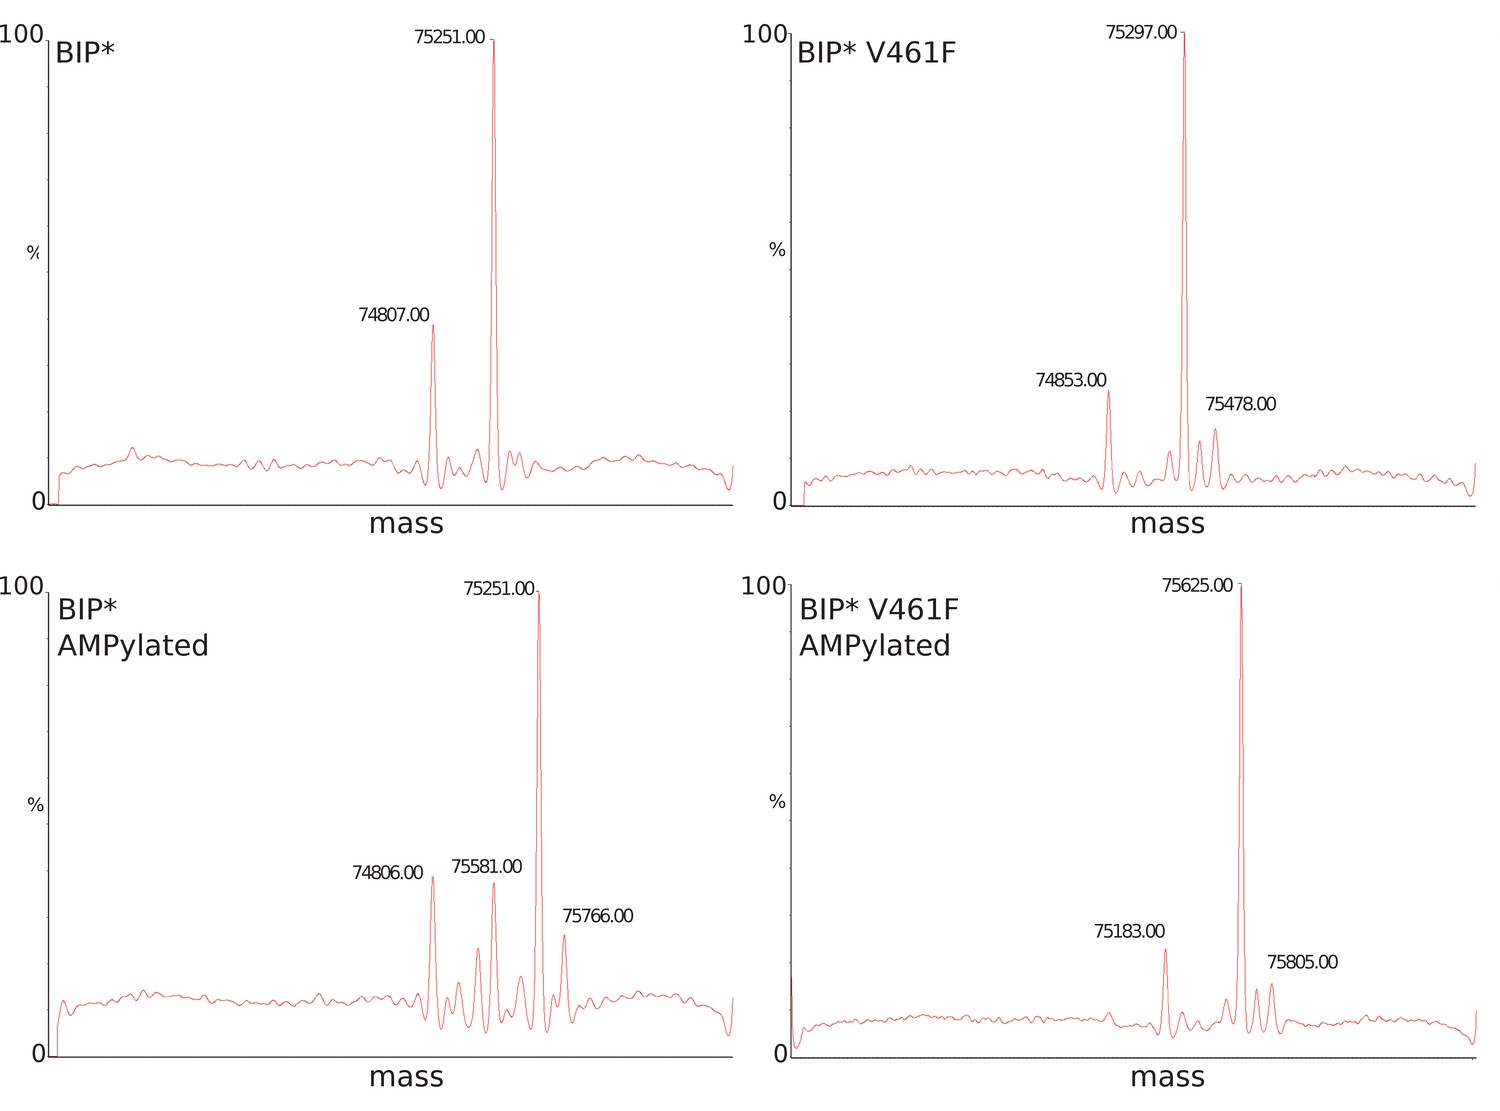
LC-MS data for molecular mass determination of unmodified (panels A-B) and AMPylated (panels C-D) BiP.
Molecular mass difference of ~330 Da as reported before (Preissler et al., 2015) corresponds to modification by AMPlation. An additional peak at ±180 Da corresponds to α-N-Glucosylation of the His-tag.
Figure 6

The unique features of the BiP conformational landscape and its posttranslational regulation: Schematic illustration of three key ligand-bound states (ATP-, ATP- and substrate-, and ADP-bound) of DnaK and BiP. For both chaperones the conformational landscapes comprises three structurally and functionally distinct conformations: domain-docked (D), intermediate domain-undocked linker-bound (I), and domain-undocked linker-unbound (U).
Blue and red arrows illustrate how local perturbations of the SBD affect the BiP conformational landscape: the I437V and I538V substitutions favor domain undocking (blue arrows, Figure 4), while the V461F and I526V substitutions (Figure 4) as well as AMPylation of Thr518 (Figure 5) stabilize the domain-docked conformation in the presence of ATP and ADP. The additive effect, for example, upon the V461F substitution and AMPylation, is also shown (double red arrows).
Tables
Table 1
Thermodynamics of nucleotide binding for BiP and DnaK.
ITC experiments for full-length (FL) BiP* and its two NBD constructs with and without the interdomain linker, NBD(1-413) and NBD(1-417), were repeated three times and the standard deviations for all parameters were less than 10%.
| ANP | Kd (µM) | ∆G (kcal/mol) | ∆H (kcal/mol) | -T∆S (kcal/mol) | |
|---|---|---|---|---|---|
| DnaK* FL | ATP | 0.16 | −9.3 | 9.0 | −18.3 |
| ADP | 0.25 | −9.0 | −3.2 | −5.8 | |
| DnaK* NBD | ATP | 0.61 | −8.9 | −4.1 | −3.7 |
| ADP | 0.17 | −9.2 | −3.3 | −6.0 | |
| BiP* FL | ATP | 0.80 | −8.3 | 11.4 | −19.7 |
| ADP | 5.73 | −7.1 | −7.4 | 0.3 | |
| BiP* NBD(1-413) | ATP | 7.41 | −7.0 | 12.3 | −19.3 |
| ADP | 5.27 | −7.2 | −7.4 | 0.2 | |
| BiP* NBD(1-417) | ATP | 1.15 | −8.1 | 14.7 | −22.3 |
| ADP | 3.94 | −7.4 | −6.4 | 1.0 |
-
*Thermodynamic parameters for ATPase deficient DnaK (DnaK*) and its NBD construct without the interdomain linker were taken from Taneva et al (Taneva et al., 2010).
Additional files
-
Transparent reporting form
- https://doi.org/10.7554/eLife.29430.026
Download links
A two-part list of links to download the article, or parts of the article, in various formats.
Downloads (link to download the article as PDF)
Open citations (links to open the citations from this article in various online reference manager services)
Cite this article (links to download the citations from this article in formats compatible with various reference manager tools)
Allosteric fine-tuning of the conformational equilibrium poises the chaperone BiP for post-translational regulation
eLife 6:e29430.
https://doi.org/10.7554/eLife.29430


