Stress responsive miR-31 is a major modulator of mouse intestinal stem cells during regeneration and tumorigenesis
- China Agricultural University, China
- Vanderbilt University Medical Center, United States
- University of California, Irvine, United States
- Shandong Academy of Agricultural Sciences, China
- Xiamen University, China
- University of Pennsylvania, United States
- Imperial College London, United Kingdom
Figures
Figure 1 with 8 supplements
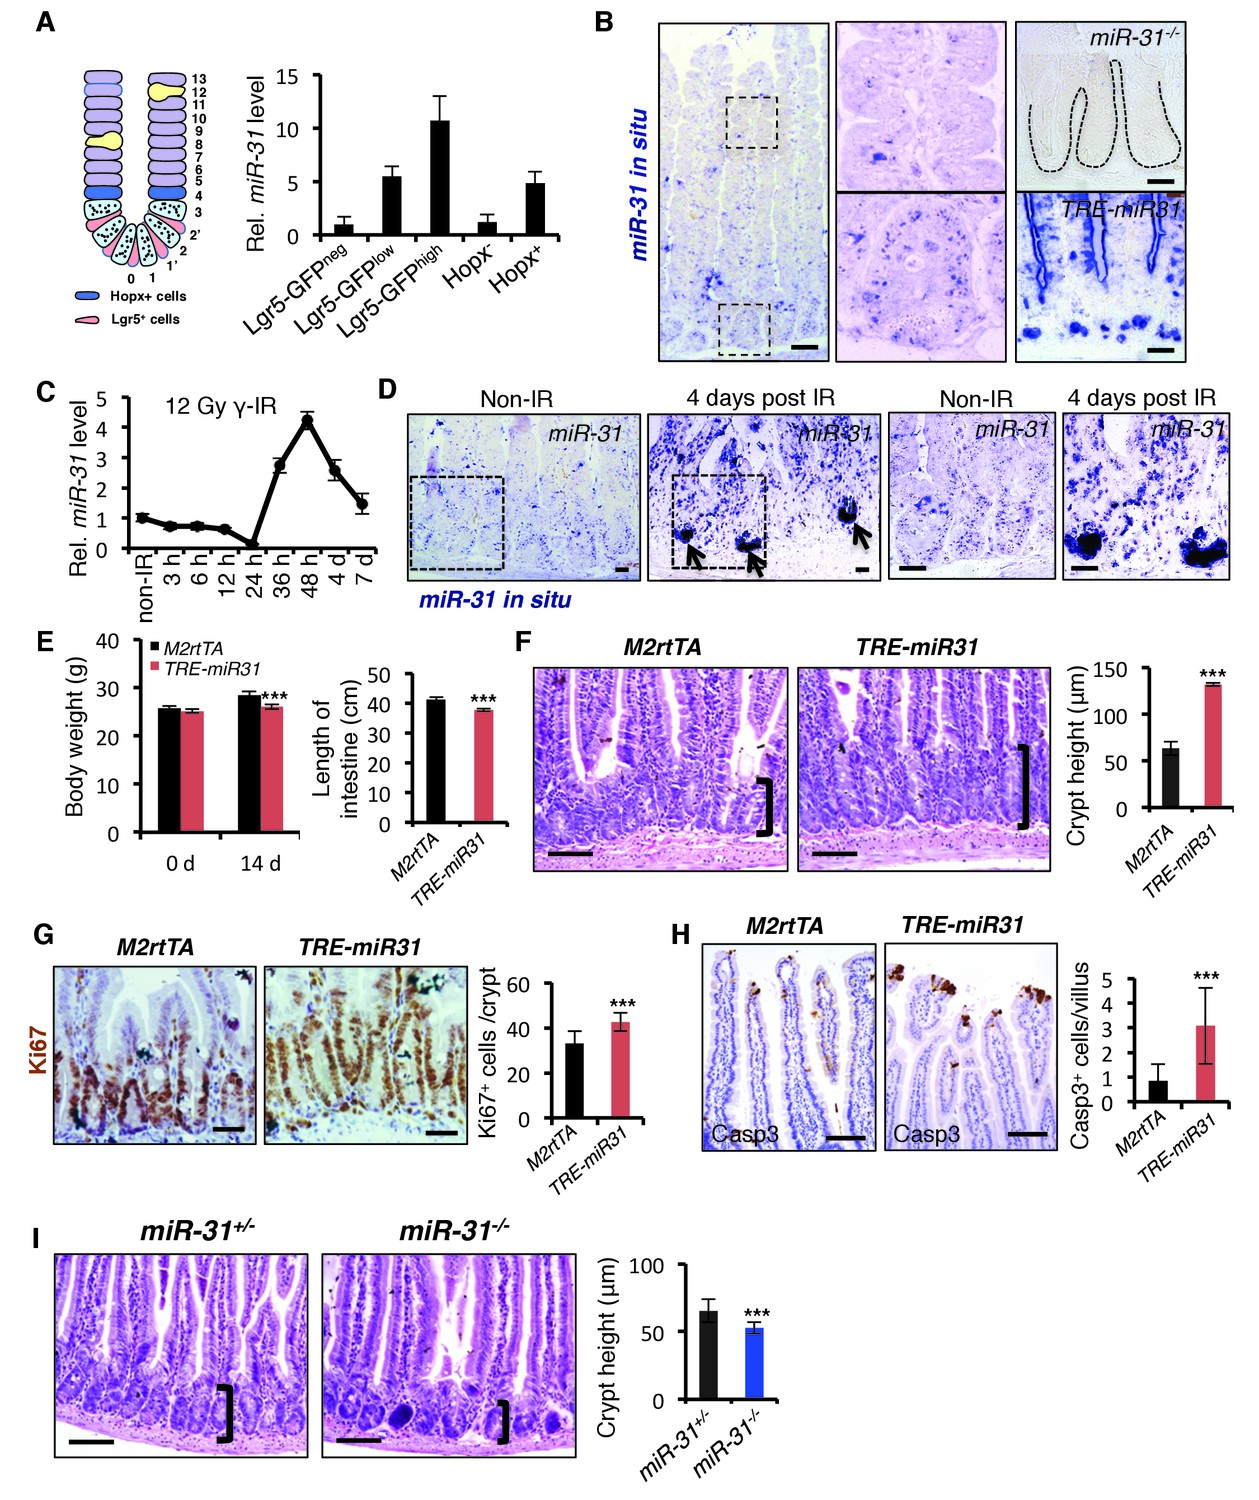
MiR-31 promotes turnover of intestinal epithelial cells.
(A) Schematic picture of intestinal crypt showing Lgr5+ CBCs and Hopx+ cells. qRT-PCR for miR-31 in Lgr5-GFPhigh, Lgr5-GFPlow, Lgr5-GFPneg, Hopx- and Hopx+ sorted intestinal epithelial cells. n = 4 biological replicates. (B) In situ hybridization for miR-31 in the intestinal epithelium. Left panel, representative low magnification image (Scale bar: 200 μm); Middle panels, high magnification images indicated by dashed boxes in left panel; Right panels (Scale bar: 50 μm), miR-31 KO intestinal section used as a negative control (Top) and TRE-miR31 (miR-31 overexpressing) intestinal section used as a positive control (Bottom). (C) qRT-PCR for miR-31 in the intestinal epithelium after exposure to 12 Gy γ-IR at indicated time points. n = 3 biological replicates. (D) In situ hybridization for miR-31 in intestines without γ -IR treatment (non-IR), and intestines 4 days after 12 Gy γ-IR. Arrows, miR-31 positive regenerative foci. Dashes boxes indicate the high magnification images in right panels. Scale bar: 50 μm. (E) Quantification of body weight from M2rtTA and TRE-miR31 mice at the age of 8 weeks before and after Dox treatment for 2 weeks. Quantification of intestine length from M2rtTA and TRE-miR31 mice following 2 week Dox induction. n = 6 biological replicates. ***p<0.001. (F) Representative histologic images showing extension of crypt height in jejunum from TRE-miR31 mice, and quantification of crypt height from M2rtTA and TRE-miR31 intestine. Both M2rtTA and TRE-miR31 mice were treated with Dox for 2 weeks. n = 3 biological replicates. Scale bar: 50 μm. ***p<0.001. (G) Immunohistochemistry for Ki67 and quantification of Ki67+ cells per crypt in M2rtTA andTRE-miR31 jejunum, showing an expanded proliferative zone in TRE-miR31 mice following 2 weeks of Dox induction. n = 3 biological replicates. Scale bar: 50 μm. ***p<0.001. (H) Immunohistochemistry for cleaved-Caspase 3 (Casp3) and quantification of Casp3+ cells in the top of intestinal villi from M2rtTA andTRE-miR31 mice following 2 weeks of Dox induction. n = 3 biological replicates. 60 villi were quantified in each mouse. Scale bar: 100 μm. ***p<0.001. (I) Representative histologic images and quantification of crypt height in intestines from miR-31+/− and miR-31−/− mice at 2 months of age. Brackets mark crypts. Scale bar: 100 μm. n = 3 biological replicates. ***p<0.001.
-
Figure 1—source data 1
Source data for Figure 1C,E,F,G,H and I.
- https://doi.org/10.7554/eLife.29538.012
-
Figure 1—source data 2
Source data for Figure 1—figure supplements 1–3.
- https://doi.org/10.7554/eLife.29538.013
-
Figure 1—source data 3
Source data for Figure 1—figure supplements 4–7.
- https://doi.org/10.7554/eLife.29538.014
Figure 1—figure supplement 1
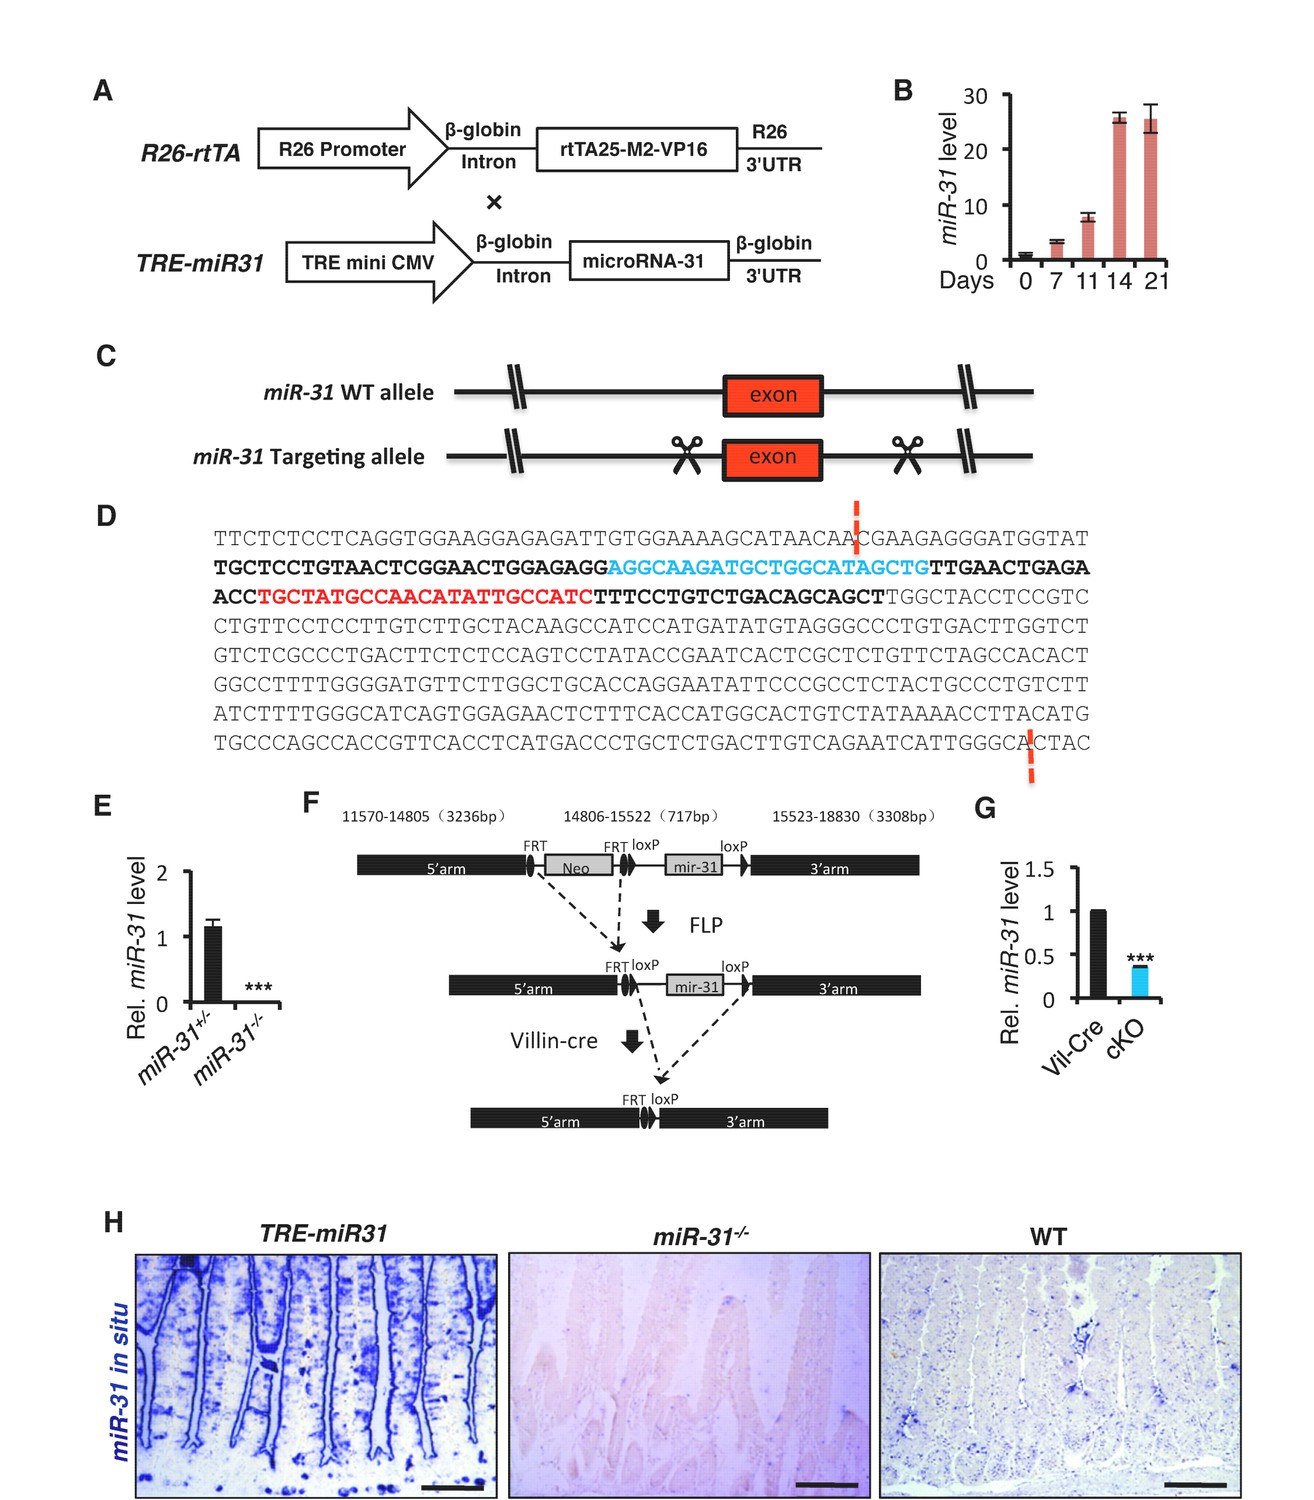
Generation of inducible TRE-miR-31 transgenic mice, constitutive miR-31 KO and conditional miR-31 KO mice.
(A) Schematic maps of constructs used to generate Rosa26-rtTA;TRE-miR31 (TRE-miR31) double transgenic mice. (B) qRT-PCR analysis for miR-31 in intestinal tissues from M2rtTA and TRE-miR31 mice at indicated timepoints following Dox treatment. (C) Strategy to generate miR-31 KO mice using Crispr/Cas9 technique. (D) 402 bp DNA fragment containing miR-31 indicated by dash lines was deleted in the KO allele. The miR-31 exon indicated by bold; mature miR-31 indicated by blue, miR-31* indicated by red. (E) qRT-PCR analysis for miR-31 in intestinal tissues from miR-31+/− and miR-31−/− mice. ***p<0.001. (F) Strategy to generate miR-31 conditional null allele. (G) qRT-PCR for miR-31 in intestine from Vil-Cre and Vil-Cre/miR-31fl/fl (cKO) mice. ***p<0.001. (H) In situ hybridization for miR-31 in TRE-miR31, miR-31−/− and WT intestines. TRE-miR31 mice were pretreated with Dox for 2 weeks. Scale bar: 100 μm. Note: The schematic depiction of the general strategy for generating miR-31 mutant mice (Figure 1—figure supplement 1C and D) was also used in another unrelated study on the role of miR-31 in mammary stem cells and breast cancer and the manuscript is currently under consideration in Nature Communications.
Figure 1—figure supplement 2
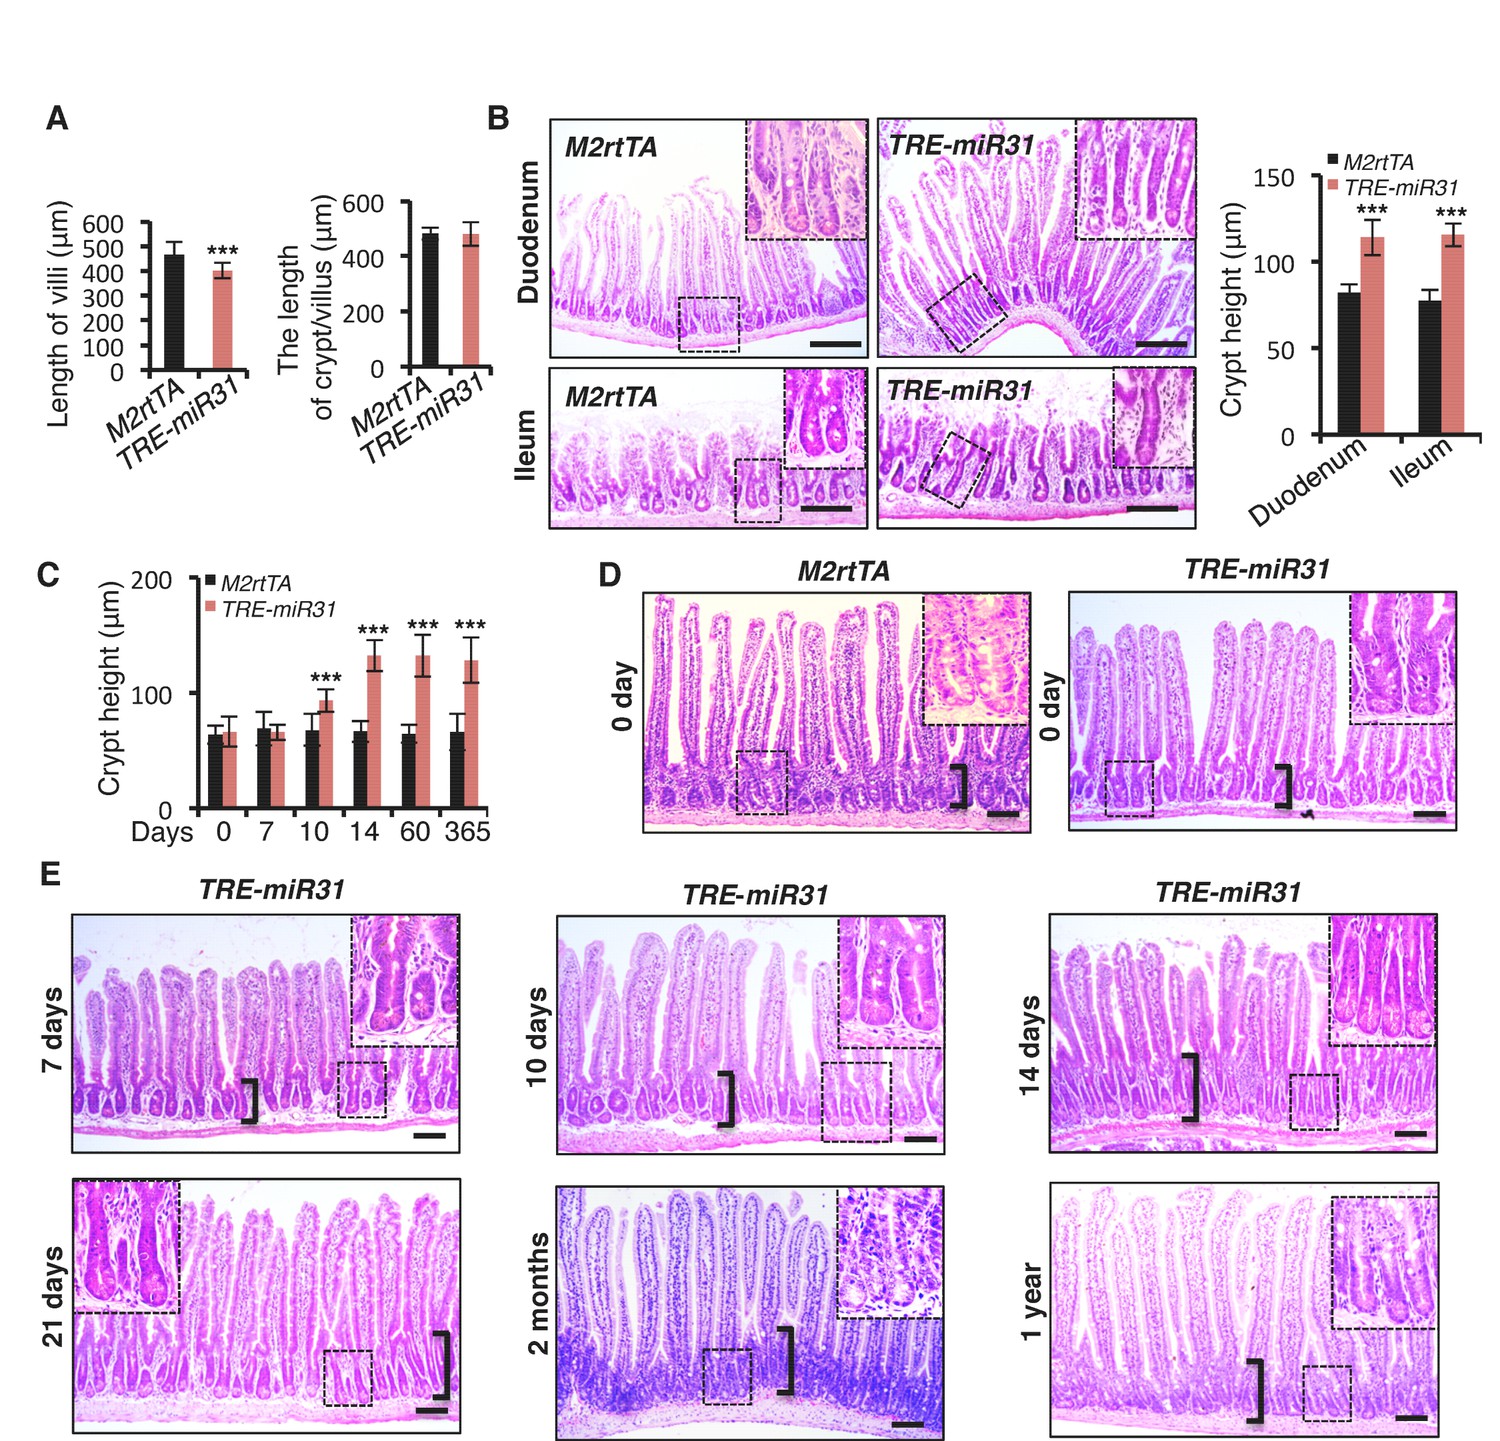
MiR-31 induction promotes crypt expansion.
(A) Quantification of length of villi and cypt/villus in M2rtTA and TRE-miR31 mice following 2 weeks of Dox induction. n = 3 biological replicates. ***p<0.001. (B) Representative histologic images of duodenum and ileum from M2rtTA and TRE-miR31 mice following 2 weeks of Dox induction, and quantification of crypt height. Dashed boxes indicate high magnification images of crypts. Scale bar: 100 μm. ***p<0.001. (C) Quantification of crypt height from M2rtTA and TRE-miR31 intestine at indicated time points. Continuous Dox treatment was administered on M2rtTA and TRE-miR31 mice for 0 day, 7 days, 10 days, 14 days, 2 months and 1 year. n = 3 biological replicates at each time points. ***p<0.001. (D) Representative histologic images of jejunum from M2rtTA and TRE-miR31 mice without Dox treatment. Brackets mark crypts. Dashed boxes indicate high magnification images of crypts. Scale bar: 50 μm. (E) Representative histologic images of jejunum from TRE-miR31 mice following 7, 10, 14, 21 days, 2 months and 1 year of Dox induction. Brackets mark crypts. Dashed boxes indicate high magnification images of crypts. Scale bar: 50 μm.
Figure 1—figure supplement 3
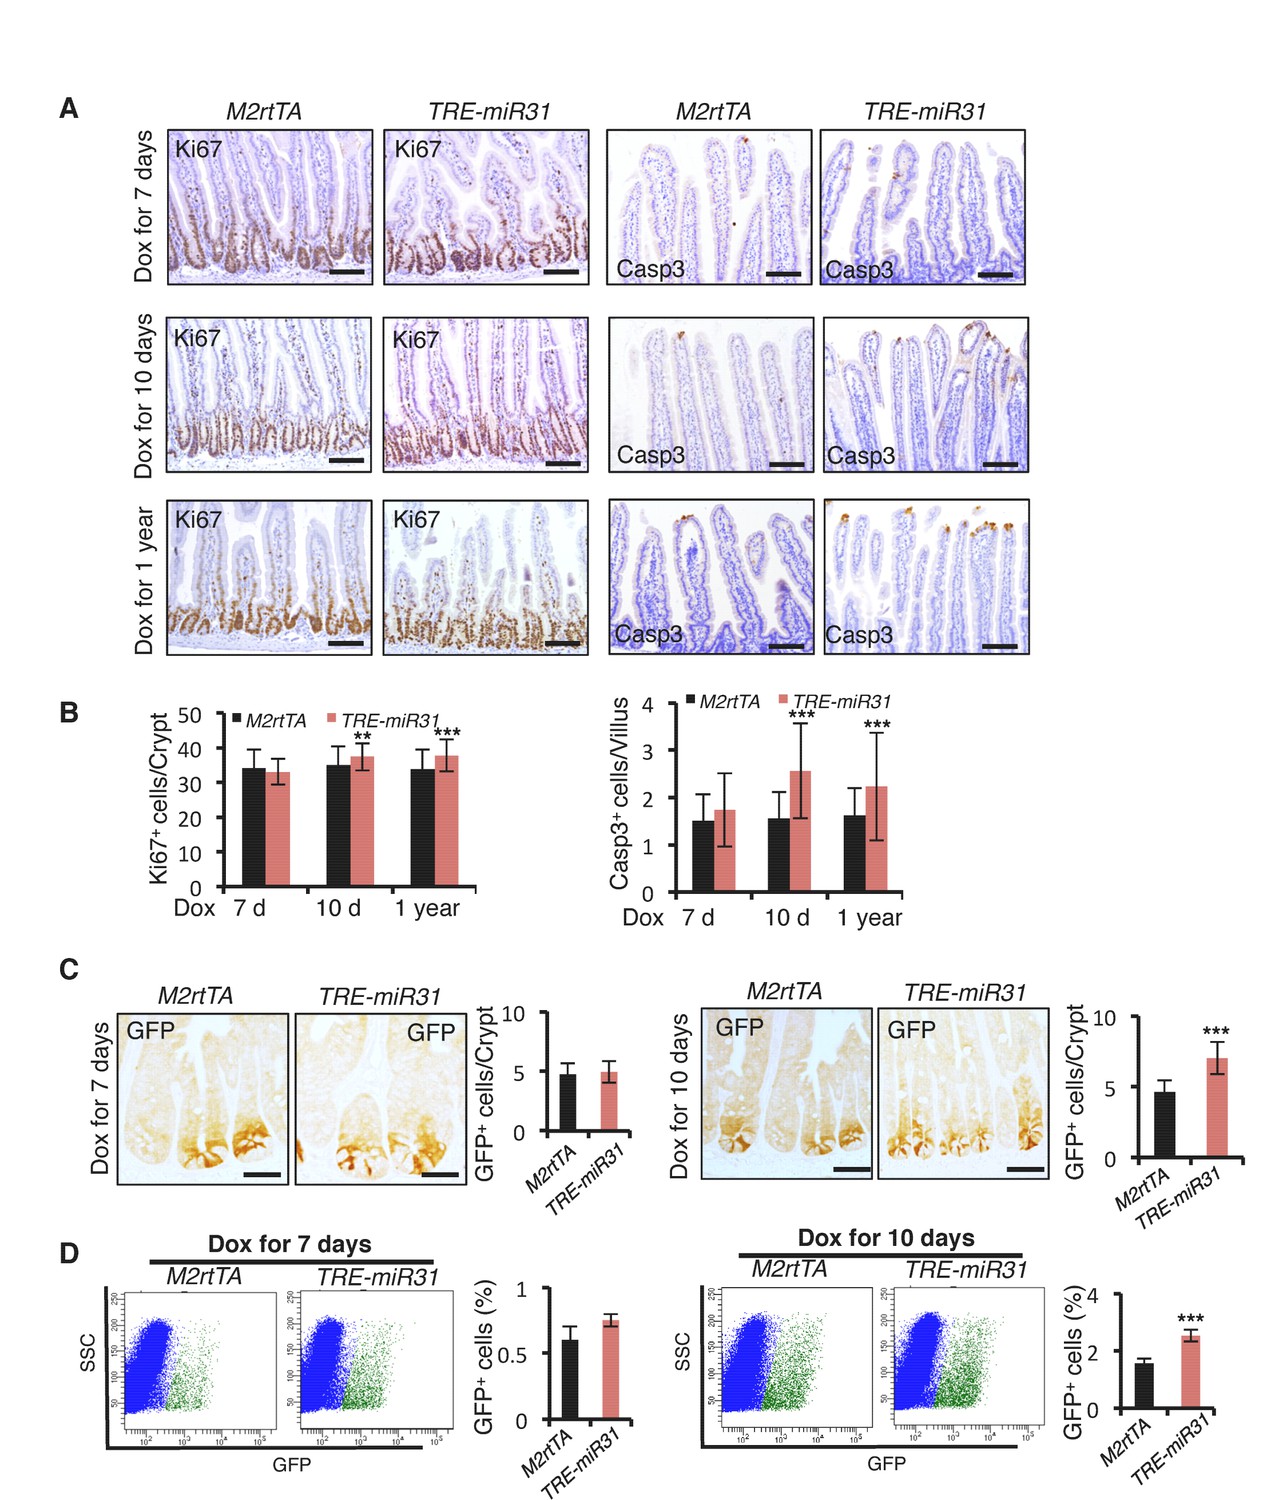
MiR-31 induction promotes cell proliferation in crypts, and apoptosis at the top of villi.
(A) Immunohistochemistry for Ki67 and Cleaved Caspase 3 in jejunum from M2rtTA and TRE-miR31 mice following 7, 10 and 365 days of Dox induction. Scale bar: 100 μm. (B) Quantification of Ki67+ cells in crypts of M2rtTA and TRE-miR31 mice, and Caspase 3+ cells at the tip of villi. **p<0.01; ***p<0.001. (C) Immunohistochemistry for GFP (Lgr5) and quantification of GFP+ cells in crypts from M2rtTA and TRE-miR31 mice following 7 and 10 days of Dox induction. ***p<0.001. (D) Representative FACS profiles and quantification of GFP positive intestinal epithelial cells (Lgr5-GFP+ cells) from an Lgr5-eGFP-CreERT reporter mice crossed with M2rtTA and TRE-miR31 mice. M2rtTA and TRE-miR31 mice were pre-treated with Dox for 7 and 10 days. n = 3 biological replicates. ***p<0.001.
Figure 1—figure supplement 4
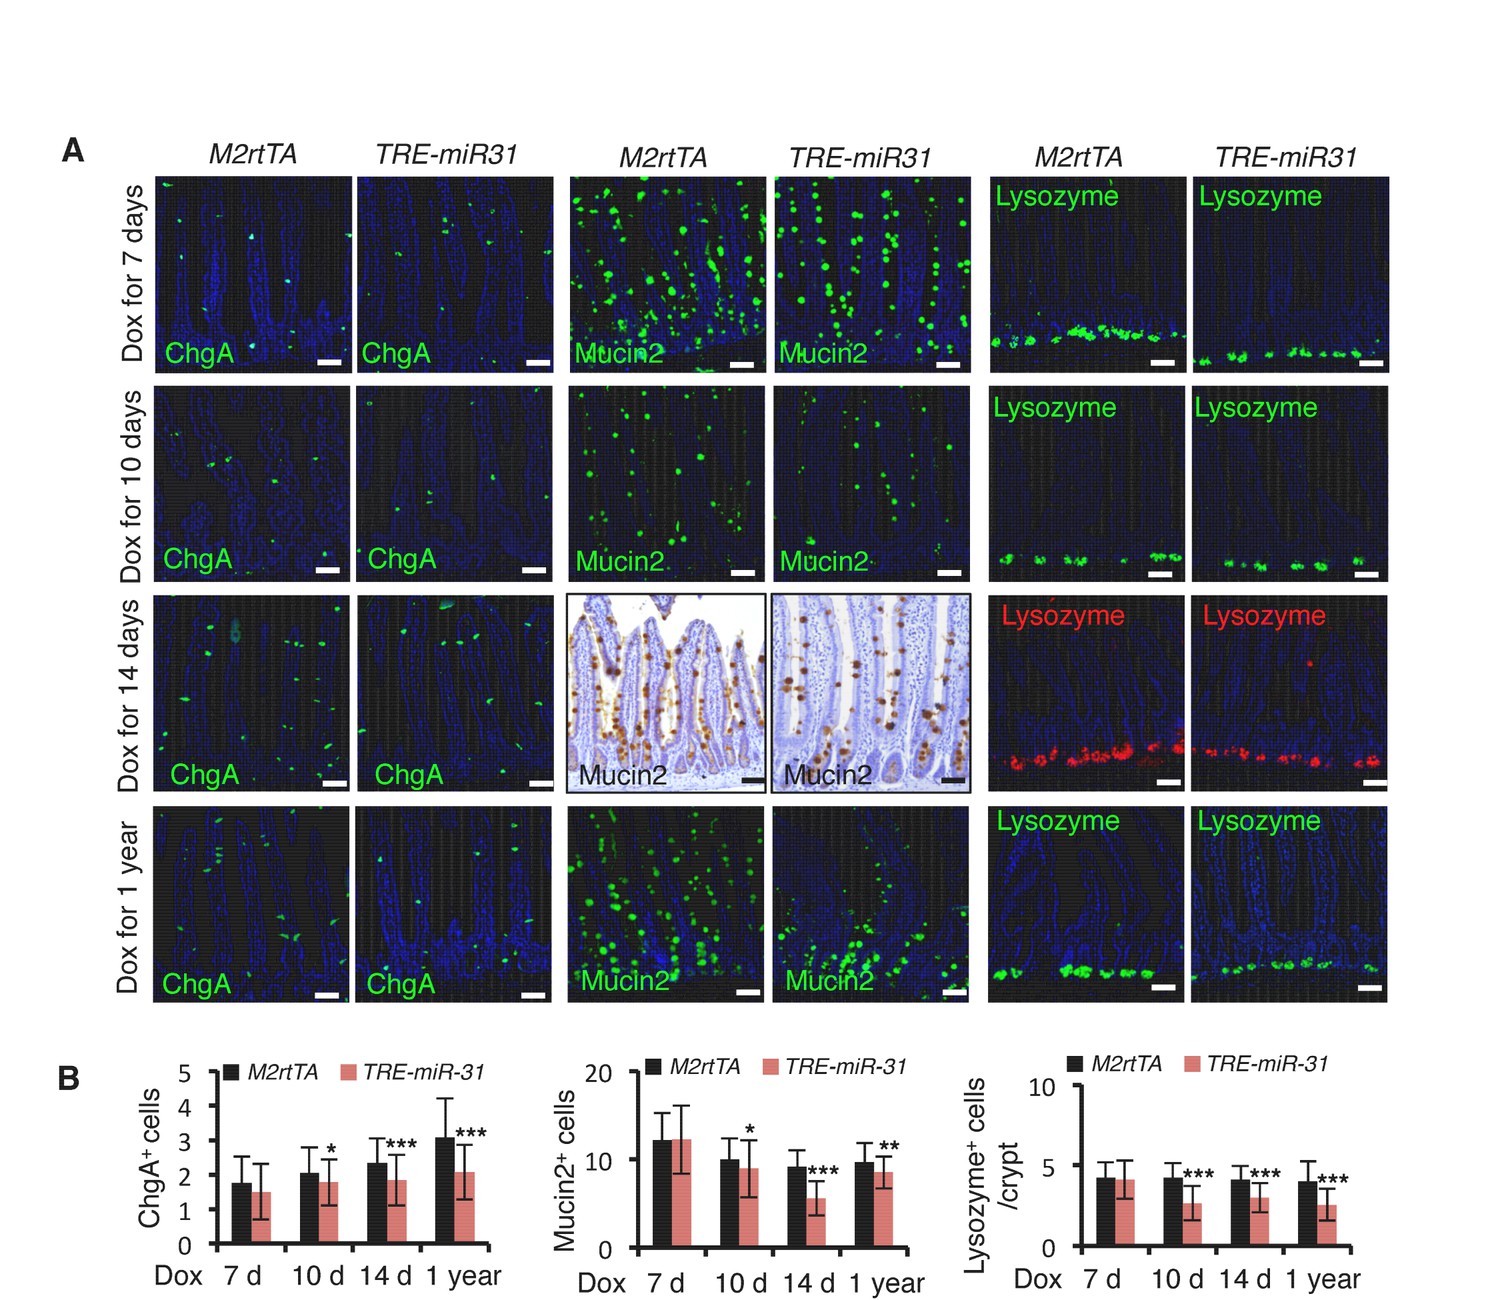
MiR-31 induction impairs cell differentiation.
(A) Immunostaining for ChgA, Mucin2 and Lysozyme in jejunum from M2rtTA and TRE-miR31 mice following 7, 10, 14 days and 1 year of Dox induction. n = 3 biological replicates at each time points. Scale bar: 50 μm. (B) Quantification of ChgA+ cells/crypt-villus, Mucin2+ cells/crypt-villus and Lysozyme+ cells/crypt in Panel A. *p<0.05; **p<0.01, ***p<0.001.
Figure 1—figure supplement 5
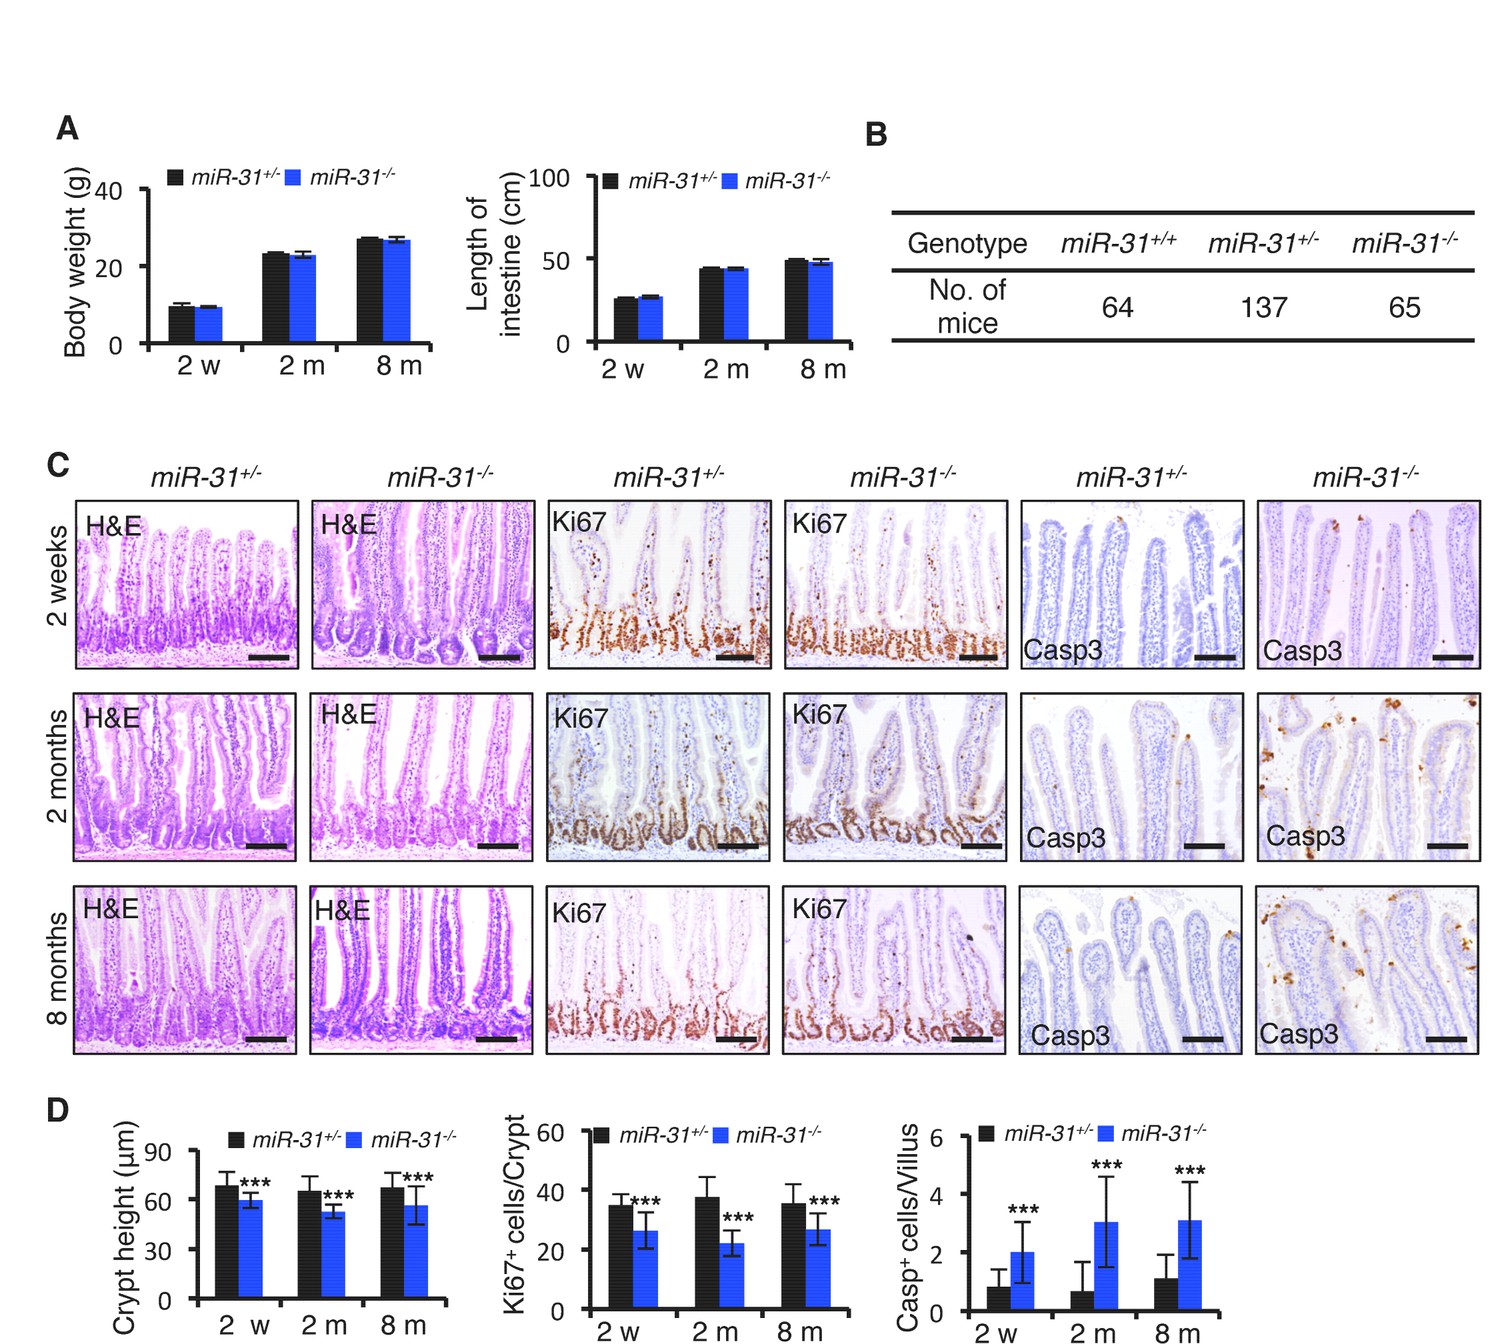
Loss of miR-31 led to shortened crypt.
(A) Quantification of body weight and intestinal length from miR-31+/− (Control) and miR-31−/− mice at 2 weeks, and 2 and 8 months of ages. n = 6 biological replicates for 2 weeks and 2 months; n = 4 biological replicates for 8 months. (B) Quantification of mouse number of miR-31+/+, miR-31+/− and miR-31−/− genotypes. (C) H&E staining and immunohistochemistry for Ki67 and cleaved Caspase 3 (Casp3) in jejunum of miR-31+/− and miR-31−/− mice at 2 weeks, 2 and 8 months of ages. Scale bar: 100 μm. (D) Quantification of crypt height, Ki67+ and Casp3+ cells at different timepoints in Panel C.
Figure 1—figure supplement 6
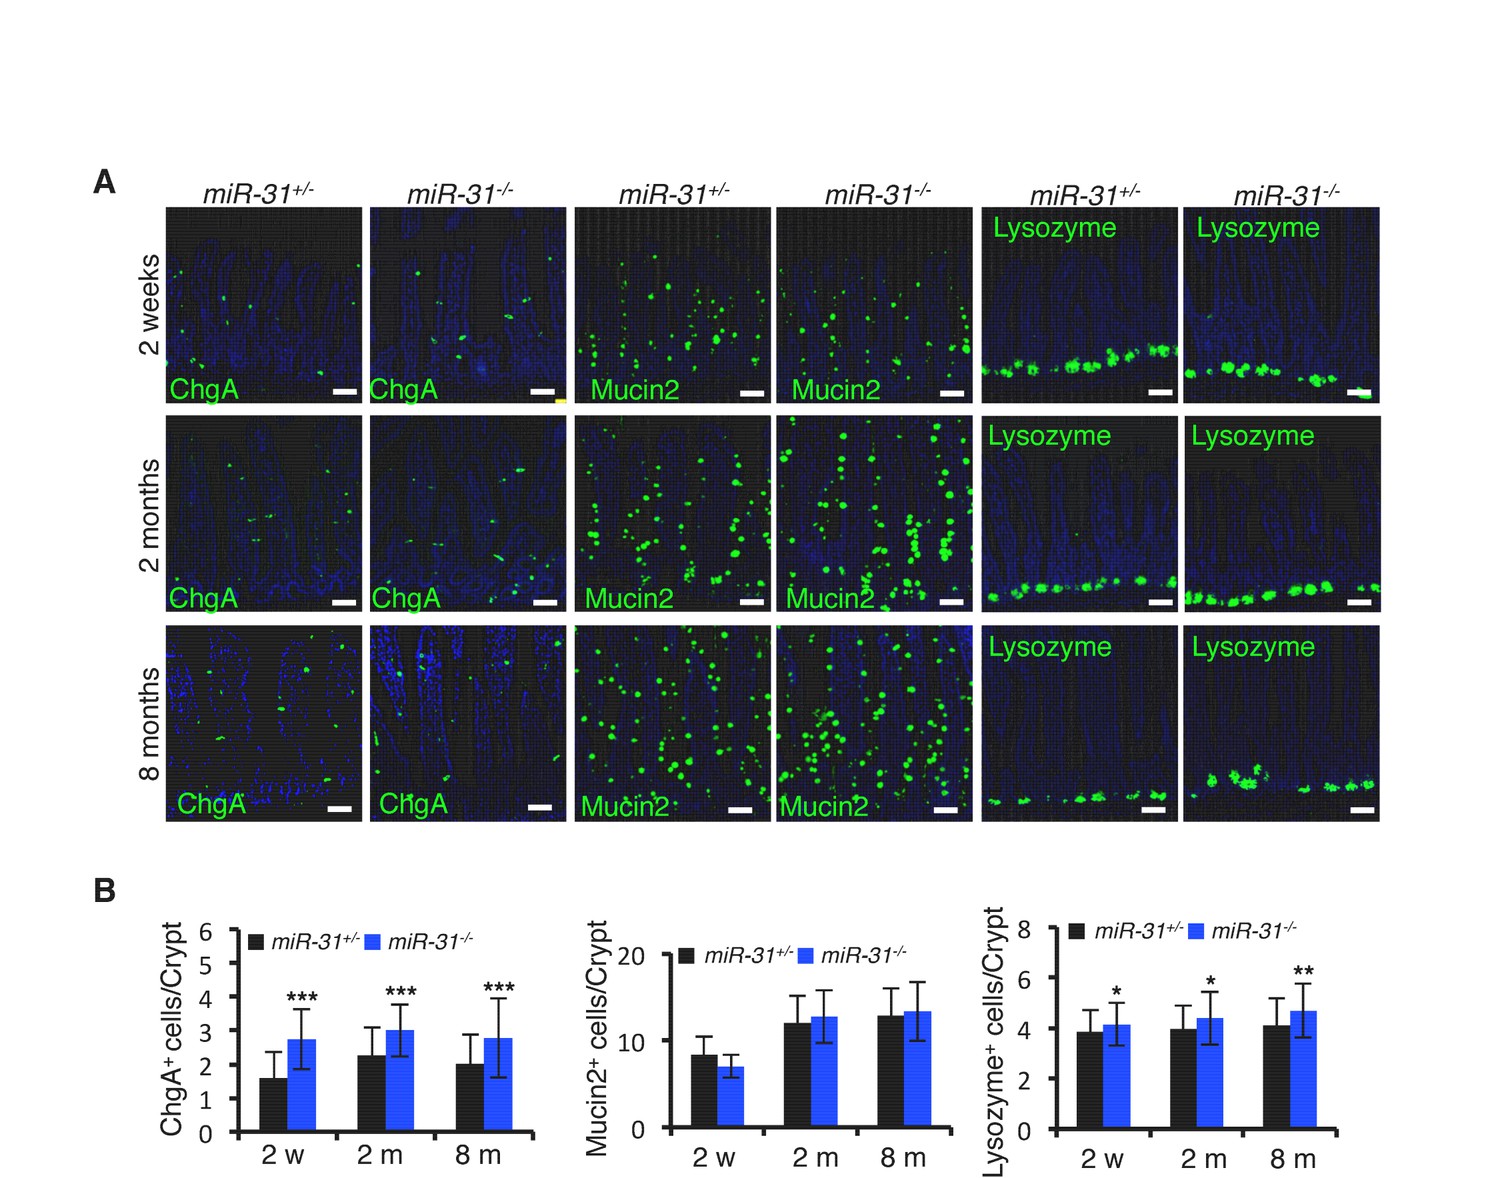
Loss of miR-31 does not affect cell differentiation.
(A) Immunofluorescence for ChgA, Mucin2 and Lysozyme in jejunum from miR-31+/− and miR-31−/− mice at indicated timepoints. Scale bar: 50 μm. (B) Quantification of ChgA+, Mucin2+ and Lysozyme+ cells in Panel A.
Figure 1—figure supplement 7
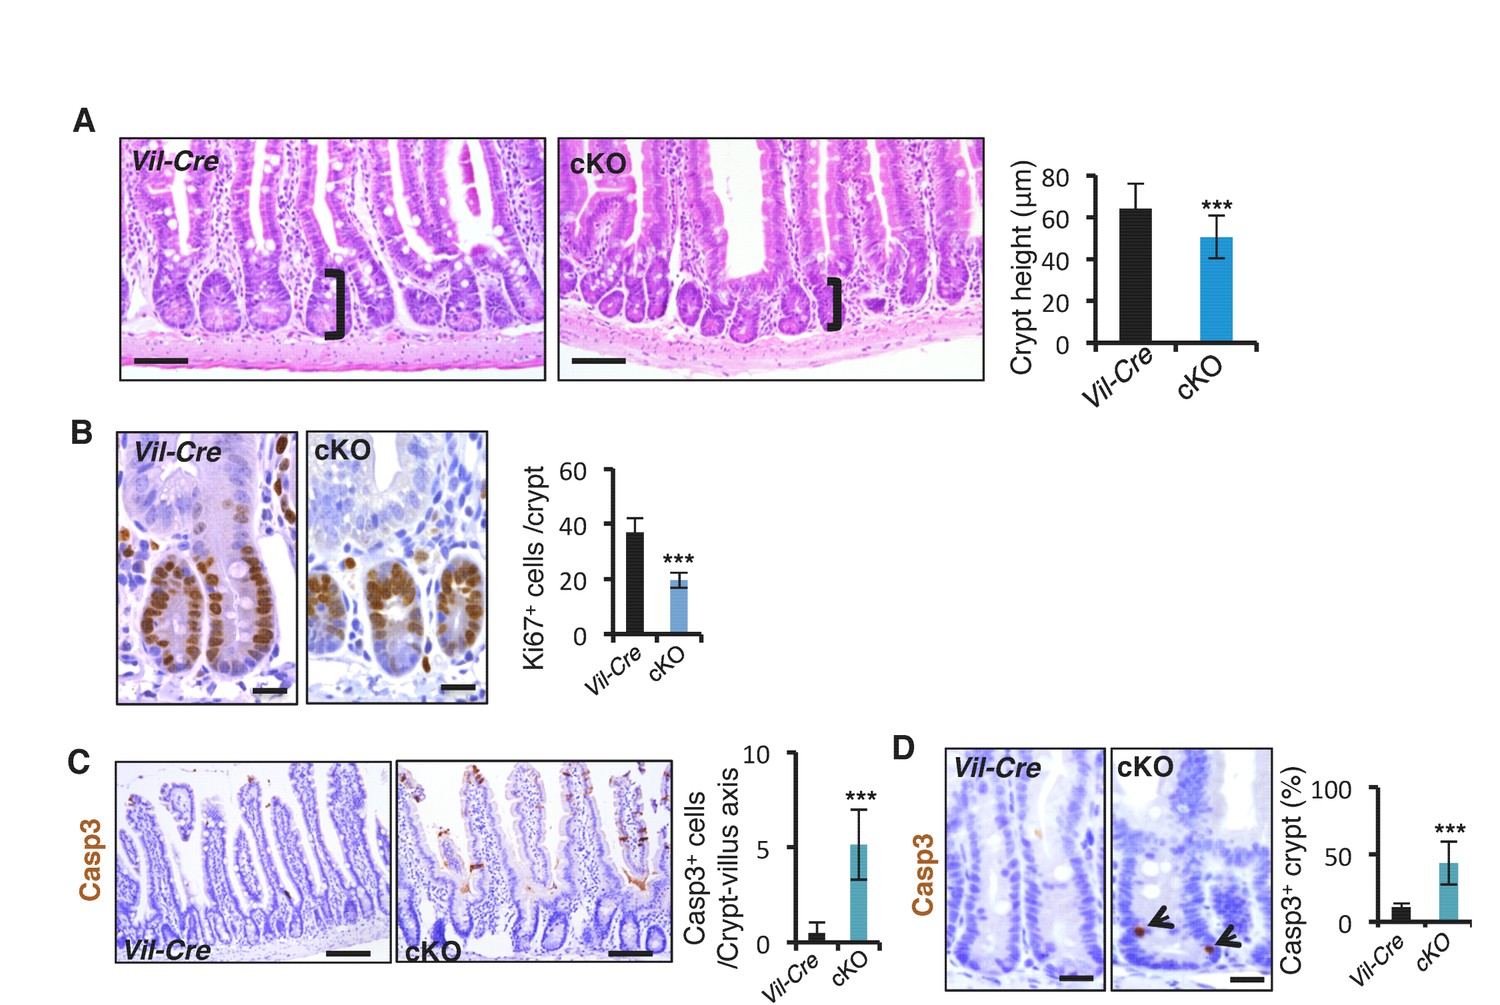
Conditional deletion of miR-31 resulted in shortened crypt, reduced proliferation and enhanced apoptosis.
(A) Representative histologic images of jejunum from Vil-Cre and miR-31 cKO mice, and quantification of crypt height. Brackets mark crypts. Scale bar: 50 μm. n = 4 biological replicates. ***p<0.001. (B) Immunohistochemistry for Ki67 in Vil-Cre and miR-31 cKO intestines. Quantification of Ki67+ cells per crypt. n = 3 biological replicates. Scale bar: 25 μm. (C) Immunohistochemistry for cleaved Caspase 3 (Casp3) in Vil-Cre and miR-31 cKO intestines. Quantification of Casp3+ cells per crypt-villus axis (excluding the tip of villus). n = 3 biological replicates. Scale bar: 100 μm. (D) High magnification images of immunohistochemistry for cleaved Caspase 3 (Casp3) in Vil-Cre and miR-31 cKO intestines. Quantification of percentage of Casp3+ crypts. n = 3 biological replicates. Scale bar: 25 μm.
Figure 1—figure supplement 8
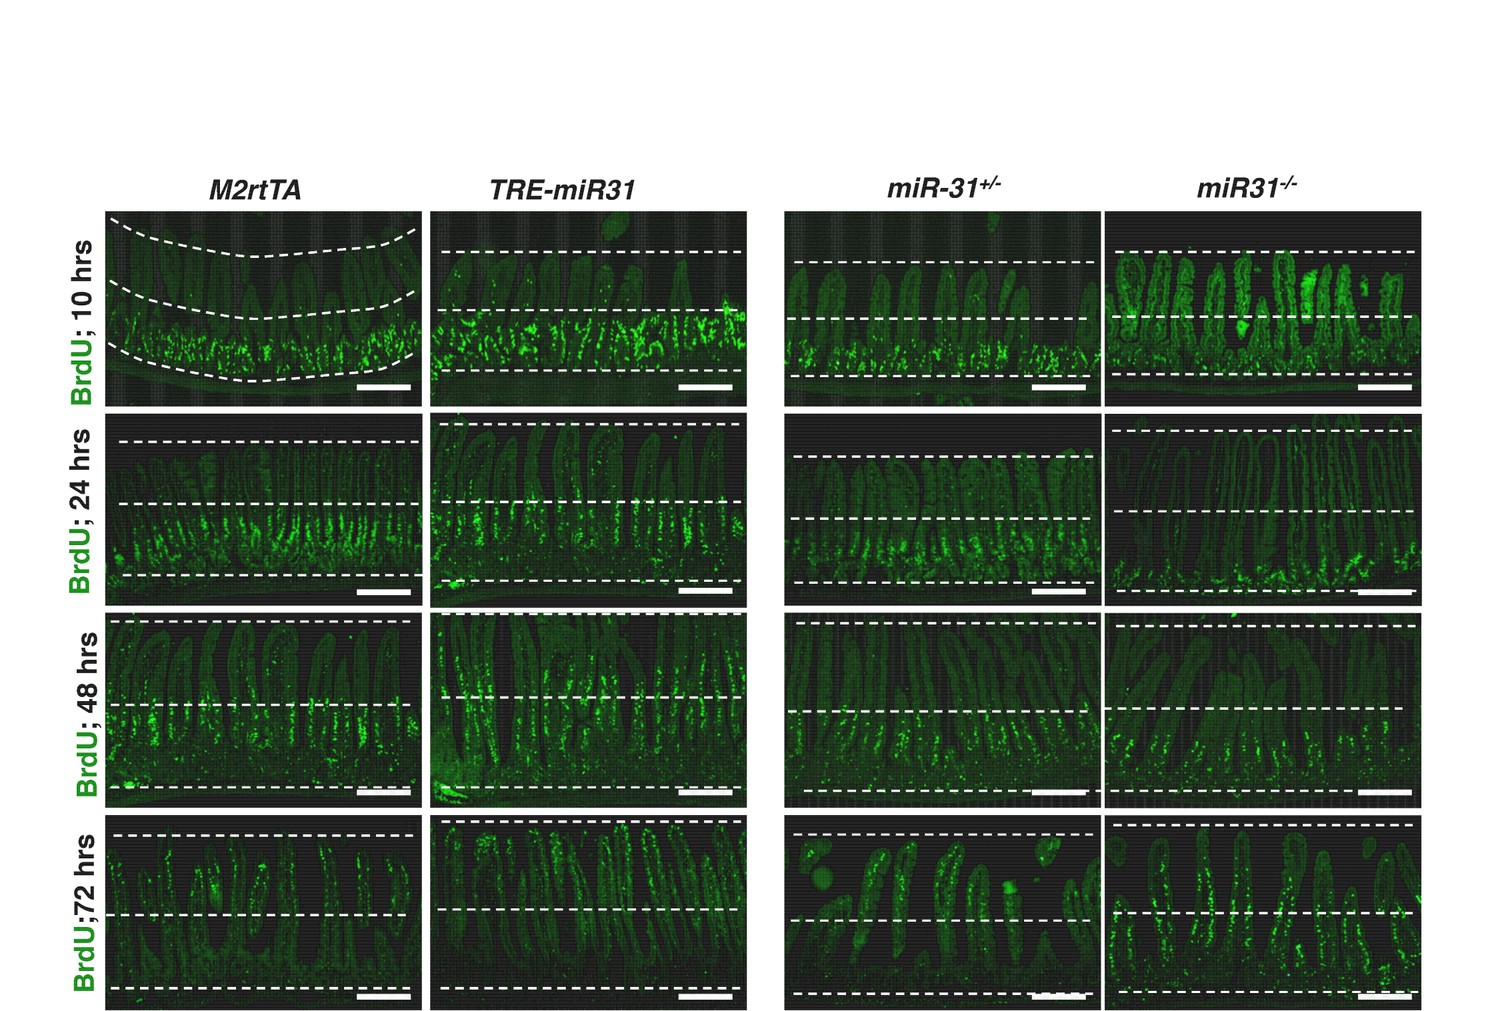
MiR-31 promotes cell turnover from crypt to villi.
Immunofluorescence for BrdU in M2rtTA, TRE-miR31, miR-31+/− and miR-31−/− intestinal crypts at indicated time points post 1 dose of BrdU pulse. The dashed lines marked the top of villi, middle line of intestine, and the bottom of crypt, respectively. Scale bar: 100 μm. n = 3 biological replicates at each time points.
Figure 2 with 1 supplement
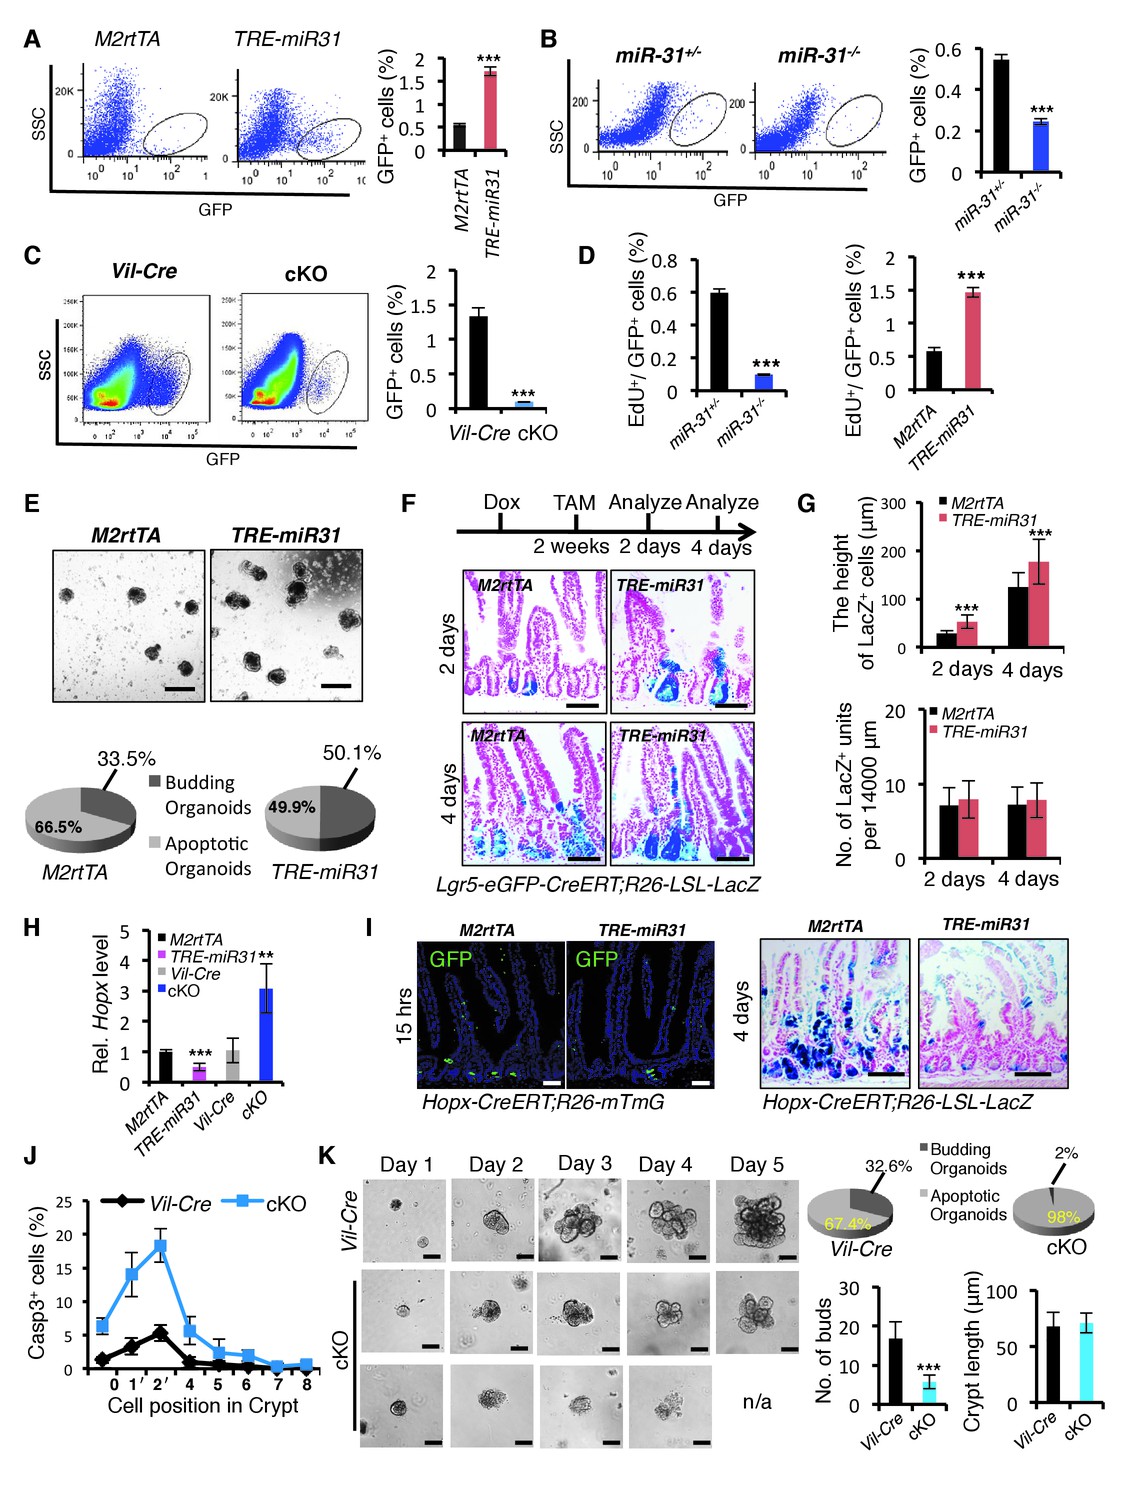
MiR-31 promotes expansion of Lgr5+ CBC stem cells.
(A) Representative FACS profiles and quantification of GFP positive intestinal epithelial cells (Lgr5-GFP+ cells) from an Lgr5-eGFP-CreERT reporter mice crossed with M2rtTA (control) and TRE-miR31 mice. M2rtTA (control) and TRE-miR31 mice were pre-treated with Dox for two weeks. n = 4 biological replicates. ***p<0.001. (B, C) FACS profiles and quantification of Lgr5-GFP+ cells from an Lgr5-eGFP-CreER reporter mice crossed with miR-31+/− (control) and miR-31−/− mice (B), or Vil-Cre (Villin-Cre) and cKO (Vil-Cre;miR-31fl/fl) mice (C). n = 4 biological replicates. ***p<0.001. (D) Assessment of 1.5-hour-pulse EdU incorporation in Lgr5+ CBC cells in M2rtTA, and TRE-miR31 mice following 2 weeks of Dox treatment, and in miR-31+/− and miR-31−/− intestine. ***p<0.001. (E) Crypts purified from M2rtTA and TRE-miR31 mice grown in organoid cultures with Dox. Representative gross images of budding organoids, and quantification of budding and apoptotic organoids at day 7. Scale bar: 500 μm. n = 5 technical replicates. (F) X-gal staining showing lineage tracing events from Lgr5+ ISCs. Lgr5-eGFP-CreERT;R26-LSL-LacZ;TRE-miR31 mice and its control counterpart were pretreated with Dox for 2 weeks, injected with a single dose tamoxifen, and analyzed 2 and 4 days after injection. Scale bar: 100 μm. n = 3 biological replicates. (G) Quantification of the length of LacZ+ cells and LacZ+ units in Panel F. ***p<0.001. (H) qRT-PCR analysis for Hopx in intestines from M2rtTA, TRE-miR31, Vil-Cre and cKO mice. n = 3 biological replicates. **p<0.01; ***p<0.001. (I) Lineage tracing events from Hopx+ ISCs. Hopx-CreERT;mTmG;TRE-miR31 mice and their control counterparts were pretreated with Dox for 2 weeks, injected with a single dose of tamoxifen, and analyzed 15 hr after injection. Hopx-CreERT;R26-LSL-LacZ;TRE-miR31 and their control counterparts were analyzed 4 days after inject with the same treatment. Scale bar: 100 μm. n = 3 biological replicates. (J) Quantification of Cleaved Caspase3+ cells at indicated positions in the intestinal crypts of Vil-Cre and miR-31 cKO mice in Figure 1—figure supplement 7D. n = 3 biological replicates, 50 crypts per sample. (K) Crypts purified from Vil-Cre and miR-31 cKO mice grown in organoid cultures at indicated time points. Quantification of budding organoids and apoptotic organoids, budding number and crypt length. n = 3 biological replicates. ***p<0.001.
-
Figure 2—source data 1
Source data for Figure 2.
- https://doi.org/10.7554/eLife.29538.017
-
Figure 2—source data 2
Source data for Figure 2—figure supplement 1.
- https://doi.org/10.7554/eLife.29538.018
Figure 2—figure supplement 1
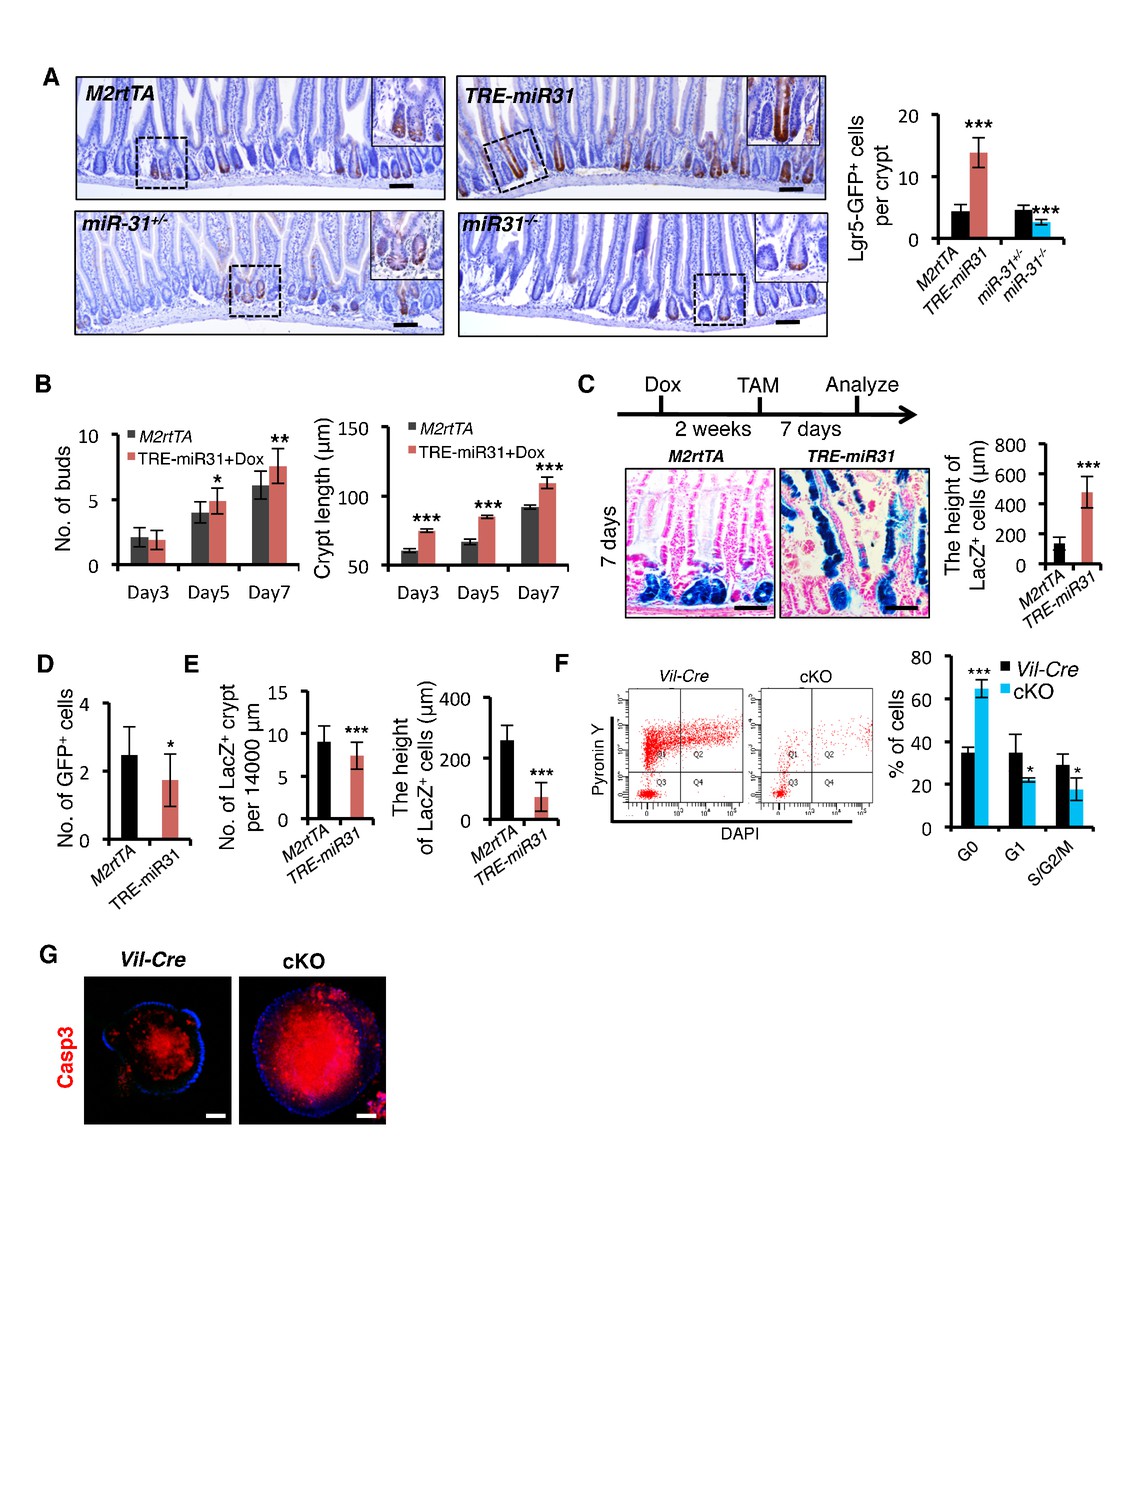
MiR-31 promotes ISC expansion.
(A) Immunohistochemistry for GFP (Lgr5-GFP) in intestines from Lgr5-eGFP-CreERT reporter mice crossed with M2rtTA (control), TRE-miR31, miR-31+/− (control) and miR-31−/− mice. Scale bar: 100 μm. The dashed boxes indicate the high magnification images of insets. Quantification of Lgr5-GFP positive intestinal epithelial cells (Lgr5-GFP+ cells). n = 4 biological replicates. 50 crypts were quantified at each single mouse. ***p<0.001. (B) Quantification of budding number and crypt length in organoids at indicated time points in Figure 2E. n = 5 technical replicates. *p<0.05; **p<0.01; ***p<0.001. (C) X-gal staining showing lineage tracing events from Lgr5+ ISCs and quantification of the length of LacZ+ cells. Lgr5-eGFP-CreERT;R26-LSL-LacZ;TRE-miR31 mice and its control counterpart were pretreated with Dox for 2 weeks, injected with a single dose tamoxifen, and analyzed 7 days after injection. Scale bar: 100 μm. n = 3 biological replicates. ***p<0.001. (D) Quantification on number of GFP+ cells per crypt 15 hrs after Tamoxifen injection in Figure 2I. *p<0.05. (E) Statistical analysis on Hopx lineage tracing 4 days after Tamoxifen injection in Figure 2I. ***p<0.001. (F) Analysis of cell cycle distribution of FACS-purified Lgr5-GFP+ cells using Pyronin Y and DAPI staining from Vil-Cre and miR-31 cKO mice. n = 3 biological replicates. *p<0.05; ***p<0.001. (G) Immunofluorescence for cleaved Caspase 3 (Casp3) in cultured organoids from Vil-Cre and cKO crypts in Figure 2K. Scale bar: 50 μm.
Figure 3 with 1 supplement
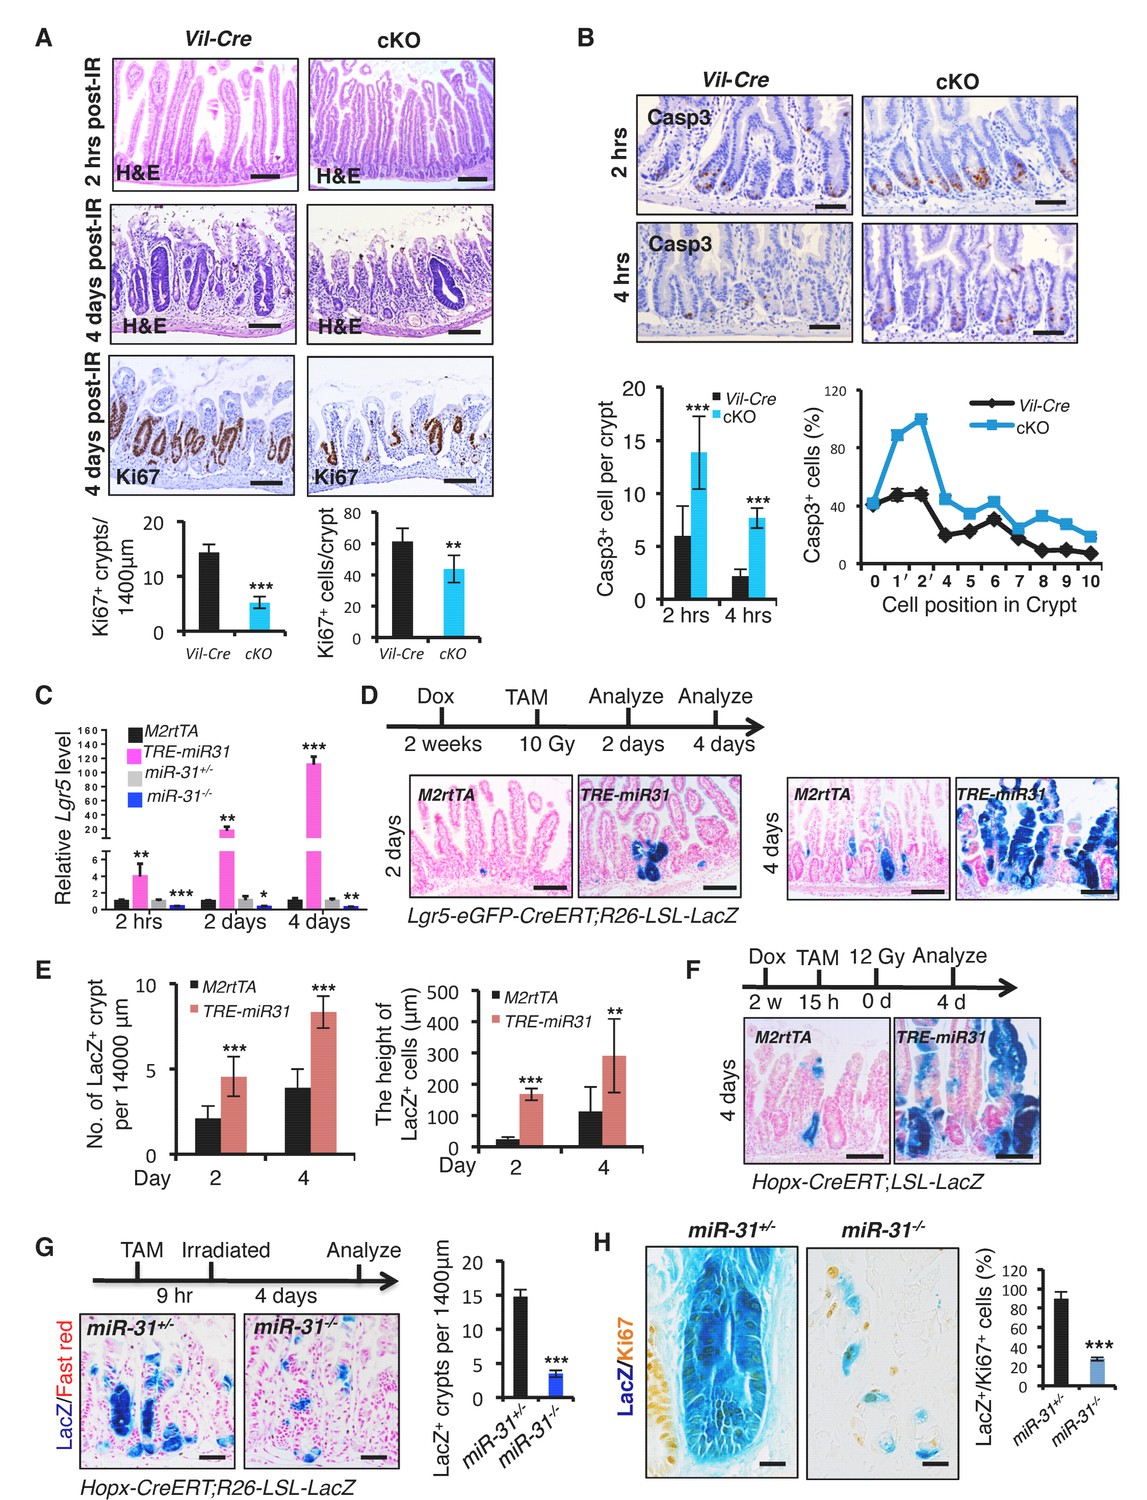
Loss of miR-31 abrogates epithelial regeneration following irradiation.
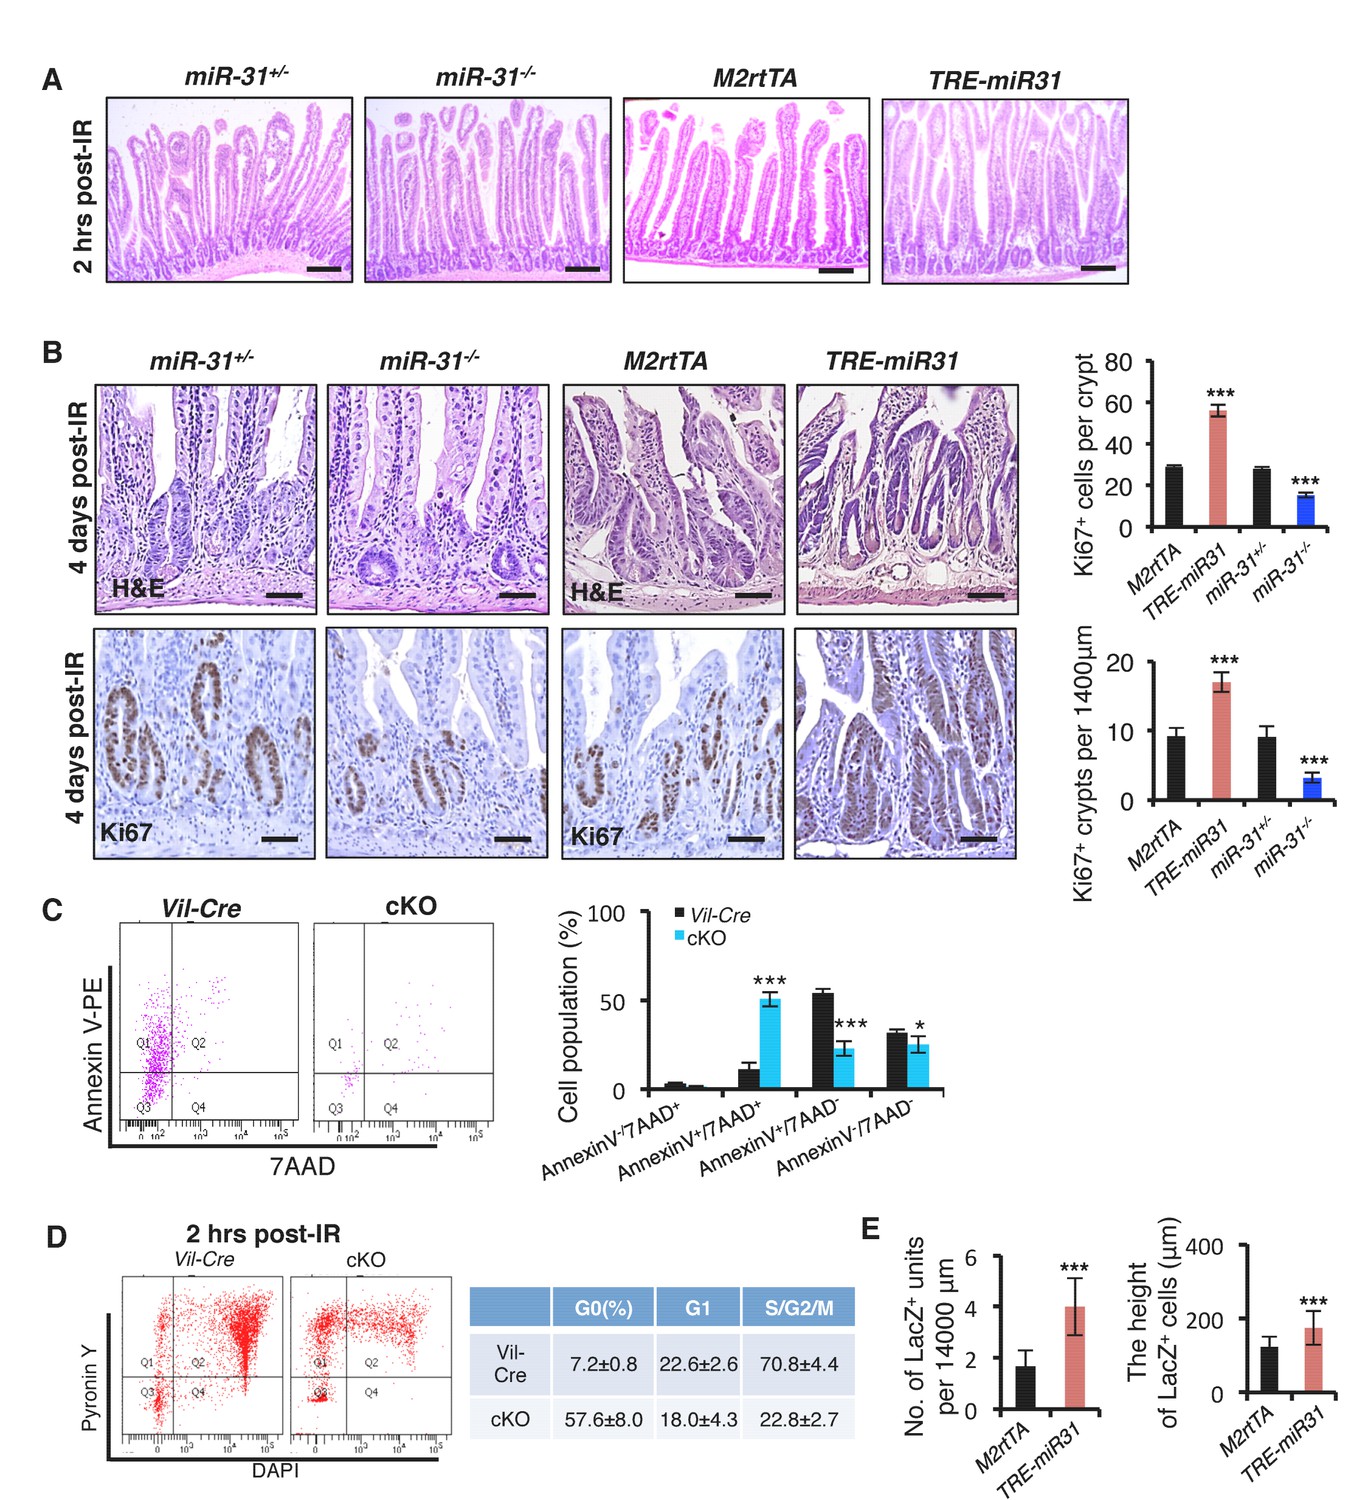
(A) Representative images of H&E and/or Ki67 immunohistochemistry from jejunum of irradiated Vil-Cre and cKO mice 2 hrs and 4 days post 12 Gy γ-IR. Quantification of Ki67+ regenerative foci per 1400 μm and No. of Ki67+ cells per regenerative focus. Top panel: n = 6 biological replicates; Scale bar: 200 μm. Middle and bottom panels: n = 5 biological replicates; Scale bar: 50 μm. **p<0.01; ***p<0.001. (B) Immunohistochemistry for Casp3, quantification of the number of Casp3+ cells in intestinal crypts of Vil-Cre and cKO mice 2 and 4 hrs post 12 Gy γ-IR. Quantification of Casp3+ cells at indicated positions in intestinal crypts of Vil-Cre and cKO mice 2 hrs post γ-IR. Scale bar: 50 μm. n = 3 biological replicates, and 50 crypts were quantified in each single mouse. ***p<0.001. (C) qRT-PCR analysis for Lgr5 in intestines from M2rtTA, TRE-miR31, miR-31+/− and miR-31−/− mice 2 hrs, 2 and 4 days post 12 Gy irradiation. M2rtTA and TRE-miR31 mice were pre-treated with Dox for two weeks. n = 3 biological replicates at each time points. *p<0.05; **p<0.01; ***p<0.001. (D) Schematic of Lgr5-eGFP-CreERT;R26-LSL-LacZ lineage tracing experiment after irradiation. X-gal staining showing lineage tracing events from Lgr5+ ISCs. Lgr5-eGFP-CreERT;R26-LSL-LacZ;TRE-miR31 mice and their control counterparts were pretreated with Dox for 2 weeks, injected with a single dose tamoxifen and then immediately exposed to 10 Gy γ-IR, and analyzed 2 and 4 days after γ-IR. Scale bar: 100 μm. n = 3 biological replicates at each time points. (E) Quantification of LacZ+ units and the length of LacZ+ cells in Panel D. (F) Schematic of Hopx-CreERT;R26-LSL-LacZ lineage tracing experiment. Hopx-CreERT;R26-LSL-LacZ;TRE-miR31 and their control counterparts were pretreated with Dox for 2 weeks, then injected with a single dose of tamoxifen, and then irradiated 15 hrs after injection and analyzed 4 days after irradiation. Representative images of LacZ staining in M2rtTA and TRE-miR31 intestine 4 days post 12 Gy γ-IR. Scale bar: 50 μm. Statistics of LacZ+ regenerative foci were shown in Figure 3—figure supplement 1E. n = 3 biological replicates. (G) Schematic of Hopx-CreERT;R26-LSL-LacZ lineage tracing experiment. Representative images of LacZ staining in miR-31+/− and miR-31−/− intestine 4 days post 12 Gy γ-IR. Scale bar: 50 μm. Statistics of LacZ+ regenerative foci. n = 3 biological replicates. (H) Representative images of LacZ (blue) and Ki67 (yellow) immunostaining in miR-31+/− and miR-31−/− intestinal crypts, and statistics of percentage of LacZ+/Ki67+cells in regenerative foci. Scale bar: 25 μm. n = 3 biological replicates. ***p<0.001.
-
Figure 3—source data 1
Source data for Figure 3.
- https://doi.org/10.7554/eLife.29538.021
-
Figure 3—source data 2
Source data for Figure 3—figure supplement 1.
- https://doi.org/10.7554/eLife.29538.022
Figure 3—figure supplement 1
MiR-31 is required for intestinal epithelial regeneration in response to γ-IR.
(A) Representative images of H&E from jejunum of irradiated M2rtTA, TRE-miR31, miR-31+/− and miR-31−/− mice 2 hrs post 12 Gy irradiation. n = 3 biological replicates. Scale bar: 200 μm. (B) Histology and immunohistochemistry for Ki67 from jejunum of irradiated miR-31+/−, miR-31−/−, M2rtTA and TRE-miR31 mice 4 days post 12 Gy irradiation. Quantification of Ki67+ regenerative foci and No. of Ki67+ cells per regenerative focus. Scale bar: 50 μm. n = 4 biological replicates. ***p<0.001. (C) The FACS profile and quantification of Annexin V−7AAD−, Annexin V-7AAD+, Annexin V+7 AAD−, Annexin V+7AAD+ cells in Lgr5-GFP+ cells from Vil-Cre and cKO mice. n = 3 biological replicates. *p<0.05; ***p<0.001. (D) Flow cytometry analysis of cell cycle distribution of FACS-purified Lgr5-GFP+ cells using PyroninY and DAPI staining from Vil-Cre and miR-31 cKO mice 2 hrs post γ-IR. PyroninYlowDAPIlow: G0; PyroninYhighDAPIlow: G1; PyroninYhighDAPIhigh: S/G2/M. n = 3 biological replicates. (E) Quantification of LacZ+ units and the length of LacZ+ cells in Figure 3F. n = 3 biological replicates.
Figure 4 with 1 supplement
MiR-31 activates Wnt pathway activity.
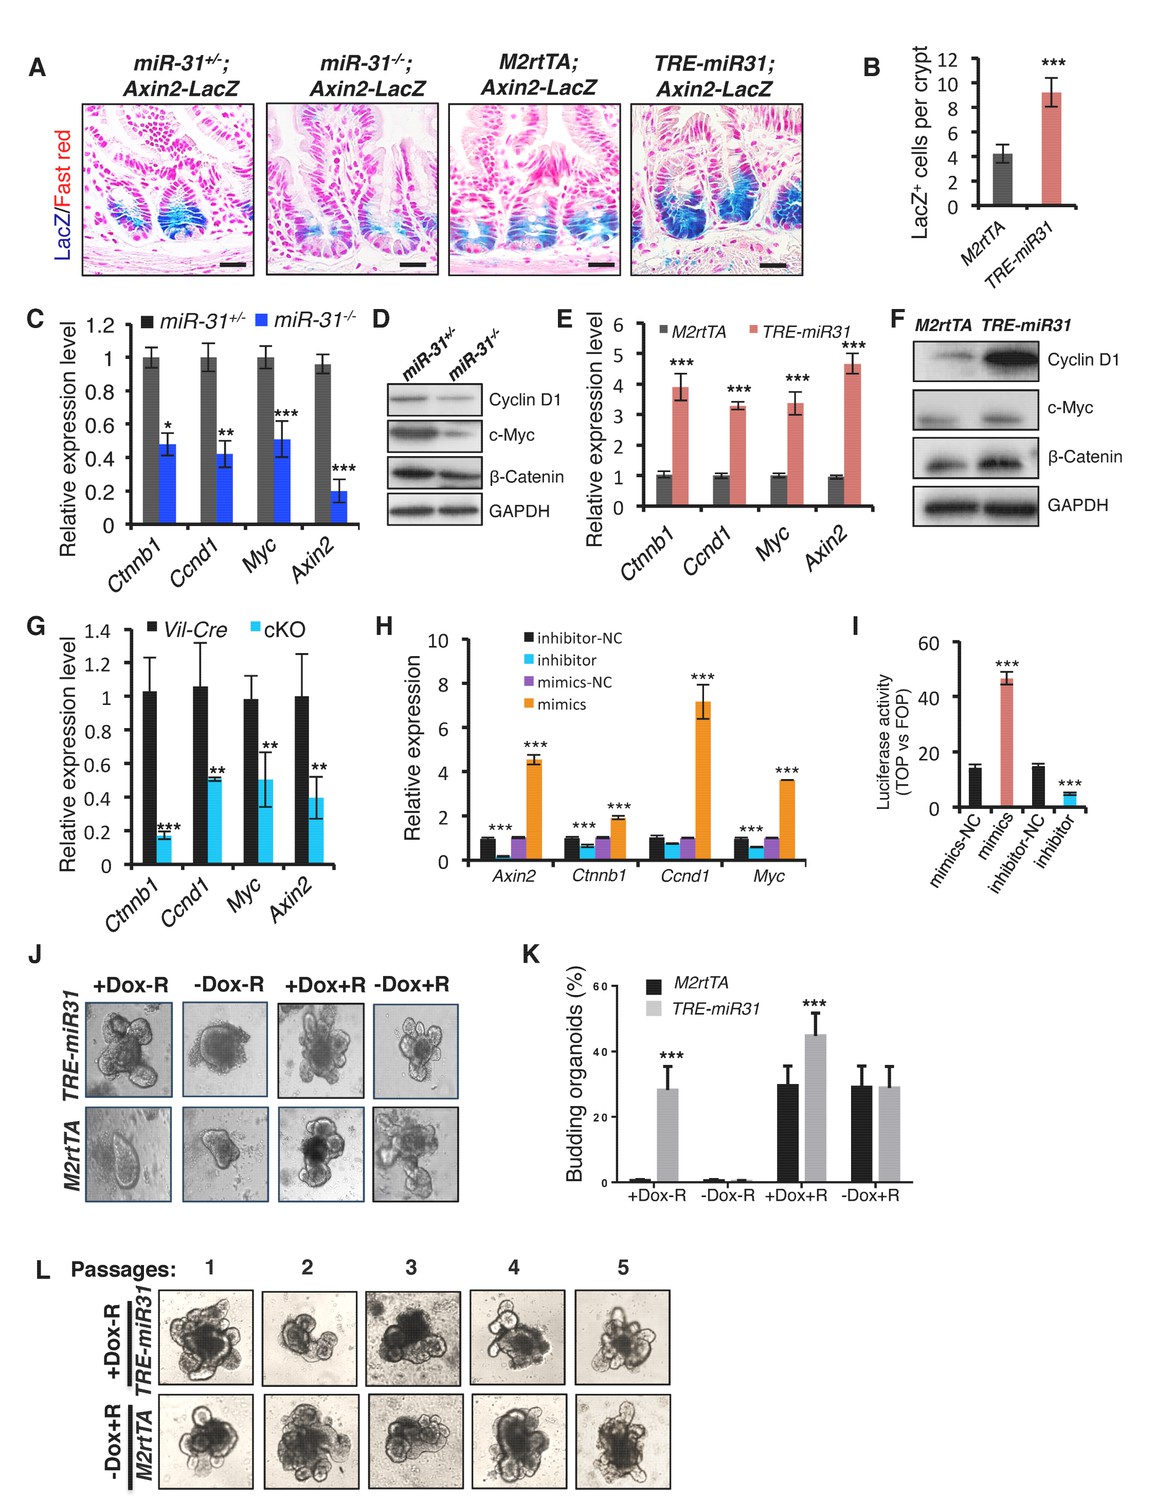
(A) Wnt activity was evaluated by Axin2-LacZ reporter activity in M2rtTA and TRE-miR31 intestine following 2 week Dox induction, and in miR-31+/− and miR-31−/− intestine. Blue, LacZ signals. n = 3 biological replicates. Scale bar: 25 μm. (B) Quantification of LacZ+ cells per crypt in M2rtTA and TRE-miR31 mice. ***p<0.001. (C) qRT-PCR analysis for Ctnnb1 (encoding β-Catenin), Ccnd1 (encoding Cyclin D1), Myc, and Axin2 in miR-31+/− and miR-31−/− intestine. *p<0.05; **p<0.01; ***p<0.001. (D) Western blotting for Cyclin D1, c-Myc and β-Catenin in miR-31+/− and miR-31−/− intestine. GAPDH was used as a loading control. (E) qRT-PCR for Ccnd1, Myc, Axin2 and Ctnnb1 in intestine from M2rtTA and TRE-miR31 mice following 2 weeks of Dox induction. ***p<0.001. (F) Western blotting for Cyclin D1, c-Myc, and β-Catenin in intestine from M2rtTA and TRE-miR31 mice following 2 weeks of Dox induction. (G) qRT-PCR for Ctnnb1, Ccnd1, Myc, and Axin2 in intestine from Vil-Cre and cKO mice. n = 4 biological replicates. **p<0.01; ***p<0.001. (H) qRT-PCR for Axin2, Ccnd1, Myc, and Ctnnb1 in HCT116 colon cancer cells treated with miR-31 inhibitor and negative control (NC, Scramble RNA), as well as miR-31 mimics and negative control (NC, Scramble RNA) for 24 hrs. ***p<0.001. (I) Luciferase activity of TOPflash versus FOPflash in HCT116 cells treated with miR-31 inhibitor and negative control (NC, Scramble RNA), as well as miR-31 mimics and negative control (NC, Scramble RNA) for 24 hrs. n = 3 technical replicates. ***p<0.001. (J) Representative images of organoids cultures from purified M2rtTA and TRE-miR31 crypts at indicated conditions. R; R-Spondin. n = 3 biological replicates. (K) Quantification of budding organoids in Panel J. ***p<0.001. (L) Representative images of organoids cultures from purified M2rtTA and TRE-miR31 crypts at serial passages. M2rtTA organoids were cultured with R-Spondin; TRE-miR31 organoids were cultured with Dox and without R-Spondin. n = 4 biological replicates.
-
Figure 4—source data 1
Source data for Figure 4.
- https://doi.org/10.7554/eLife.29538.025
-
Figure 4—source data 2
Source data for Figure 4—figure supplement 1.
- https://doi.org/10.7554/eLife.29538.026
Figure 4—figure supplement 1
MiR-31 activates Wnt signaling pathway.
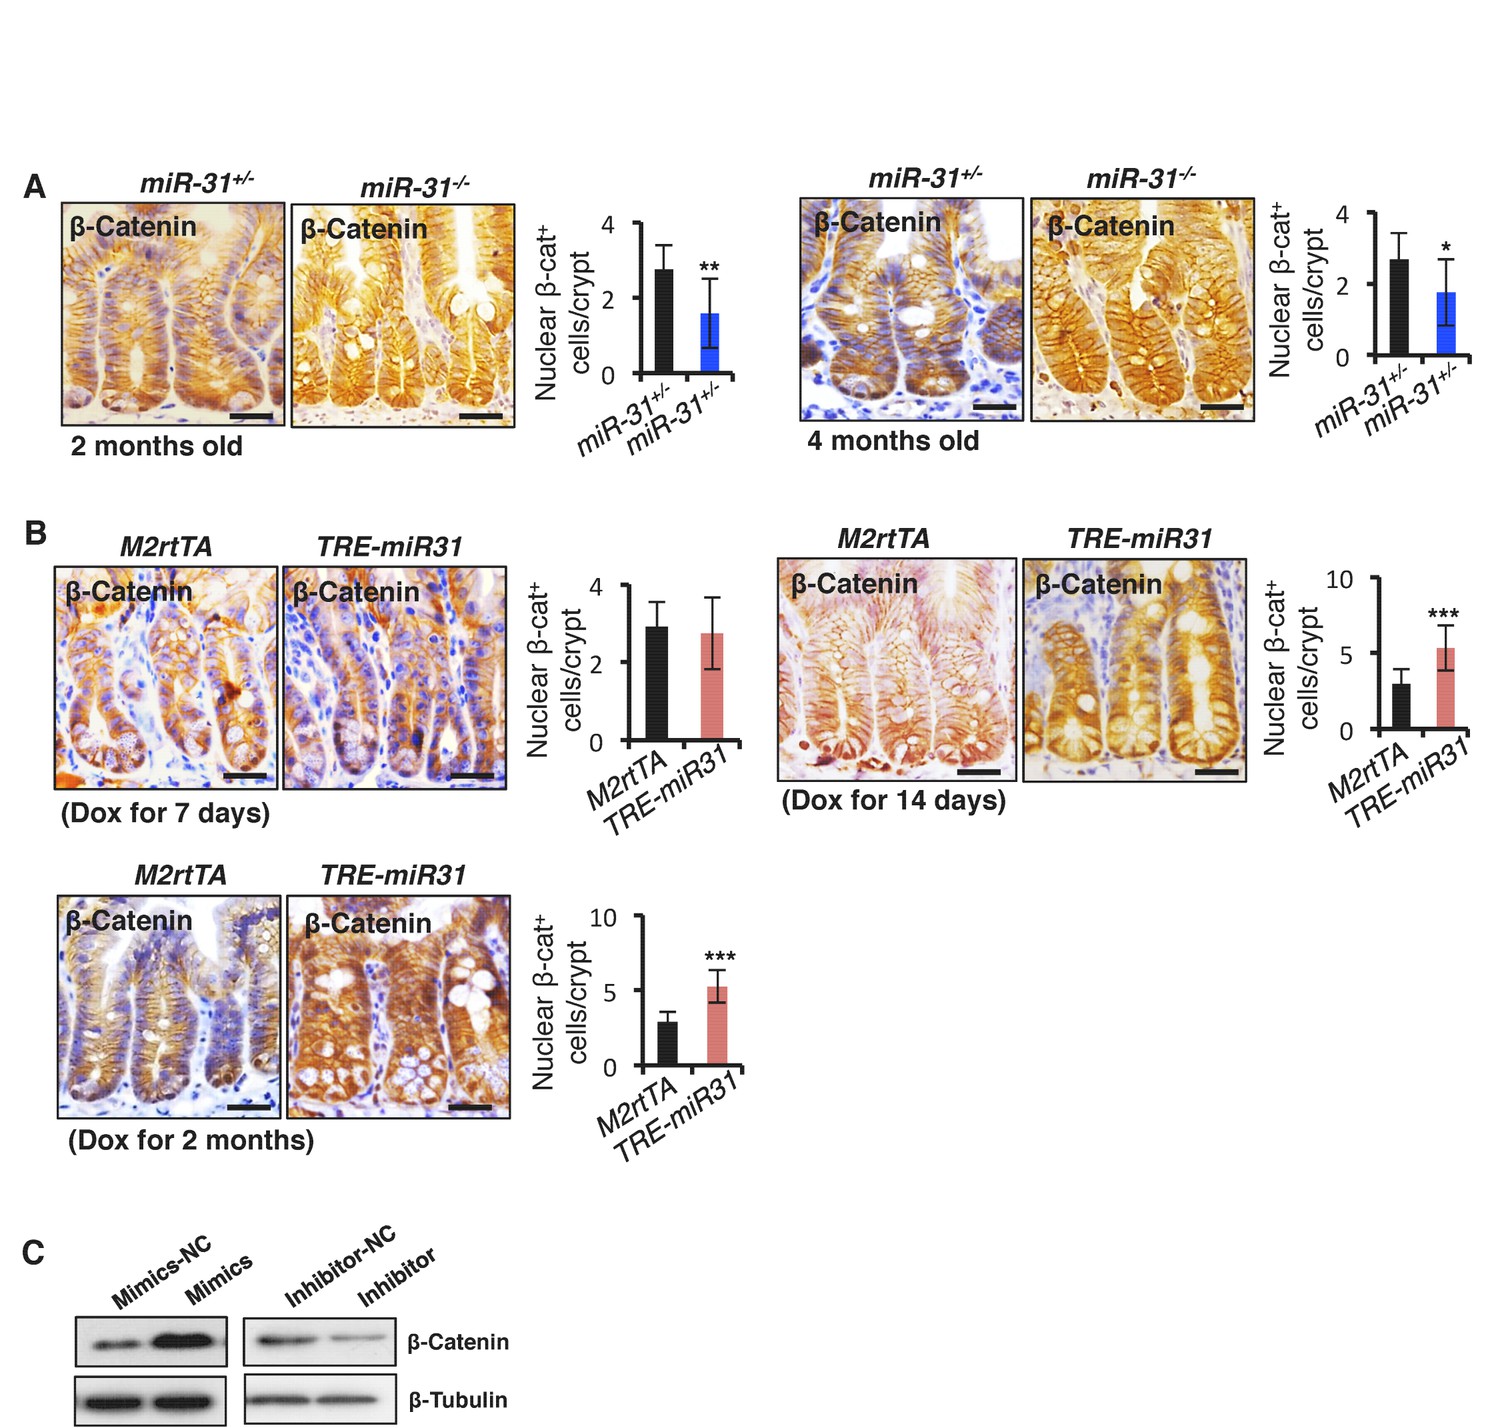
(A) Immunohistochemistry for β-Catenin in jejunum from miR-31+/− and miR-31−/− mice at 2 and 4 months of ages. Quantification of nuclear β-Catenin positive cells in miR-31+/− and miR-31−/− crypts. Scale bar: 25 μm. *p<0.05; **p<0.01. (B) Immunohistochemistry for β-Catenin in jejunum from M2rtTA and TRE-miR31 mice following 7 days, 14 days and 2 months of Dox induction. Quantification of nuclear β-Catenin positive cells in M2rtTA and TRE-miR31 crypts. Scale bar: 25 μm. ***p<0.001. (C) Western blotting for β-Catenin in HCT116 cells under treatment of control (mimics-NC) and miR-31 mimics, or control (inhibitor-NC) and anti-miR31. β-Tubulin was used as a loading control.
Figure 5 with 1 supplement
MiR-31 represses BMP/TGFβ signaling pathways.
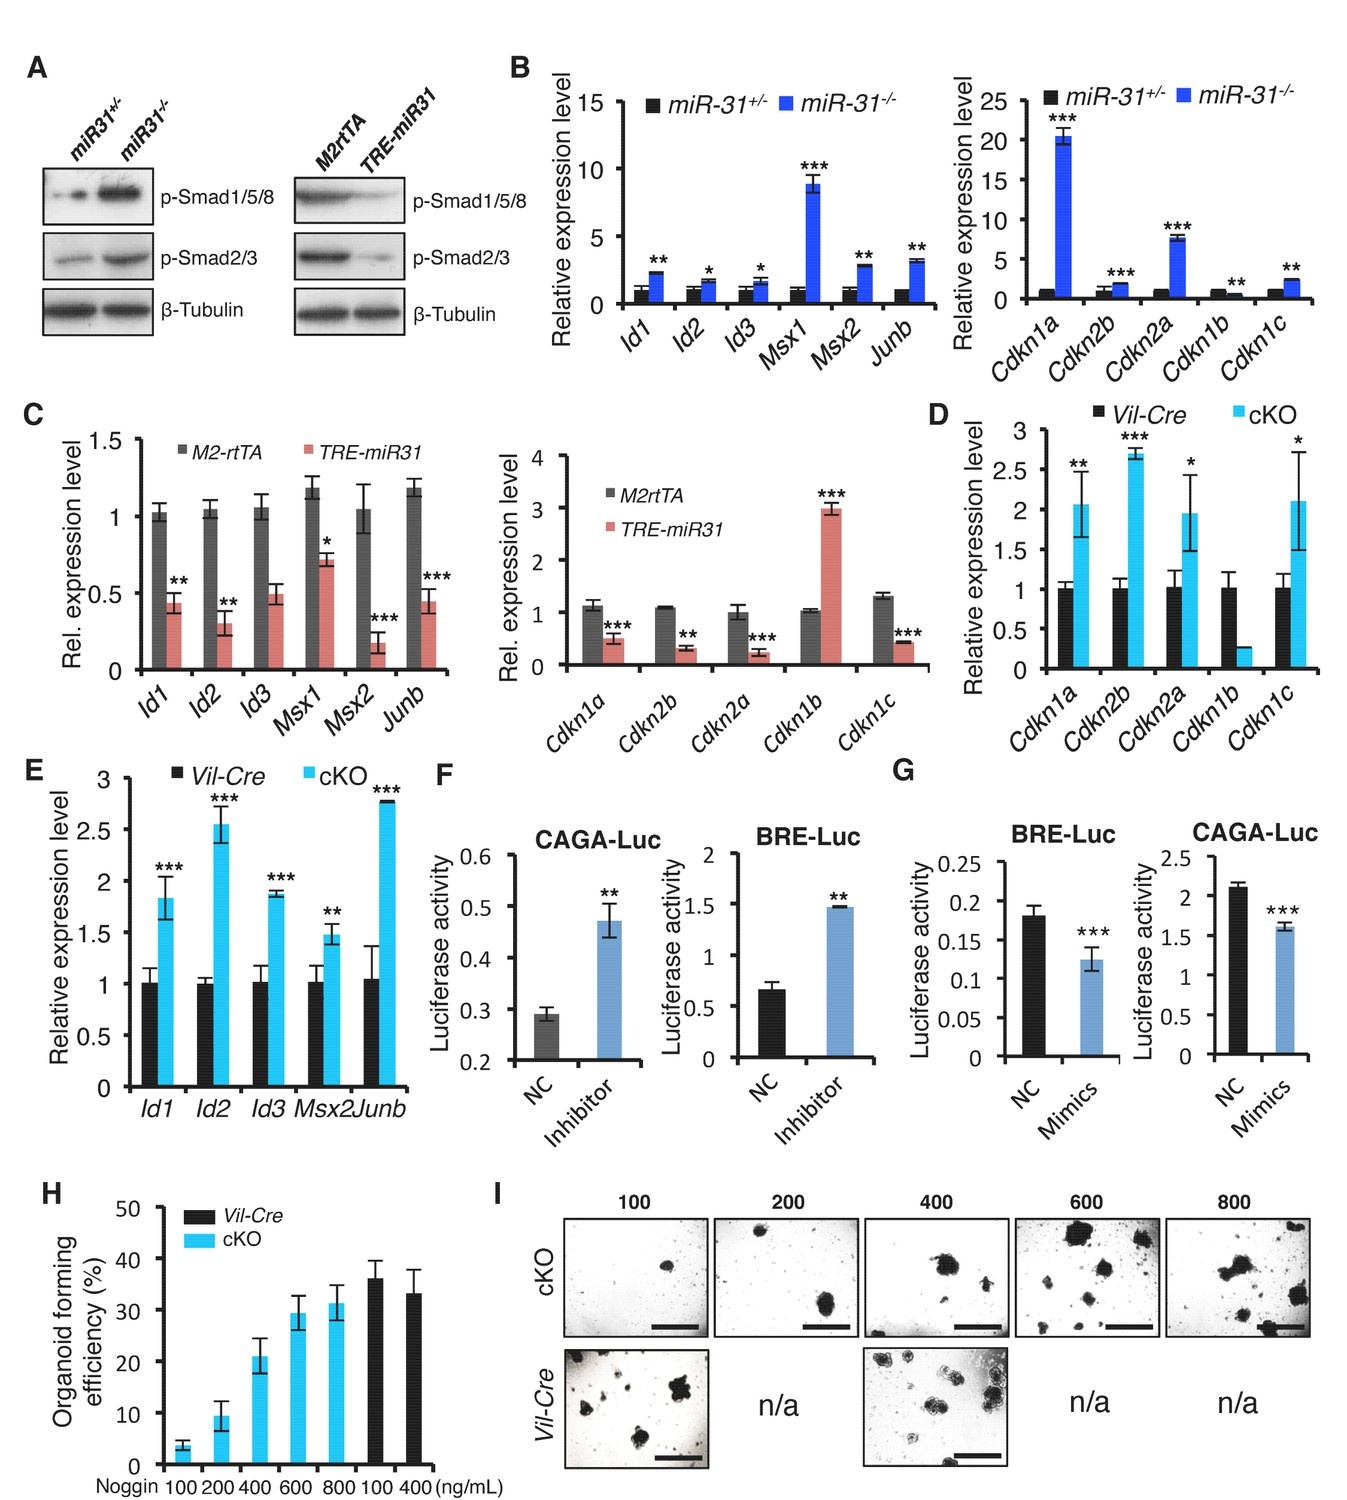
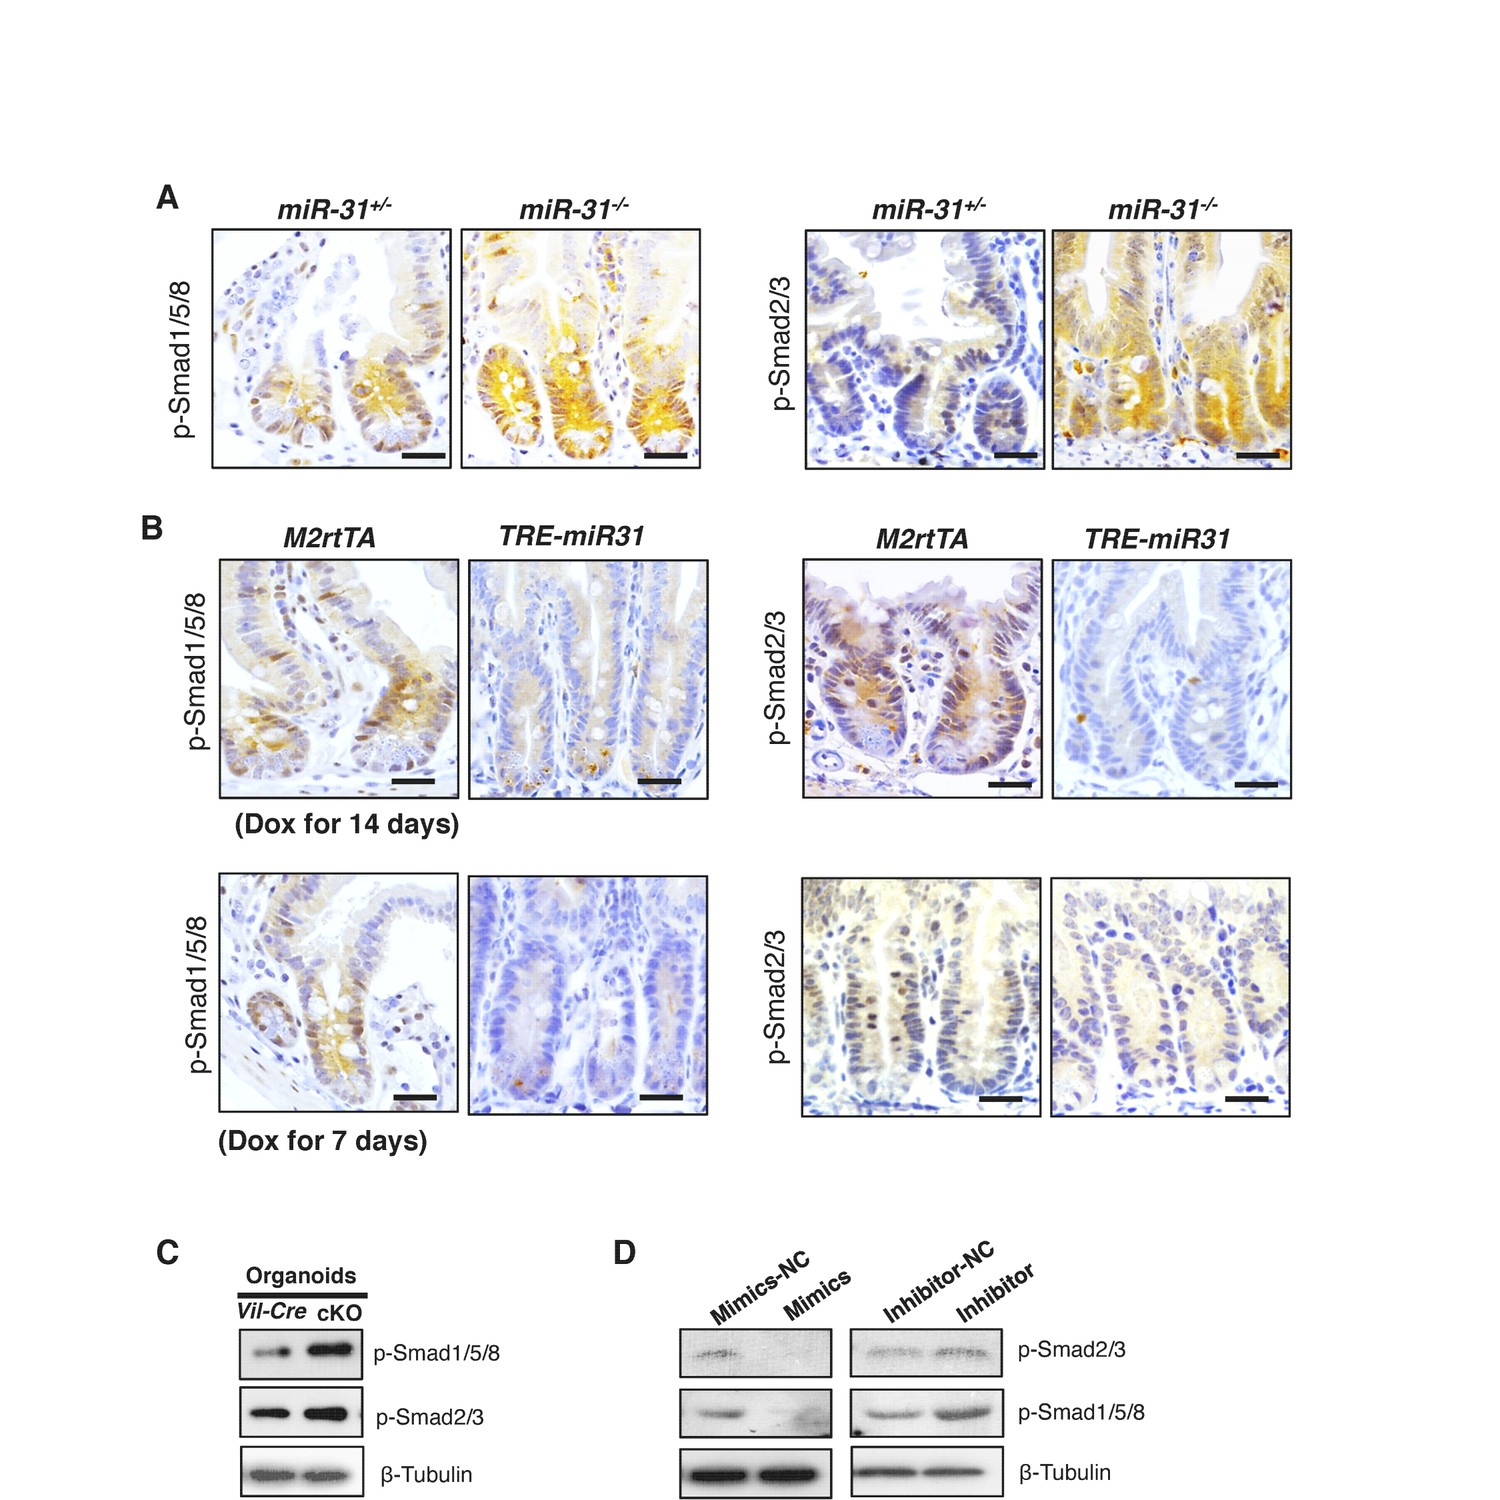
(A) Western blotting for p-Smad1/5/8 and p-Smad2/3 in miR-31+/−, miR-31−/−, M2rtTA and TRE-miR31 intestine. Both M2rtTA and TRE-miR31 mice were treated with DOX for 2 weeks. β-Tubulin was used as a loading control. (B) qRT-PCR analysis for BMP downstream genes, Id1, Id2, Id3, Msx-1, Msx-2 and Junb, and TGFβ downstream genes, Cdkn1c (p57), Cdkn1a (p21), Cdkn2a (p16), Cdkn2b (p15) and Cdkn1b (p27) in miR-31+/− and miR-31−/− intestine. *p<0.05; **p<0.01; ***p<0.001. (C) qRT-PCR analysis for BMP downstream genes, Id1, Id2, Id3, Msx-1, Msx-2 and Junb, and TGFβ downstream genes, Cdkn1c, Cdkn1a, Cdkn2a, Cdkn2b and Cdkn1b in M2rtTA and TRE-miR31 intestine following 2 weeks of Dox induction. **p<0.01; ***p<0.001. (D) qRT-PCR analysis for TGFβ downstream genes, Cdkn1c, Cdkn1a, Cdkn2a, Cdkn2b and Cdkn1b in intestine from Vil-Cre and cKO mice. *p<0.05; **p<0.01; ***p<0.001. (E) qRT-PCR analysis for BMP downstream genes, Id1, Id2, Id3, Msx2 and Junb in Vil-Cre and cKO intestine. **p<0.01; ***p<0.001. (F and G) HEK293T cells were transfected with CAGA- or BRE- luciferase reporter vector, combined with scramble RNA (negative control, NC) or anti-miR-31 (miR-31 inhibitors) (F), or scramble RNA (negative control, NC) and miR-31 mimics (G) for 24 hrs and then harvested for luciferase activity determination. n = 3 technical replicates. **p<0.01; ***p<0.001. (H) Quantification of organoid forming efficiency (budding organoids per 100 crypts) after Vil-Cre or cKO crypts cultured with noggin at indicated concentrations for 4 days. n = 3 technical replicates. (I) Representative images of organoids from Vil-Cre and cKO crypts cultured with noggin at indicated concentrations (100, 200, 400, 600 and 800 ng/mL) for 4 Days in Panel H.
-
Figure 5—source data 1
Source data for Figure 5.
- https://doi.org/10.7554/eLife.29538.029
Figure 5—figure supplement 1
MiR-31 represses BMP and TGFβ signaling pathways.
(A) Immunohistochemistry for p-Smad1/5/8 and p-Smad2/3 in jejunum from miR-31+/− and miR-31−/− mice at 2 months of age. Scale bar: 25 μm. (B) Immunohistochemistry for p-Smad1/5/8 and p-Smad2/3 in jejunum from M2rtTA and TRE-miR31 mice following 7 days and 14 days of Dox induction. Scale bar: 25 μm. (C) Western blotting for p-Smad1/5/8 and p-Smad2/3 in cultured organoids from Vil-Cre and miR-31 cKO crypts. n = 4 biological replicates. β-Tubulin was used as a loading control. (D) Western blotting for p-Smad2/3 and p-Smad1/5/8 in HCT116 cells under treatment of control (mimics-NC) and miR-31 mimics, or control (inhibitor-NC) and anti-miR31. β-Tubulin was used as a loading control, which is identical to Figure 4—figure supplement 1C.
Figure 6 with 3 supplements
Identification of miR-31 target genes in intestinal epithelium.
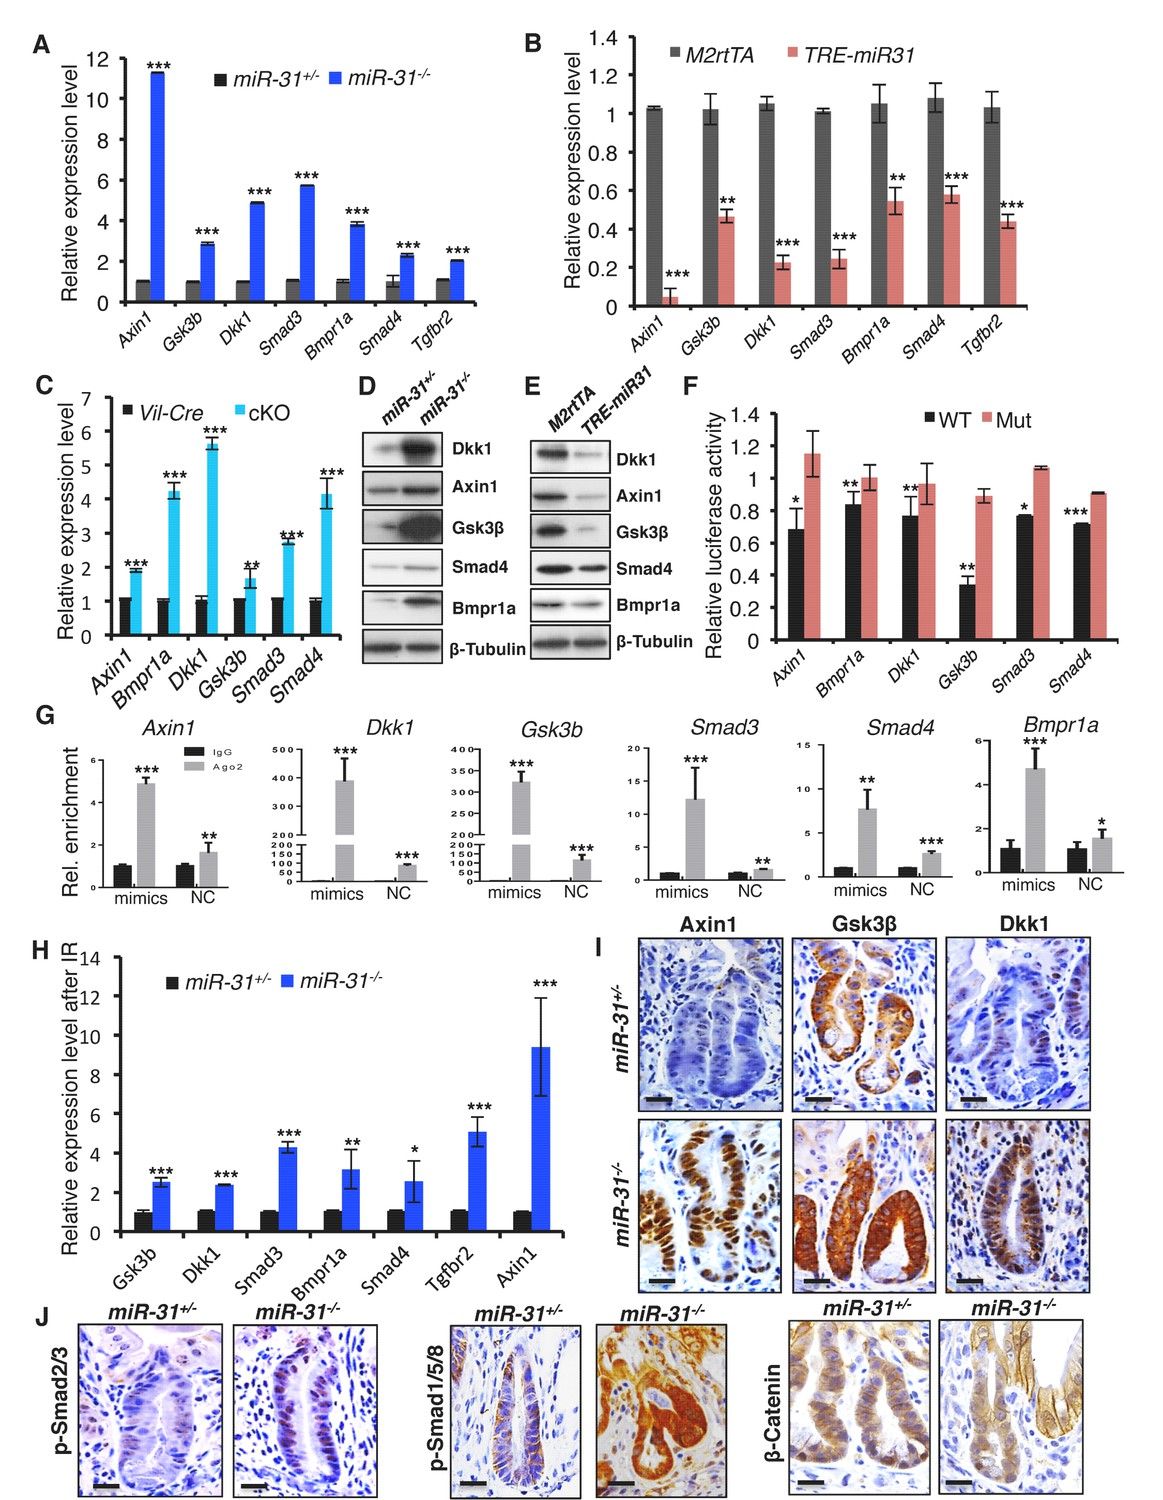
(A, B) qRT-PCR analysis for Axin1, Gsk3b, Dkk1, Smad3, Bmpr1a, Smad4 and Tgfbr2 in miR-31+/− and miR-31−/− intestine (A), as well as M2rtTA and TRE-miR31 intestine following 2 weeks of Dox induction (B). **p<0.01; ***p<0.001. (C) qRT-PCR analysis for Axin1, Bmpr1a, Dkk1, Gsk3b, Smad3, and Smad4 in Vil-Cre and cKO intestine. **p<0.01; ***p<0.001. (D) Western blotting for Axin1, Gsk3β, Dkk1, Smad4, and Bmpr1a in miR-31+/− and miR-31−/− intestine. β-Tubulin was used as a loading control, which is identical with Figure 5A. n = 3 biological replicates. (E) Western blotting for Axin1, Gsk3β, Dkk1, Bmpr1a and Smad4 in M2rtTA and TRE-miR31 intestine following 2 weeks of Dox induction. β-Tubulin was used as a loading control. n = 3 biological replicates. (F) Ratio of luciferase activity of miR-31 mimics versus scramble RNA in wild type and mutant 3’UTR constructs based on 3 independent experiments. *p<0.05; **p<0.01; ***p<0.001. (G) RNA crosslinking, immunoprecipitation, and qRT-PCR (CLIP-PCR) assay for Dkk1, Axin1, Gsk3b, Smad3, Smad4 and Bmpr1a upon Ago2 antibody immunoprecipitates in response to miR-31 mimics and scramble RNA (NC). IgG was used as a negative control. (H) qRT-PCR analysis for Axin1, Gsk3b, Dkk1, Smad3, Bmpr1a, Smad4 andTgfbr2 in miR-31+/− and miR-31−/− intestine 4 days post 12 Gy γ-IR. n = 3 biological replicates. *p<0.05; **p<0.01; ***p<0.001. (I) Immunohistochemistry for Axin1, Gsk3β and Dkk1 in miR-31+/− and miR-31−/− intestinal crypts 4 days post 12 Gy γ-IR. Scale bar: 25 μm. (J) Immunohistochemistry for p-Smad2/3, p-Smad1/5/8 and β-Catenin in miR-31+/− and miR-31−/− intestinal crypts 4 days post 12 Gy γ-IR. Scale bar: 25 μm.
-
Figure 6—source data 1
Source data for Figure 6.
- https://doi.org/10.7554/eLife.29538.034
Figure 6—figure supplement 1
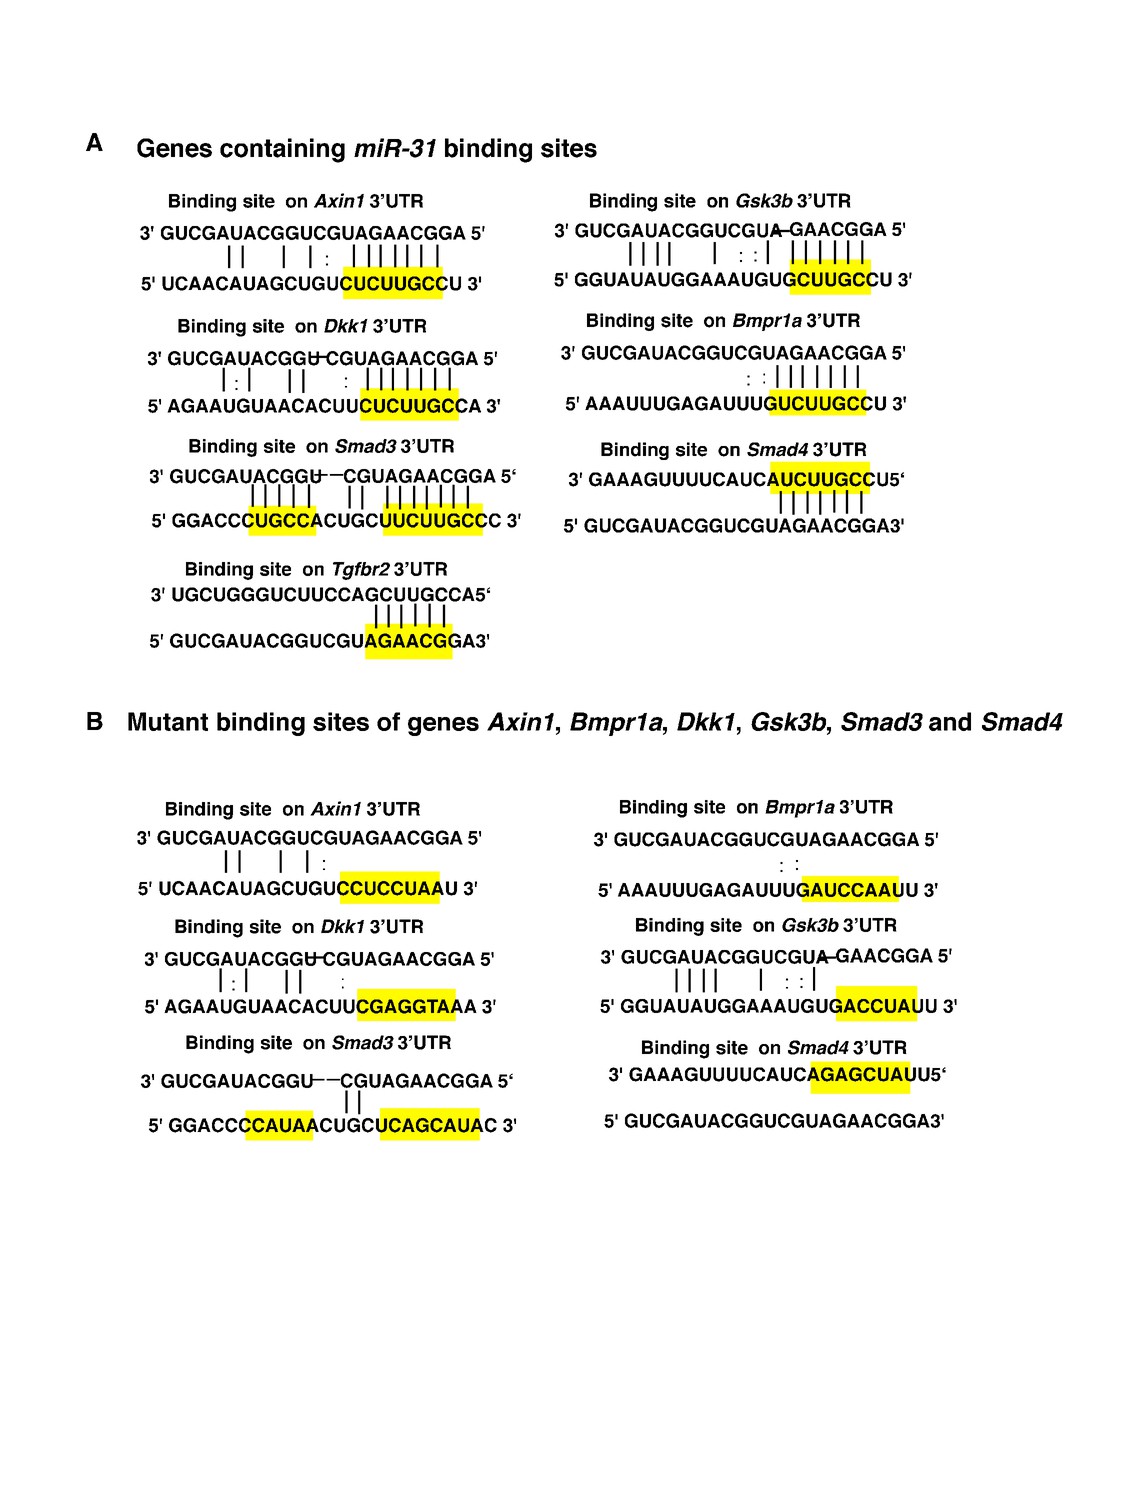
Identification of miR-31 target genes.
(A) MiR-31 binding sites in 3’UTR of these putative target genes. (B) Mutant binding sites of genes, Axin1, Bmpr1a, Dkk1, Gsk3b, Smad3 and Smad4.
Figure 6—figure supplement 2
Identification of miR-31 target genes.
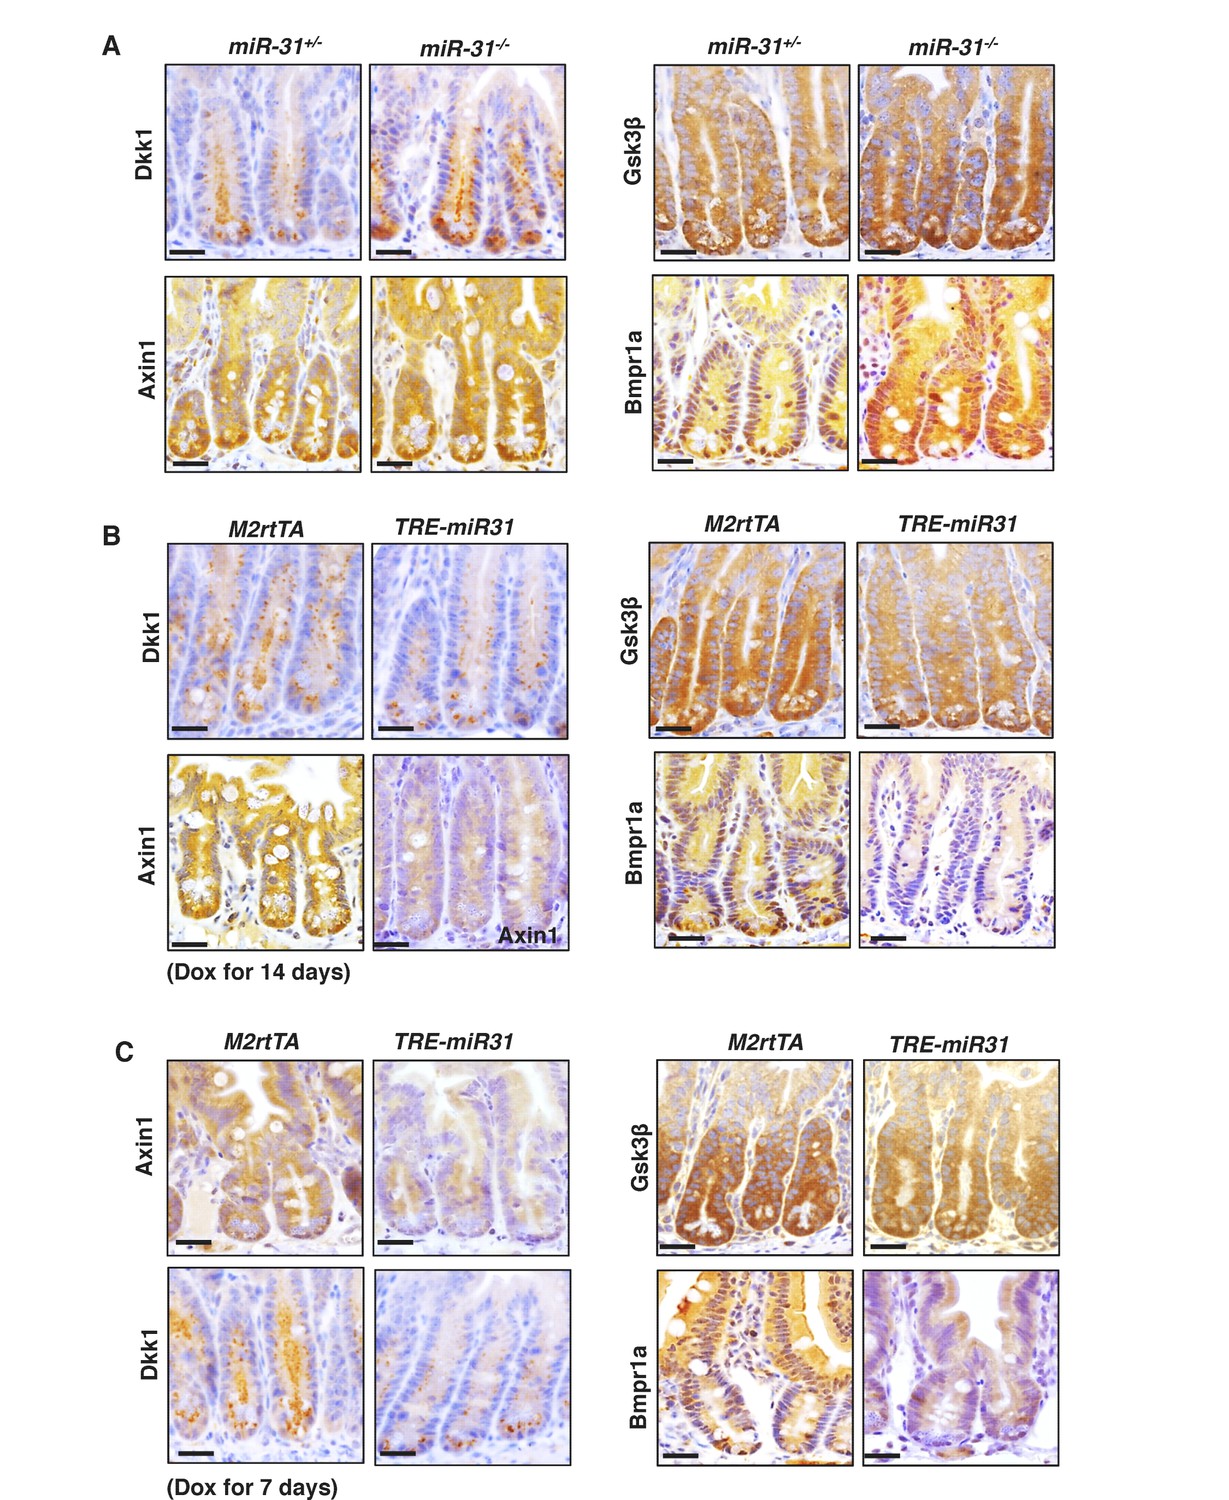
(A) Immunohistochemistry for Dkk1, Gsk3β, Axin1 and Bmpr1a in jejunum from miR-31+/− and miR-31−/− mice at 2 months of age. Scale bar: 25 μm. (B) Immunohistochemistry for Dkk1, Gsk3β, Axin1 and Bmpr1a in jejunum from M2rtTA and TRE-miR31 mice following 7 days and 14 days of Dox induction. Scale bar: 25 μm.
Figure 6—figure supplement 3

Identification of miR-31 target genes.
(A) Western blotting for Gsk3β, Dkk1, Axin1, Smad4 and Bmpr1a in cultured organoids from Vil-Cre and miR-31 cKO crypts. n = 4 technical replicates. β-Tubulin was used as a loading control. (B) Western blotting for Dkk1, Axin1, Gsk3β, Smad4 and Bmpr1a in HCT116 cells under treatment of control (mimics-NC) and miR-31 mimics, or control (inhibitor-NC) and anti-miR-31. β-Tubulin was used as a loading control, which is identical to Figure 4—figure supplement 1C and Figure 5—figure supplement 1D.
Figure 7 with 1 supplement
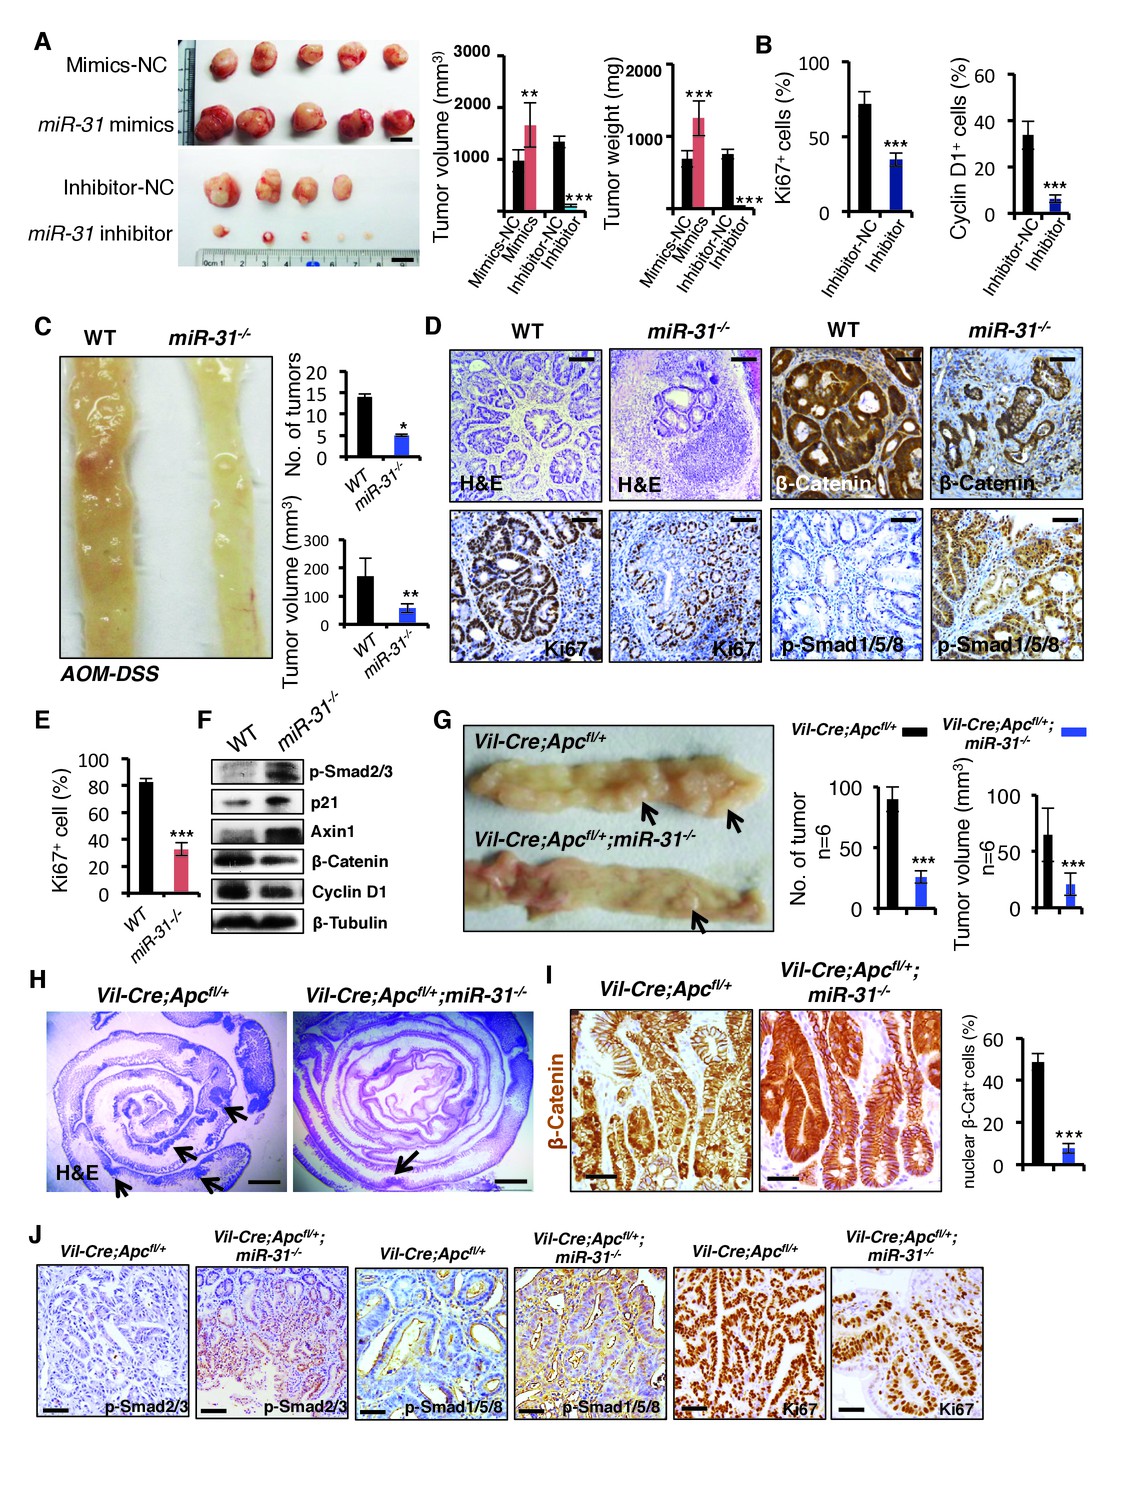
MiR-31 promotes tumor growth in vivo.
(A) Gross appearance of tumors of HCT116 colorectal cancer cell xenograft 30 days post transplantation. HCT116 colorectal cancer cells were transfected with mimics-NC or miR-31 mimics, and inhibitor-NC or anti-miR-31 (inhibitor) for 36 hrs before xenograft. NC-mimics, n = 5; miR-31 mimics, n = 5; NC-inhibitor, n = 4; anti-miR-31, n = 5. Quantification of tumor volume and tumor weight at indicated conditions. **p<0.01; ***p<0.001. Scale bar: 1 cm. (B) Quantification of Ki67+ and Cyclin D1+ cells in NC-inhibitor and miR-31 inhibitor treated tumors in Figure 7—figure supplement 1B. ***p<0.001. (C) Representative photograph of distal colon resected from WT and miR-31−/− mice at the end of AOM-DSS protocol. Frequency and tumor size of inflammation-driven colorectal adenomas in mice treated with the AOM-DSS protocol, with or without miR-31 deletion. n = 6 mice per group, *p<0.05; **p<0.01. (D) H&E, and immunohistochemistry for Ki67, β-Catenin and p-Smad1/5/8 in adenomas of WT and miR-31−/− mice resulting from AOM-DSS treatment. Scale bar: 100 μm. (E) Quantification of Ki67+ cells in Panel D. ***p<0.001. (F) Western blotting for p-Smad2/3, p21, Axin1, β-Catenin, Cyclin D1 in adenomas of WT and miR-31−/− mice resulting from AOM-DSS treatment. β-Tubulin was used as a loading control. (G) Representative photograph of intestine resected from Vil-Cre;Apcfl/+ and Vil-Cre;Apcfl/+;miR-31−/− mice at 6 months of age. Arrows point to tumors. Quantification of tumor number and tumor volume in intestines from these mice. n = 6 biological replicates. ***p<0.001. (H) Representative histology of intestine resected from Vil-Cre;Apcfl/+ and Vil-Cre;Apcfl/+;miR-31−/− mice at 6 months of age. Arrows point to tumors. Scale bar: 2.5 mm. (I) Immunohistochemistry for β-Catenin and quantification of nuclear β-Catenin positive cells in Vil-Cre;Apcfl/+ and Vil-Cre;Apcfl/+;miR-31−/− tumors. (Black, Vil-Cre;Apcfl/+; Blue, Vil-Cre;Apcfl/+;miR-31−/−). n = 6 biological replicates. Scale bar: 50 μm. ***p<0.001. (J) Immunohistochemistry for p-Smad2/3, p-Smad1/5/8 and Ki67 in Vil-Cre;Apcfl/+ and Vil-Cre;Apcfl/+;miR-31−/− tumors. Scale bar: 50 μm.
-
Figure 7—source data 1
Source data for Figure 7.
- https://doi.org/10.7554/eLife.29538.037
-
Figure 7—source data 2
Source data for Figure 7—figure supplement 1.
- https://doi.org/10.7554/eLife.29538.038
Figure 7—figure supplement 1
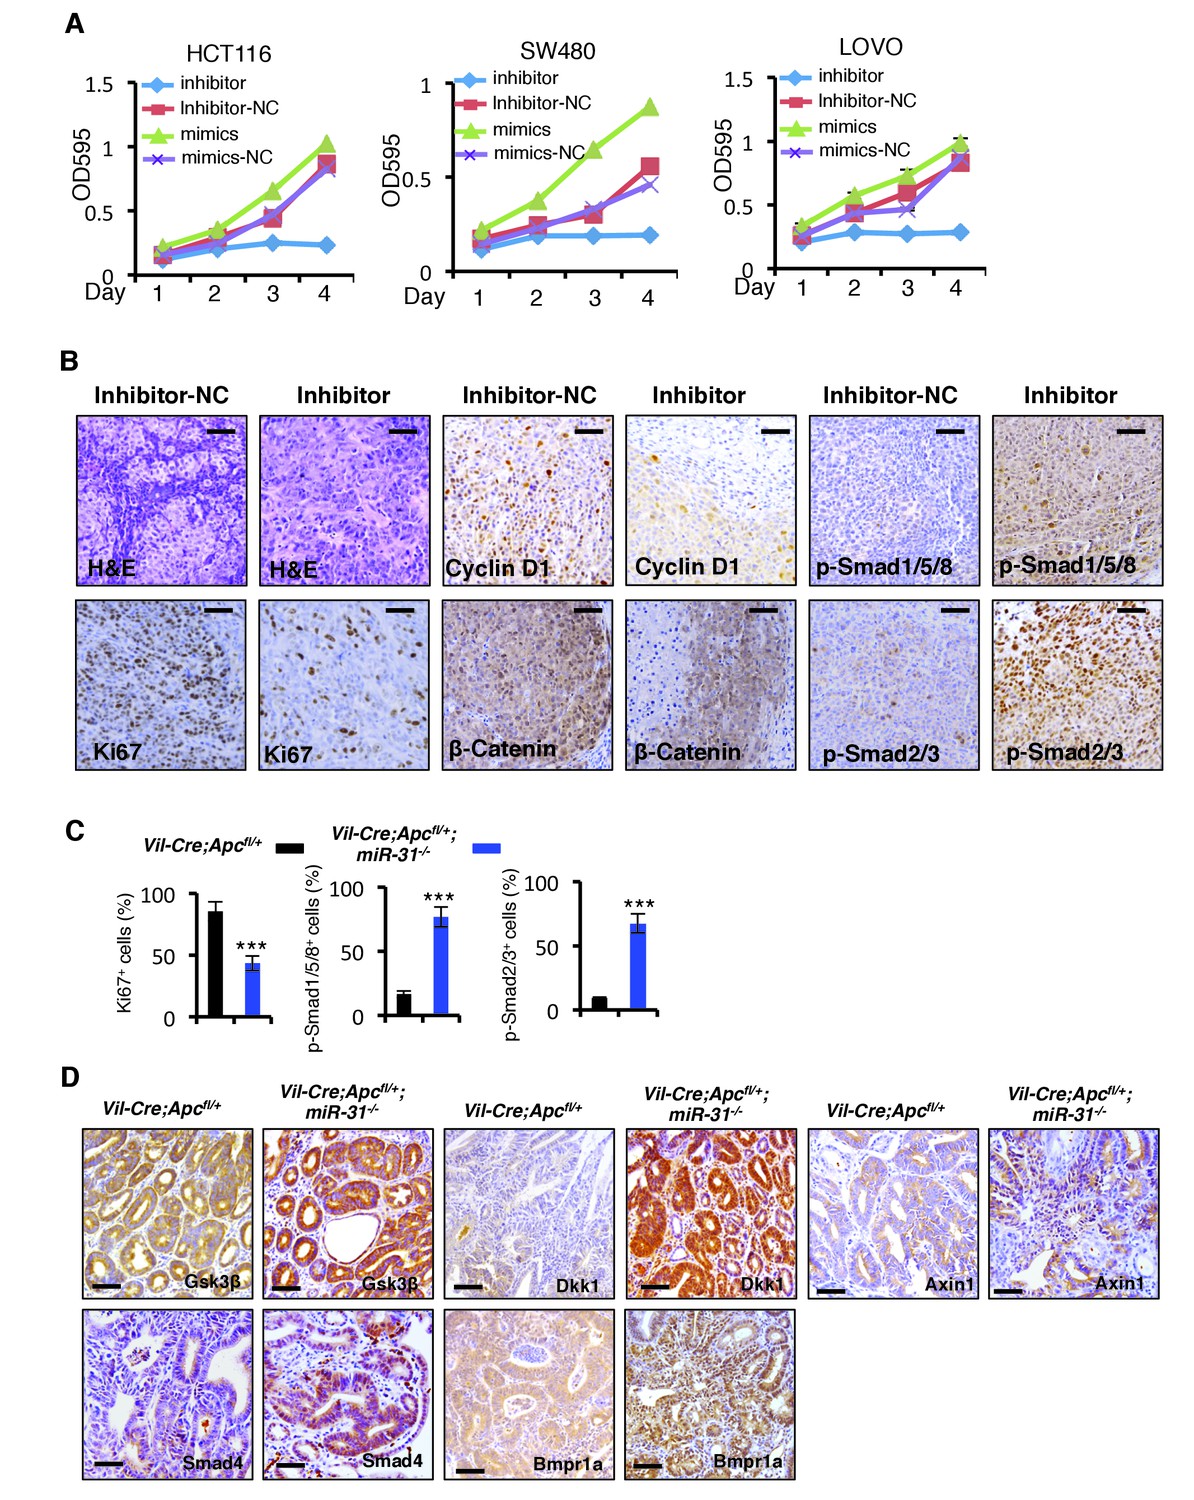
MiR-31 promotes tumor growth.
(A) In vitro MTT proliferation assay of human colorectal cancer cell lines, HCT116, SW480 and LOVO upon transfection of miR-31 inhibitor (anti-miR-31), and inhibitor-NC, as well as miR-31 mimics and mimics-NC. n = 3 technical replicates. (B) H&E, and immunohistochemistry for Ki67, Cyclin D1, β-Catenin, p-Smad1/5/8 and p-Smad2/3 in inhibitor-NC and miR-31 inhibitor treated tumors in Figure 7A. n = 3 biological replicates. Scale bar: 50 μm. (C) Quantification of p-Smad2/3+, p-Smad1/5/8+ and Ki67+ cells in Vil-Cre;Apcfl/+ and Vil-Cre;Apcfl/+;miR-31−/− tumors shown in Figure 7J. n = 3 biological replicates. ***p<0.001. (D) Immunohistochemistry for Dkk1, Axin1, Gsk3β, Smad4 and Bmpr1a in Vil-Cre;Apcfl/+ and Vil-Cre;Apcfl/+;miR-31−/− tumors. n = 4 biological replicates. Scale bar: 50 μm.
Figure 8
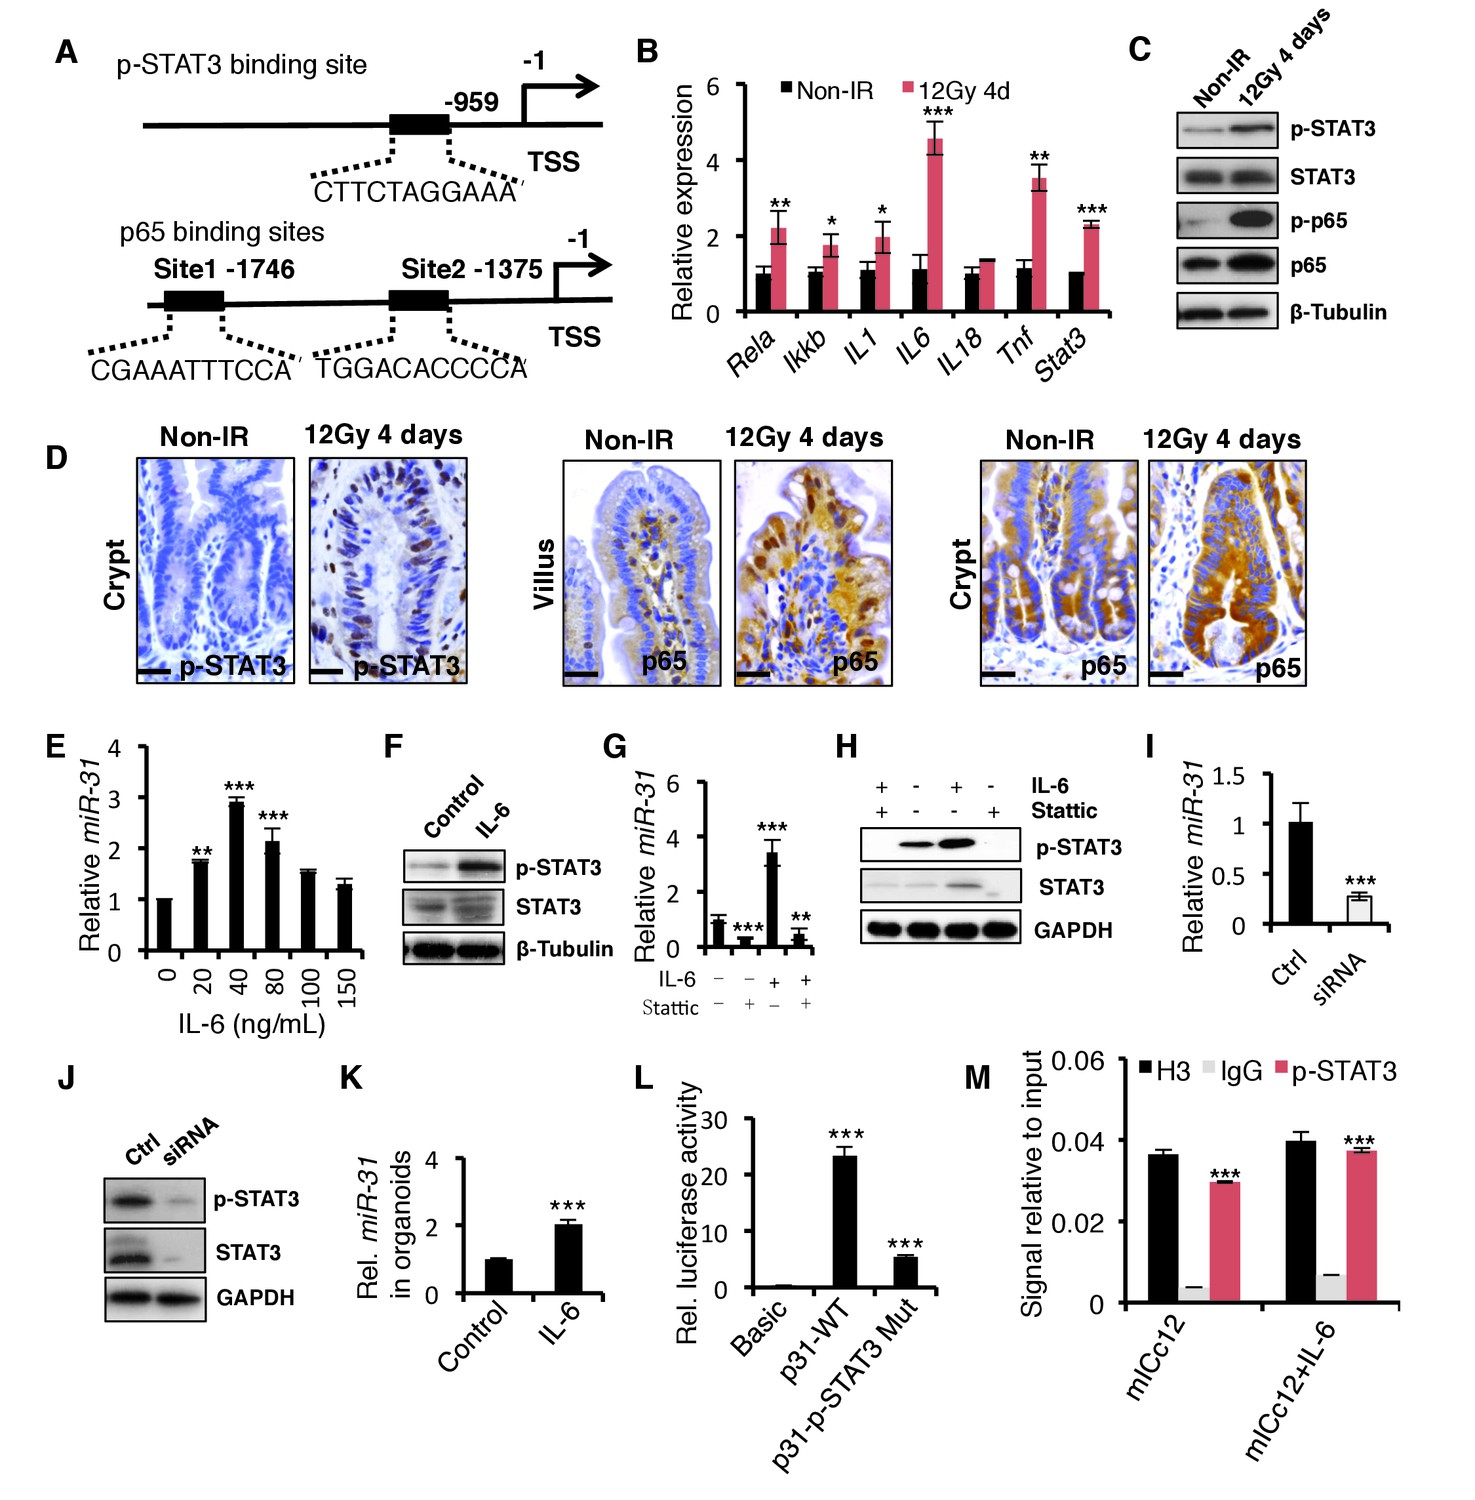
The STAT3 pathway mediates the induction of miR-31 caused by γ-IR.
(A) The schematic diagram showed two potential p65 binding sites and one p-STAT3 binding site in the miR-31 promoter. (B) qRT-PCR analysis for Rela, Ikk-b, IL-1, IL-6, IL-18, Tnf and Stat3 in the intestinal epithelium 4 days after exposure to 12 Gy γ-IR, relative to non-irradiated controls. n = 3 biological replicates. *p<0.05, **p<0.01, ***p<0.001. (C) Western blotting for STAT3, p-STAT3, p65 and p-p65 in the intestinal epithelium 4 days after exposure to 12 Gy γ-IR, relative to non-irradiated controls. n = 3 biological replicates. (D) Immunohistochemistry for p-STAT3 and p65 in control and the intestinal epithelium 4 days after exposure to 12 Gy γ-IR. n = 3 biological replicates. Scale bar: 25 μm. (E) qRT-PCR for miR-31 in mouse intestinal epithelial cell line (mICc12) in response to IL-6 with concentrations of 20, 40, 80, 100 and 150 ng/mL. n = 3 technical replicates. **p<0.01; ***p<0.001. (F) Western blotting for STAT3 and p-STAT3 in mICc12 cells in response to 40 ng/mL IL-6. (G) qRT-PCR analysis for miR-31 in mICc12 cells treated with IL-6 and STAT3 inhibitor, Stattic. **p<0.01; ***p<0.001. (H) Western blotting for p-STAT3 in mICc12 cells treated with IL-6 and Stattic. (I) qRT-PCR analysis for miR-31 in mICc12 cells treated with Stat3 siRNA. ***p<0.001. (J) Western blotting for STAT3 and p-STAT3 in mICc12 cells treated with STAT3 siRNA. (K) qRT-PCR analysis for miR-31 in cultured organoids treated with IL-6. n = 4 technical replicates. ***p<0.001. (L) Luciferase activity in lysates of mICc12 cells transfected with luciferase reporter plasmids of pGL3-basic empty vector (basic), wild type miR-31 promoter or mutant promoter with mutation of p-STAT3 binding sites. ***p<0.001. (M) Chromatin immunoprecipitation (ChIP) assay carried out on mICc12 cells using antibodies against p-STAT3 and Histone 3. The antibody against Histone 3 was used as a positive control. The enrichment of p-STAT3 binding to miR-31 promoter was quantified using qPCR. ***p<0.001.
-
Figure 8—source data 1
Source data for Figure 8.
- https://doi.org/10.7554/eLife.29538.040
Figure 9
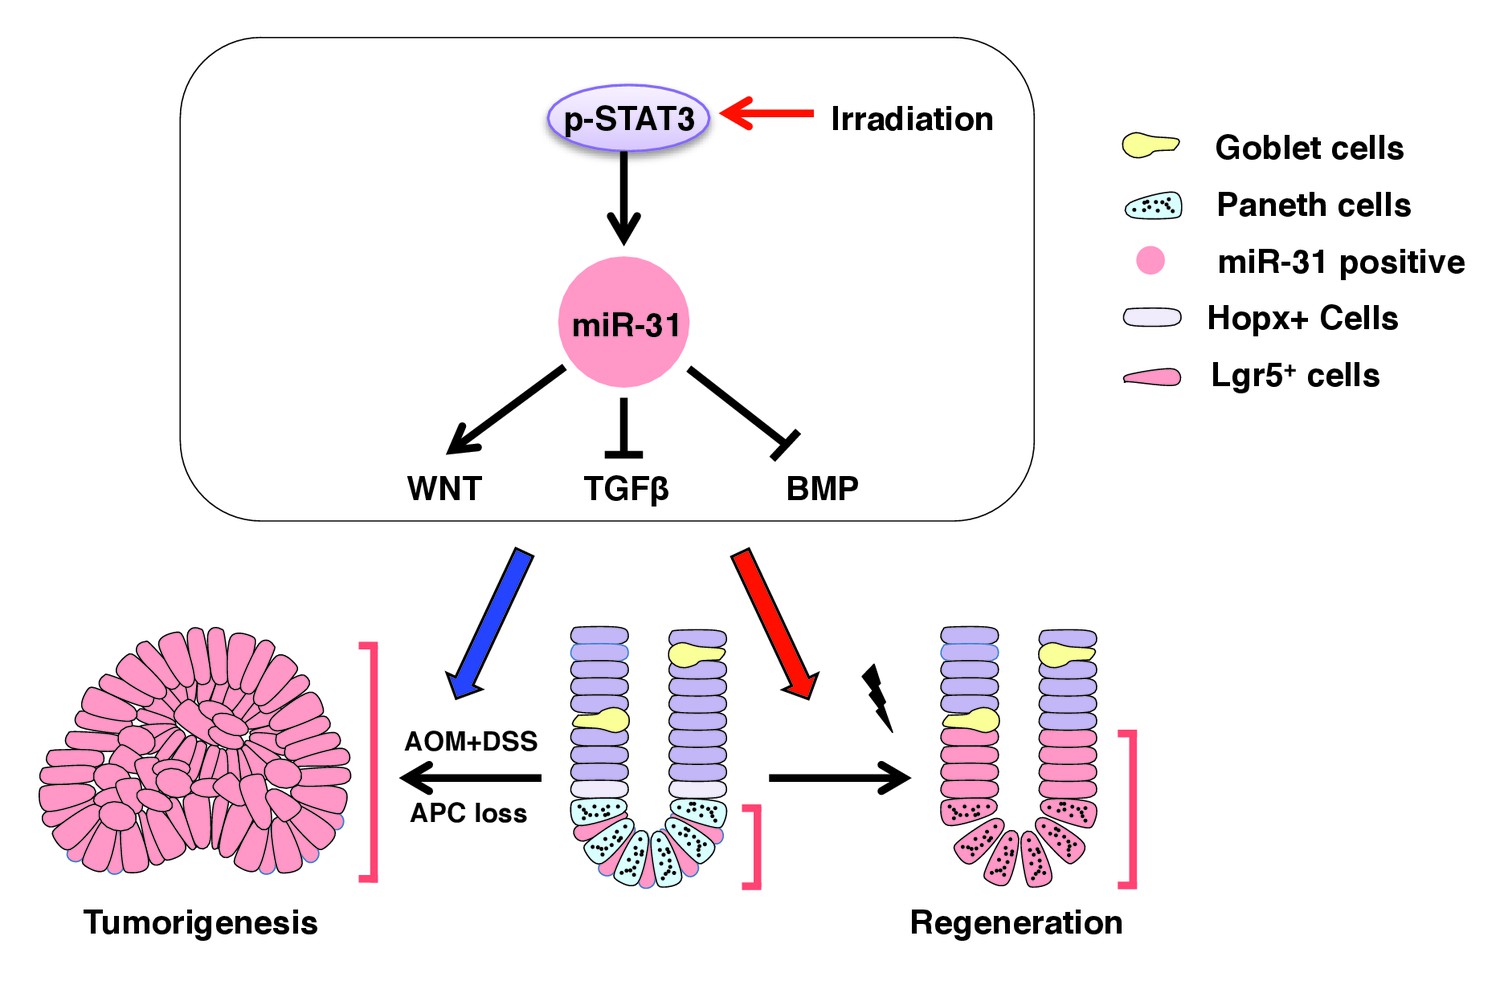
The miR-31 working model in intestinal epithelial regeneration and tumorigenesis.
https://doi.org/10.7554/eLife.29538.041
Author response image 1
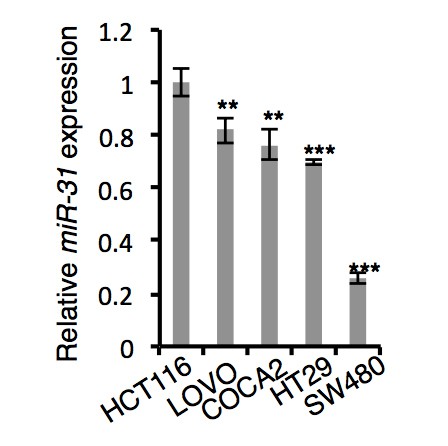
qRT-PCR analysis for miR-31 in HCT116, LOVO, COCA2, HT29 and SW480 colorectal cancer cells.
Author response image 2
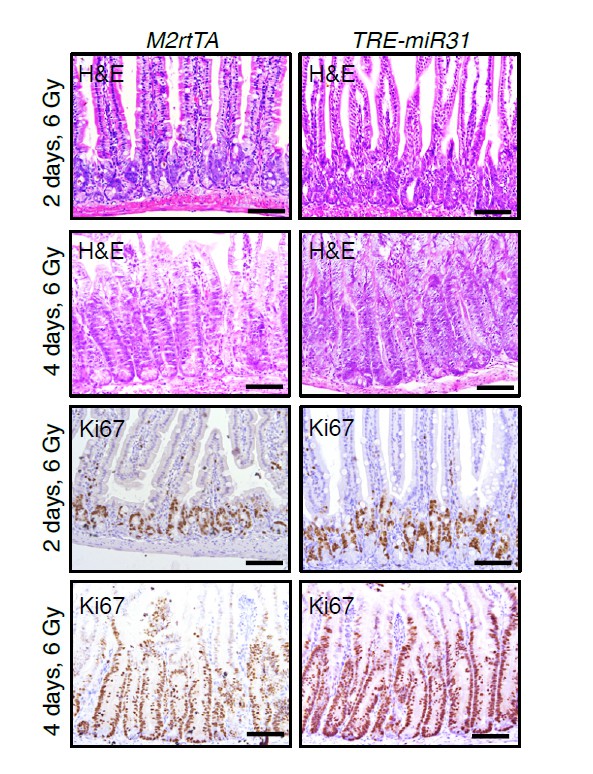
H&E and immunohistochemistry for Ki67 in intestines from M2rtTA control and TRE-miR31 mutant mice 2 and 4 days post 6 Gy irradiation.
Author response image 3
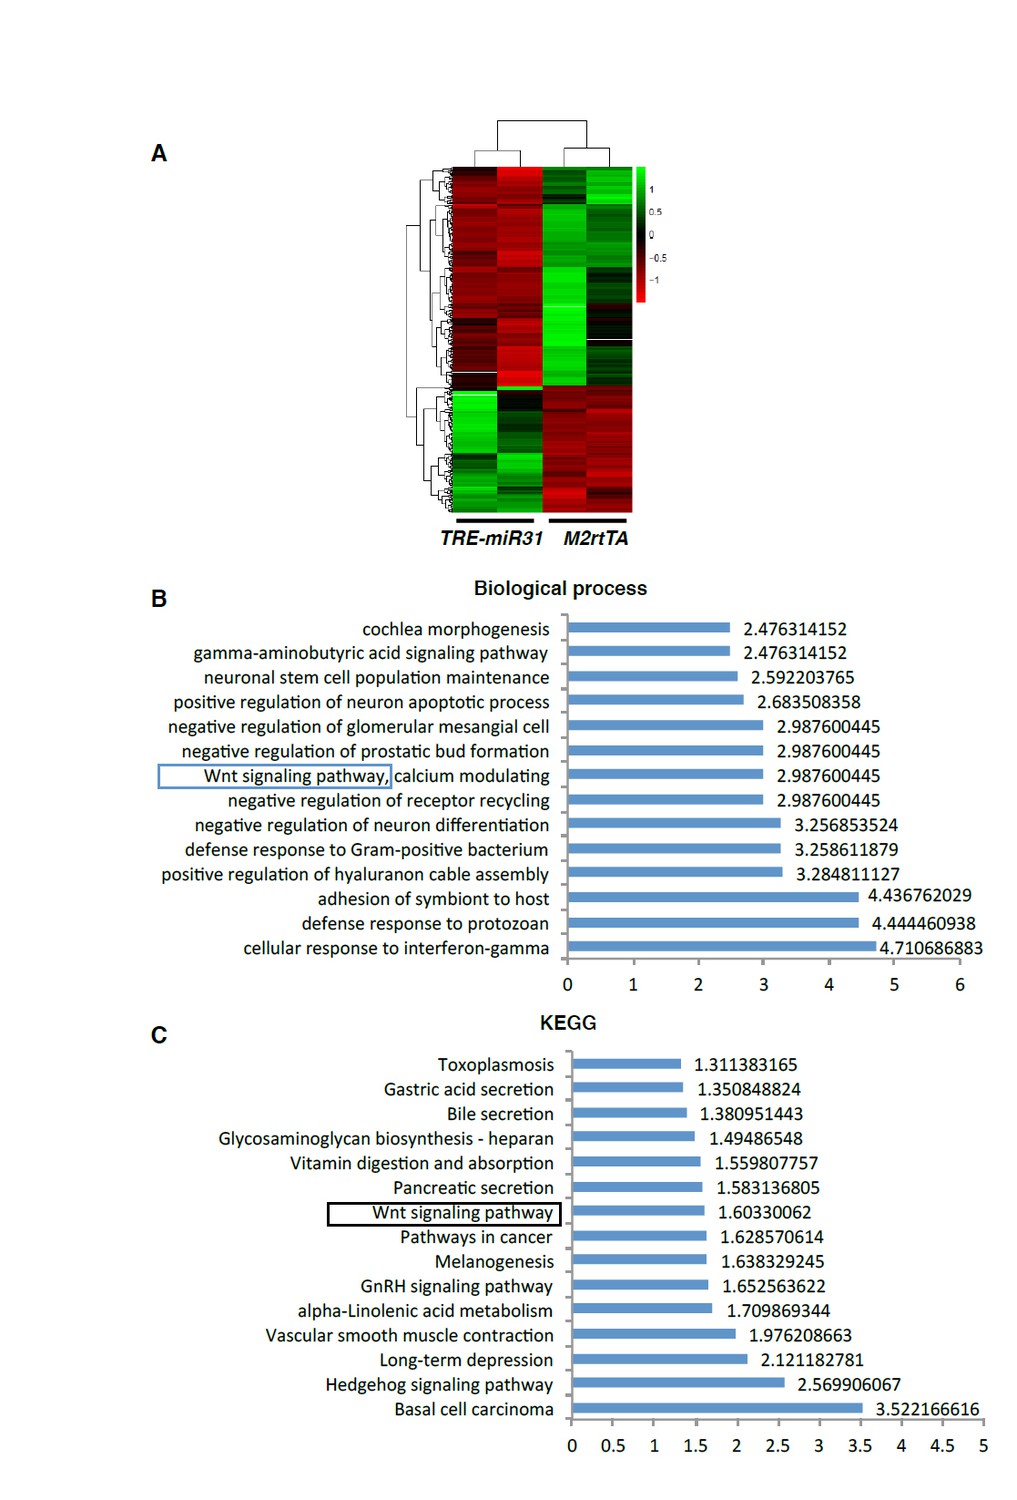
Transcriptome profiling of miR-31 overexpressing intestines.
Author response image 4
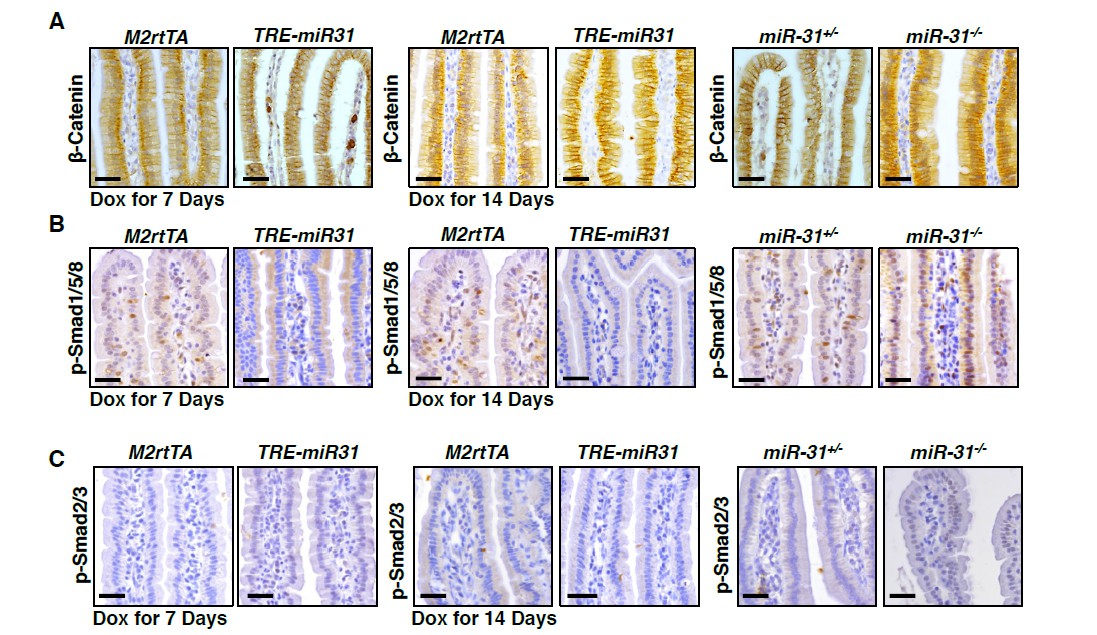
Immunohistochemistry for β-Catenin (A), p-Smad1/5/8 (B), and p-Smad2/3 (C) in intestinal villi from M2rtTA and TRE-miR31 mice, as well as miR-31+/- and miR-31-/- mice.
Author response image 5

Immunohistochemistry for Dkk1, Axin1, Gsk3β and Bmpr1a in intestinal villi from M2rtTA and TRE-miR31 mice, as well as miR-31+/- and miR-31-/- mice.
Additional files
-
Transparent reporting form
- https://doi.org/10.7554/eLife.29538.042
Download links
A two-part list of links to download the article, or parts of the article, in various formats.
Downloads (link to download the article as PDF)
Open citations (links to open the citations from this article in various online reference manager services)
Cite this article (links to download the citations from this article in formats compatible with various reference manager tools)
Stress responsive miR-31 is a major modulator of mouse intestinal stem cells during regeneration and tumorigenesis
eLife 6:e29538.
https://doi.org/10.7554/eLife.29538


