Control of voluntary and optogenetically perturbed locomotion by spike rate and timing of neurons of the mouse cerebellar nuclei
- Northwestern University, United States
Figures
Figure 1
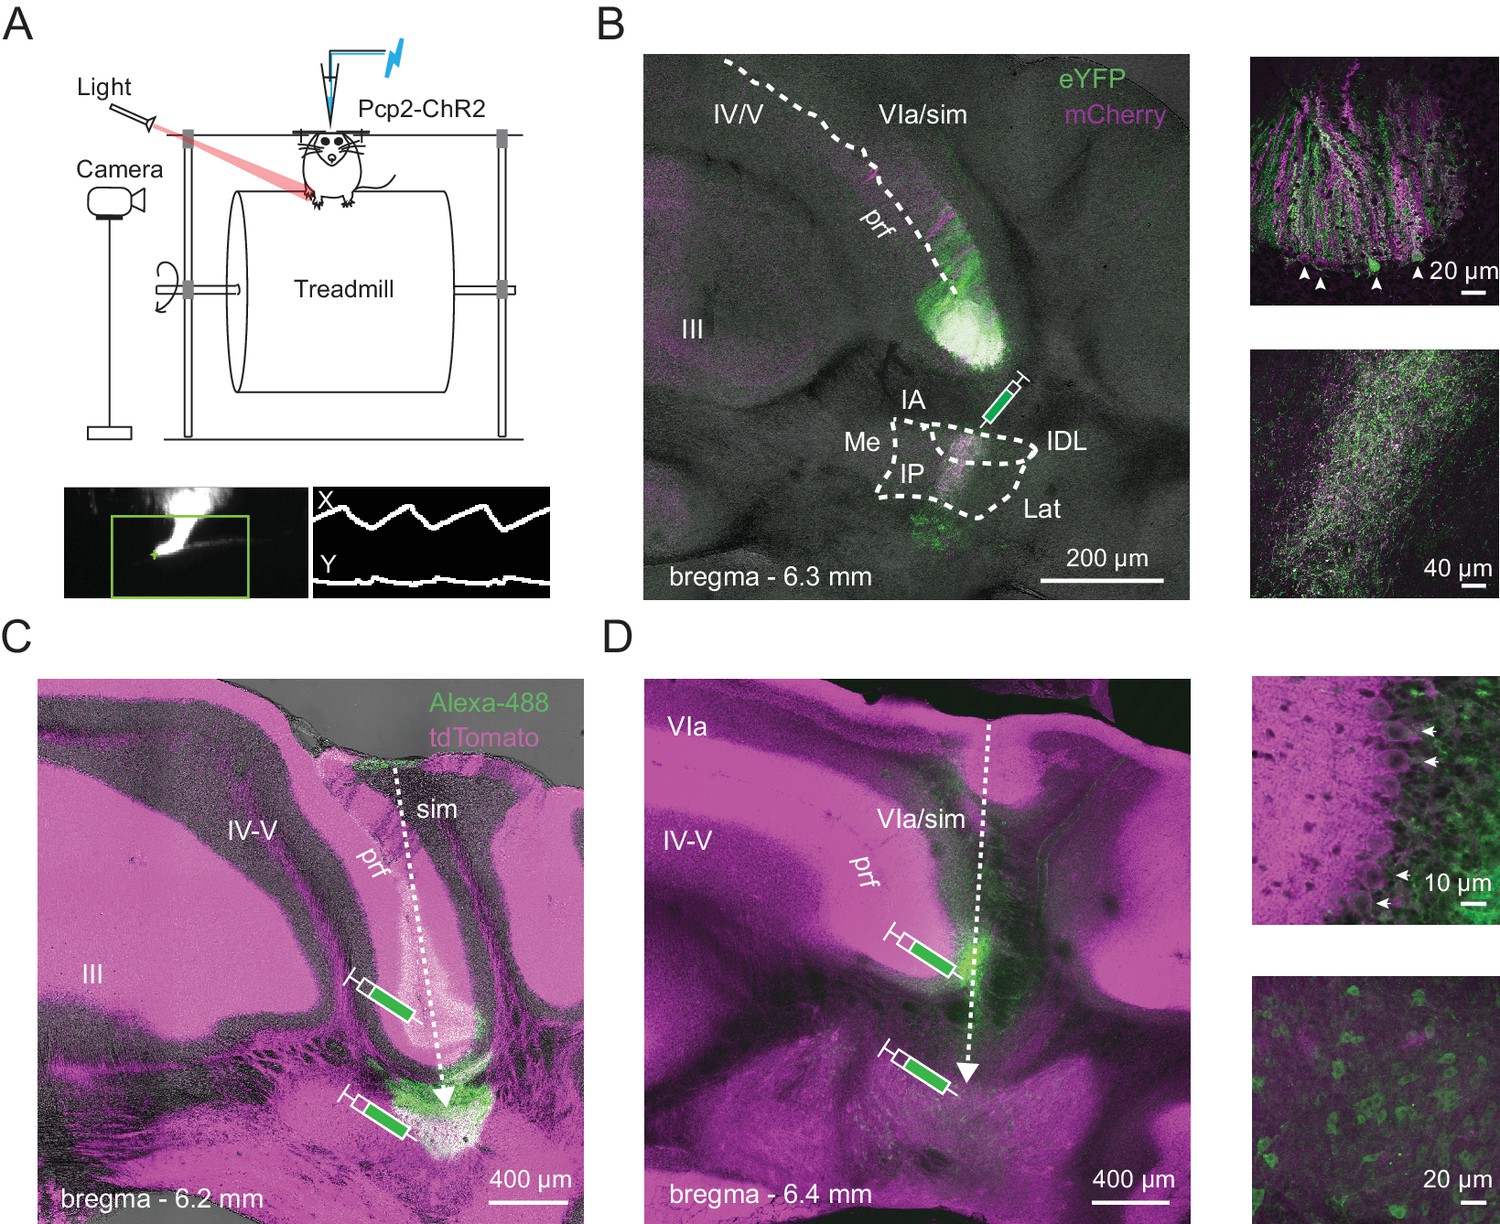
Identification of Purkinje and CbN cells involved in hindlimb movement during locomotion.
(A) Top, Schematic of the setup including a head-fixed mouse running on the cylindrical treadmill, with paw movement recorded with an infrared camera. The patch pipette contained an electrode wire and an optical fiber. Bottom. Side-view of the ipsilateral hindlimb (left). A cursor (green cross) tracked the X and Y positions of tip of the paw within a marked ROI (green box). The paw record (right) was captured at ~ 240 frames/s. (B) Left, AAV2/9-mediated retrograde labeling of Purkinje inputs following injection of a viral mixture (ChR2-mCherry and ChR2-eYFP) in the interpositus nucleus of Pcp2-cre mice. Sample image of a coronal section showing an overlap (white) of mCherry (magenta) and eYFP (green) label in Purkinje cells of lobulus simplex. sim, simplex, prf, primary fissure, IA, interpositus anterior, IP, interpositus posterior, IDL, interpositus dorsolateral hump, Lat, lateral nucleus, Me, medial nucleus. Upper right, higher magnification image of labeled Purkinje somata (arrows) at the bottom of lobulus simplex surrounding the primary fissure. Lower right, higher magnification image of the site of injection in the nucleus interpositus posterior, showing labeled terminals of Purkinje afferents, but not CbN cell bodies. (C) and (D), Left, Sample images of coronal sections from two different mice. Green, Alexa 488-dextran amine injected at two sites along the recording track in mice expressing ChR2 and tdTomato (magenta) in all Purkinje cells (Ai27D x Pcp2-cre). Dotted arrows, injection pipette track. (D), right. Higher magnification images of the labeled Purkinje somata (top; arrows) and CbN cell somata (bottom) along the track in D.
Figure 2

Running related changes in Purkinje and CbN cell firing rates.
(A) Sample traces of loose cell-attached recordings from a Purkinje (Pkj) cell (left) or a CbN cell (right) in awake, head-fixed mice on a non-motorized treadmill during periods of rest (top) or run (bottom). Paw, ipsilateral hind paw position in the x-domain. IFR, instantaneous firing rate; IFR hist, histogram of the IFR in 20 ms bins, overlaid for rest and run. (B, C, D) Mean, minimal, or maximal firing rates during run periods across multiple strides vs. mean firing rate during rest (≥2 s) for all cells. Open symbols, individual cells; filled symbols, means; grey lines, unity.
Figure 3
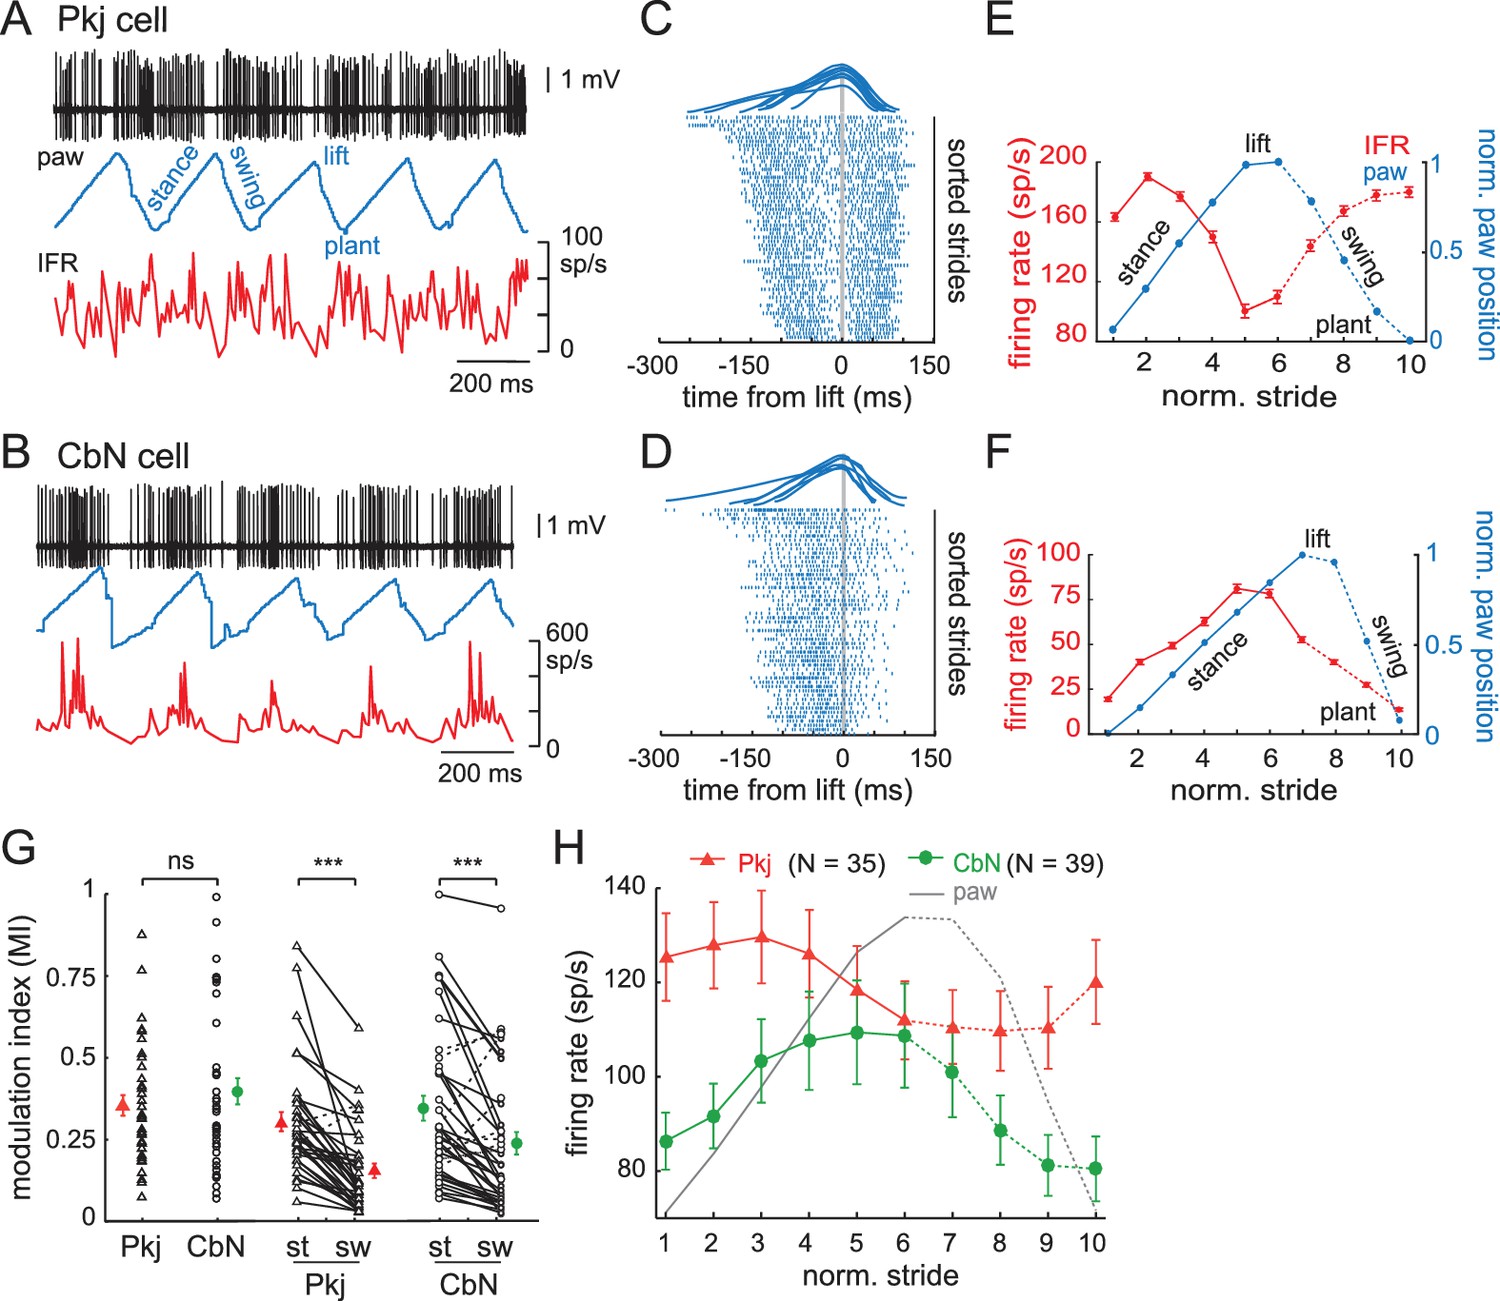
Modulation of firing rates relative to the phase of strides.
(A) Sample records from a running mouse of Purkinje cell spikes, paw position, and instantaneous firing rate, illustrating stance, swing, lift, plant, component phases of a stride. (B) As in (A), for a CbN cell. (C) Top, sample strides aligned to lift. Raster plots of firing by the Purkinje cell in (A) during strides sorted by duration and aligned to the lift phase. Every third stride of 171 strides is plotted. (D) As in (C), for the CbN cell in (B). Rasters during every third stride of 159 strides. (E, F) Red, binned instantaneous firing rates averaged across all lift-aligned strides vs. normalized stride bin. Blue, paw position averaged across all normalized strides. Data from the Purkinje cell in (A, C) and the CbN cell in (B, D). (G) Modulation indices (MI) for all cells calculated from the mean IFR curves as in (E, F). Open symbols, individual cells, filled symbols, means; st, stance phase; sw, swing phase. (H) Population average of all IFR tuning curves across all Purkinje and CbN cells, superimposed on paw position. Solid line, stance; dotted line, swing. On all panels, all figures, ns, non-significant, *p<0.05, **p<0.01, ***p<0.001.
Figure 4
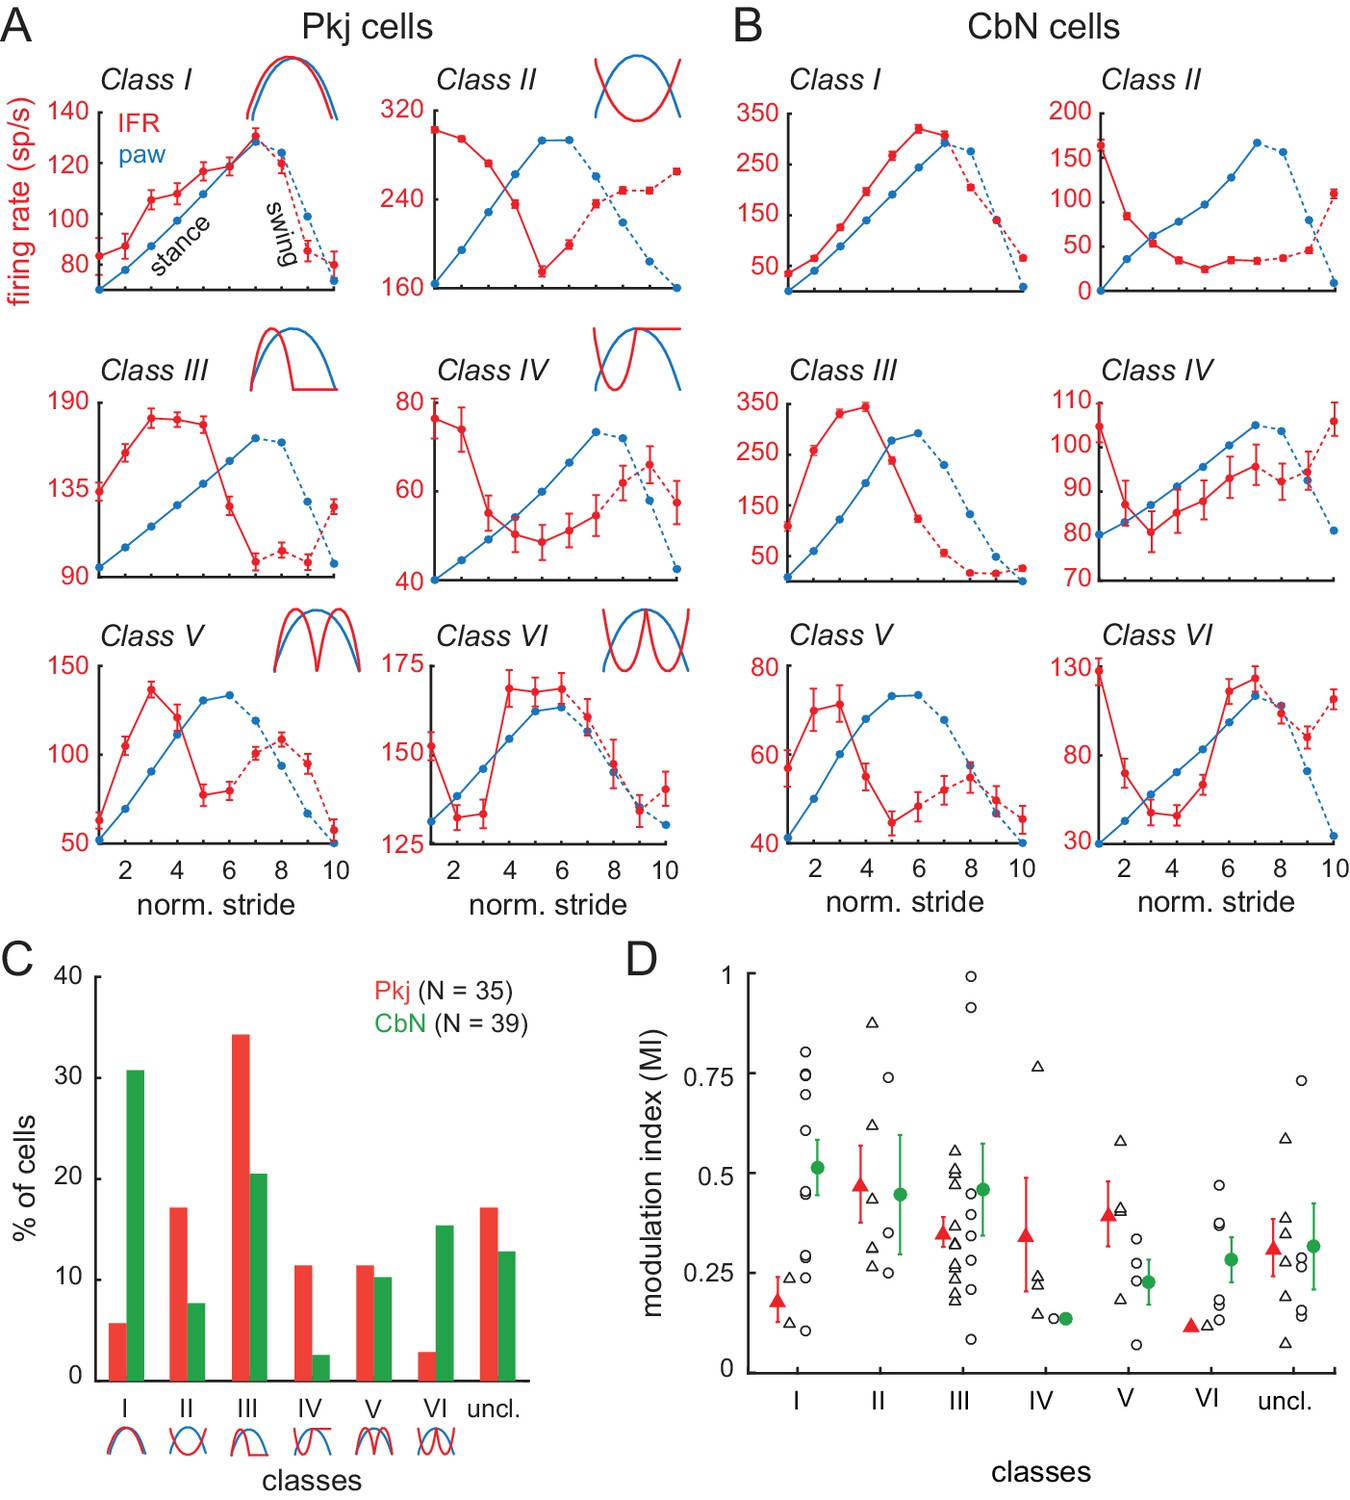
Multiple categories of stride-related firing rate modulation in Purkinje and CbN cells.
(A, B) Instantaneous firing rates (red, IFR) and paw position (blue, paw) during normalized strides for six different Purkinje cells (A, Classes I-VI, N = 101, 208, 108, 77, 75, 118 strides) and CbN cells (B, Classes I-VI, N = 102, 67, 107, 95, 295, 54 strides). Insets, schematics of modulation pattern in each class. (C) Distribution of cells in each of the six classes. (D) Modulation indices sorted by class. Triangles, Purkinje; circles, CbN; Open symbols, individual cells, filled symbols, means; uncl., unclassified.
Figure 5 with 1 supplement

Effects of optogenetic stimulation of Purkinje cells on locomotion.
(A-D) Sample recordings from a Purkinje (left) and CbN cell (right), with paw position, instantaneous firing rate, and stimulus pattern, for non-slip trials (A) and slip trials, including prolonged strides (B), incomplete strides (C), and arrested strides (D). Blue shading, light stimulation. Arrows in (C) indicate the time of the slip.
Figure 5—figure supplement 1
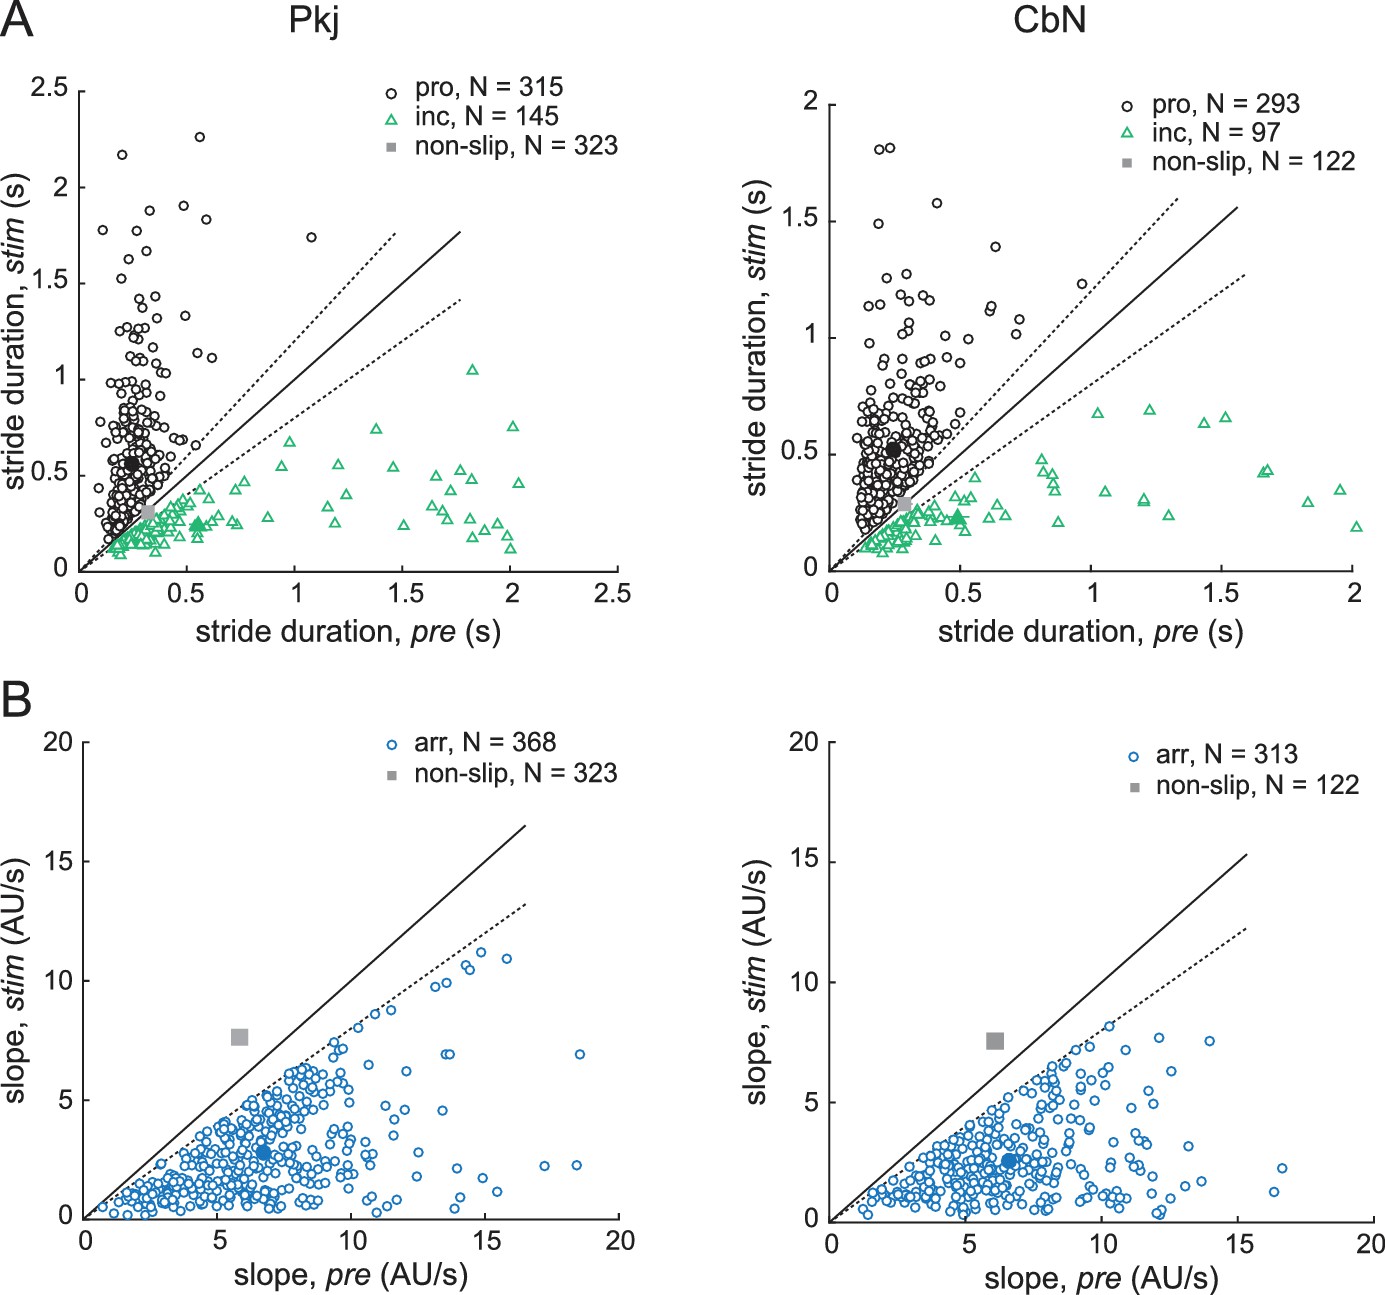
Parameters of slips.
(A) Stride duration during vs. before light stimulation for all automatically detected slip trials obtained during recordings from Purkinje cells (left) and CbN cells (right). Black, prolonged strides, green, incomplete strides, open symbols, values from each trial, closed symbols, mean values. Grey symbols, mean ± SEM (within the symbol) values for all non-slip trials. Solid lines, unity; dotted lines, threshold for slip classification, that is, 20% deviation from unity. (B) Stance or swing slope during vs. before light stimulation for all automatically detected arrested stride slip trials obtained during recordings from Purkinje cells (left) and CbN cells (right). Whichever phase (stance or swing) was more greatly altered is plotted. Grey symbols, mean ± SEM (within the symbol) values for all non-slip trials. Solid lines, unity; dotted lines, threshold, that is, 20% deviation from unity.
Figure 6
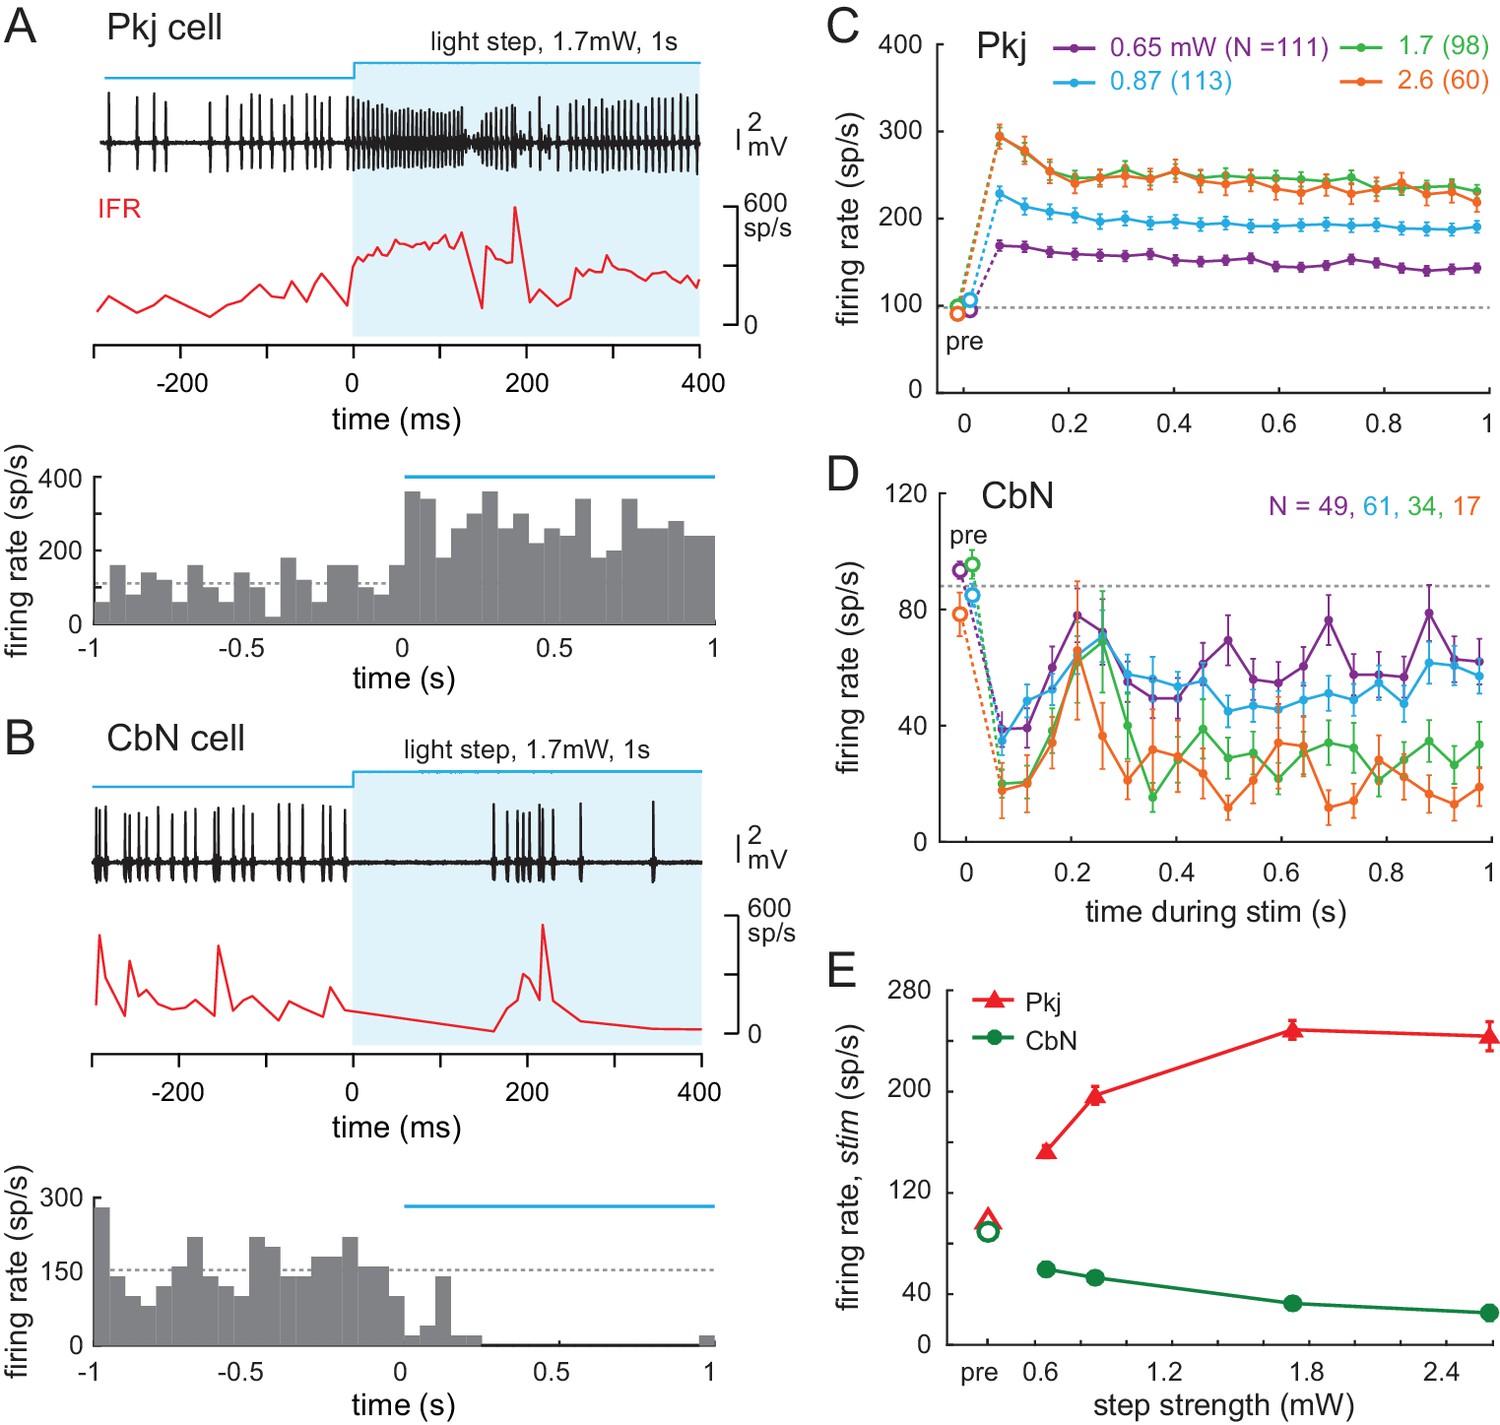
Effects of light steps on Purkinje and CbN cell firing.
(A, B) Top, Sample traces from a Purkinje (A) and CbN cell (B) in response to the first 400 ms of a light step (blue shading). Instantaneous firing rate (red, IFR). Bottom, PSTH of the examples in (A, B) for the full 1 s of stimulation. Light onset, 0 ms. Bin width, 50 ms; blue line, light duration, dotted line, mean pre-stimulus firing rate for that trial (1 s). (C, D Mean PSTHs across all trials for all step intensities for all 35 Purkinje (C) and all 39 CbN cells (D) Bin width, 50 ms; pre, pre-stimulus rates; dotted line, mean pre-stimulus rates in all conditions. (E) Mean firing rates over the 1 s stimulus for all cells at each stimulus strength.
Figure 7 with 1 supplement
Effects of light trains on Purkinje and CbN cell firing.
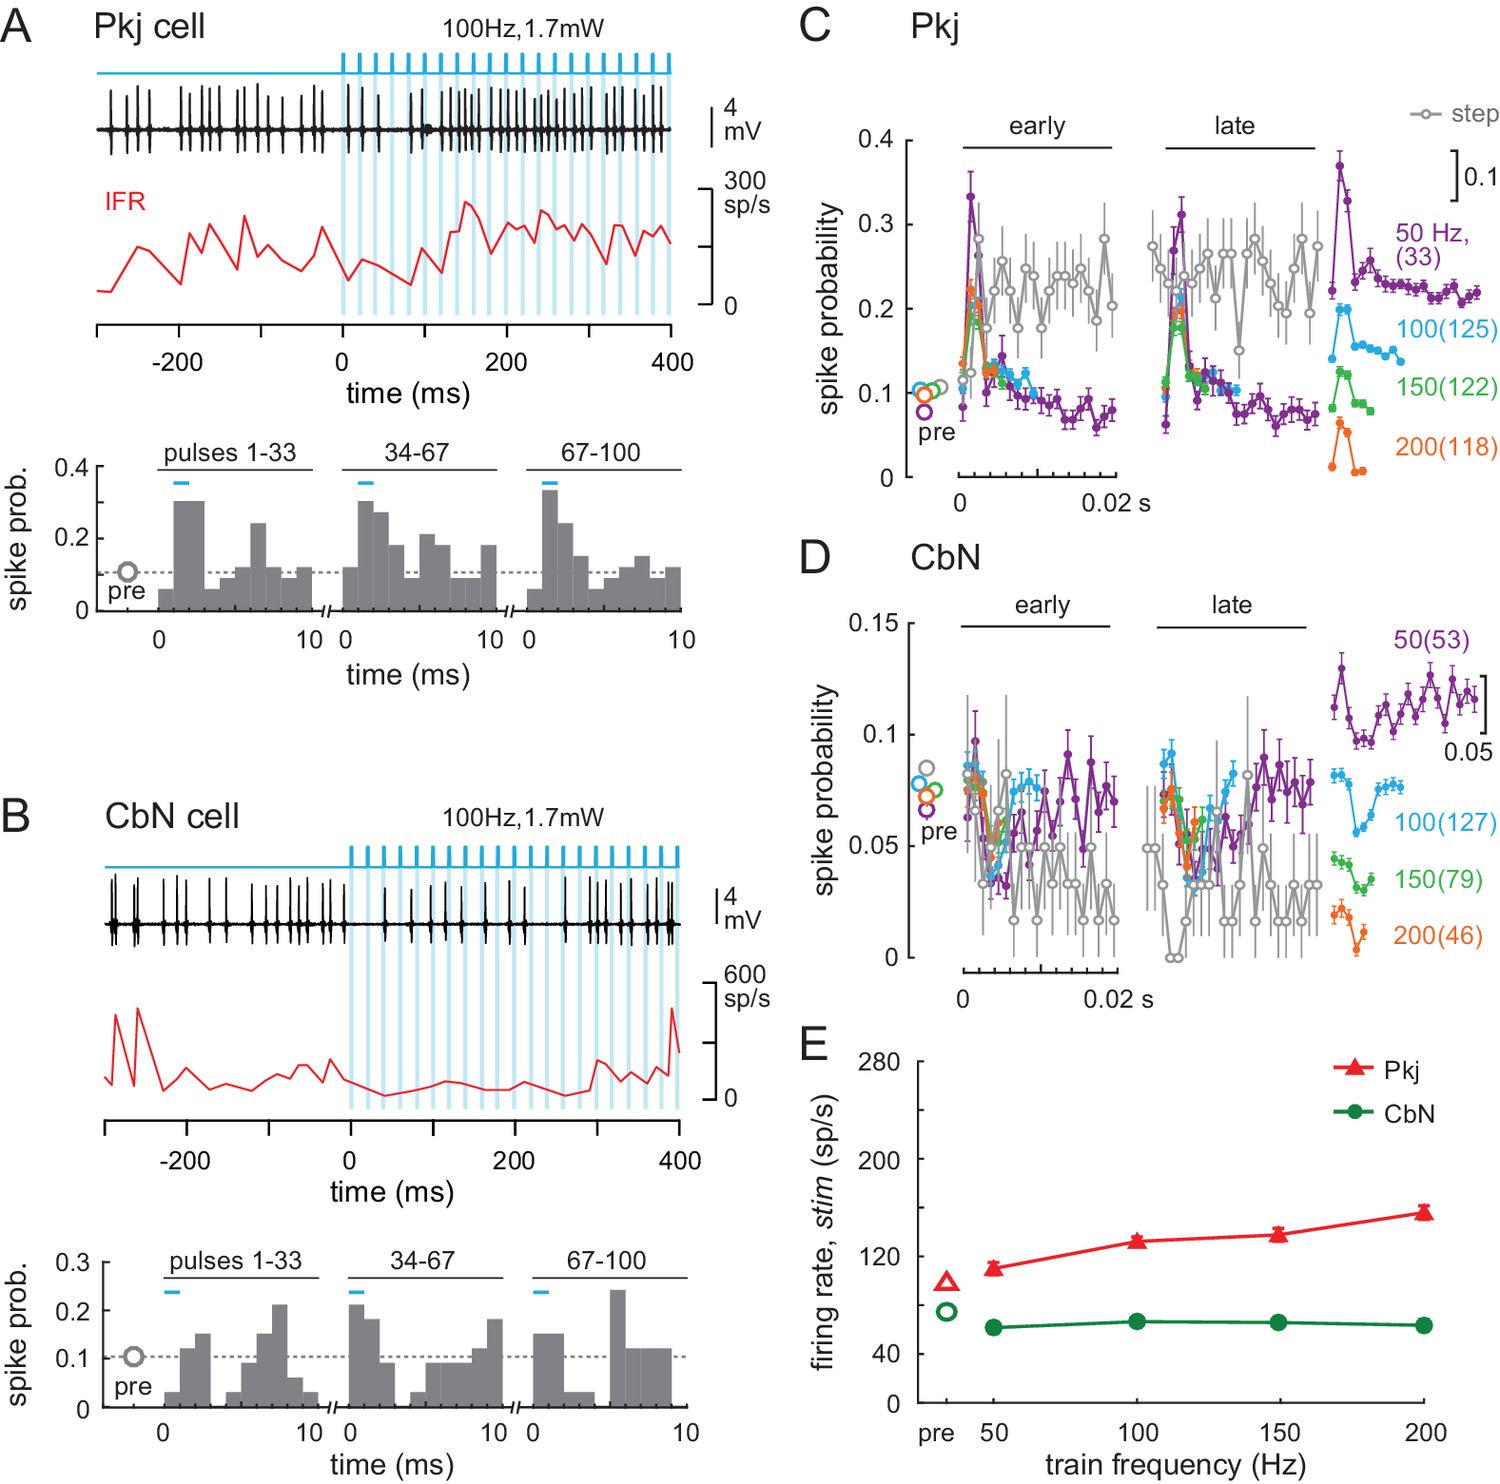
(A, B) Top, Sample traces from a Purkinje (A) and CbN cell (B) in response to the first 400 ms of a 100 Hz light train (blue shading). Instantaneous firing rate (red, IFR). Bottom, Mean PSTH across cycles for the early (1-33), middle (34-67) and late (68-100) pulses in the train, showing resetting of spike times. Bin width, 1 ms; inter-pulse interval, 10 ms; pre, mean spike probability per 1 ms over a 1 s pre-stimulus epoch. (C, D) Mean PSTHs across all 35 Purkinje and 39 CbN cells for all train frequencies for early and late cycles analyzed as in (A) and (B). Far right, inset, PSTH traces from the early group at different frequencies are offset for clarity (scale = 0.1 change in spike probability). Grey open circles, PSTH of responses to light step (0.87 mW) from Figure 6, binned at 1 ms and overlaid for comparison; dotted grey line, mean pre-stimulus firing rates for all train conditions. (E) Mean firing rates over the 1 s stimulus for all cells at each frequency.
Figure 7—figure supplement 1
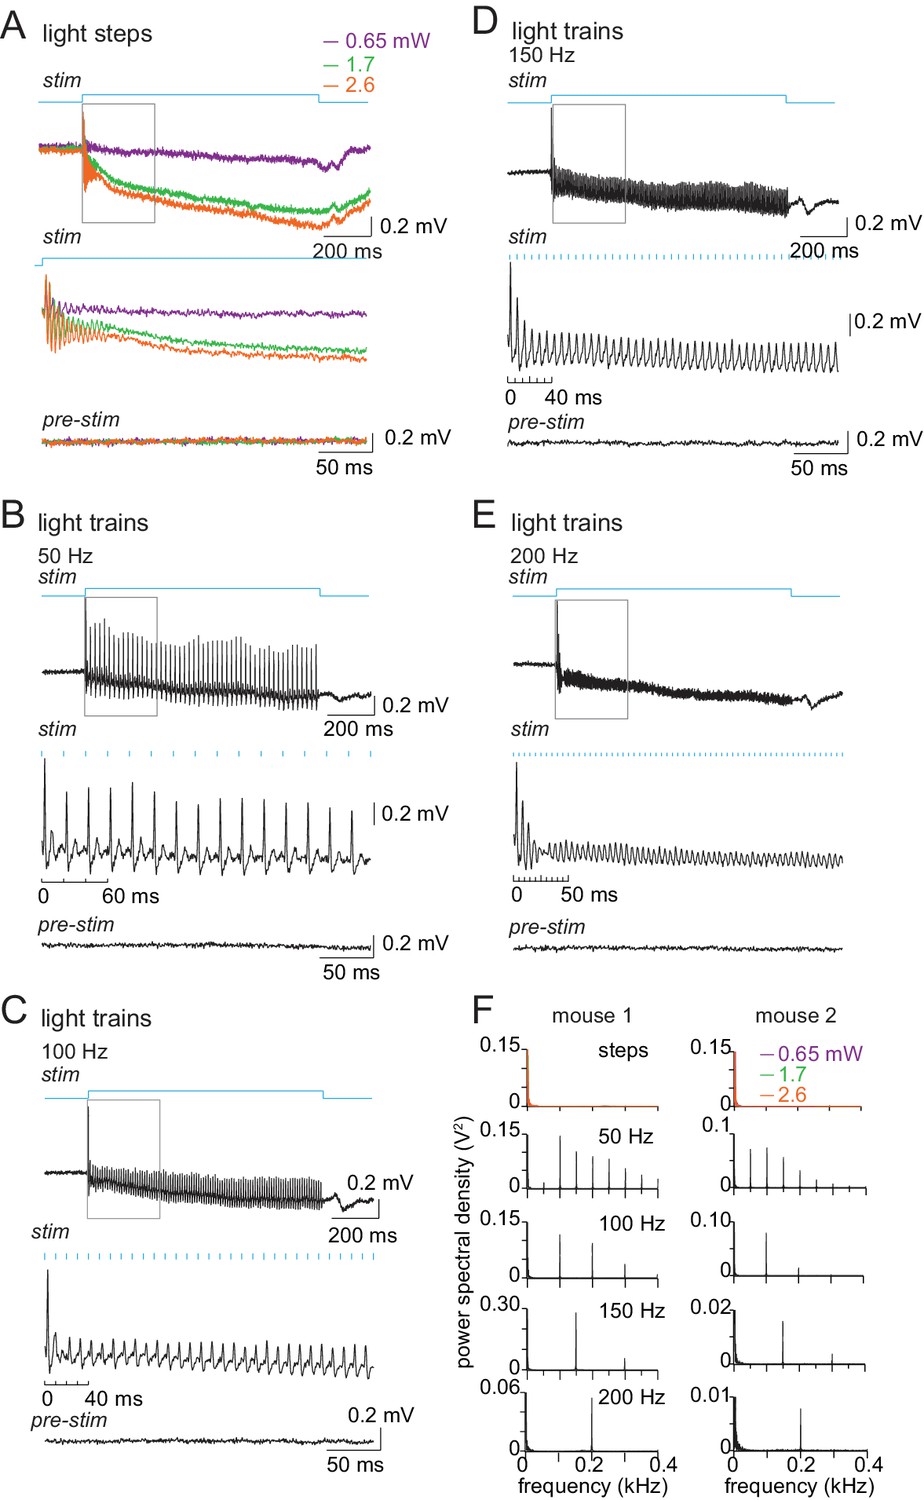
Local field potentials of Purkinje cell responses to optical stimulation.
(A) Upper traces: Local field potentials evoked by 1 s light steps (blue square pulse) of 0.65, 1.7, and 2.8 mW, with the optical fiber positioned as it was for CbN cell recordings. Each record is the mean of ten trials. Middle traces: Expansion of the 300 ms boxed region in the upper records, illustrating the high-frequency oscillation for the first 50 ms, likely owing to coherent firing at the onset of stimulation. Bottom traces: Mean of ten pre-stimulus records, same gain as middle traces. (B, C, D, E) As in (A) for train stimulation (2.8 mW) at 50, 100, 150, and 200 Hz. On middle traces, the blue tick marks indicate the timing of light pulses to illustrate time-locking of the population spike to the stimulus. (F) FFTs of responses to steps and trains, showing frequency match between the stimulus and response for both mice tested.
Figure 8
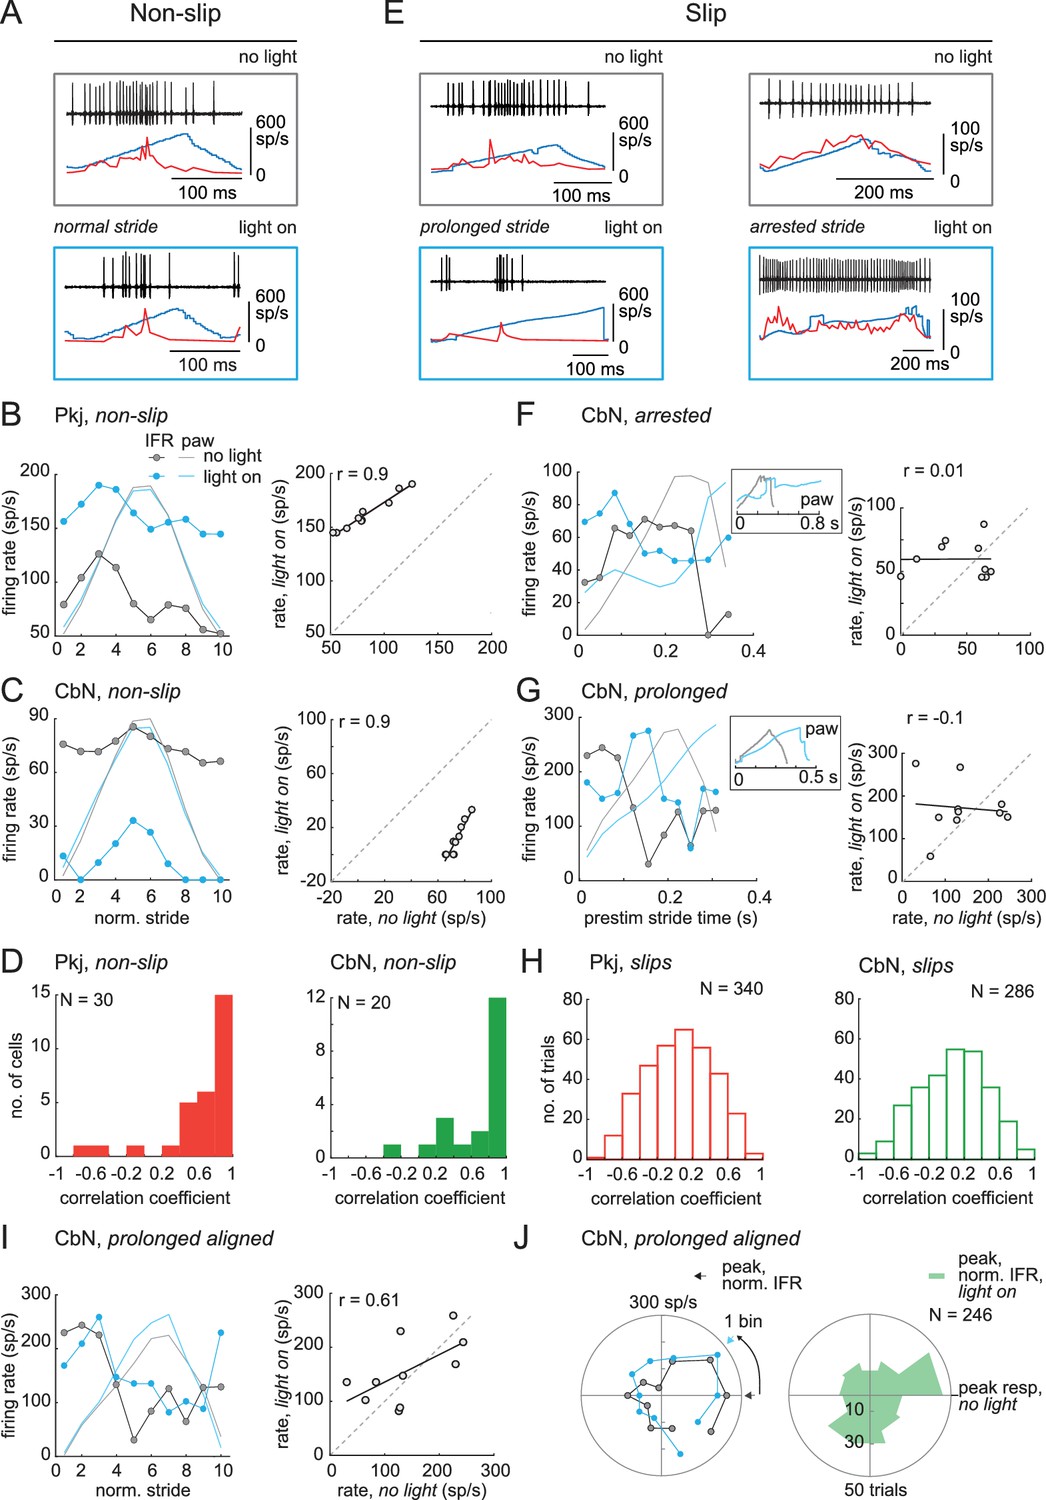
Correlation between firing rate modulation of individual neurons and slip/non-slip trials.
(A) Comparison of CbN cell activity (black), paw position (blue), and instantaneous firing rate (red) without light (top, ‘no light’) and during light stimulation (bottom, ‘light on’) in non-slip trials. (B, C) Left, Instantaneous firing rate (IFR) and paw position during normalized strides for a Purkinje (B) and a CbN cell (C) for non-slip trials. Right, Binned IFRs from left panels for ‘light on’ vs. ‘no light’ conditions; r, correlation coefficient; dotted line, unity. (D) Histogram of correlation coefficients measured as in (B), (C) for all Purkinje (left) and CbN (right) cells. (E) As in (A) for two slip trials. Note differences in time base between ‘no light’ and ‘light on’ pairs. (F, G) As in (C), for slip trials for the illustrated CbN cells. Insets, overlay of paw traces during the pre-stimulus (grey, 'no light') stride template and the slip epoch (blue, 'light on'). (H) As in (D), for all slip trials. (I). As in (C) for prolonged stride aligned to the lift of a control stride ('no light'), for the same slip trial as shown in (G). (J) Left. Polar plots from (I) of control and prolonged lift-aligned stride. 0 indicates bin with maximal firing rate in control stride. Right. Mean of all prolonged lift-aligned stride trials, showing the peak response is near 0, which is the bin with the peak firing rate in control ('no light').
Figure 9 with 1 supplement
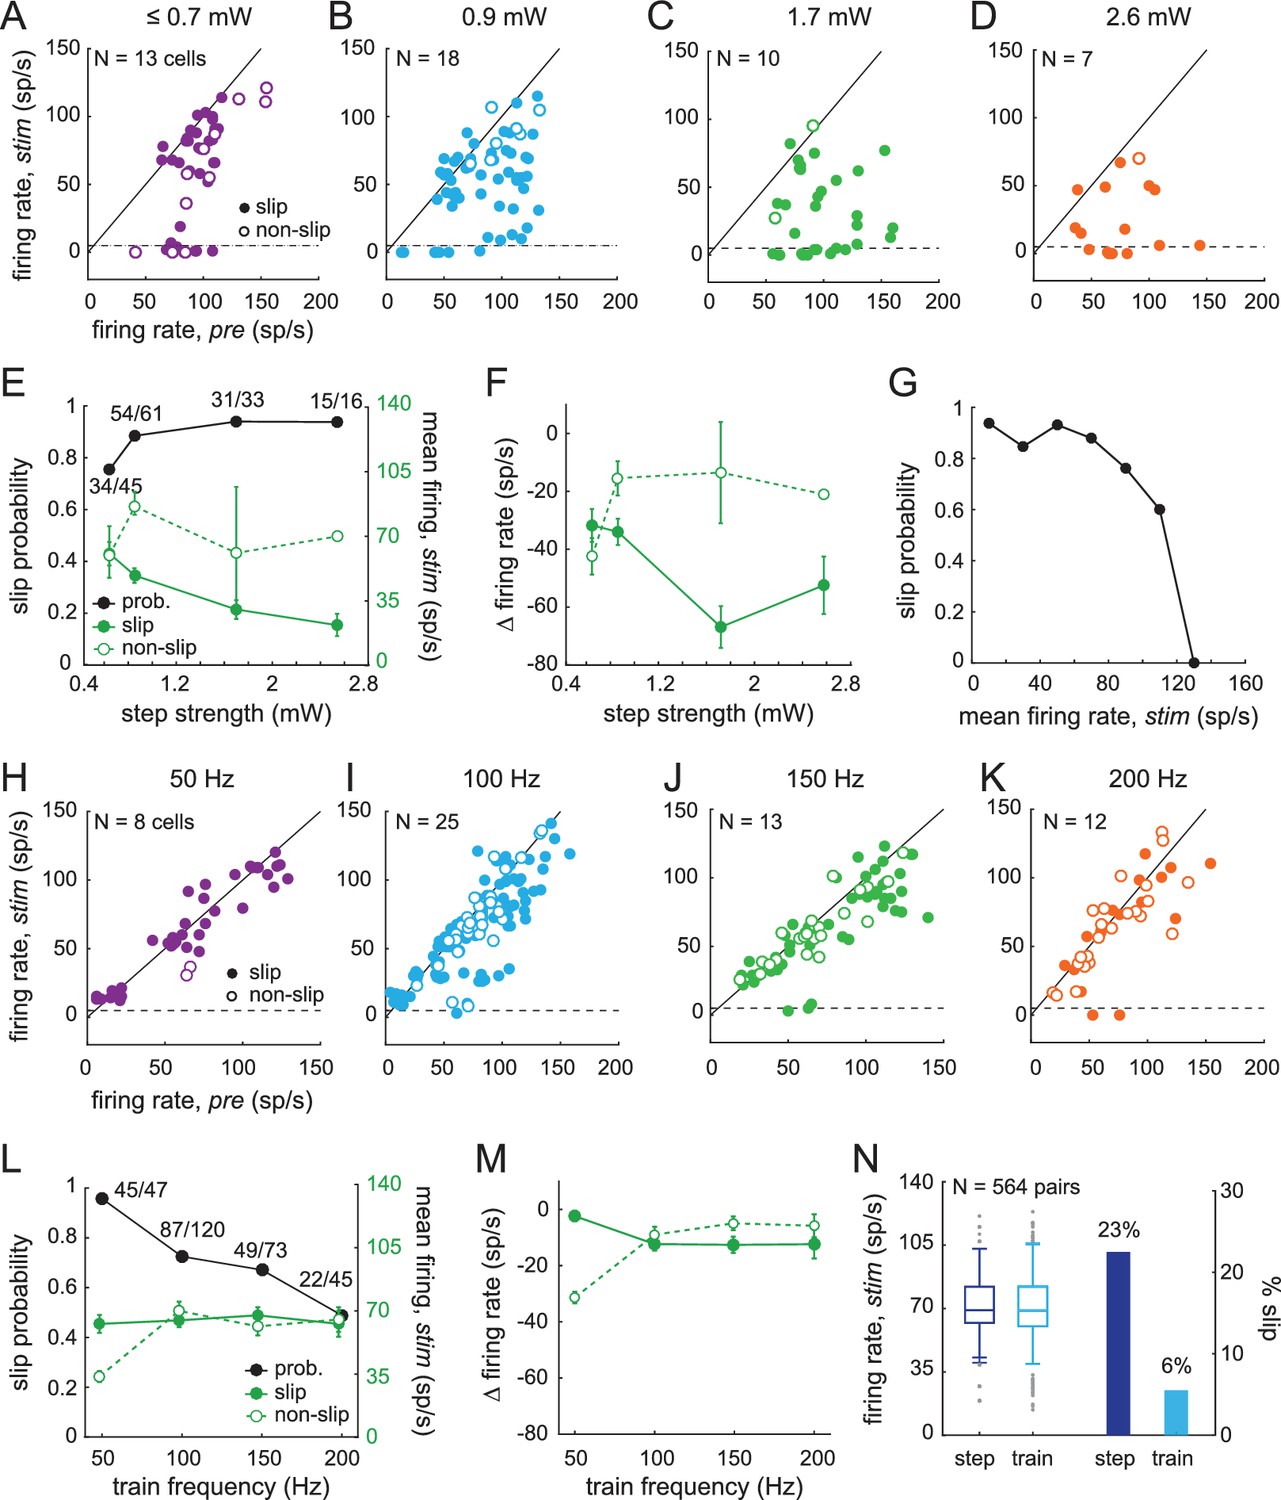
Sensitivity of smooth locomotion to optogenetic changes in CbN firing rates and patterns.
(A-D) Scatter plots for each light intensity of mean CbN cell firing rates during light steps (1 s) vs. pre-stimulus firing rates (1 s) for single trials. Filled symbols, slip; open symbols, non-slip trials; black line, unity; dashed line, five spikes/s. (E) Slip probability (black) and mean CbN cell firing rates (green) for slip (solid symbols) and non-slip (open symbols) trials. Numbers, slip/total trials (F) Change in CbN cell firing rates compared to pre-stimulus firing rates in slip and non-slip trials vs. light step strength. Symbols as in (E). (G) Slip probability vs. binned mean firing rates across all step intensities (bin = 20 spikes/s). (H–K) As in (A–D) for each light train frequency. (L) As in (E), for trains. (M) As in (F), for trains. (N) Left, Box plot of firing rates for 564 pairs of trials selected for similar mean firing rates during a step and a train of light stimuli applied to the same cell. Grey symbols, outliers; whiskers, two standard deviations. Right, Bar graph of fraction of paired trials in which a slip was evoked only by the step (dark blue) or only by the train (light blue).
Figure 9—figure supplement 1
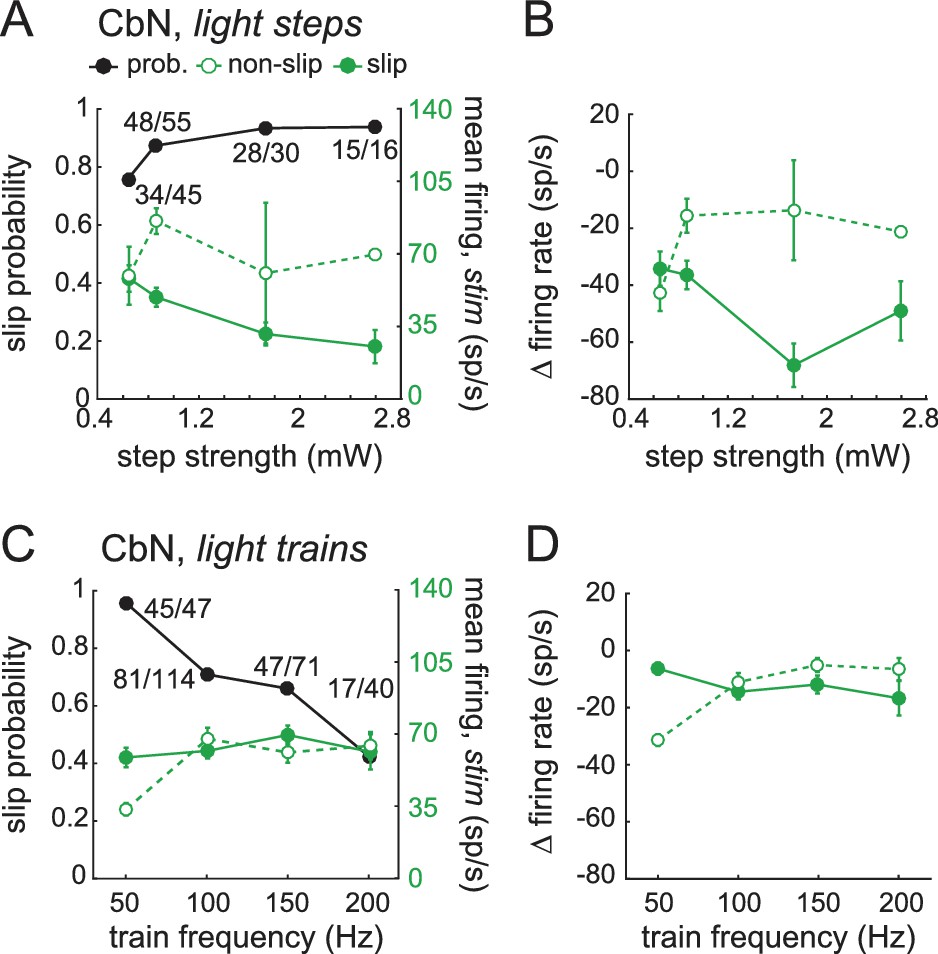
Reanalysis of data of Figure 9 with slip measurements constrained to the period within the trial when locomotion was perturbed.
The trials consist of the subset of those in Figure 9 in which slip onsets and offsets were clearly identifiable. (A) Slip probability (black) and mean CbN cell firing rates (green) for slip (solid symbols) and non-slip (open symbols) trials. Steps: χ2 (7, N = 132)=3.1, p=0.4, chi-square test. (B) Change in CbN cell firing rates compared to pre-stimulus firing rates in slip and non-slip trials vs. light step strength. Symbols as in (A). Two-way ANOVA F(3,124) = 3.9, p=0.05, interaction between step strength and slip/non-slip, p=0.6. (C) As in (A), for trains. Trains: χ2 (7, N = 185)=25.8, p<0.001, chi-square test. (D) As in (B), for trains. Two-way ANOVA F(3,177) = 2.95, p=0.09, interaction between frequency and slip/non-slip, p=0.06.
Figure 10
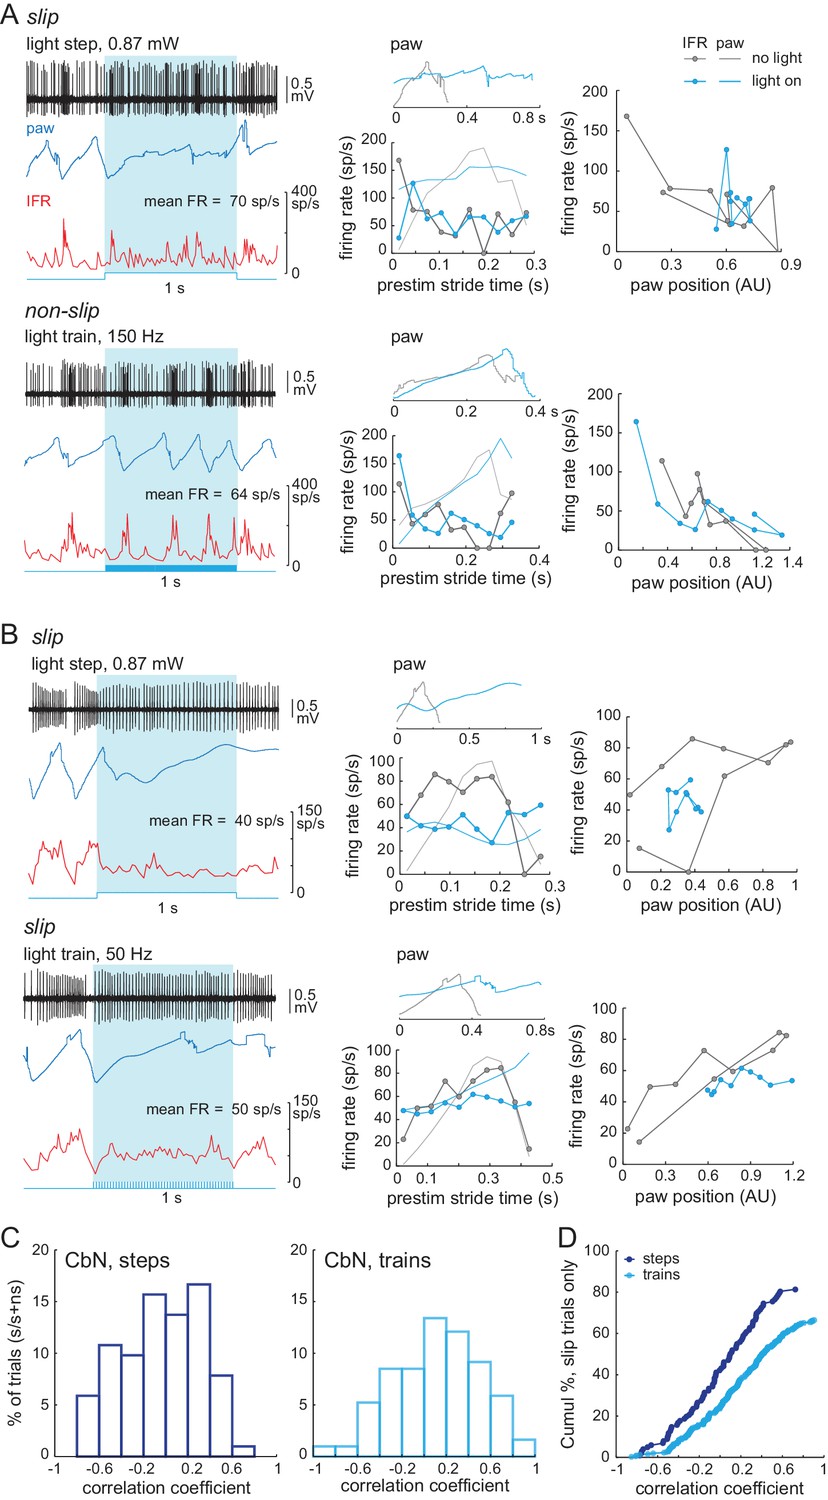
Loss of stride-related firing rate modulation during slips evoked by steps or trains.
(A) Left, Rate matched trials from a single CbN cell in which a step led to a slip (top) and a train led to a non-slip (bottom). Middle, Overlaid paw records from the pre-stimulation and stimulation period (upper plots) and binned instantaneous firing rates (10 bins) during the pre-stimulus stride and during the stimulation over an equivalent period (lower plots) for the trials at left. Right, firing rate vs. paw position for the trials at left. (B) As in (A) for a different CbN cell in which both the step and train led to a slip. (C) Data from Figure 8H showing the correlation between the firing rate during the pre-stimulus stride and during the stimulus on slip trials, separated by steps and trains, and normalized to the total number of step trials (122) or train trials (286). (D) Cumulative histograms for the percentage of trials with a given correlation coefficient, for slip trials only. The maximal value of each histogram corresponds to the percentage of slip trials resulting from steps (81%) or trains (63%).
Tables
Key resources table
| Reagent type (species) or resource | Designation | Source or reference | Identifiers | Additional information |
|---|---|---|---|---|
| strain, strain background (Mus musculus) | B6.Cg-Gt(ROSA)26Sortm27.1(CAG- COP4*H134R/tdTomato)Hze/J | Jackson Laboratory | Jackson stock: 012567 | - |
| strain, strain background (Mus musculus) | B6.129-Tg(Pcp2-cre)2Mpin/J | Jackson Laboratory | Jackson stock: 004146 | - |
| recombinant DNA reagent | AAV9.CBA.Flex.ChR2(H134R)- mCherry.WPRE.SV40 | Addgene | Addgene: 18916 | - |
| recombinant DNA reagent | AAV9.EF1a.DIO.hChR2(H134R)- eYFP.WPRE.hGH | Addgene | Addgene: 20298 | - |
| software, algorithm | custom paw tracking software | Actimetrics | from Actimetrics www.actimetrics.com | free by contacting company |
| software, algorithm | irradiance calculator | Deisseroth Lab Optogenetics Resources | https://web.stanford.edu/group/dlab/ | - |
Additional files
-
Transparent reporting form
- https://doi.org/10.7554/eLife.29546.015
Download links
A two-part list of links to download the article, or parts of the article, in various formats.
Downloads (link to download the article as PDF)
Open citations (links to open the citations from this article in various online reference manager services)
Cite this article (links to download the citations from this article in formats compatible with various reference manager tools)
Control of voluntary and optogenetically perturbed locomotion by spike rate and timing of neurons of the mouse cerebellar nuclei
eLife 7:e29546.
https://doi.org/10.7554/eLife.29546


