The genome of an intranuclear parasite, Paramicrosporidium saccamoebae, reveals alternative adaptations to obligate intracellular parasitism
- University of Michigan, United States
- University of Ottawa, Canada
- CHLAREAS Chlamydia Research Association, France
- Medical University of Vienna, Germany
- Central Institute of the Federal Armed Forces Medical Services, Germany
Figures
Figure 1

Metagenomic plots to decipher target P.saccamoebae contigs from metagenomic assembly using multiple lines of evidence.
(A) Emergent self-organizing map (ESOM) torroidal topology (topo map) with black outline representing the final area surrounding P. saccamoebae contigs. Individual points on the map represent 3000 bp windows of metagenomic assembly contigs, whose distance to other points on the map is determined by their tetramer frequency matrix, and green ‘valleys’ of the map represent windows who frequency matrix are more similar and tan or white ‘mountains’ separate winodws whose tetramer frequencies are more different. (B) Topo map overlaid with contig median coverage; the most common P. saccamoebae coverage class (50-59x) is highlighted in pink; this alone was not enough to identify P. saccamoebae-specific contigs. (C) Contigs with blastn hits to the de novo Trinity assembly are in yellow, and found in many parts of the map including concentrations in the P. saccamoebae area, whereas those contigs with no hit to the assembly (in white) are not found in P. saccamoebae area. (D) Phylogenetic classes mapped onto the topology (based on best blastn to GenBank ‘nr’ database). P. saccamoebae region contains contigs with hits to mostly Fungi, animals, NO HIT, plants, Nuclearia, Microsporidia, and the P. saccamoebae rDNA. There are a few hits to bacteria that map within the genome, which were further tested to insure they belong on contigs which have multiple fungal proteins on them as well.
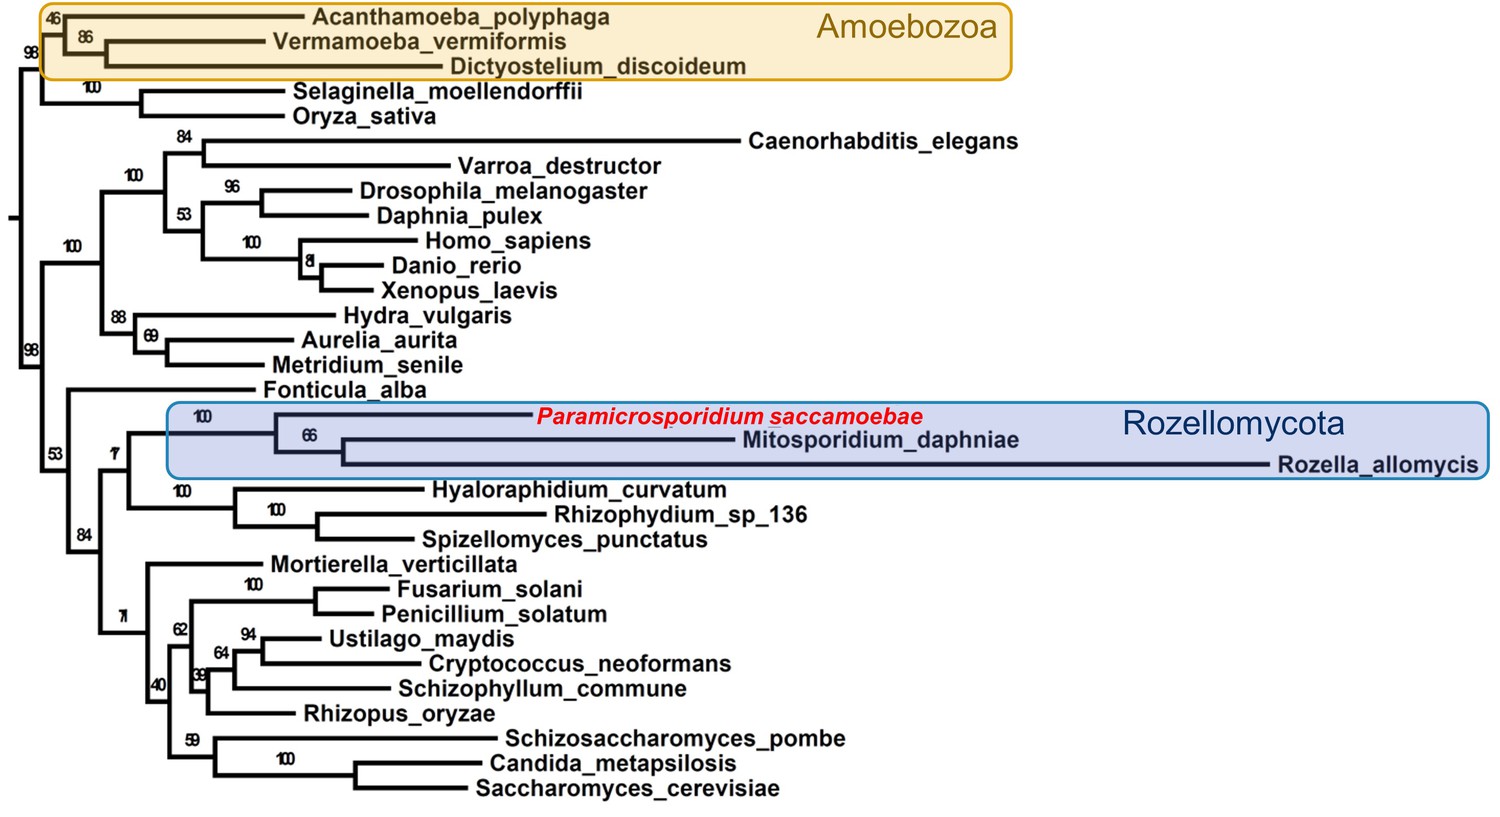
Figure 2 with 2 supplements
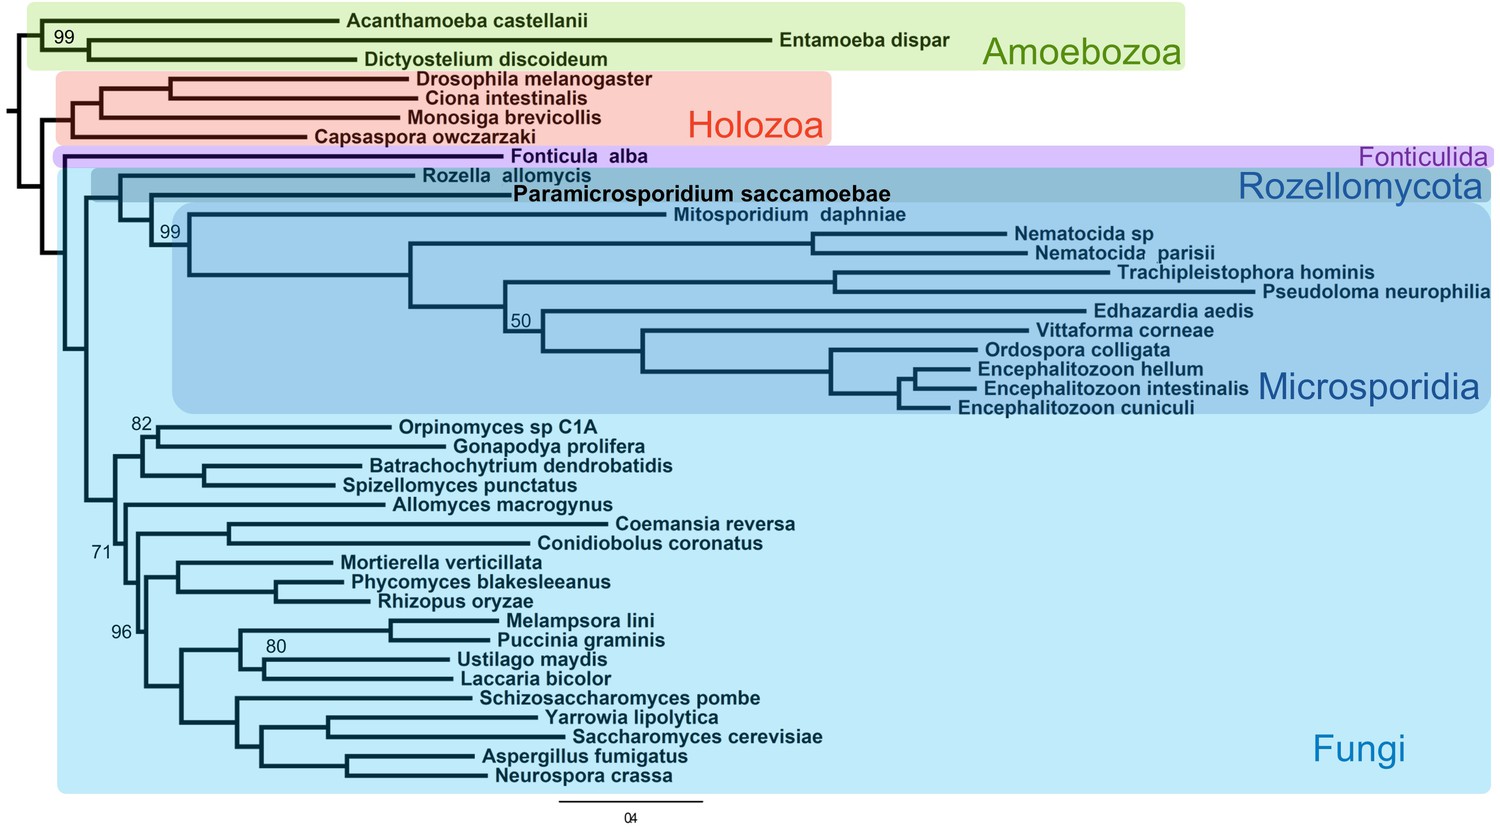
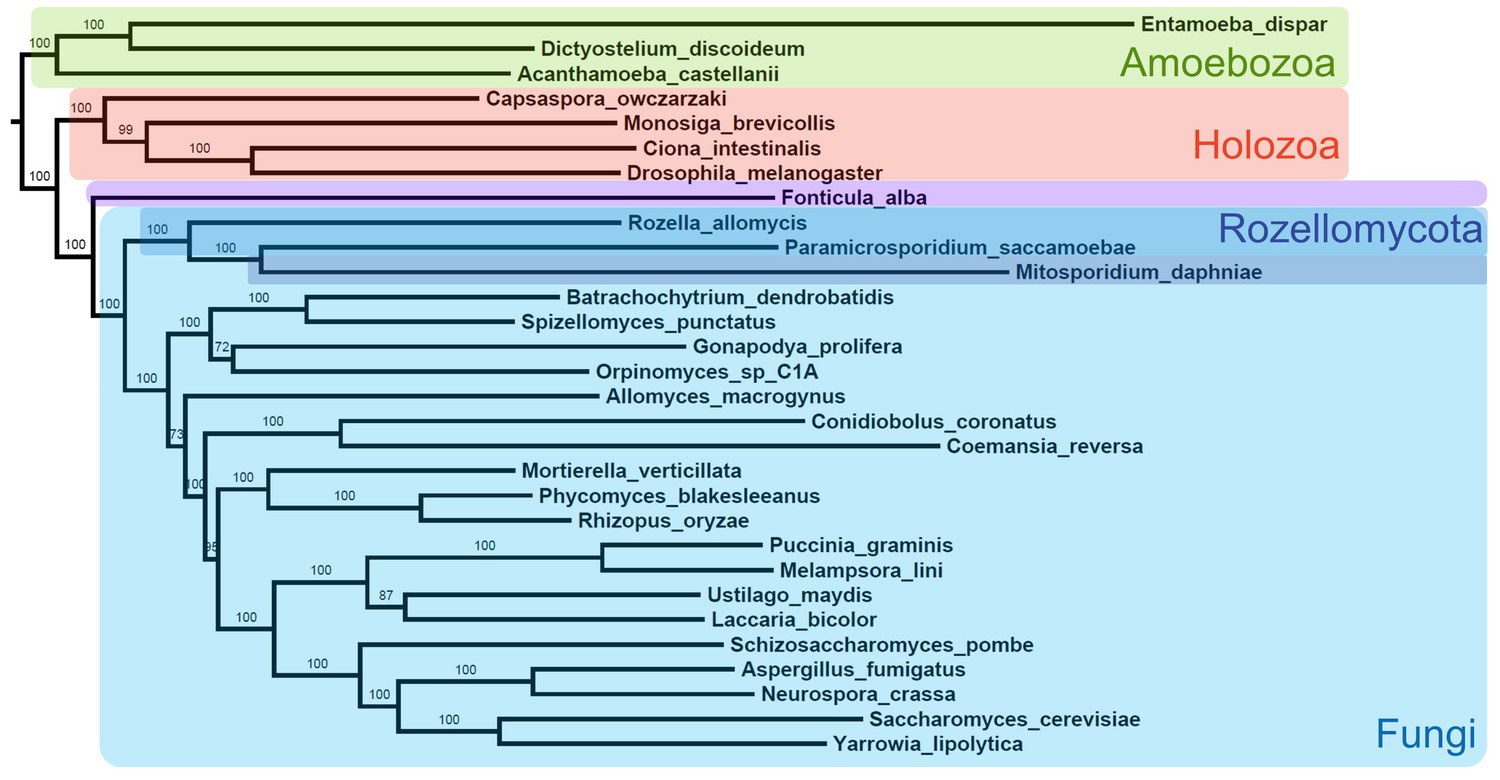
Maximum likelihood phylogenomic analysis of 53 proteins with 26,062 amino acid positions in the concatenated alignment and 500 bootstrap replicates.
All nodes have 100% bootstrap support except where marked. All Fungi are in shades of blue, and sequenced representatives of Amoebozoa are included as outgroups. Taxa, strains, and references for genomes used are included in Supplementary file 3.
Figure 2—figure supplement 1
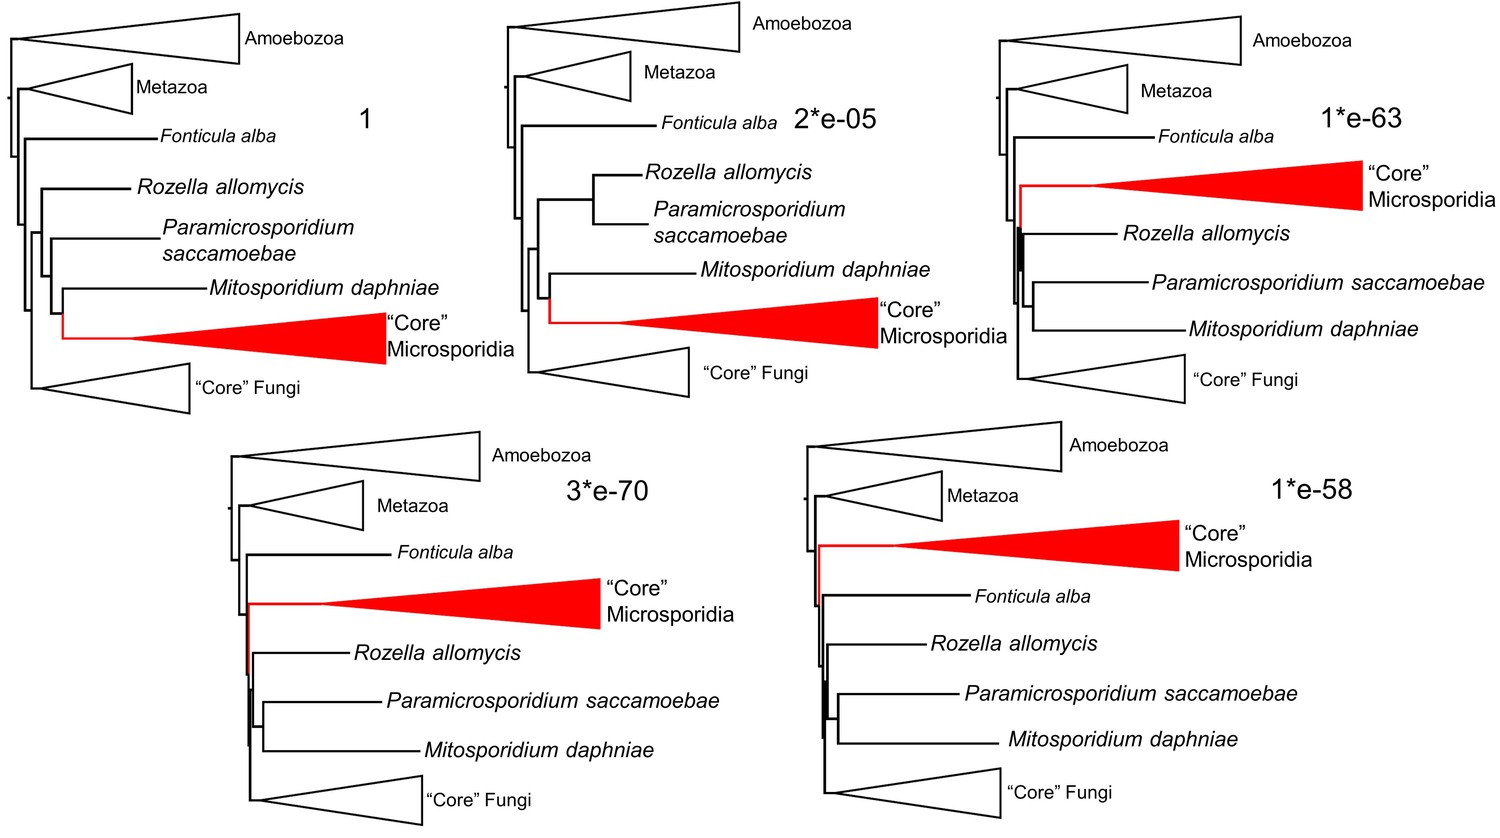
Consel alternative topology likelihood testing results.
Numbers next to each topology are the p-values of the approximately unbiased test. The top left tree is the topological result of the phylogenomic analysis (Figure 2).
Figure 2—figure supplement 2
Alternative maximum likelihood phylogeny using same data from Figure 2 and analyzed with same options in RAxML but excluding all Microsporidia except M.daphniae.
https://doi.org/10.7554/eLife.29594.006
Figure 3 with 2 supplements
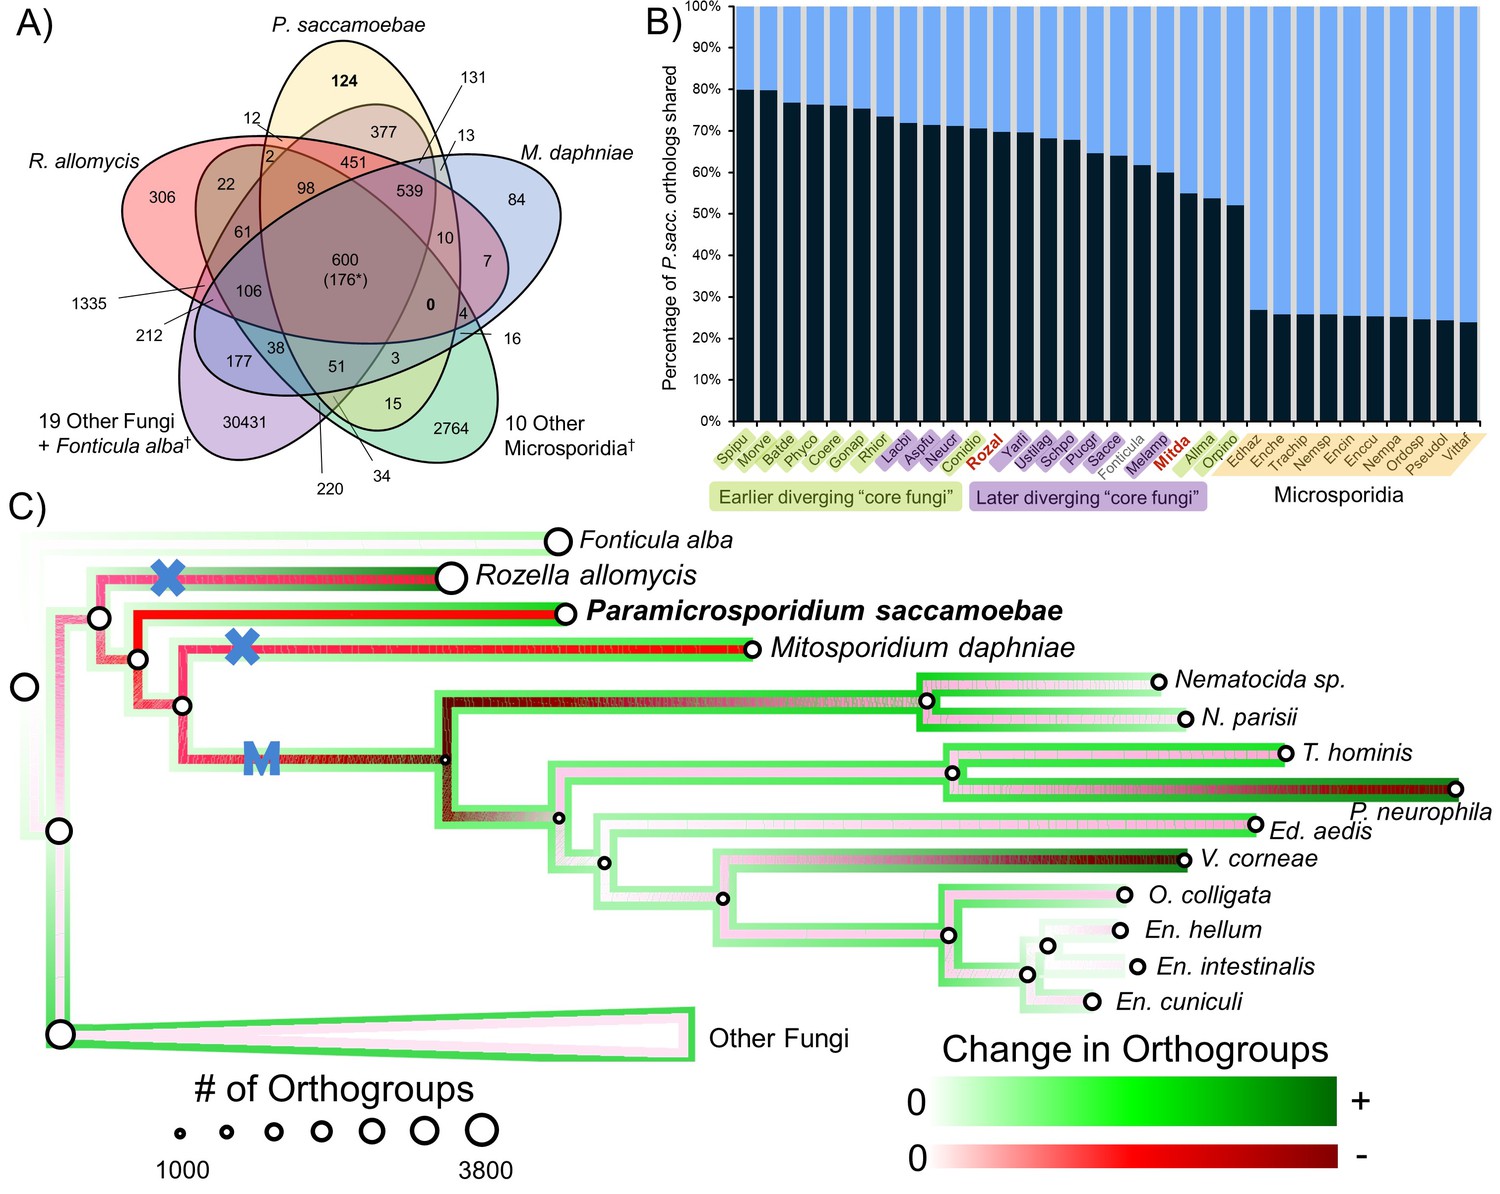
Analysis of orthogroups in Rozellomycota and Microsporidia.
(A) Venn diagram of orthologous clusters shared and unique to P. saccamoebae, related taxa, and other Fungi. *At least one copy present in all 33 taxa. †Numbers reflect presence of at least one species from these groups in a cluster. (B) Graphical representation of percentage of P. saccamoebae orthologs shared with other Fungi (and the outgroup Fonticula alba). Its closest sequenced relatives, R. allomycis and M. daphniae, are in red text. (C) Ancestral reconstruction of orthologous cluster gains and losses highlighting the independent reductions in the mitochondrion (X) and loss of true mitochondrion (M) which unites the ‘core Microsporidia.’ Diameter of circles is relative to the number of orthogroups present in terminal taxa and reconstructed ancestors. To illustrate the quantity of both gains and losses throughout the evolution of this clade, the outside track shows relative amount of orthogroups gained (in shades of green), while the inside track is showing the relative amount of orthogroups lost (shades of red); the lighter the shade of green or red, the fewer respective gains or losses are reconstructed at that node.
-
Figure 3—source data 1
Orthologous cluster raw data for graphs (Figure 3B, Figure 3—figure supplements 1 and 2) and ancestral reconstruction (Figure 3C).
- https://doi.org/10.7554/eLife.29594.010
Figure 3—figure supplement 1
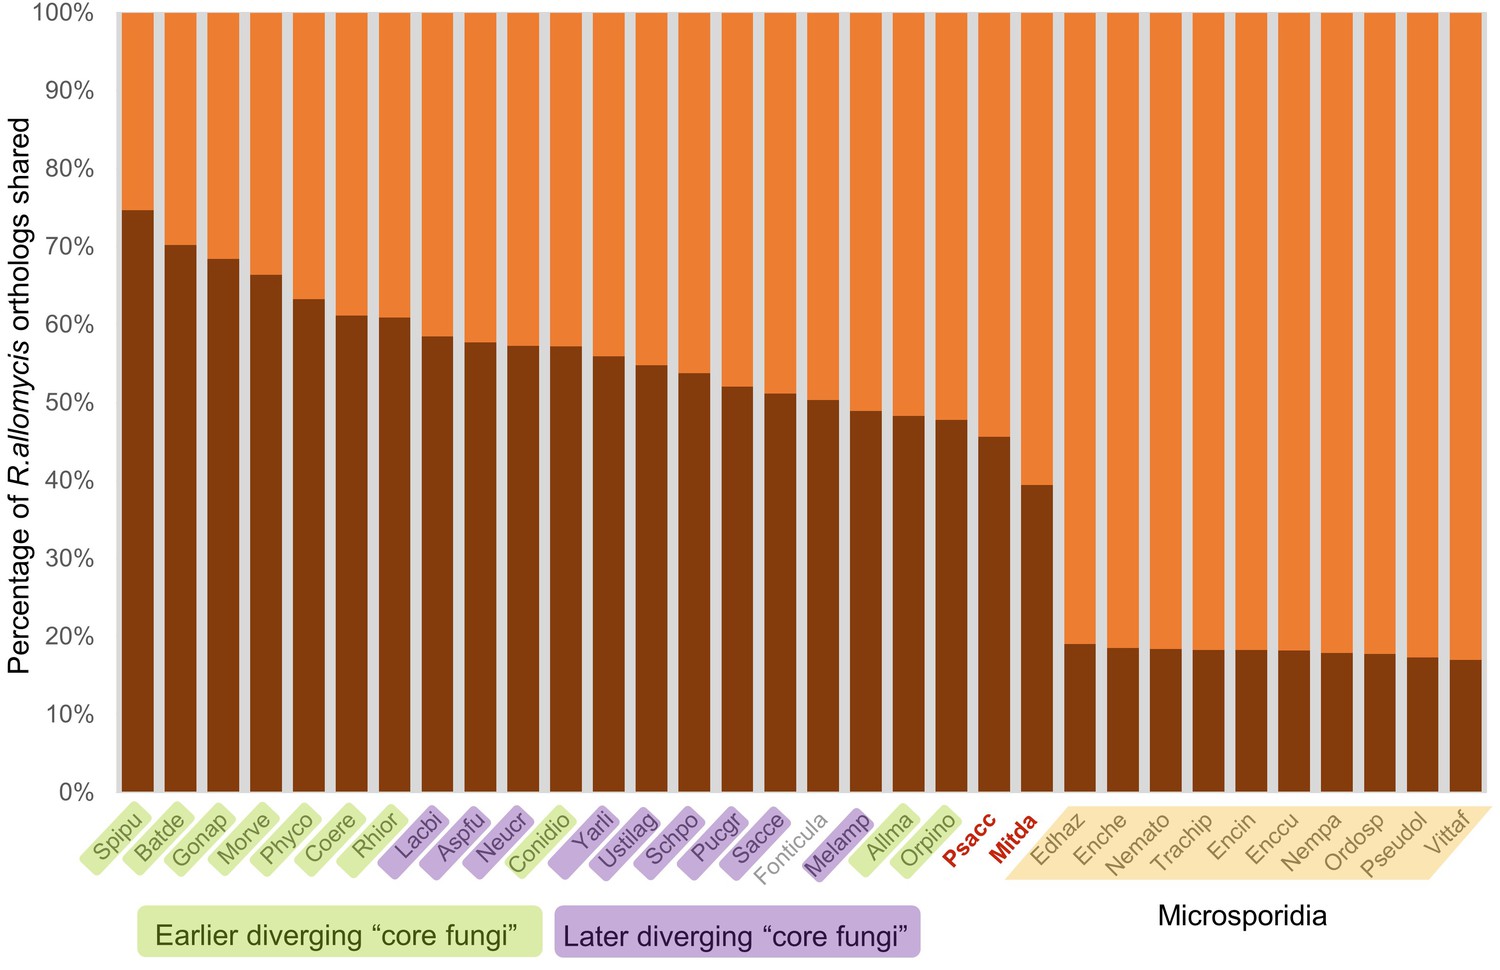
Graphical representation of percentage of R.allomycis orthologs shared (darker shade) with other Fungi (and the outgroup Fonticula alba).
Its closest sequenced relatives, P. saccamoebae and M. daphniae, are in red text.
Figure 3—figure supplement 2
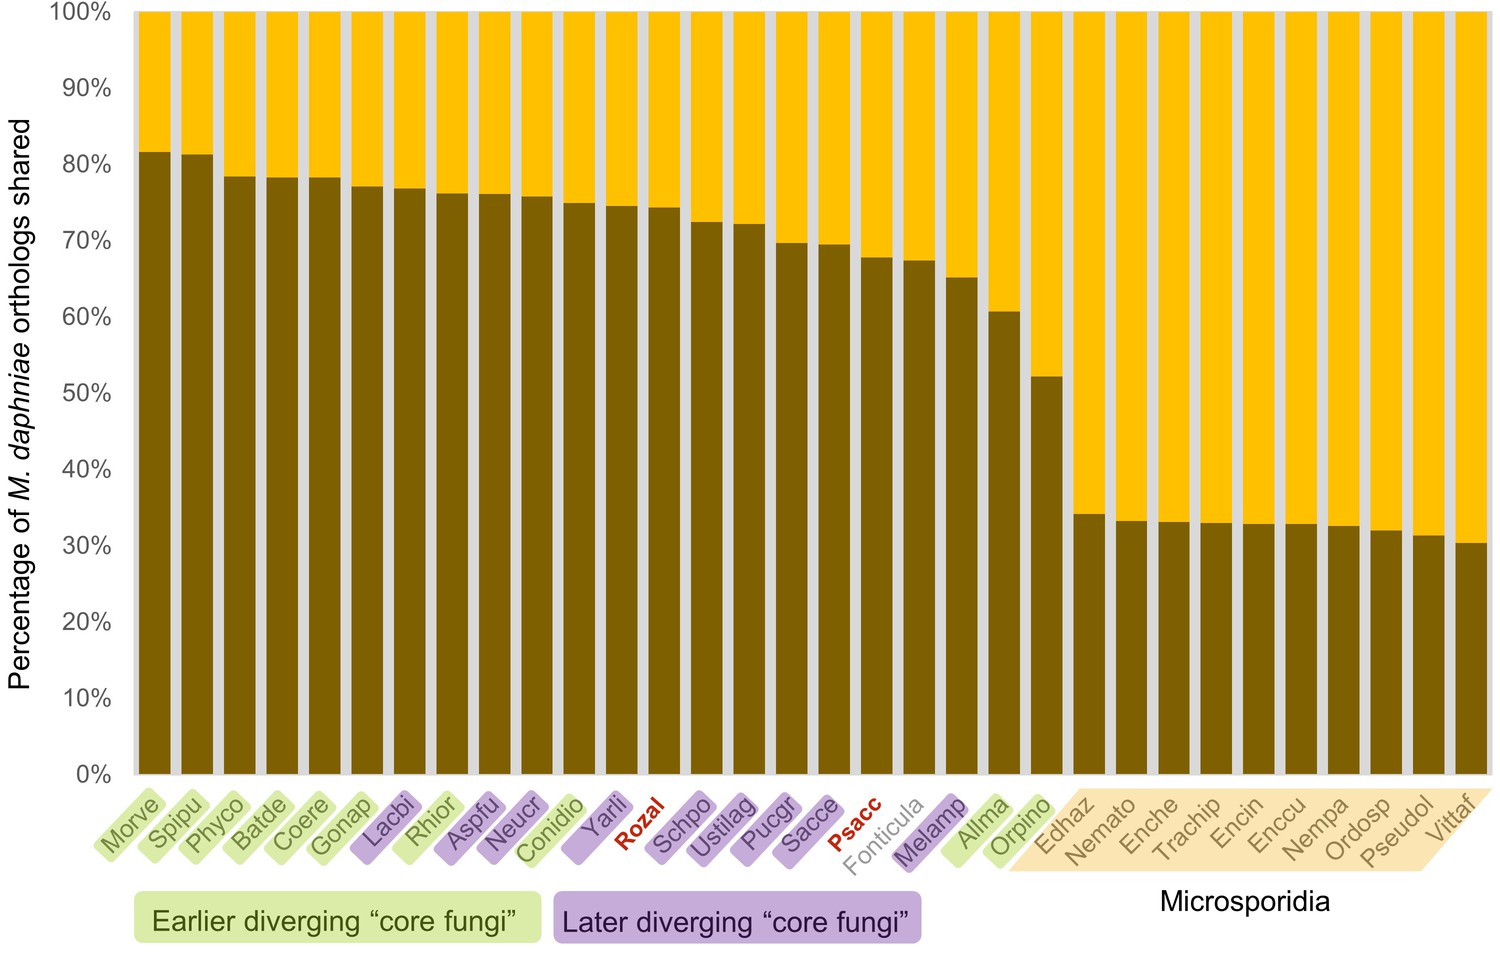
Graphical representation of percentage of M.daphniae orthologs shared (darker shade) with other Fungi (and the outgroup Fonticula alba).
Its closest sequenced relatives, P. saccamoebae and R. allomycis, are in red text.
Figure 4 with 2 supplements
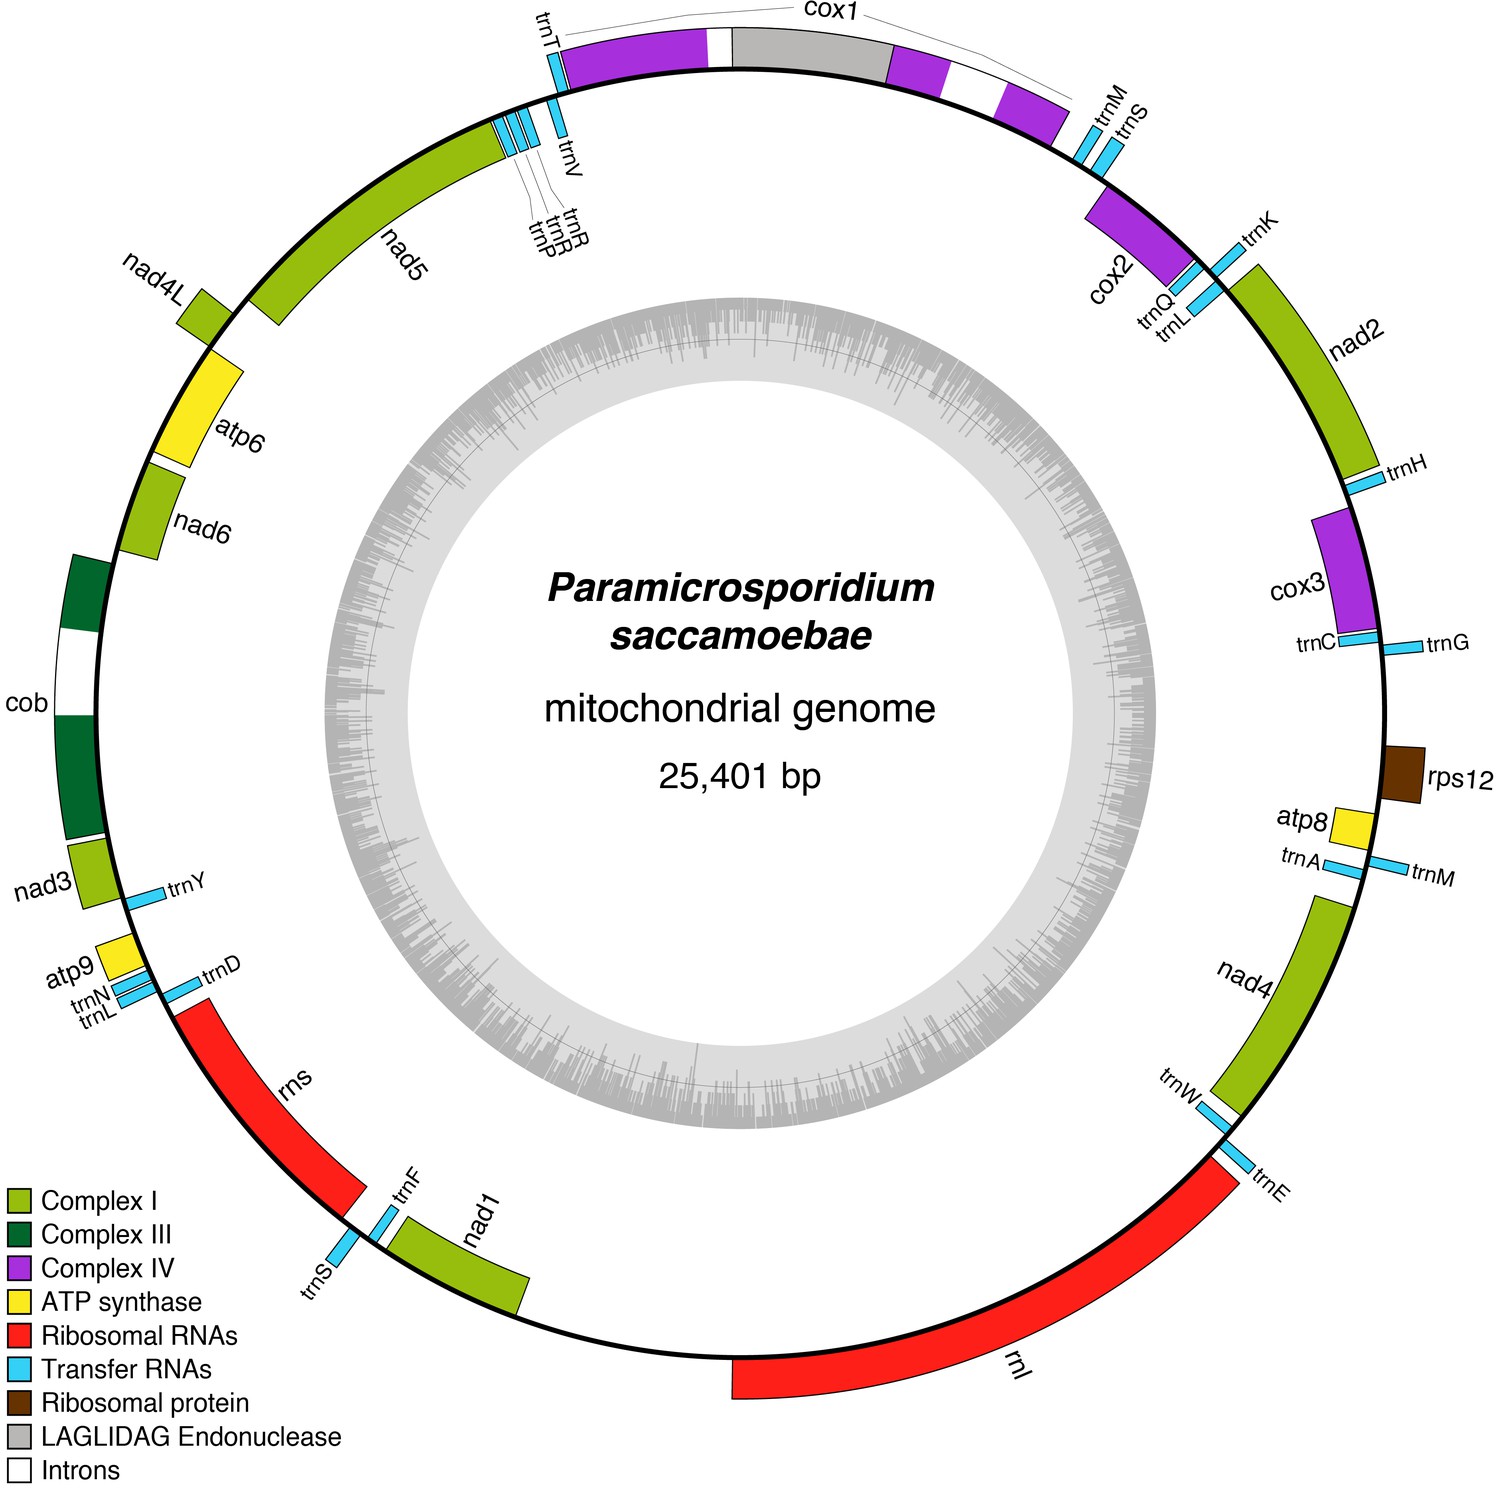
Reconstruction of the mitochondrial genome of P.saccamoebae with GC Content (represented by height of grey bars - black line is 50%) and gene annotations, which include the seven genes typically found in Fungi involved Complex I of oxidative phosphorylation.
https://doi.org/10.7554/eLife.29594.011
Figure 4—figure supplement 1
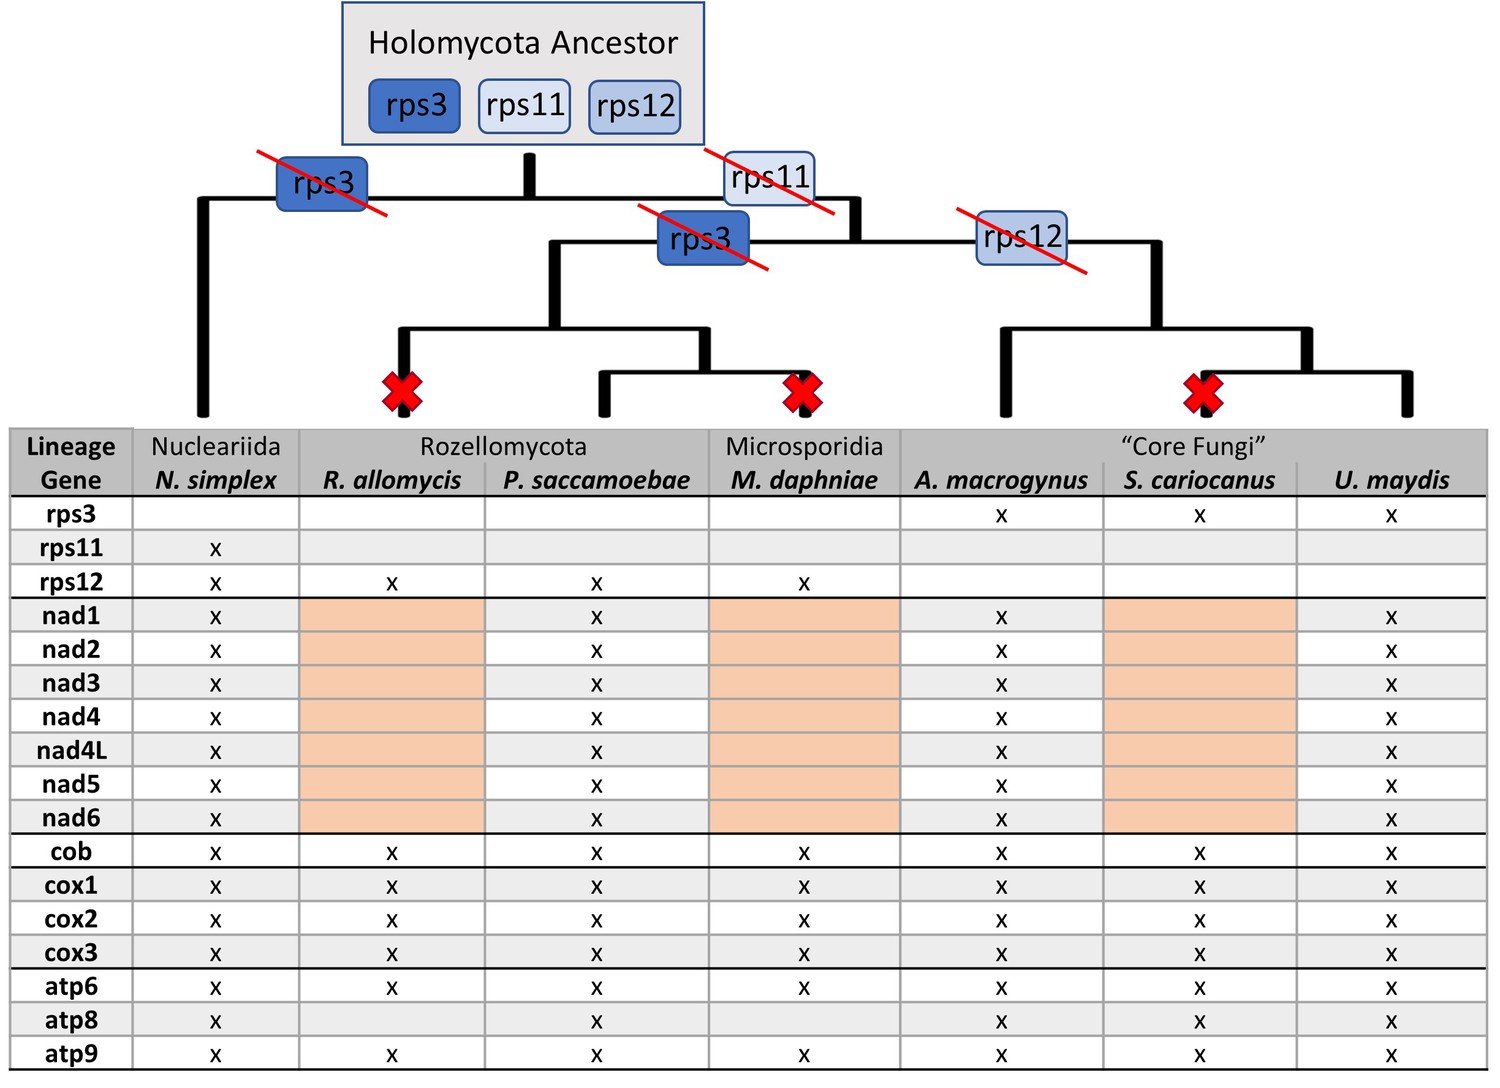
Presence and absence of mitochondrial genes in P.saccamoebae and related species.
Presence of mitochondrial genes (x) are shown in the table with major loss of the seven NADH dehydrogenase genes highlighted in pink. Major losses of genes in Complex I of oxidative phosphorylation (large red X) and ribosomal proteins (with red strike through) are mapped onto the phylogenetic relationships (inferred from nuclear phylogeny, Figure 2). Hypothetical mitochondrial ribosomal protein content of the ancestor to Holomycota is inferred to have rps3, rps11, and rp12, which have been retained differentially across the three lineages shown.
Figure 4—figure supplement 2
Maximum likelihood phylogeny of Mitochondrial genes cox1, cox2, cox3, cob1, and atp6.
There were 1177 amino acid positions in the concatenated alignment, and the PROTGAMMAWAG model was used for phylogenetic reconstruction in RAxML.
Figure 5
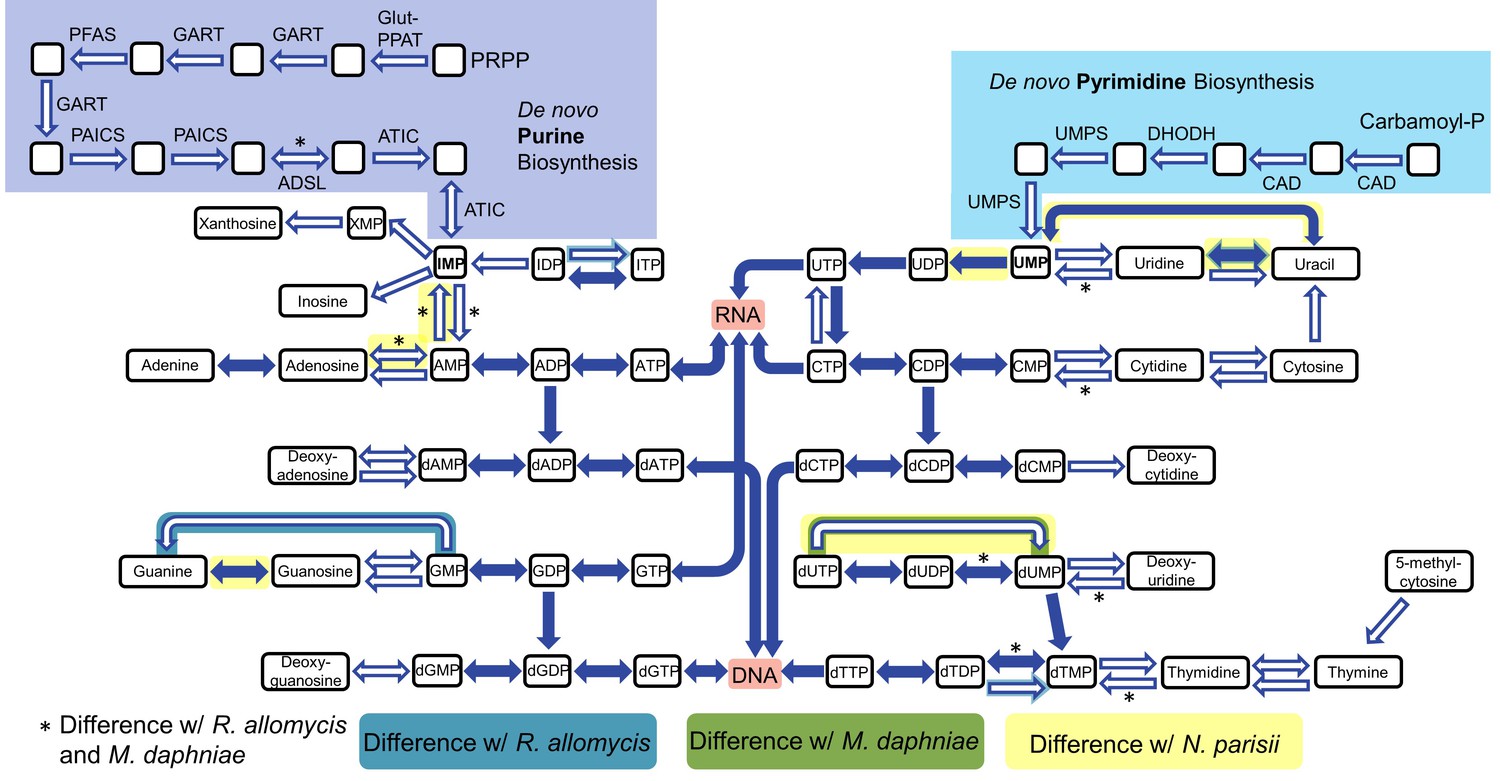
Nucleotide biosynthesis pathways present and absent in P.saccamoebae, and comparison with related taxa.
Hollow arrows are proteins not identified in the P. saccamoebae genome. Differences with P. saccamoebae are highlighted as specified in the key at bottom. Figure design adapted from Dean et al. (2016).
Figure 6
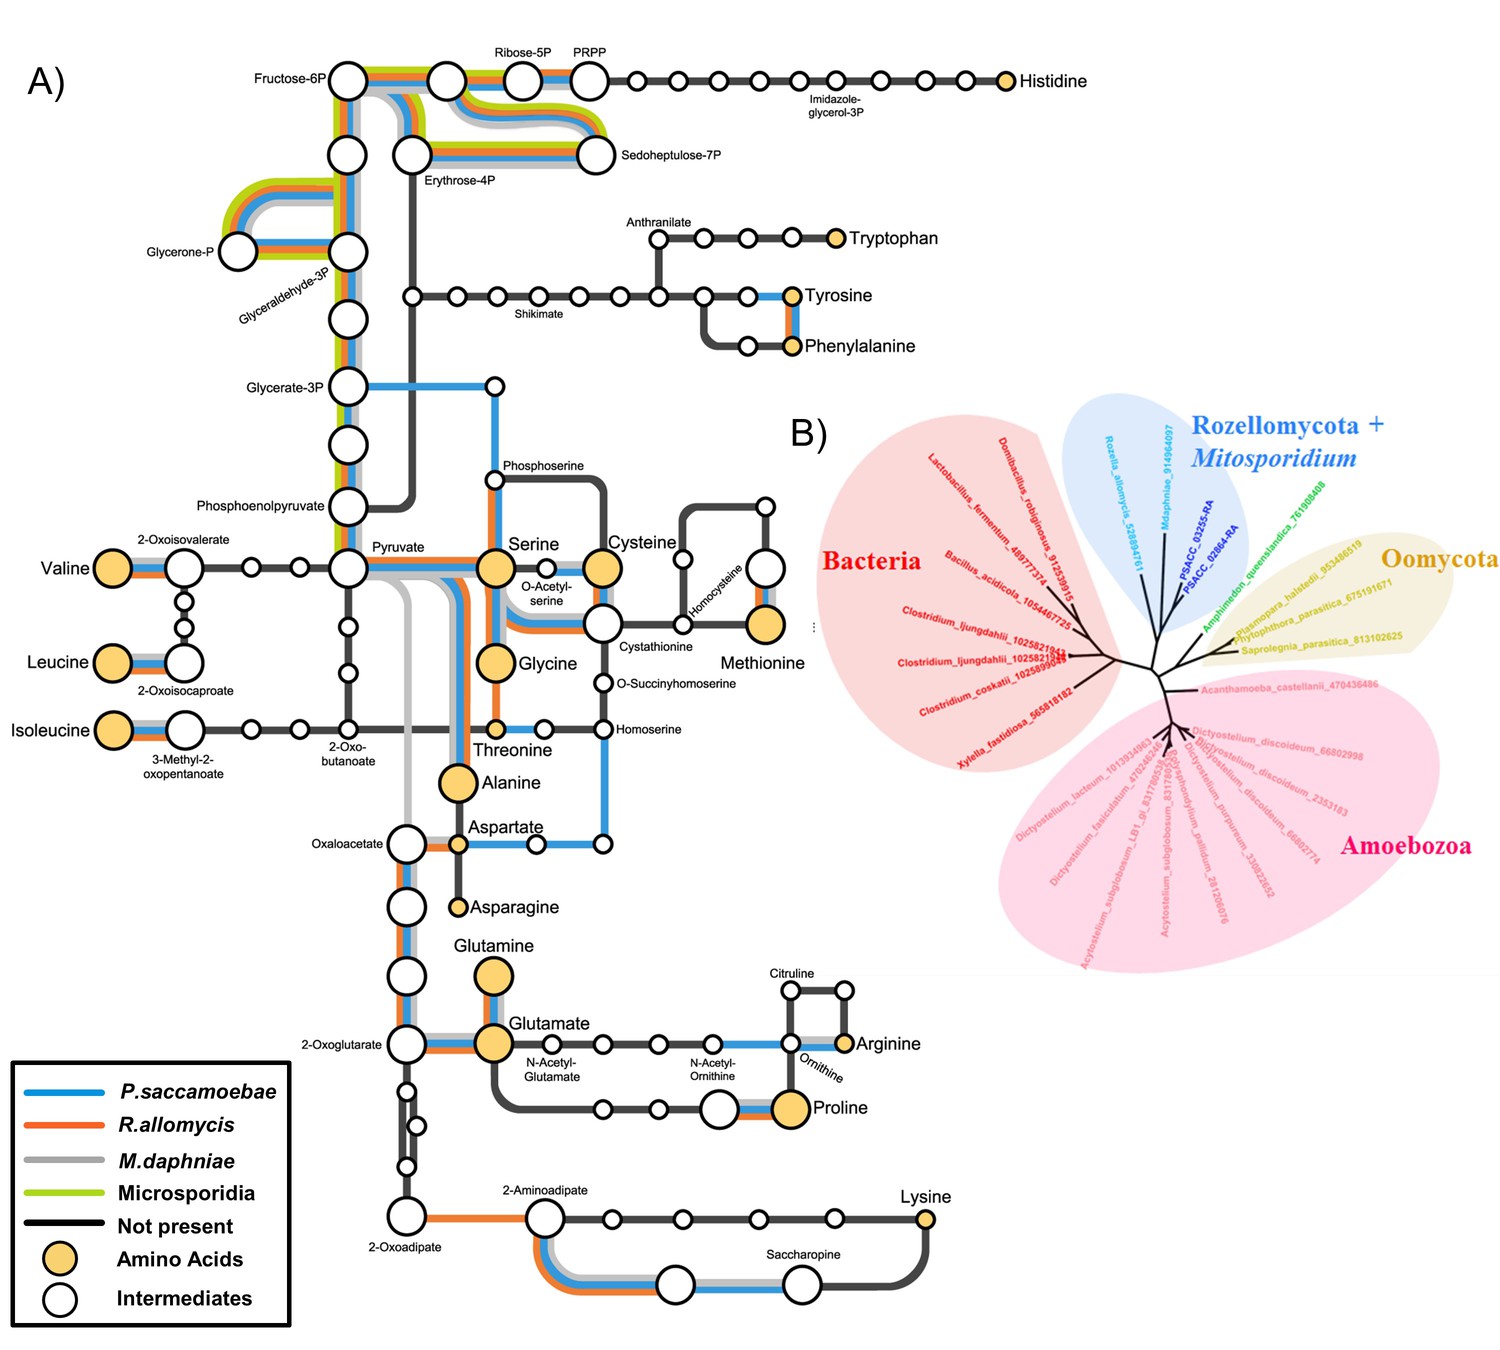
Amino acid biosynthesis capability and amino acid permeases in Rozellomycota and Mitosporidium daphniae and other Microsporidia.
(A) Amino acid biosynthesis map for selected taxa, with end products and intermediates, for P. saccamoebae, R. allomycis, M. daphniae, all of which contain lineage specific enzyme retentions, while other pathways, specifically the ability to produce serine, glycine, alanine, and cysteine are maintained in all three taxa. (B) Phylogenetic analysis of amino acid permeases in P. saccamoebae, R. allomycis, and M. daphniae, which are not found in other Microsporidia or any other Fungi.
Figure 7 with 1 supplement
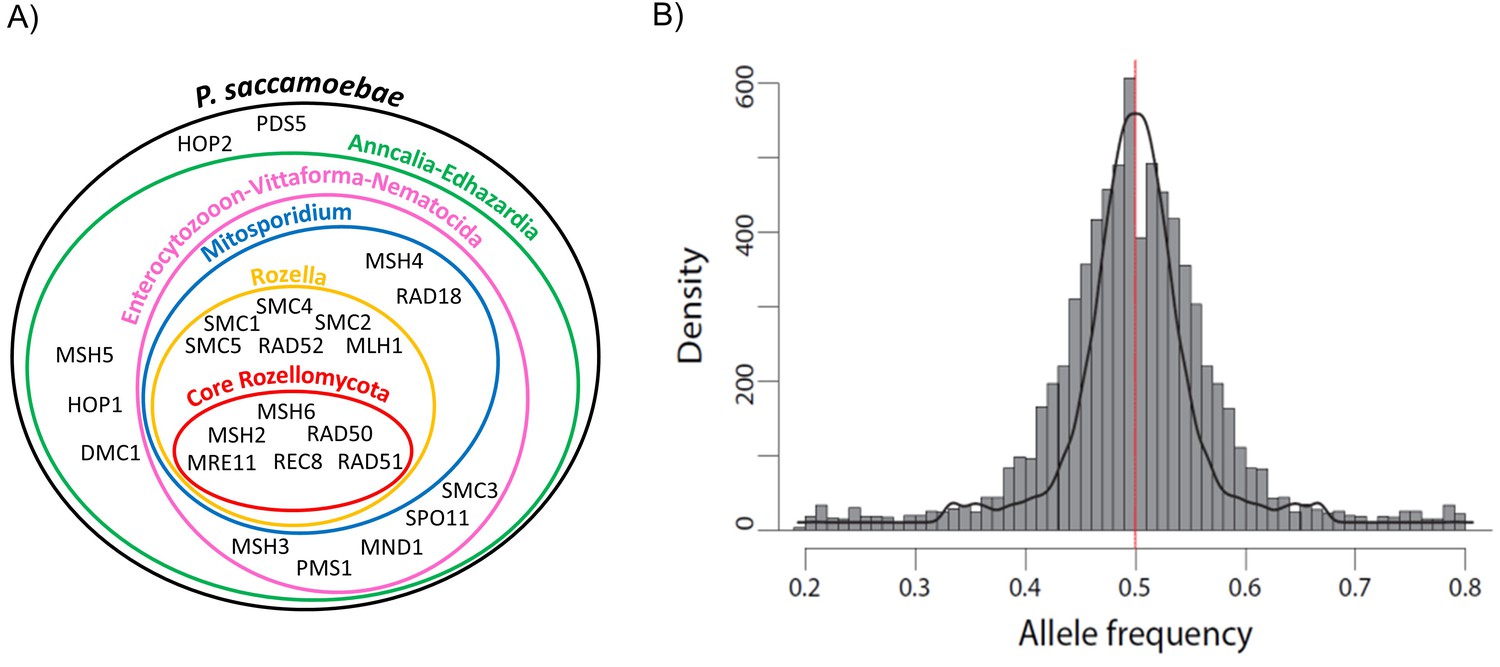
Schematic representation of Rozellomycota and Microsporidia meiotic genes and analysis of P. saccamoebae allele frequency.
(A) Venn diagram showing the presence or absence of the core genes known to be directly involved in meiotic processes. The presence or absence of these genes have been investigated in the genomes of P. saccamoebae and its relatives, including representative species belonging to the phylum Microsporidia, described in detail in Supplementary file 1. (B) Allele frequency analysis of P. saccamoebae genomic scaffolds. The histogram of allele frequency distribution is based on read counts of filtered bi-allelic SNPs and is overlapped by density curves (black). The vertical line (red) represents the 0.5 allelic frequency. A total of 3832 variable nucleotide positions were analyzed.
Figure 7—figure supplement 1
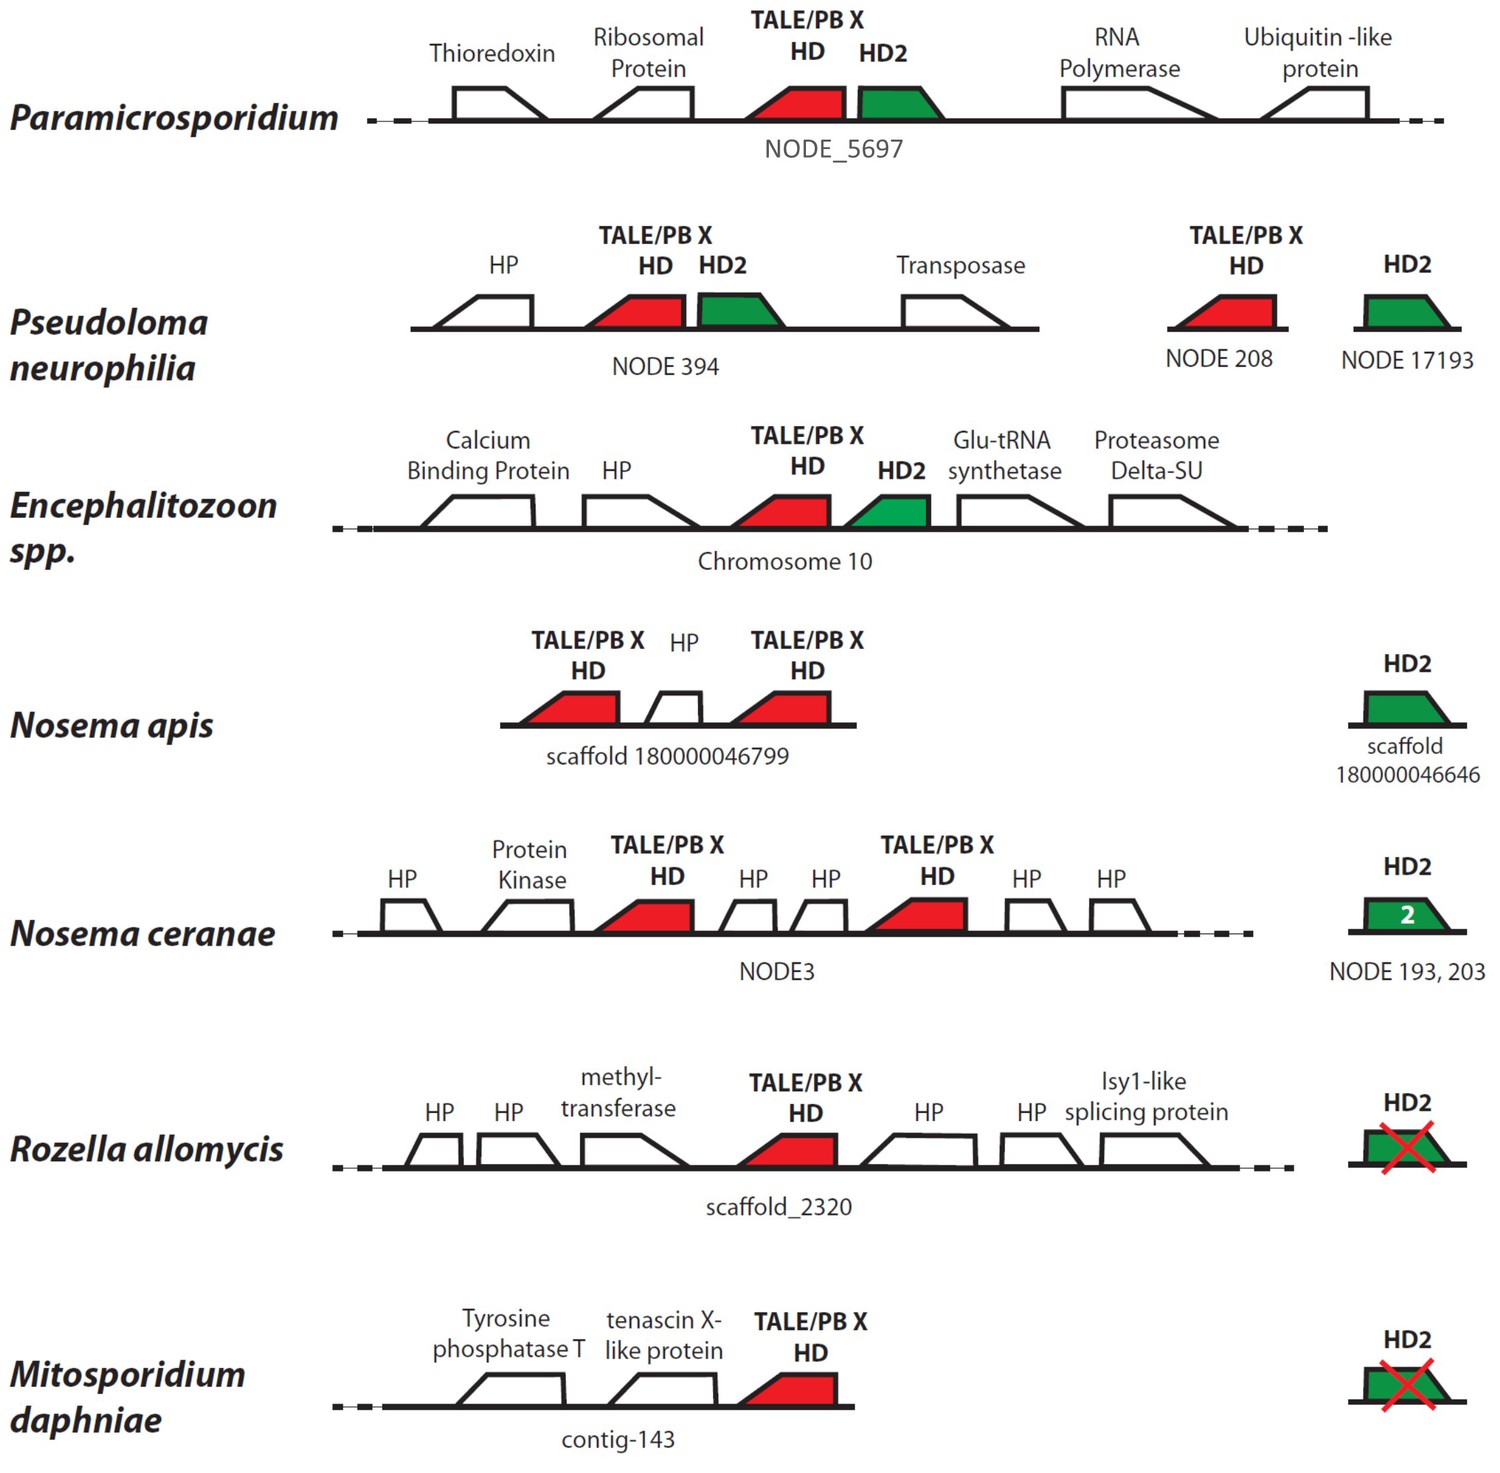
Homology and synteny comparison for homeodomain gene clusters in seven Microsporidia and Rozellomycota.
https://doi.org/10.7554/eLife.29594.017Tables
Table 1
Genome statistics for P. saccamoebae and previously sequenced relatives.
https://doi.org/10.7554/eLife.29594.003| Rozellomycota | Microsporidia | |||||
|---|---|---|---|---|---|---|
| Rozella allomycis | Paramicrosporidium saccamoebae | Mitosporidium daphniae | Trachipleistophora hominis | Encephalitozoon cuniculi | Nematocida parisii | |
| Genome size (Mb) | 11.86 | 7.28 | 5.64 | 8.5 | 2.5 | 4.15 |
| GC % | 34.5 | 46.9 | 43 | 34.1 | 47.3 | 34.5 |
| Number of scaffolds | 1059 | 221 | 612 | 310 | 11 | 53 |
| Longest scaffold (bp) | 719,121 | 261,540 | 115,468 | -- | -- | -- |
| L50 | 52 | 29 | 51 | 212 | 6 | 9 |
| # protein models | 6350 | 3750 | 3331 | 3212 | 1996 | 2726 |
Additional files
-
Supplementary file 1
Presence (x) and absence (-) of conventional meiosis genes within Microsporidia and Rozellomycota species.
Annotations of P. saccamoebae meiosis related homologs given in first column.
- https://doi.org/10.7554/eLife.29594.018
-
Supplementary file 2
Flagellum-related protein presence or absence in several Fungi, animals, and oomycetes.
Across the top row, possession of a flagellum – yes, no, or unknown (?). Amended to and modified from James et al. (2013).
- https://doi.org/10.7554/eLife.29594.019
-
Supplementary file 3
Information and references about genome data used for all comparative analyses (Figure 3) and for protein annotation in the Maker pipeline.
- https://doi.org/10.7554/eLife.29594.020
-
Supplementary file 4
Polar filament proteins (PFPs) and their accession numbers used to search P. saccamoebae genome.
- https://doi.org/10.7554/eLife.29594.021
-
Transparent reporting form
- https://doi.org/10.7554/eLife.29594.022
Download links
A two-part list of links to download the article, or parts of the article, in various formats.
Downloads (link to download the article as PDF)
Open citations (links to open the citations from this article in various online reference manager services)
Cite this article (links to download the citations from this article in formats compatible with various reference manager tools)
The genome of an intranuclear parasite, Paramicrosporidium saccamoebae, reveals alternative adaptations to obligate intracellular parasitism
eLife 6:e29594.
https://doi.org/10.7554/eLife.29594


