Allosteric mechanism of the V. vulnificus adenine riboswitch resolved by four-dimensional chemical mapping
- Stanford University, United States
Figures
Figure 1 with 3 supplements

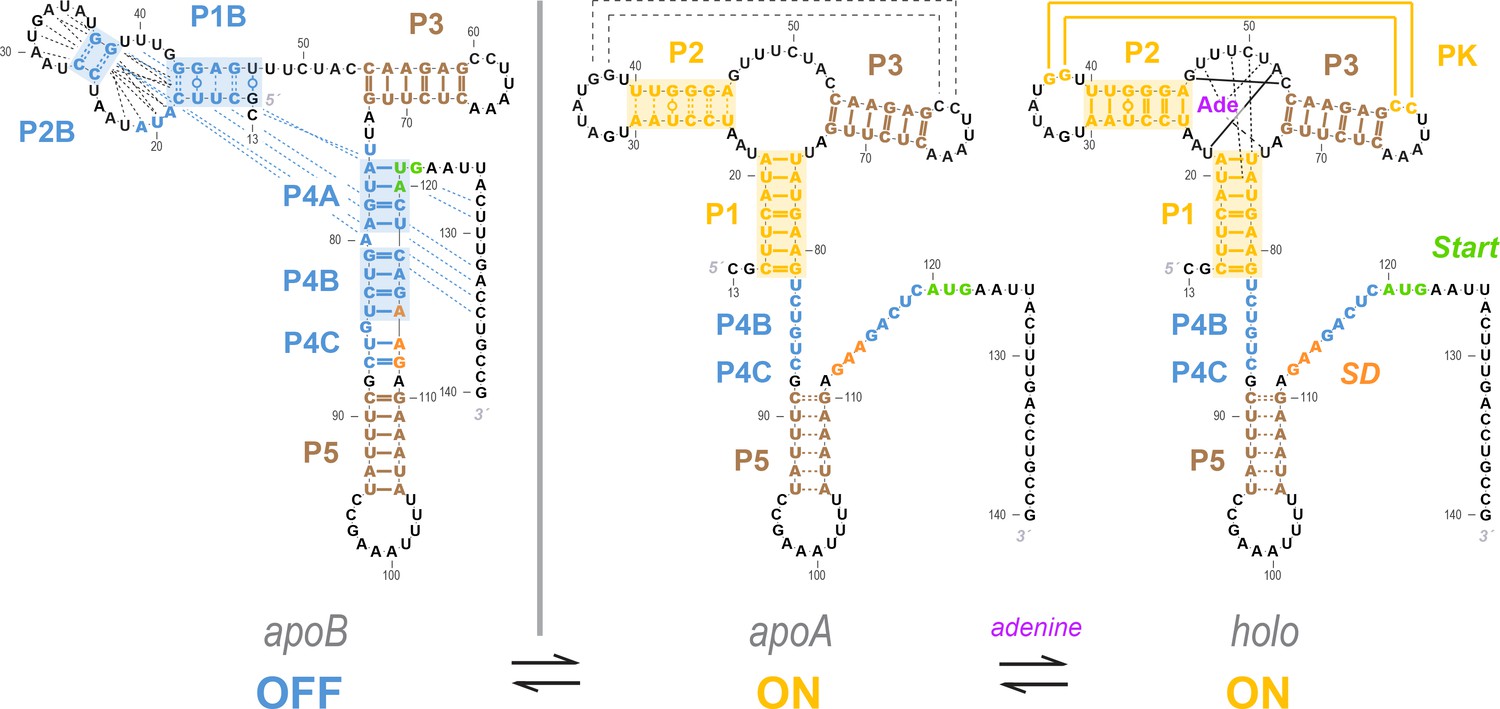
Models of the add riboswitch.
(A–B) Three-state models for conformational changes and ligand binding in the add riboswitch. In current models, there is an apoB state (left). This state is OFF (Shine-Dalgarno sequence and AUG start codon sequestered) and is also incompetent for ligand binding due to the aptamer’s rearrangement (blue background in both regions). The ligand-bound state holo (right) is ON with Shine-Dalgarno sequence and AUG codon (gene expression platform, cross-hatched) exposed and the aptamer region folded into a secondary structure compatible with binding adenine (gold background in both regions; adenine is purple). The apoA state (center), defined as the transient adenine-free conformation with an aptamer fold ready for ligand binding (gold background), differs in the two models. (A) In a Monod-Wyman-Changeux model, apoA is assumed to be ON, with a similar expression platform to holo. (B) In a non-MWC model proposed in a prior study (Reining et al., 2013), the apoA state is ‘mixed’, with the aptamer fold ready for binding (gold) but the expression platform turned OFF as the Shine-Dalgarno sequence and AUG codon are sequestered into helices P4B and P4C (blue). (C–D) Cartoons of possible ligand-free structural ensembles allowing for myriad alternative secondary structures with only some helices shared with those in (A–B) or completely different helices. This description does not assume a three-state decomposition of (A–B), which does not take into account the possibility of other possible helices (pink arrows). In an MWC scenario (C), helices characteristic of the aptamer secondary structure (such as P1, highlighted gold) and helices characteristic of closed gene expression platform (such as P4B, highlighted blue) appear in different members of the structural ensemble, but never together. The helix frequencies are anticorrelated (equation above cartoon). In non-MWC scenario (D), both kinds of helices appear together in ‘mixed’ secondary structures (marked with red arrows) at joint frequencies similar to the product of their individual occurrence frequencies (equation above cartoon).
Figure 1—figure supplement 1
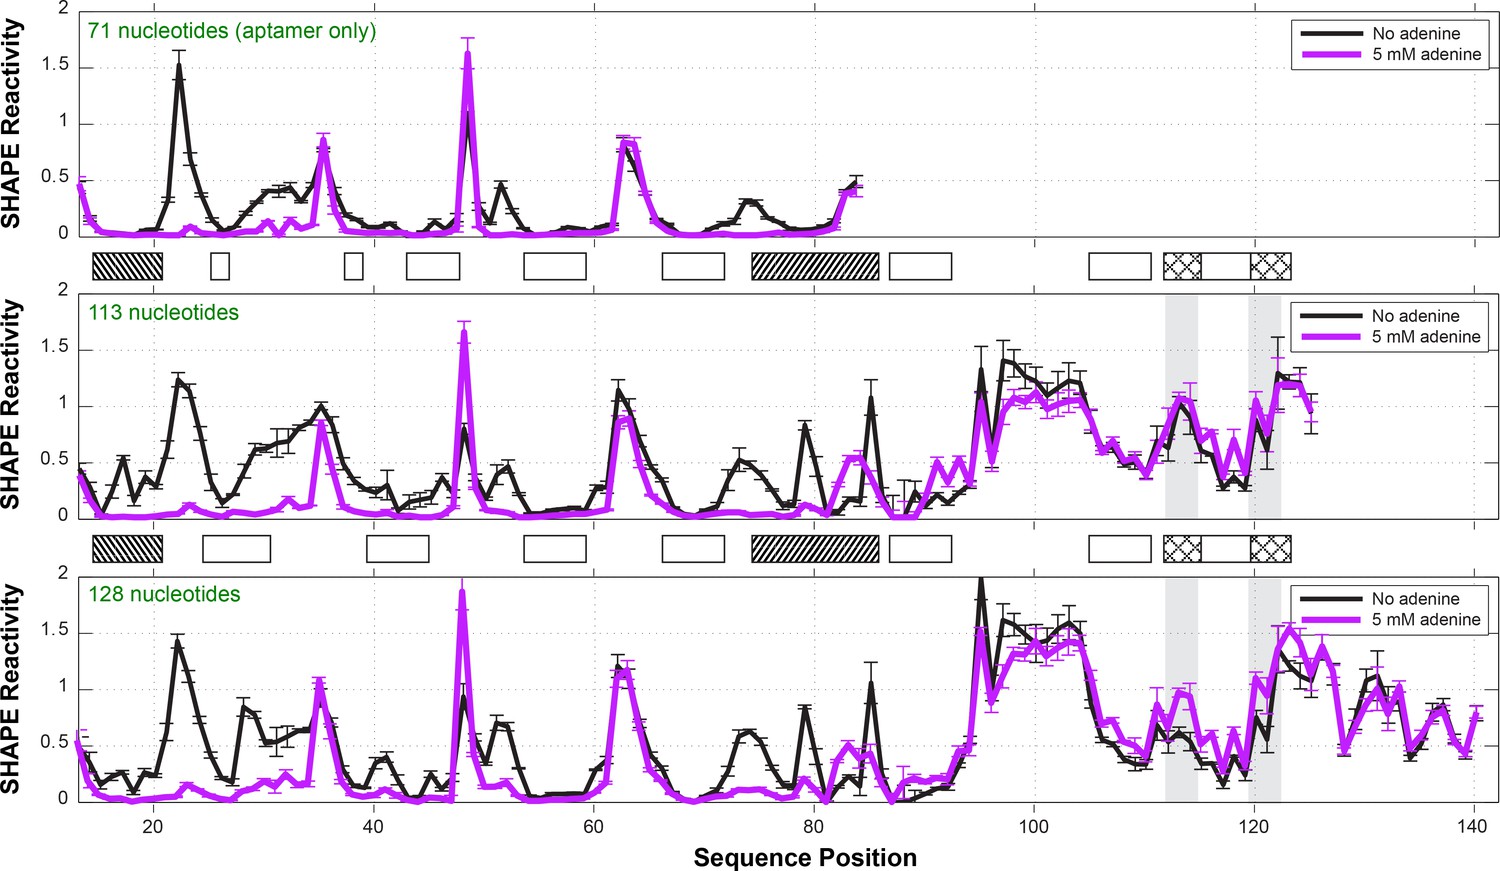
One-dimensional SHAPE profiles of add riboswitch constructs.
Three different constructs were probed by SHAPE: (top) a 71-nt aptamer only construct (nts 13–83); (middle) a 113-nt construct (nts 13–125) including the expression platform, matching the previous NMR study; (bottom) a 128-nt construct (nts 13–140) including the first 15 nt of the coding region. Reactivities are normalized based on GAGUA penta-loop reference hairpins that flank the RNA (not shown). Ligand-dependent reactivity changes in the aptamer domain (nts 15–83) occur in all three constructs. The 113-nt construct did not show significant switching for the Shine-Dalgarno sequence (nts 112–114) or AUG start codon (nts 120–122), highlighted in gray, with cross-hatched boxes between panels. The 128-nt construct was therefore used for all measurements in this manuscript. See also reference (Ali, 2011). Measurements were acquired in 10 mM MgCl2, 50 mM Na-HEPES, pH 8.0, in the absence or presence of ligand (5 mM adenine).
Figure 1—figure supplement 2
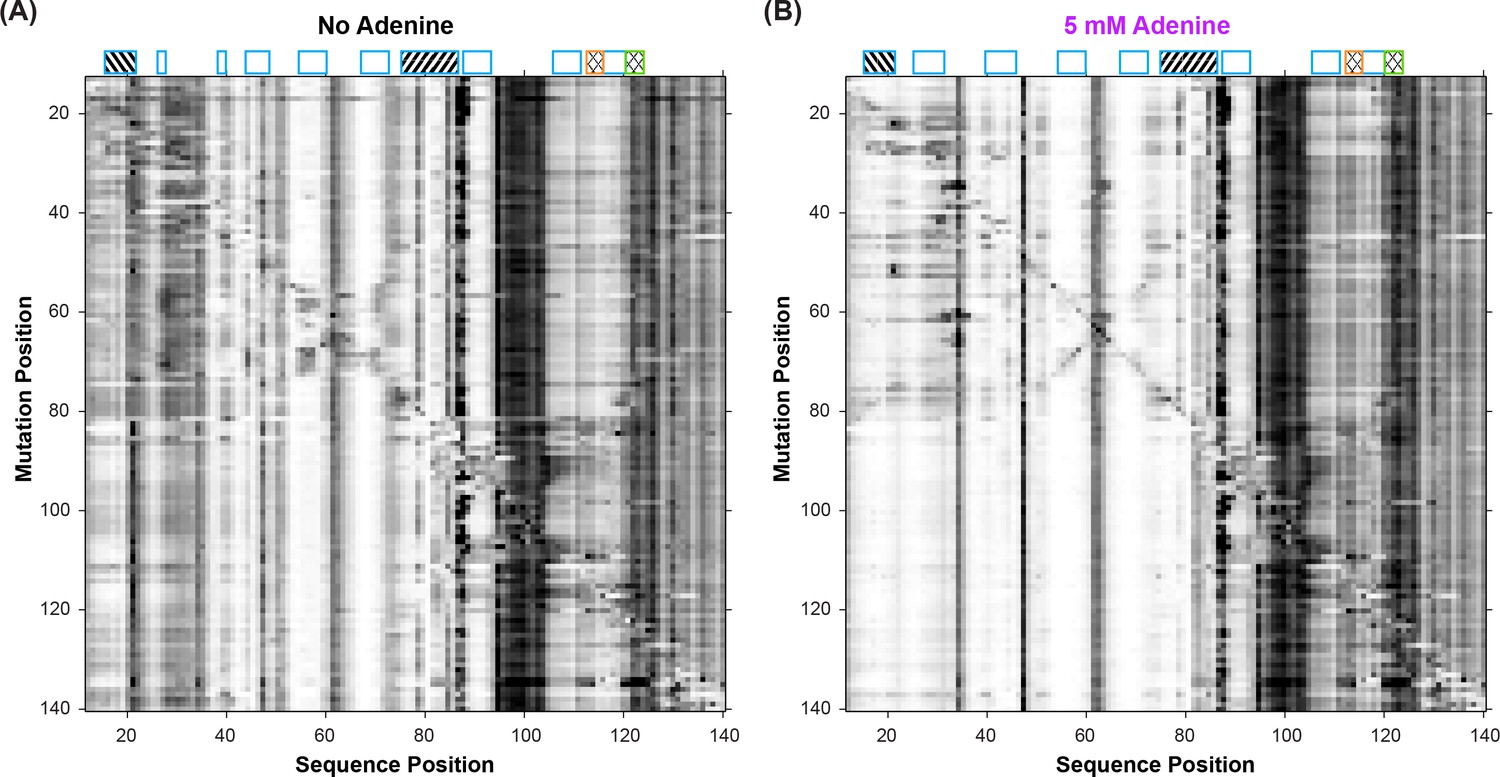
Mutate-and-map (M2) experiments on the add riboswitch.
Measurements were acquired in 10 mM MgCl2, 50 mM Na-HEPES, pH 8.0, in (A) the absence of adenine ligand and (B) in the presence of ligand (5 mM adenine).
Figure 1—figure supplement 3
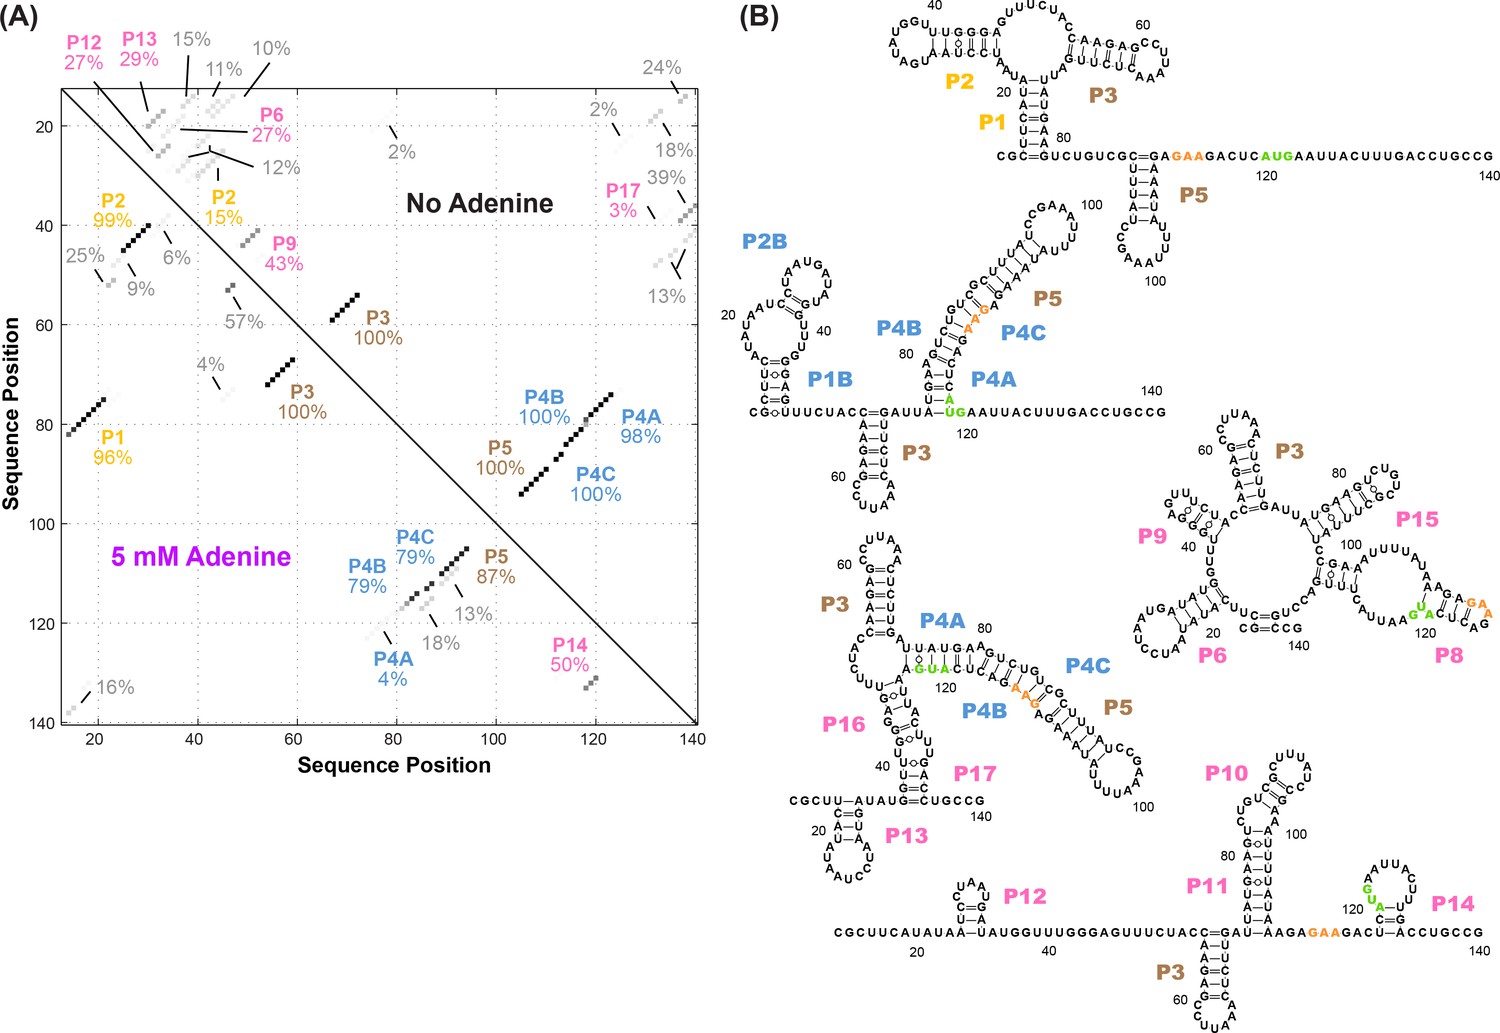
Candidate alternative helices from M2 analyses.
(A) Helices modeled to be in the adenine riboswitch based on M2 data with and without adenine, using prior analysis assuming a dominant secondary structure. To estimate uncertainties, simulated data replicates were prepared by bootstrapping, and percentages give fraction of the simulations in which each helix was inferred to be in the dominant secondary structure (Kladwang et al., 2011). While not recovering the actual helix frequencies in the solution ensemble, this initial analysis revealed a large number of possible helices that needed to be considered in modeling the ensemble, particularly for the adenine-free state. (B) Helices P6, P8-17 identified in the M2-guided structure analysis of (A) as well as a different model of the adenine-free ensemble based on the REEFFIT method (Cordero and Das, 2015) and the M2 data. These helices were individually tested by single base-pair M2R (see main text and Figure 4). The presented structures are for illustration of the helices only, and do not imply co-existence in the same structure. Helix name P7 was skipped to avoid a naming conflict with a previous REEFFIT investigation under different solution conditions (Cordero and Das, 2015).
Figure 2 with 1 supplement

Mutate-map-rescue (M2R) enables inference of helix frequencies.
(A) Interrogation of base pairs by compensatory mutagenesis and chemical mapping, illustrated on a four-way junction (nts 126–235) of the E. coli 16S ribosomal RNA. Experiments involve ‘quartets’ of SHAPE profiles for the wild type RNA, variants with single mutations on each side of a candidate base pair, and a variant with double mutations that could rescue Watson-Crick pairing of the candidate pair. Experiments involving possible pairings of G201 result in no obvious rescue (G201C-C207G), clear rescue (G201C-C217G), or an intermediate result (G201C-U216G), termed ‘partial rescue’. In partial rescue, some disruptions observed in single mutants are rescued, but other features are not rescued or arise in the double compensatory mutant (marked with yellow arrow). Panel adapted from ref (Tian et al., 2014). (B) Cartoon of structural ensembles that explain the ‘partial rescue’ scenario. A fraction of structures in the wild type ensemble have target base pair (cyan/blue, within helix outlined in gold); this picture assumes that those structures are disrupted in the single mutant but restored with similar fraction in the double mutant ensemble. (C) Correlation of observed rescue factor against helix frequency in simulated mutate-map-rescue experiments. Data are for helices with length longer than 2 bp for RNAs across 325 Rfam families mutated and folded in silico. Each data point represents a helix whose rescue factor and simulated helix frequency has been averaged across all its base-pairs. Helices are shaded in grays based on their length. The rescue factor estimates the extent of similarity restored in a double mutant’s reactivity compared to WT (wild type), scaled by perturbations observed in single mutants. (B) In silico M2R quartets illustrating full compensatory rescue (high rescue factor), partial rescue (medium rescue factor) and no rescue (low rescue factor).
Figure 2—figure supplement 1
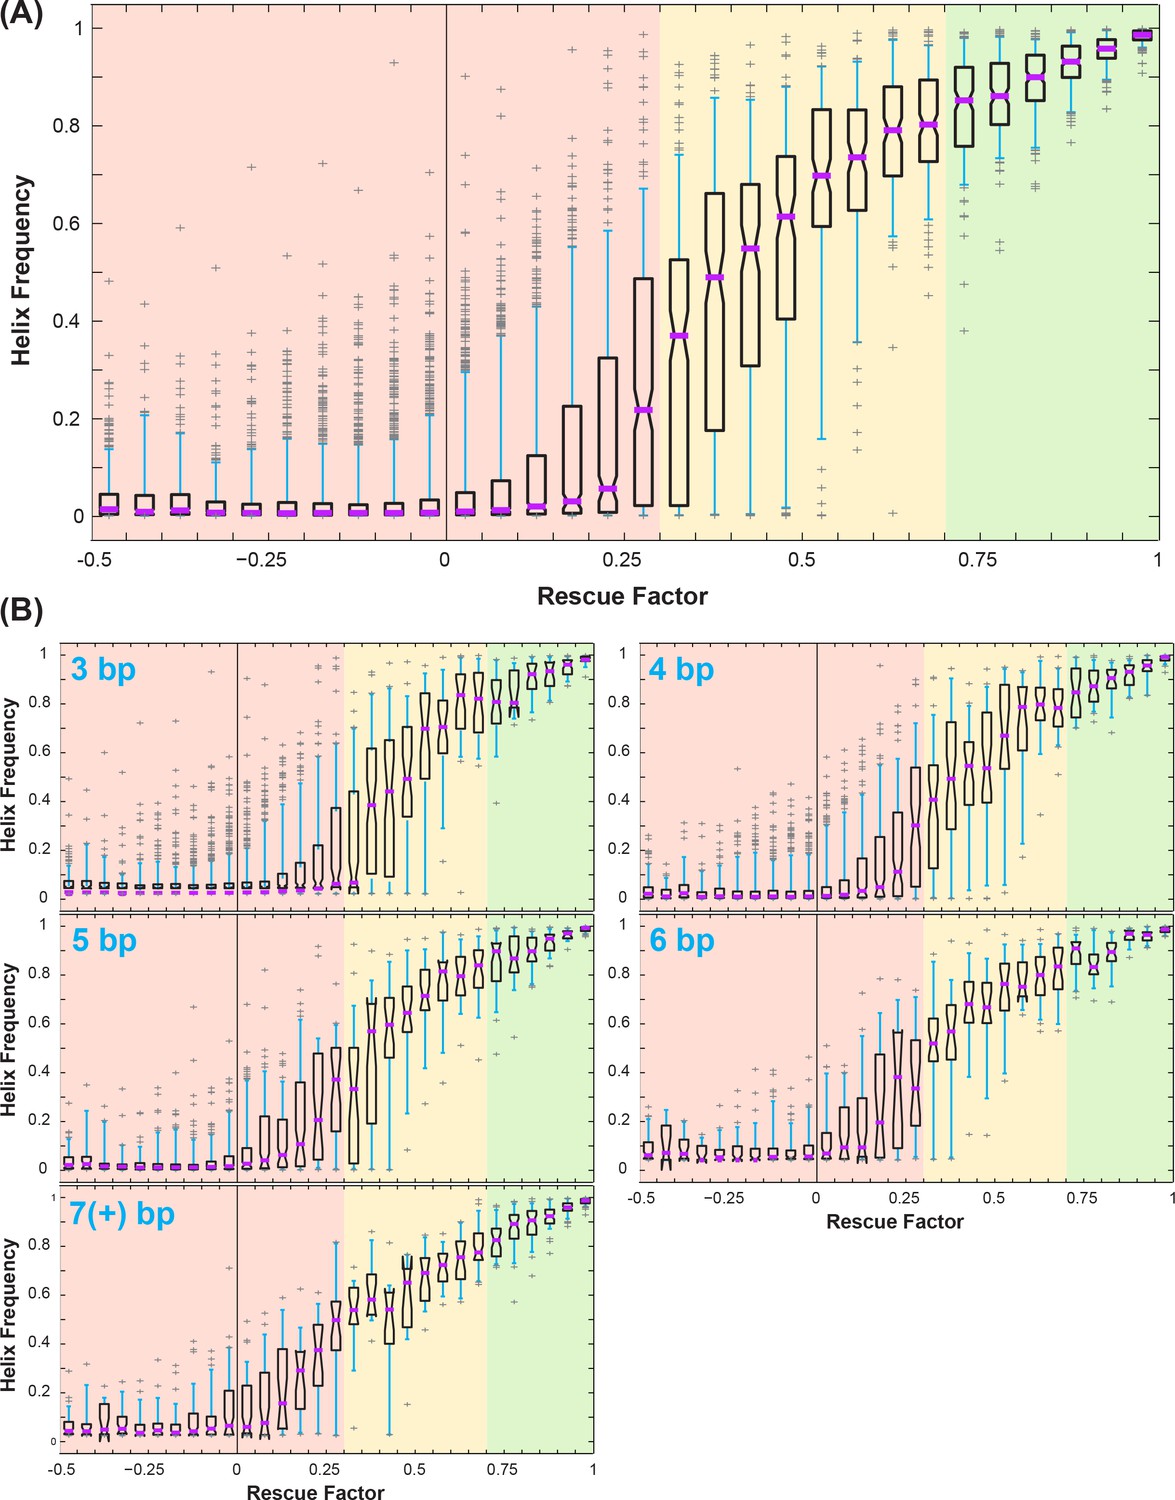
Correlation between rescue factor and helix frequency from Rfam simulations of mutate-map-rescue (M2R).
(A) Boxplots showing helix frequency vs. rescue factor, over all simulated helices. Purple lines mark median, open boxes cover 25th to 75th percentile, cyan whiskers show 5th and 95th percentile, and gray plus signs label outliers. Rescue factor ranges are colored in red, yellow, or green for low or no rescue (0 to 0.3), partial rescue (0.3 to 0.7), and strong rescue (0.7 and higher). (B) Boxplots showing how uncertainties in helix frequency (e.g. the 25th to 75th percentile range spanned by open boxes) decrease with the number of base pairs tested by mutate-map-rescue: 3, 4, 5, 6, and ≥7 base-pairs.
Figure 3 with 2 supplements
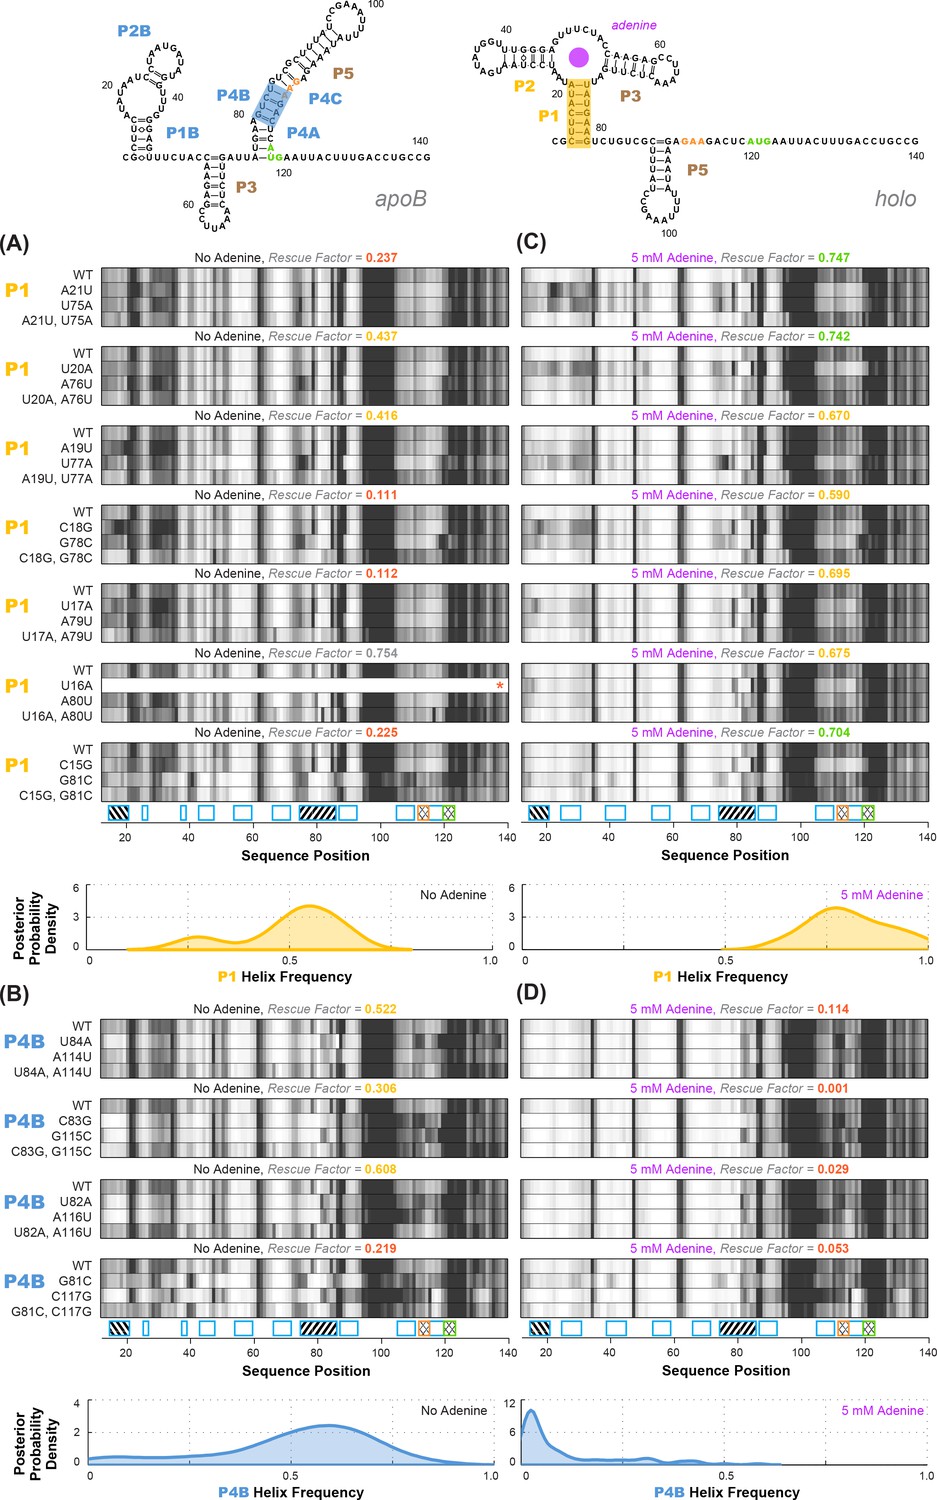
Experimental data and frequency estimates for helices P1 and P4B in the add riboswitch structural ensembles.
Top: two example secondary structures showing sequences of the add riboswitch and helices probed. The presented structures are for illustration of the helices only, and do not imply co-existence in the same structure. In (A-D), each panel shows (top) experimentally measured mutate-map-rescue (M2R) quartets for each base pair of a probed helix and (below) posterior distributions over helix frequency, estimated from the mean rescue factor in the M2R experimental data and simulations (see Figure 2—figure supplement 1). Experiments are shown probing (A) P1 helix without adenine, (B) P4B helix without adenine, (C) P1 helix with 5 mM adenine, and (D) P4B helix with 5 mM adenine. Measurements were acquired in 10 mM MgCl2, 50 mM Na-HEPES pH 8.0.
Figure 3—figure supplement 1
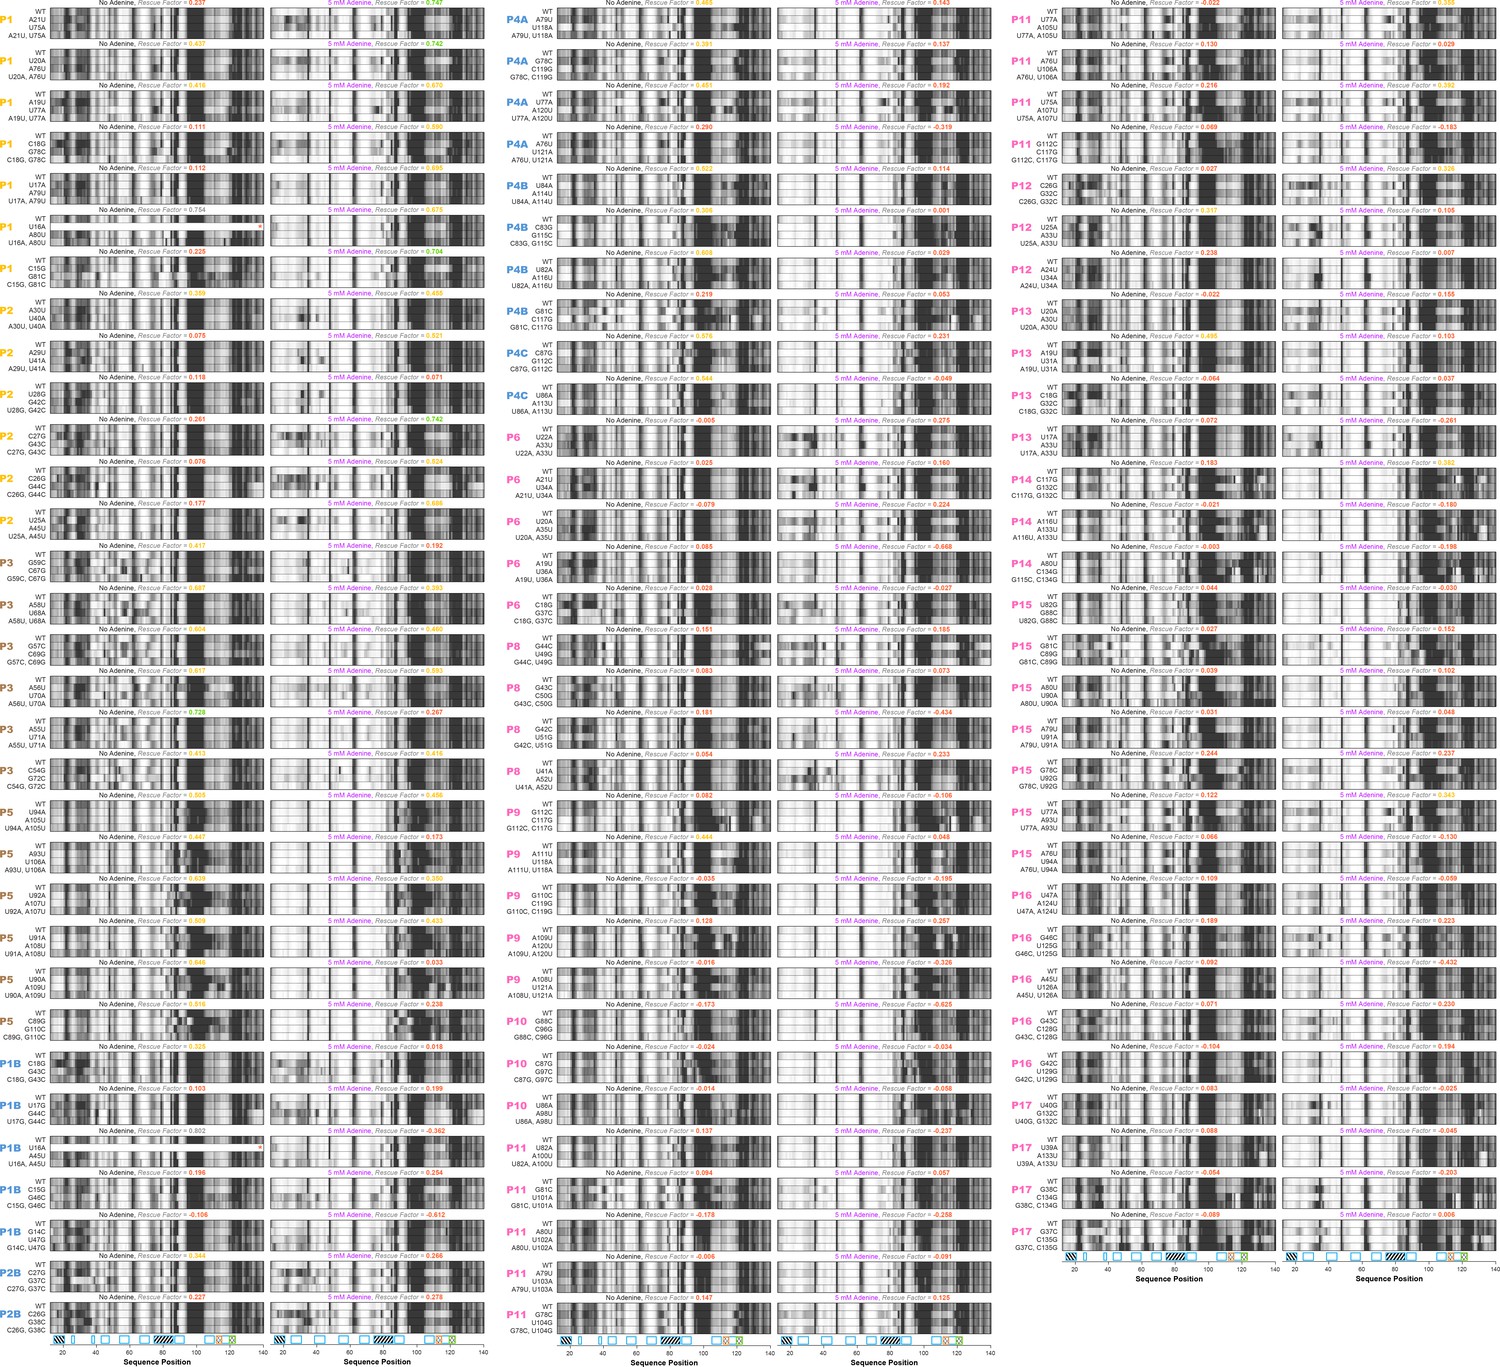
All 188 single base-pair M2R quartets for add riboswitch.
Helices P1 (7 bp), P2 (6 bp), P3 (6 bp), P5 (6 bp), P1B (5 bp), P2B (2 bp), P4A (4 bp), P4B (4 bp), P4C (2 bp), P6 (5 bp), P8 (4 bp), P9 (5 bp), P10 (3 bp), P11 (9 bp), P12 (3 bp), P13 (4 bp), P14 (3 bp), P15 (7 bp), P16 (5 bp), and P17 (4 bp) were tested for both no adenine and 5 mM adenine conditions. Rescue factor for each quartet is given in the title and colored as in Figure 2—figure supplement 1.
Figure 3—figure supplement 2
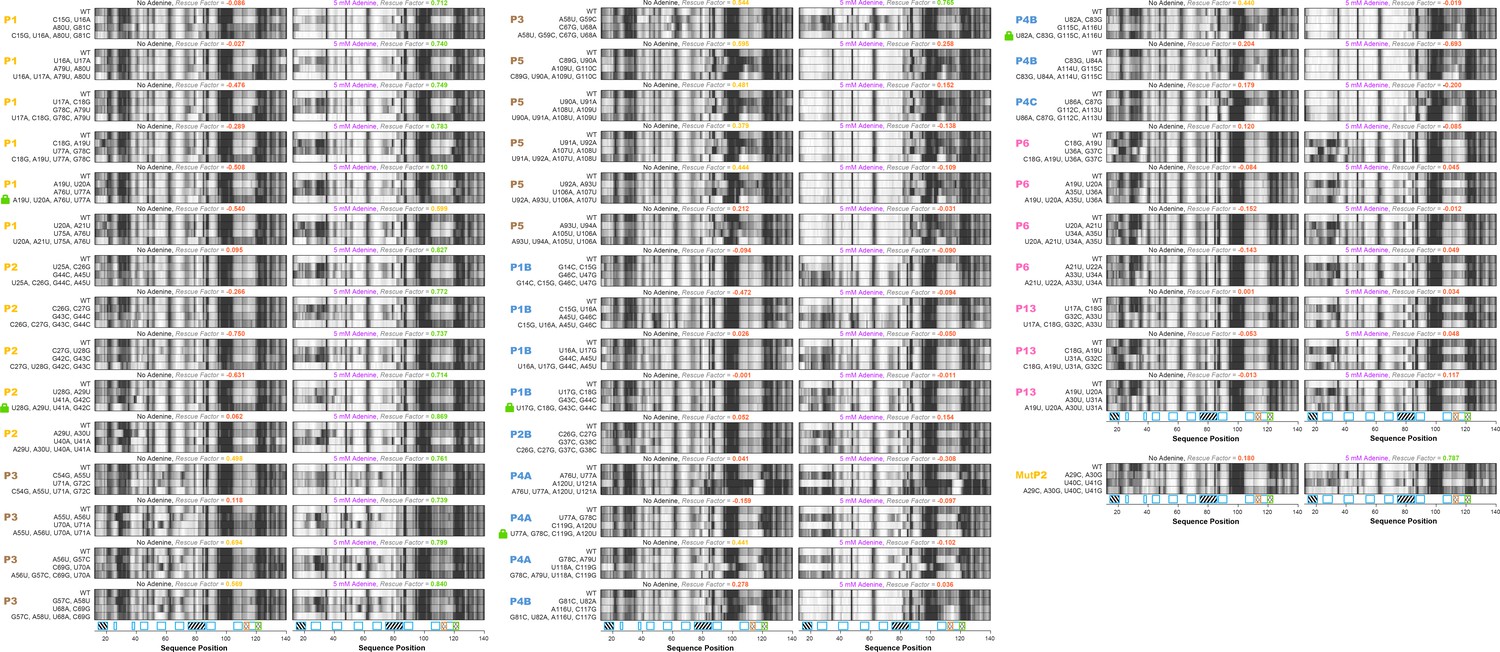
All 82 double base-pair M2R quartets for add riboswitch.
Helices P1, P2, P3, P5, P1B, P2B, P4A, P4B, P4C, P6, and P13 were tested for both no adenine and 5 mM adenine conditions. MutP2 from a previous study (Reining et al., 2013) is also included. Rescue factor for each quartet is given in the title and colored as in Figure 2—figure supplement 1. Mutants chosen to ‘lock’ P1, P2, P4A, P1B, and P4B are labeled by green lock symbol.
Figure 4
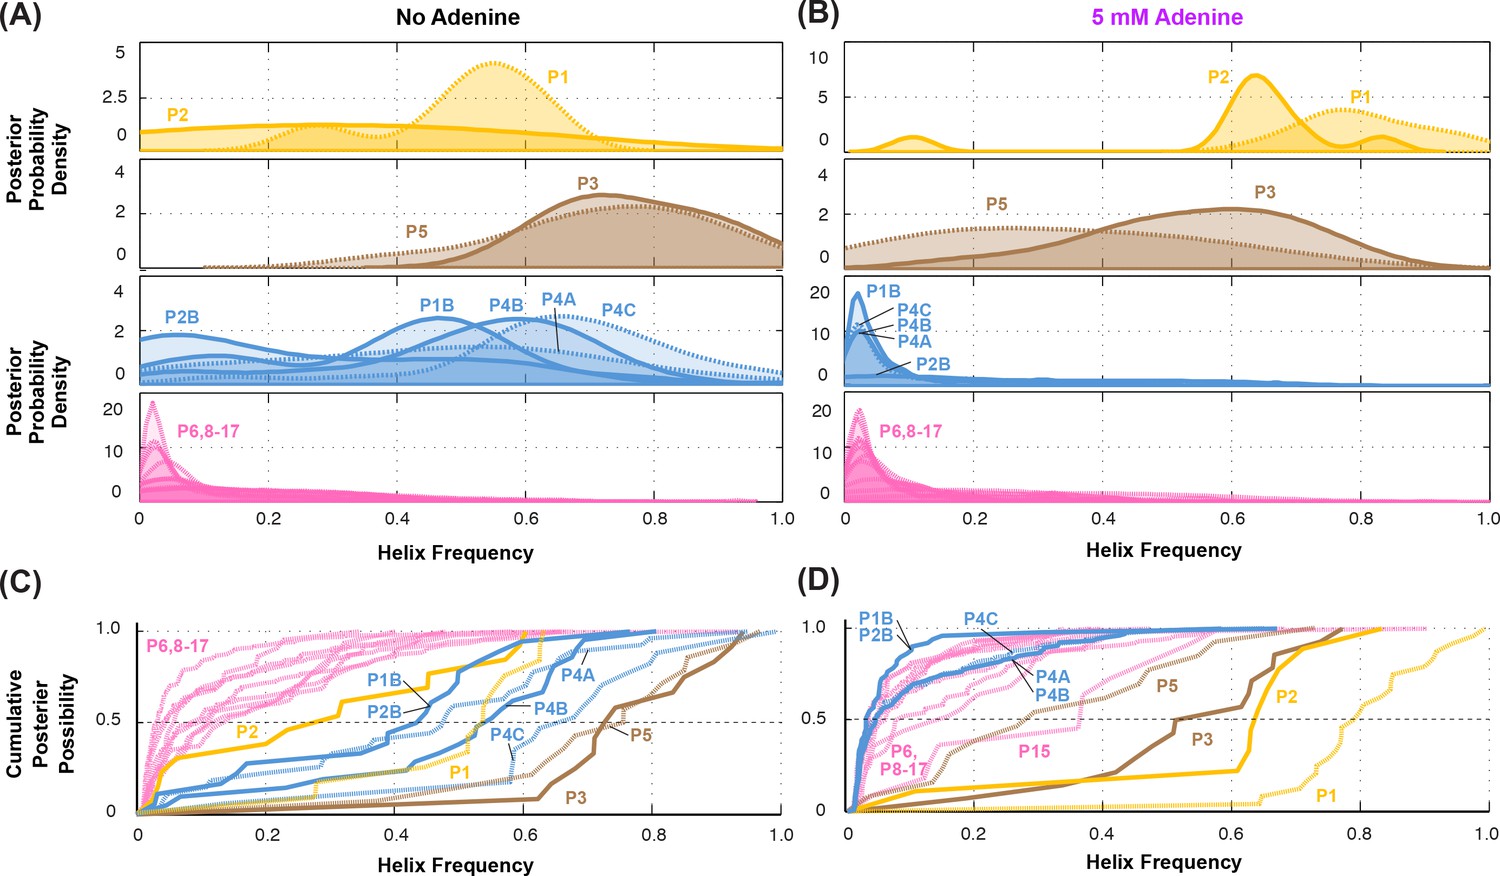
Summary of helix frequencies inferred for the add riboswitch.
Posterior distributions over helix frequencies (A) without adenine ligand and (B) with 5 mM adenine ligand. Curves have been smoothed through kernel density estimation. Sub-panels separate helices expected to have high frequencies with adenine bound (gold); ‘positive control’ helices expected to be present irrespective of adenine (brown); helices expected to be present only in the absence of adenine (blue); additional helices that are not expected to have high frequencies (pink). (C-D) same distributions as in (A-B) but represented as cumulative distributions and overlaid together without smoothing.
Figure 5 with 2 supplements
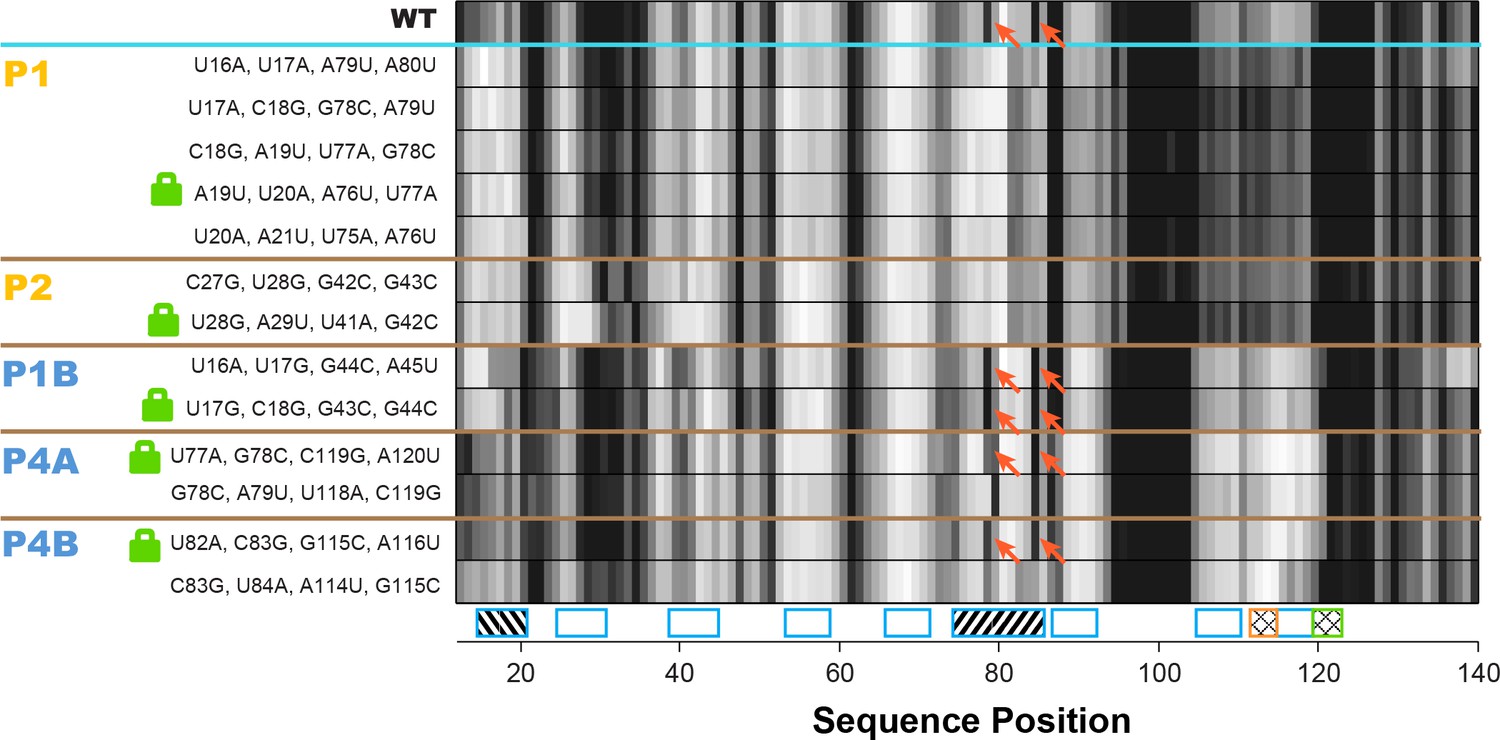
Double-base-pair mutations to lock each helix of the adenine riboswitch.
One-dimensional SHAPE reactivity of candidate constructs for locking each add riboswitch helix. In each candidate, two consecutive base pairs of the helix were switched to alternative Watson-Crick pairs (Figure 3—supplement 2). For each helix targeted, at least two sets of mutations gave SHAPE reactivities distinct from wild type but similar to each other. Red arrows mark residues in switch region that are reactive in wild type and strongly reactive in lock mutants chosen for P1B, P4A, and P4B.
Figure 5—figure supplement 1
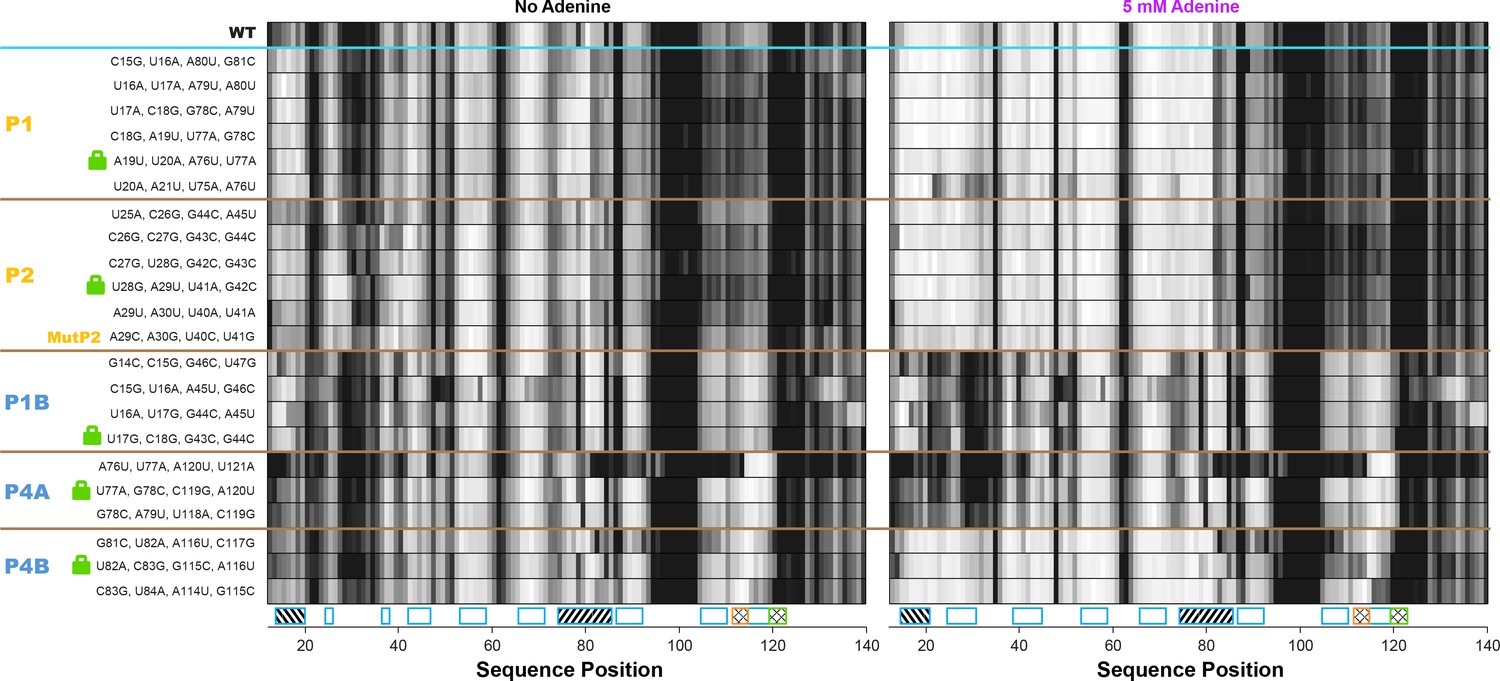
All double-base-pair mutations tested as possible locking mutations.
One-dimensional SHAPE reactivity of candidate constructs for locking each add riboswitch helix. The MutP2 variant is derived from reference (Reining et al., 2013); it shows less SHAPE increase in the gene expression platform (nts 105–122) than other tested lock P2 mutants.
Figure 5—figure supplement 2
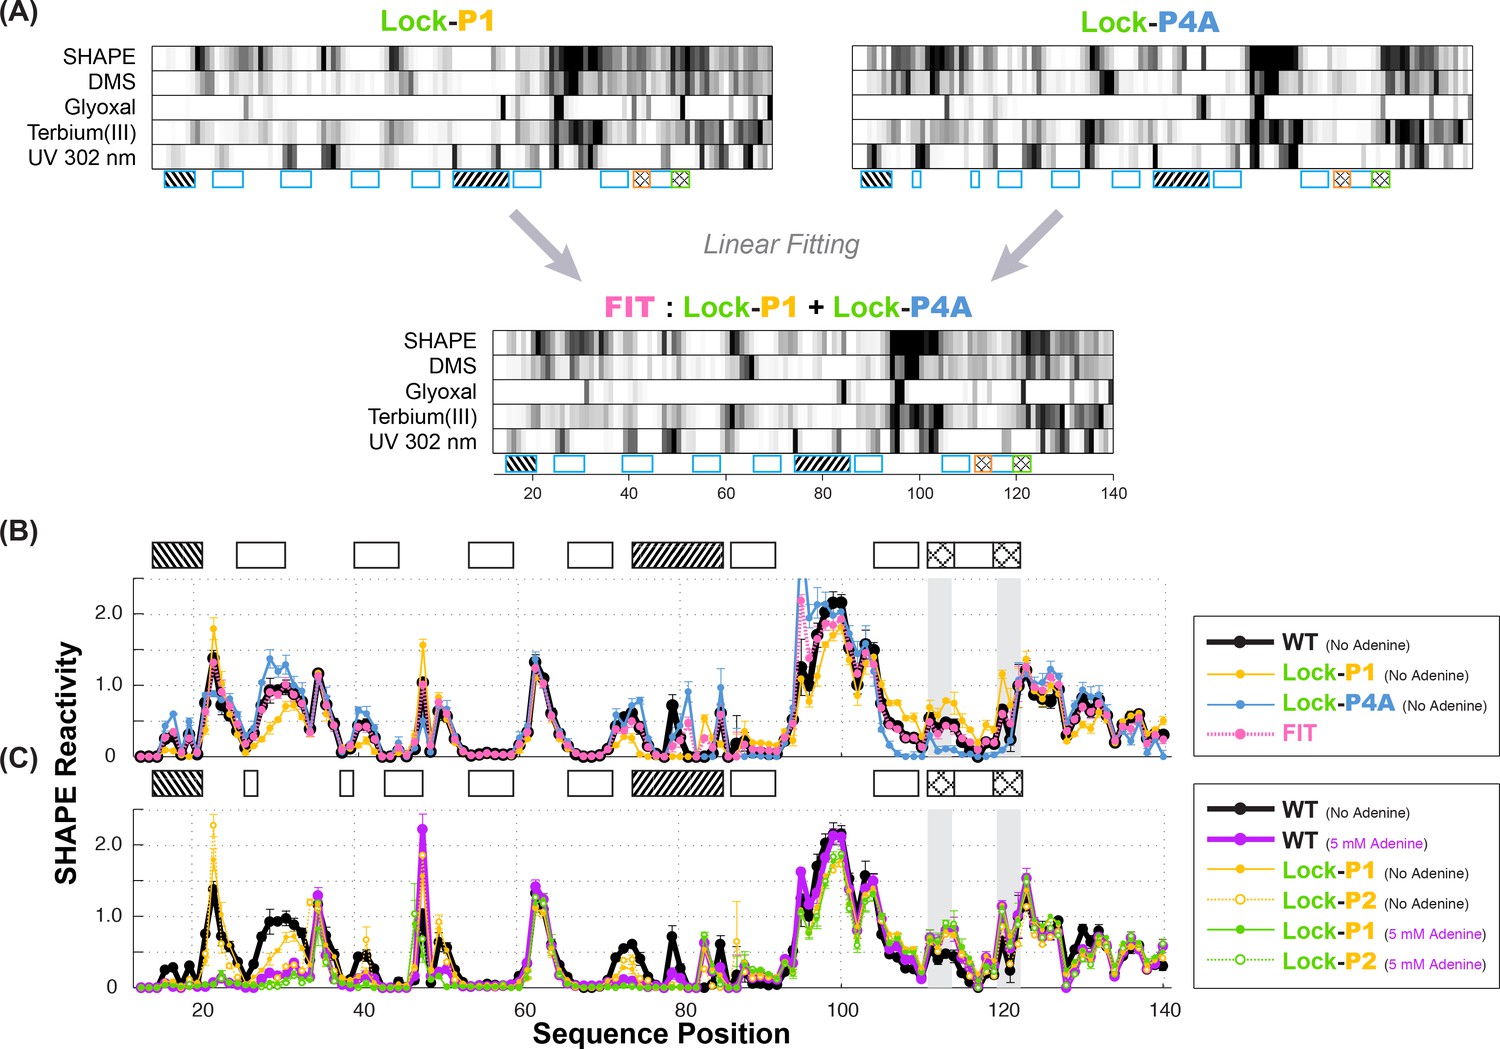
Multi-probe chemical mapping of stabilizers and linear fitting of P1 and P4A.
(A) Five-modifier (SHAPE, 1M7, glyoxal, terbium (III), UV 302 nm) reactivity profile for lock-P1 and lock-P4A constructs. χ2 score-based linear fitting yields apoA state as 48% (SHAPE), 58% (DMS), 46% (glyoxal), 52% (terbium (III)) and 68% (UV 302 nm) in population. Some uncertainty remains in the UV data normalization for a quantitative fitting. (B) Comparison of fitted SHAPE reactivity profile (pink) to observed WT (black) in absence of adenine. Reactivity profiles of lock-P1 (gold) and lock-P4A (blue) are plotted. The fitted profile resolves reactivity differences in the expression platform and resembles WT, although discrepancies (nts 79–80) suggest that there are more than the two states represented by lock-P1 and lock-P4A in the WT adenine-free ensemble. (C) Comparison of lock-P1 and lock-P2 profiles in the absence or presence of ligand to observed WT profile in the presence of 5 mM adenine. Lock-P1 and lock-P2 mutants show agreement in the expression platform reactivity (nts 82–140) with adenine-bound WT (purple) even in the absence of adenine (solid gold and green).
Figure 6 with 2 supplements
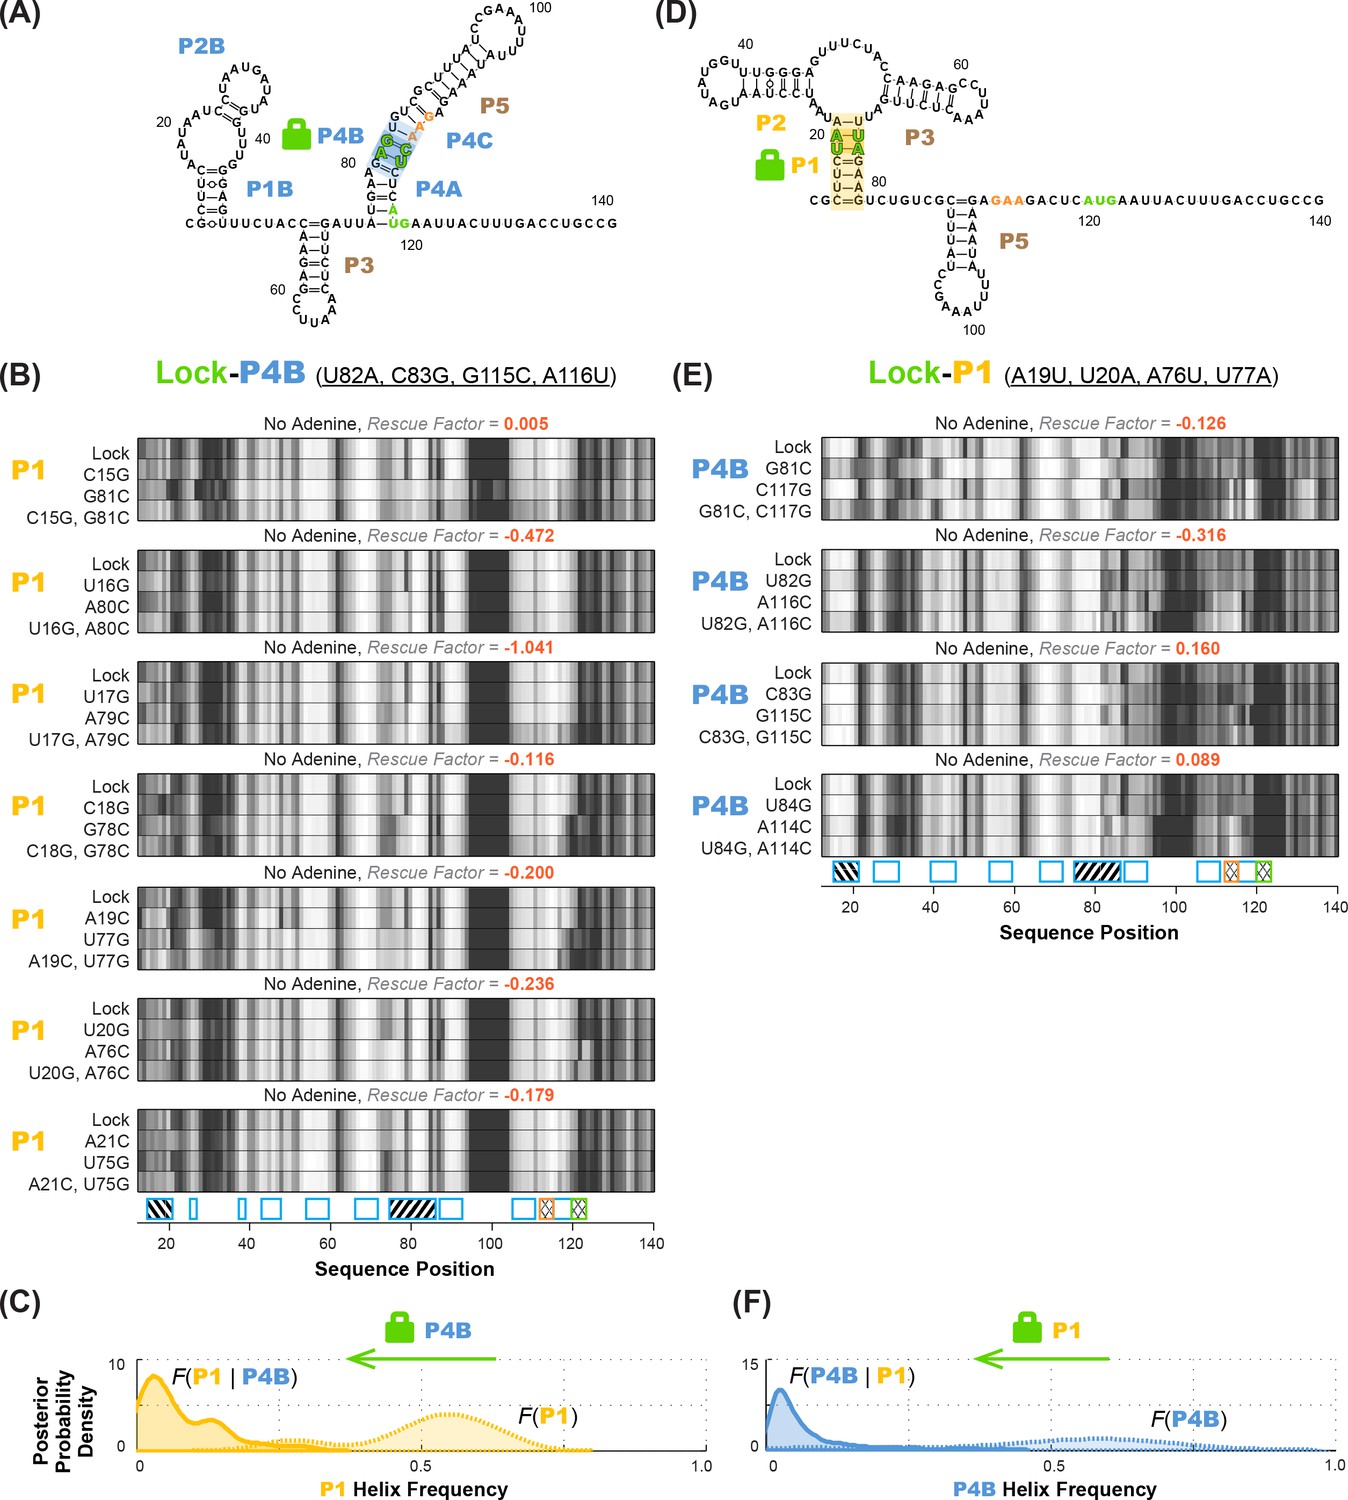
Anticorrelation between P1 and P4B helices in ligand-free add riboswitch structural ensemble, inferred through lock-mutate-map-rescue (M2R).
(A–C) M2R quartets probing P1 in the context of lock-P4B mutations show no rescue. (D–F) M2R quartets probing P4B in the context of lock-P1 mutations show no rescue. Panels (A,D) show possible secondary structures for helix lock mutants. Panels (B,E) give M2R quartets for each base pair of the probed helix in the context of the mutations locking the other helix. Panels (C,F) give posterior probability distributions over helix frequency, estimated from the experimental M2R rescue factors in locked background and wild type background (solid and dotted curves, respectively).
Figure 6—figure supplement 1
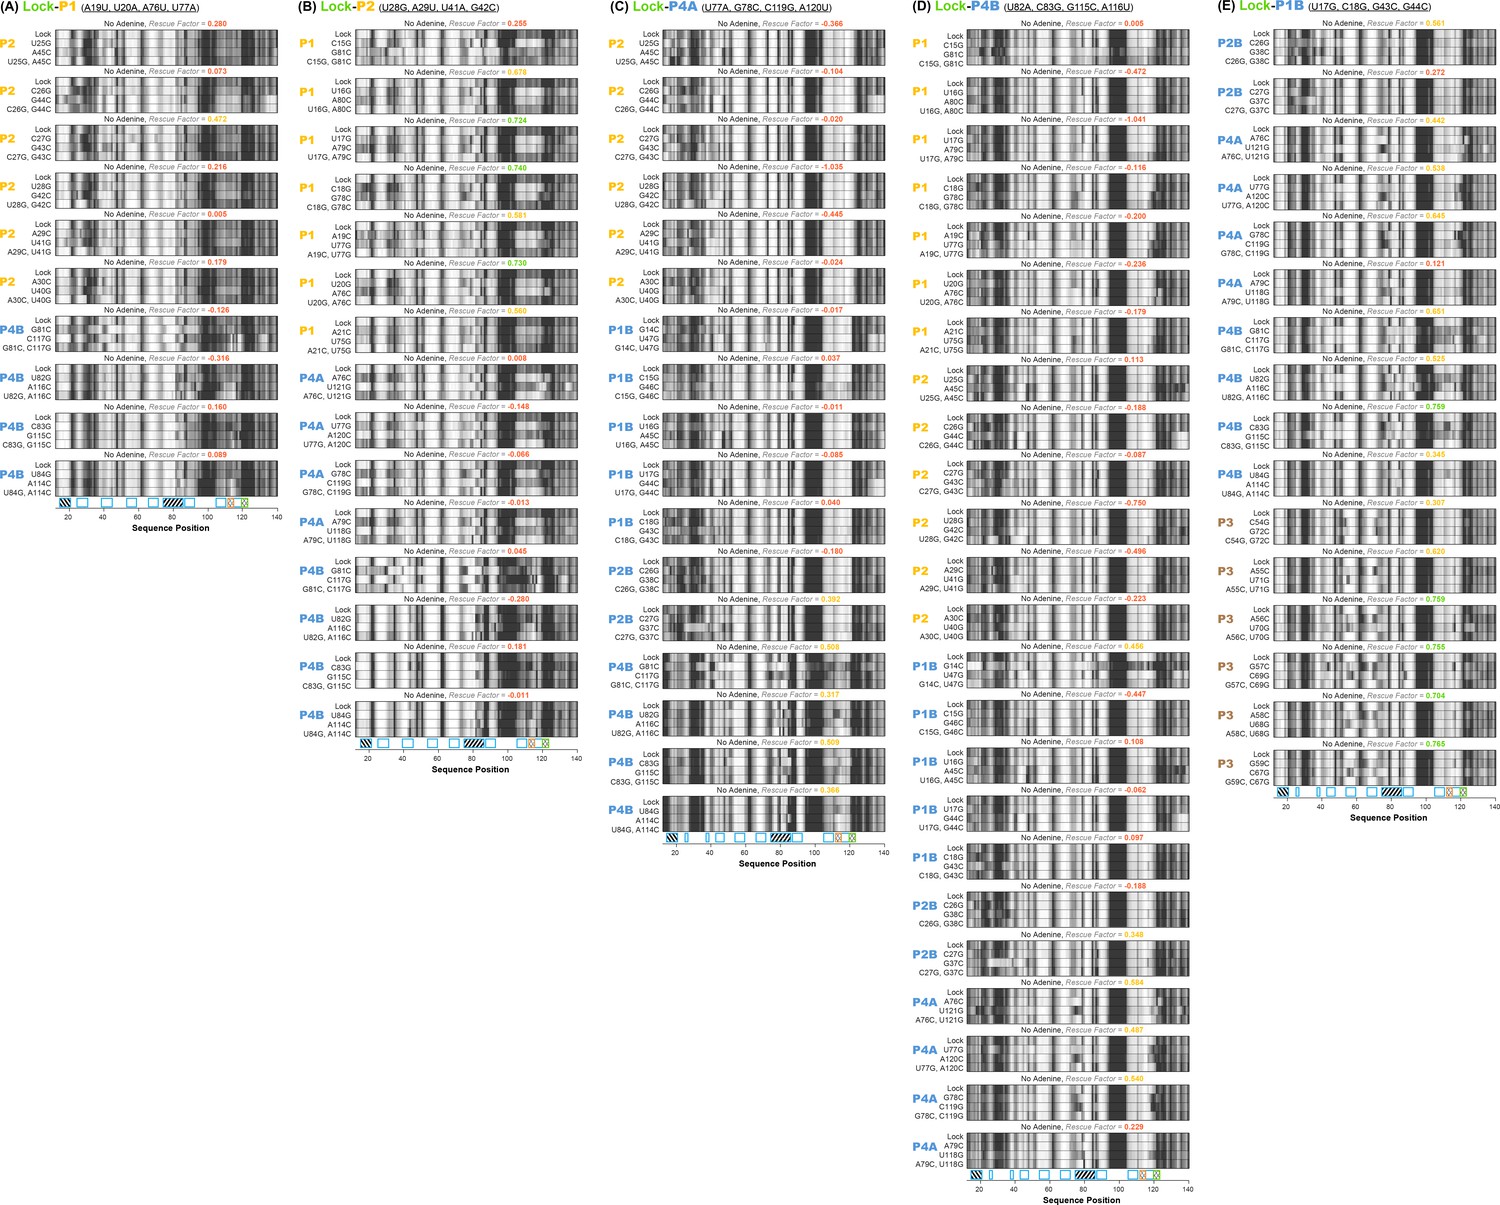
All 82 single base-pair LM2R quartets for add riboswitch.
Helices P2 and P4B are tested in context of lock-P1 stabilizing mutations; helices P1, P4A, and P4B are tested in lock-P2 stabilizing mutations; helices P2, P1B, P2B, and P4B are tested in context of lock-P4A stabilizing mutations; helices P2B, P4A, P4B, and P3 are tested in context of lock-P1B stabilizing mutations; helices P1, P2, P1B, P2B, and P4A are tested in context of lock-P4B stabilizing mutations; all under no adenine condition. Rescue factor for each quartet is given in the title and colored red, yellow, or green as in Figure 2—figure supplement 1.
Figure 6—figure supplement 2
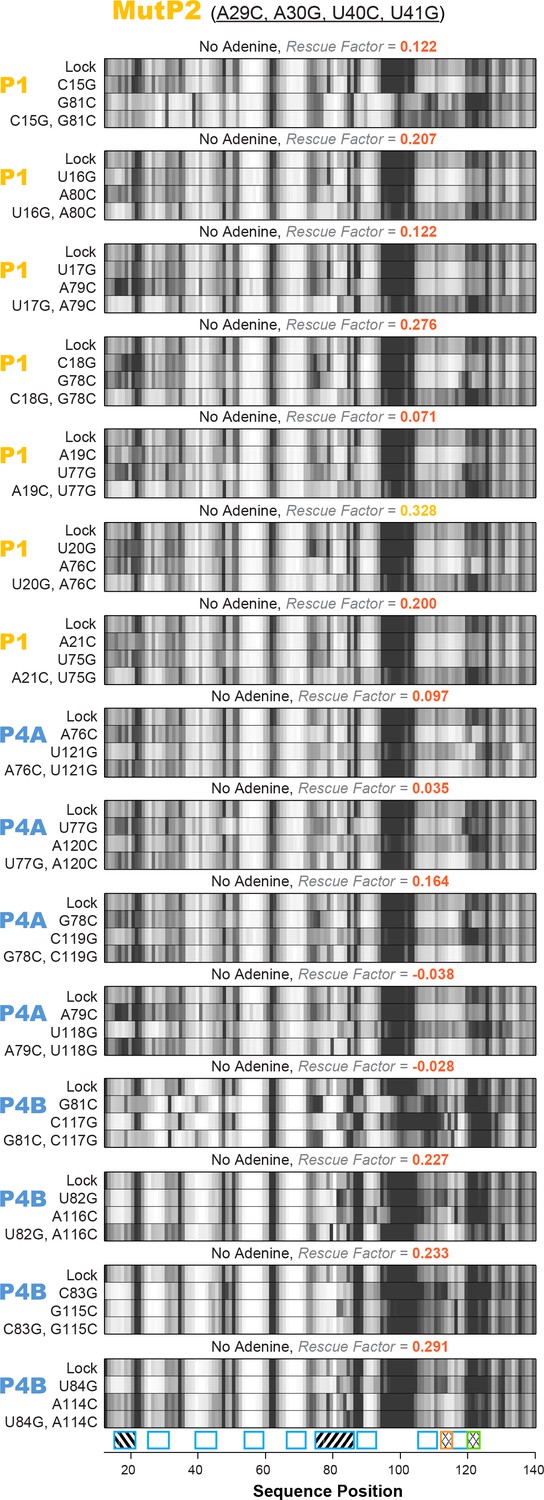
All 15 single base-pair LM2R quartets for add riboswitch with the MutP2 construct.
Helices P1, P4A, and P4B were tested under no adenine condition. Rescue factor for each quartet is given in the title and colored as in Figure 2—figure supplement 1.
Figure 7 with 1 supplement
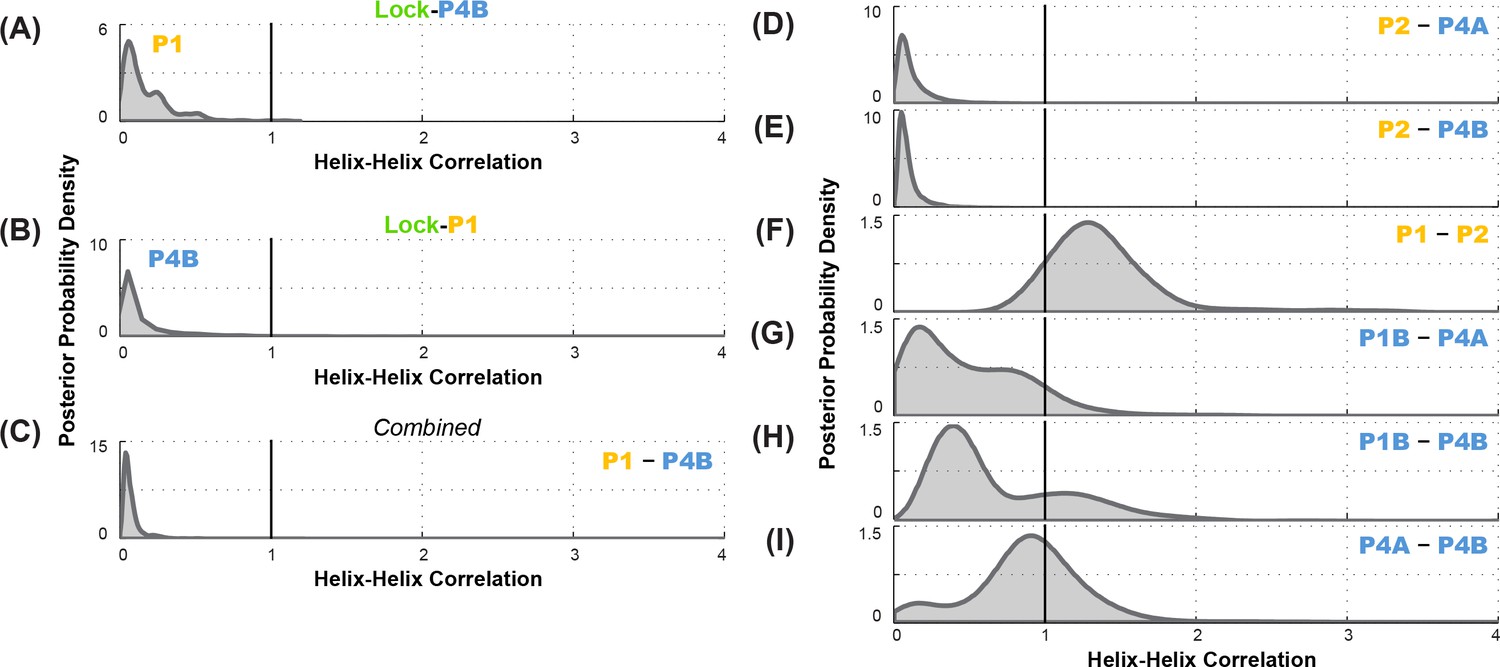
Correlation analysis for functionally important helix-helix pairs in the ligand-free add riboswitch structural ensemble.
Posterior probability distributions, smoothed through kernel density estimation, for correlation of (A-C) P1 and P4B, based on LM2R experiments (A) locking P4B and probing P1, (B) locking P1 and probing P4B, and (C) combination of experiments of (A) and (B); and (D-I) other pairs of helices, based on combination of experiments locking each helix and probing the other and vice versa. Helix pairs are (D) P2 and P4A, (E) P2 and P4B, (F) P1 and P2; (G) P1B and P4A; (H) P1B and P4B; and (I) P4A and P4B.
Figure 7—figure supplement 1
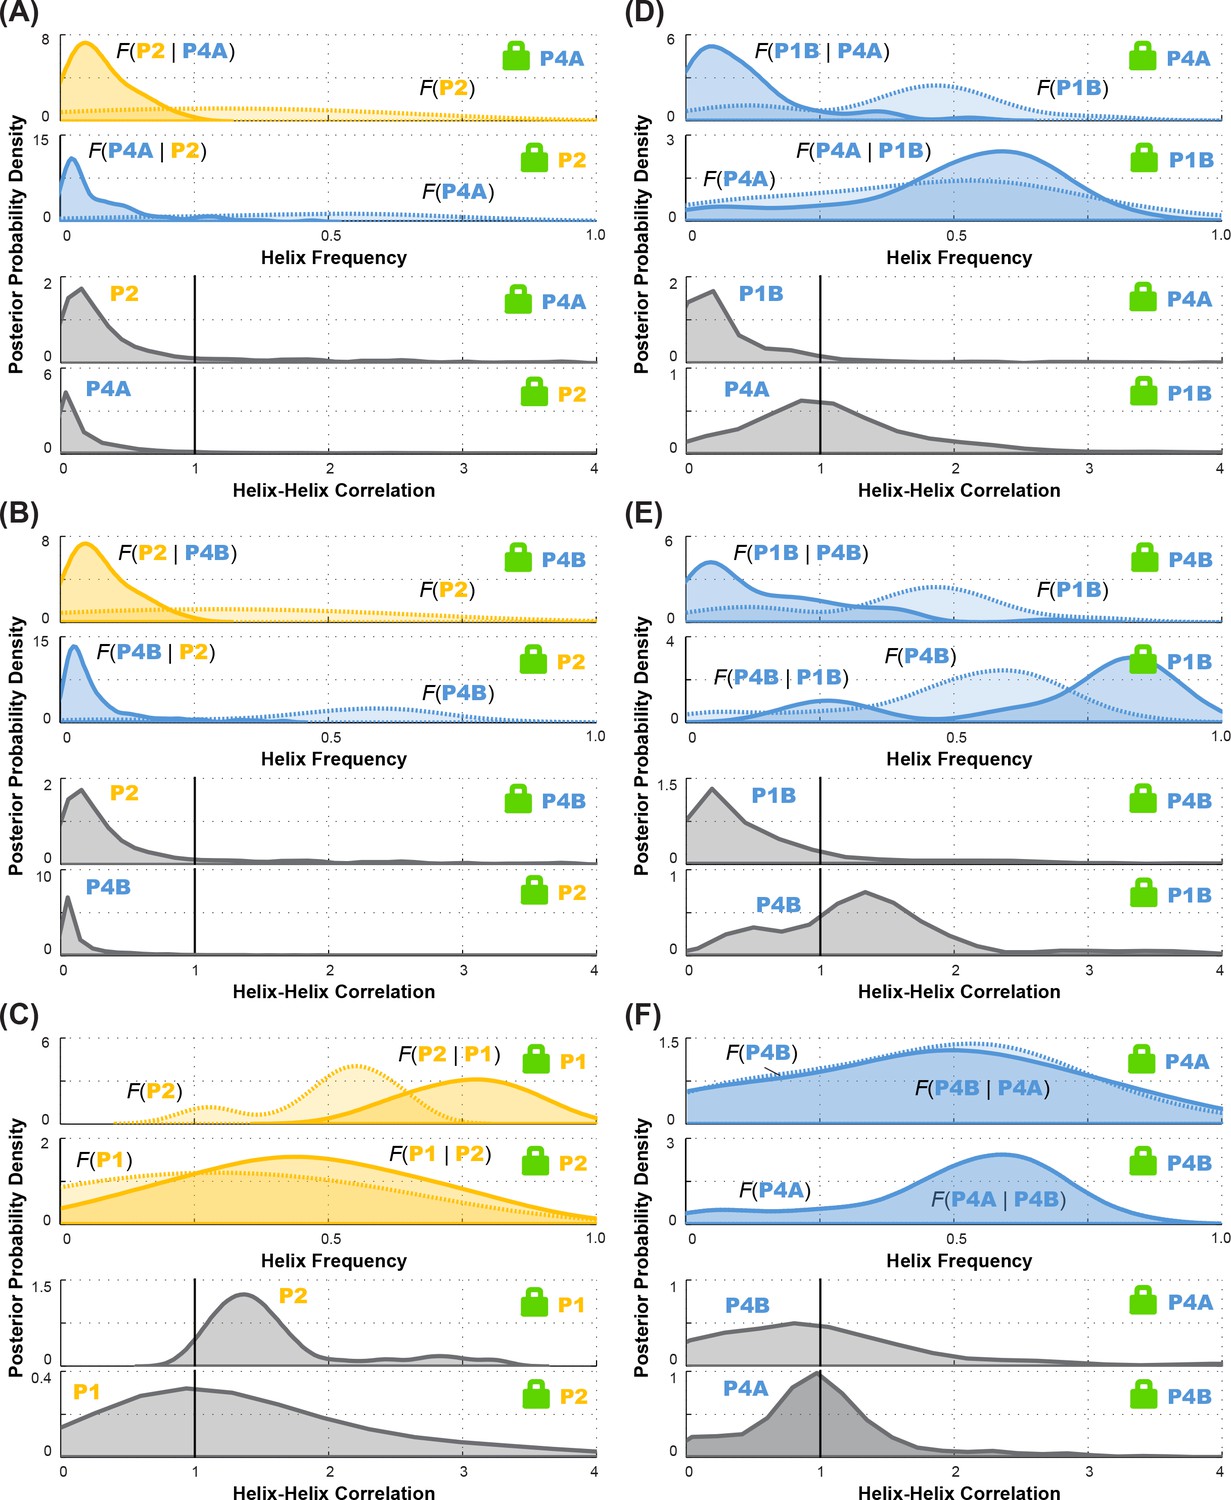
Posterior probability distributions over helix frequencies and helix-helix correlations for individual LM2R experiments.
In each panel, top two sub-panels show posterior probability distributions, smoothed through kernel density estimation, over helix frequency, estimated from the experimental M2R rescue factors in locked background and wild type background (solid and dotted curves, respectively). In each panel, bottom two sub-panels show posterior probability distributions, smoothed through kernel density estimation, for correlation of the helix-helix pairs inferred from the corresponding top subpanels. Helix pairs are (A) P2 and P4A, (B) P2 and P4B, (C) P1 and P2; (D) P1B and P4A; (E) P1B and P4B; and (F) P4A and P4B. These curves are the distributions that are combined to give final posterior distributions for helix-helix correlations shown in Figure 7 (D-I), respectively.
Figure 8 with 3 supplements
Current model for the add riboswitch structural ensemble.
The proposed model favors a Monod-Wyman-Changeux (population shift, conformational selection) model of allostery. The ligand-free apoB state (left) sequesters the Shine-Dalgarno sequence and AUG codon in the P4 domain, precluding gene expression. Our measurements show that sampling of the aptamer secondary structure is strongly anticorrelated with formation of the P4 domain; it is therefore valid to represent it as a separate state (apoA, middle). This apoA state is structurally similar to the ligand-bound holo, including not just the aptamer region but also the gene expression platform, as predicted by an MWC framework (right). Our measurements and other studies are consistent with sampling of additional alternative structures in the apoB state (dashed blue lines), a partially formed P5 in apoA, and additional stabilization of the aptamer through coupled tertiary contacts upon adenine binding (dashed black lines in apoA, solid yellow lines in holo).
Figure 8—figure supplement 1
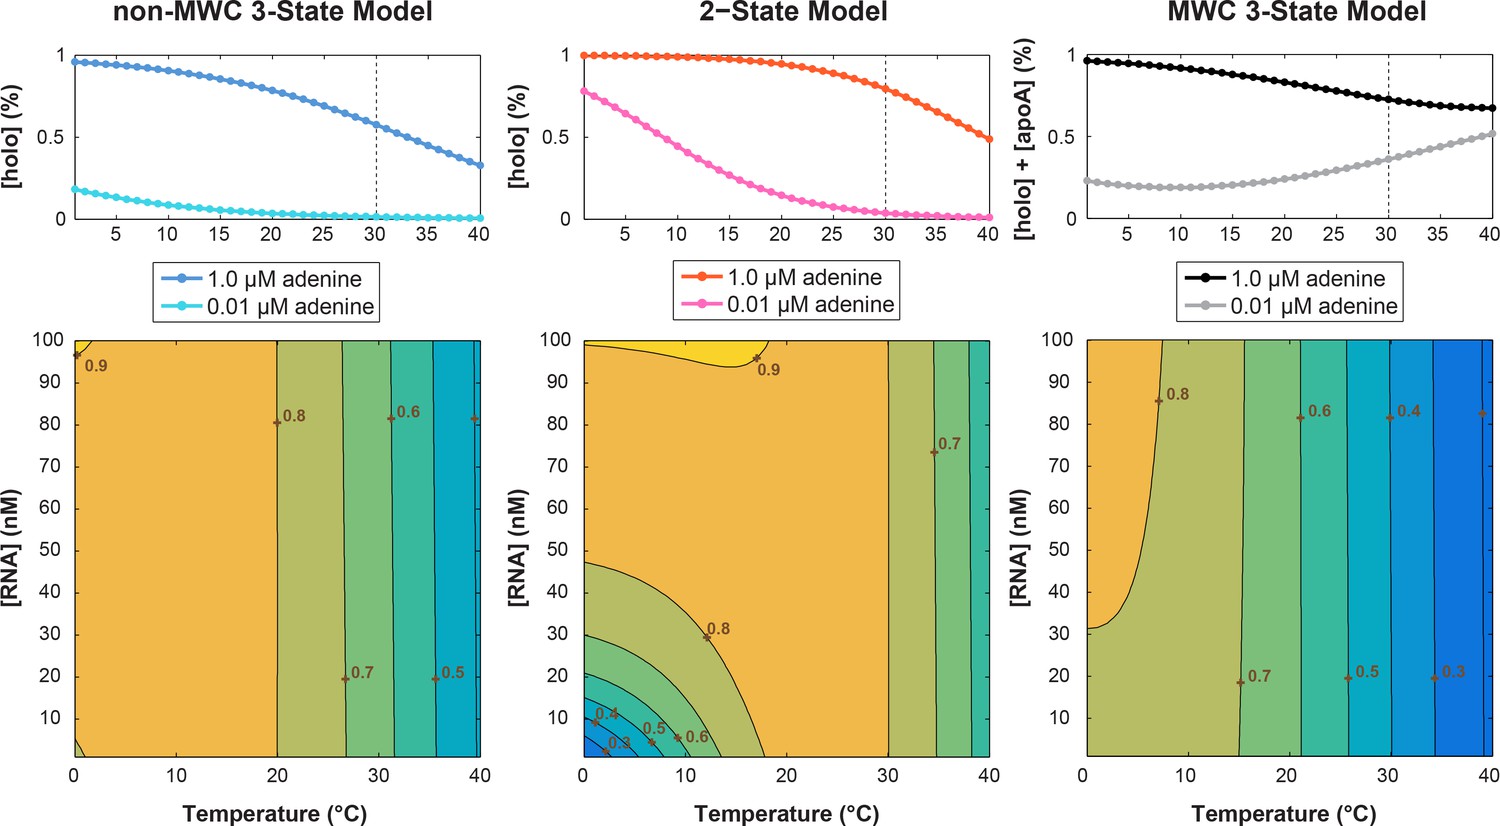
Simulation of temperature dependence on switching efficiency.
Thermodynamic parameters used are: ΔHKpre = 52 kJ.mol−1, ΔSKpre = 167 J.mol−1.K−1, ΔHKd = 238 kJ.mol−1, ΔSKd = 110 J.mol−1.K−1. Ligand concentrations: [Llow]=0.01 μM; [Lhigh]=1.0 μM for (top) panels and [Llow]=1.5 μM for (bottom) heatmaps. The (top) population linear plots used [RNA]=1.5 nM; while (bottom) temperature vs. [RNA] heatmap simulated [RNA] = 0–100 nM for T = 0–40°C. Parameters were derived from prior study reviewing the temperature compensation model (Fürtig et al., 2015b).
Figure 8—figure supplement 2
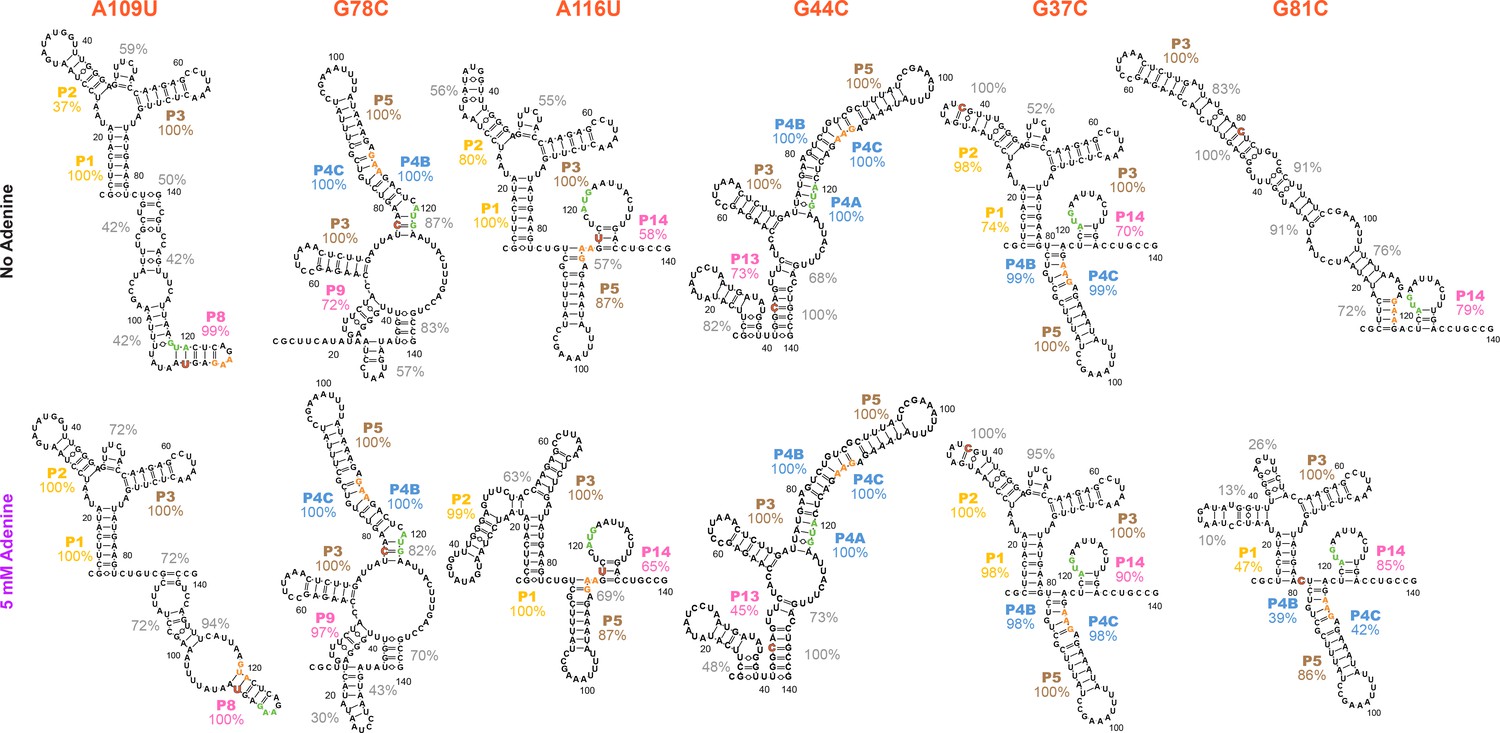
Models of additional structures that the add riboswitch can form, based on mutate-and-map on selected single mutant backgrounds.
Single mutants (A) A109U, (B) G78C, (C) A116U, (D) G44C, (E) G37C, and (F) G81C were selected from a clustering analysis of WT M2 data. Models are for dominant structures of the RNA based on higher-order mutate-and-map data presented in Figure 8—figure supplement 3. Secondary structures inferred for these single mutants are quite diverse, particularly for the adenine-free state (percentage values give bootstrapping confidence that those helices are present in the dominant secondary structure). The ease at which these alternative structures can be stabilized for the add riboswitch suggest that they occur for the wild type RNA at low frequency, and might explain deviations of SHAPE profiles and LM2R data across mutants that lock different helices of the apoB secondary structure (Figures 5 and 6).
Figure 8—figure supplement 3
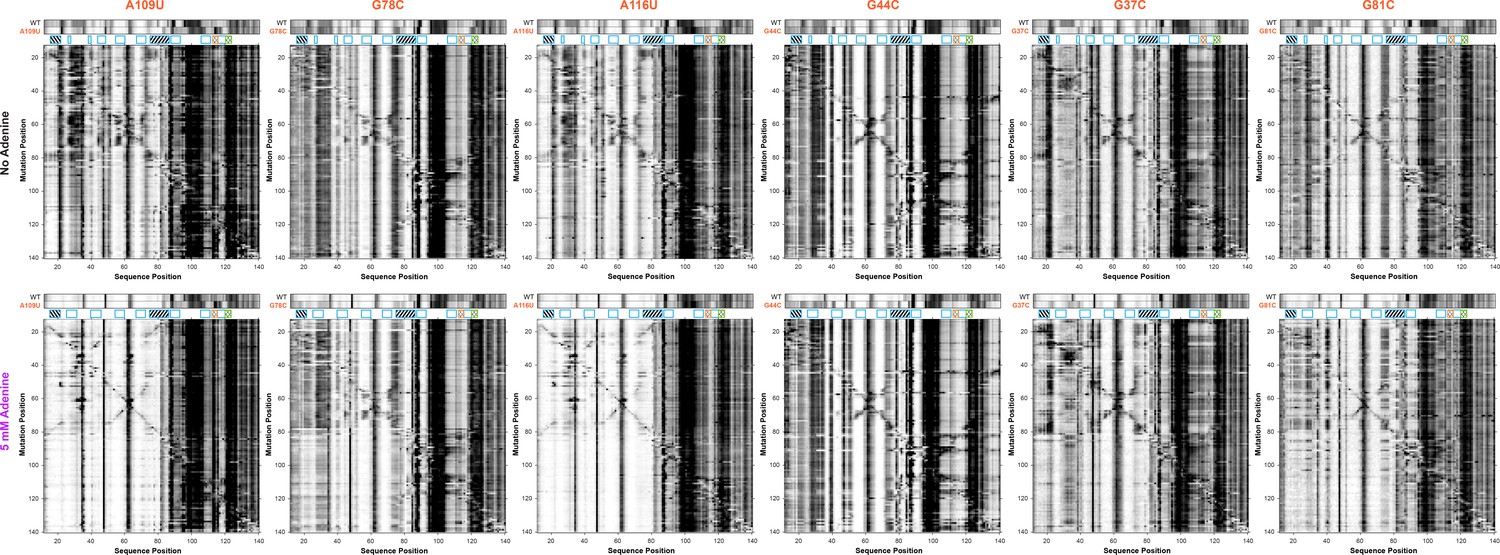
Higher-order mutate-and-map on selected single mutant backgrounds.
(A) A109U, (B) G78C, (C) A116U, (D) G44C, (E) G37C, and (F) G81C. A comparison of 1D SHAPE profile to WT under both no adenine and 5 mM adenine conditions are shown along with complete M2 datasets; inferred structures are given in Figure 8—figure supplement 2.
Appendix 1—figure 1
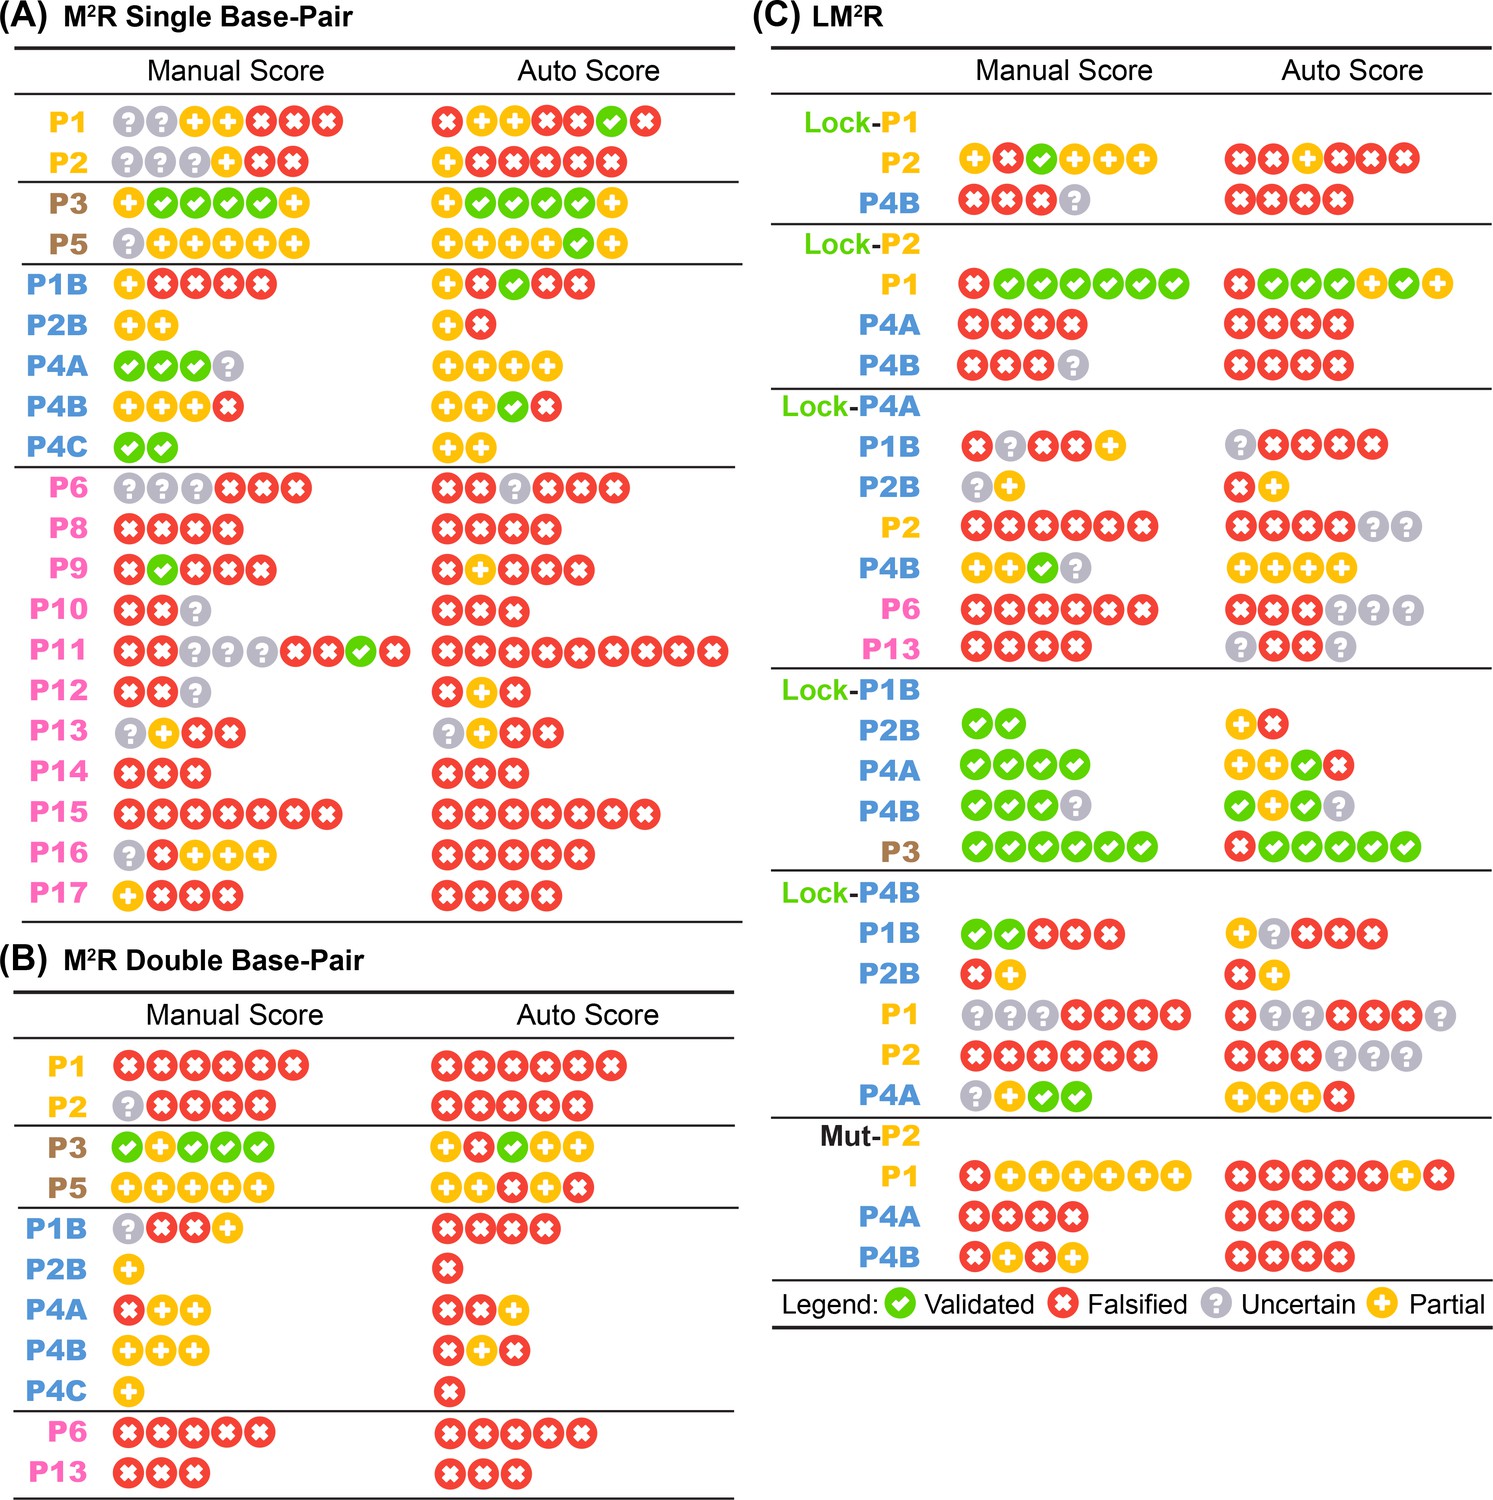
Base-pair-wise classification of M2R and LM2R quartets by the 4-bin auto-score.
Table summary of 4-bin classification by human expert and automatic algorithm on in vitro (A) single base-pair M2R, (B) double base-pair M2R, and (C) LM2R and MutP2 are shown. Each symbol represents one quartet testing a single base-pair (or two adjacent base-pairs in (B)).
Appendix 1—figure 2
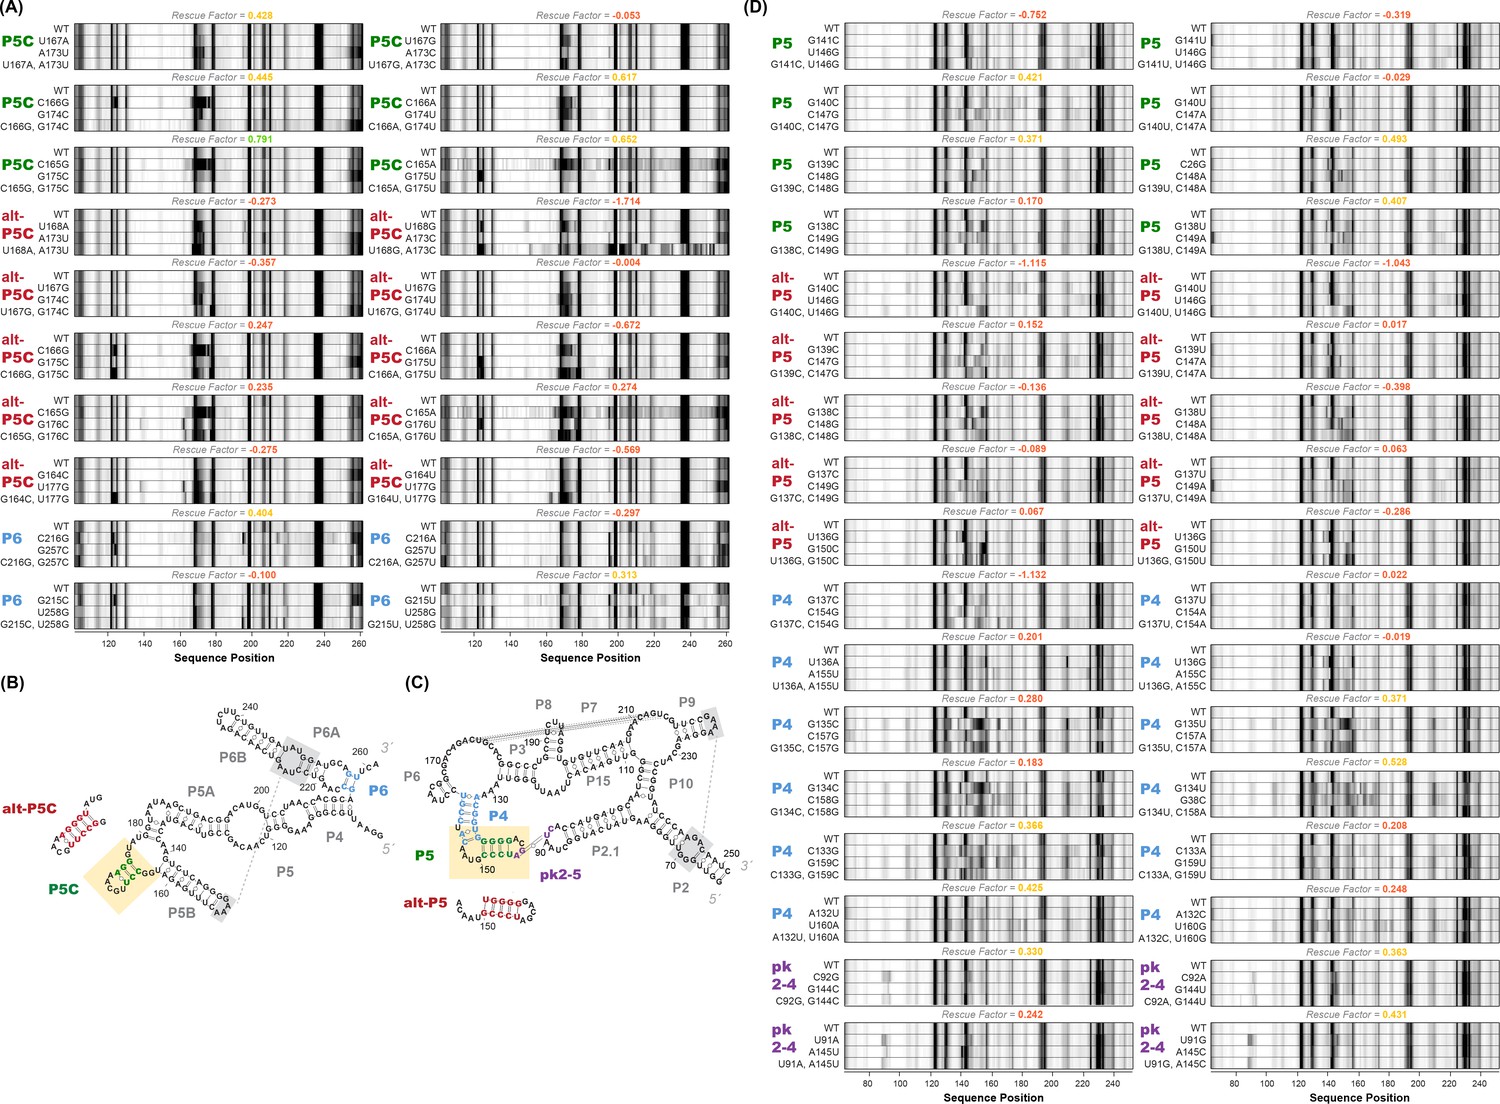
M2R quartets and helices tested for P4-P6 and GIR1.
(A) M2R quartets of P4-P6 domain testing P5C, alt-P5C, and P6. Rescue factor for each quartet is given in the title and colored as in Figure S1. (B–C) Secondary structures of P4-P6 and GIR1 highlighting tested helices. (D) M2R quartets of GIR1 ribozyme testing P5, alt-P5, P4, and pk2-5.
Appendix 1—figure 3
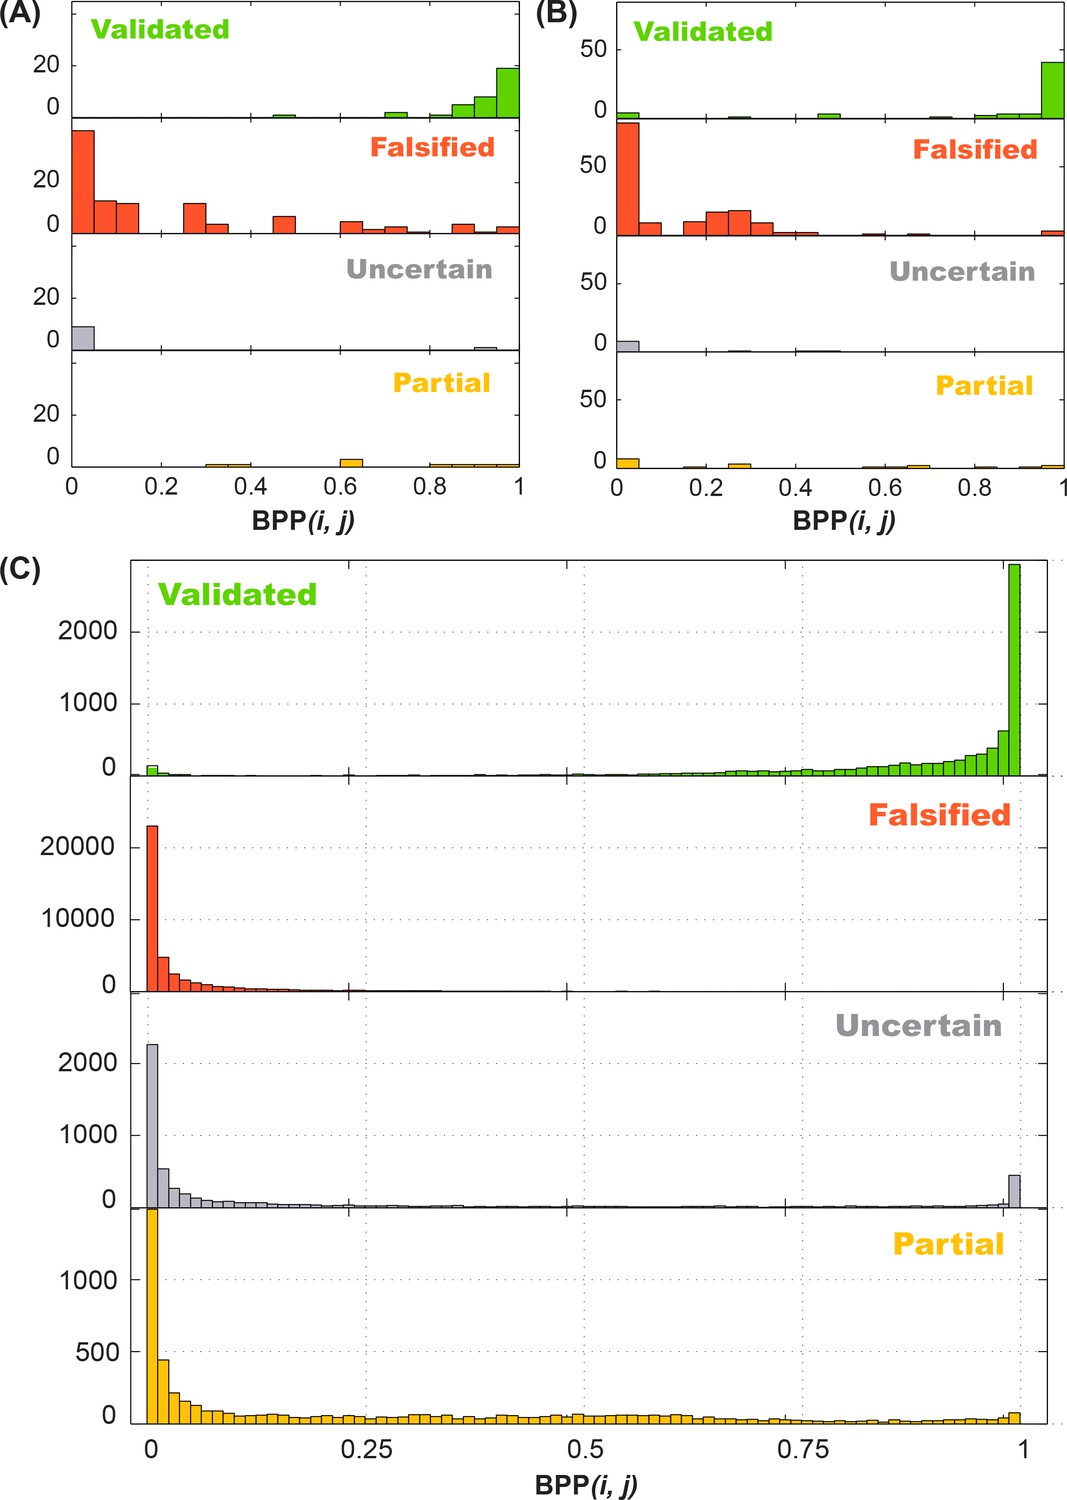
Performance of 4-bin auto-score classifier.
Histogram of in silico (A) training data (16S-FWJ, P4P6, GIR1, Hox, PB2; total of 162 quartets), (B) test data (add single and double base-pair M2R; total of 242 quartets), and (C) Rfam family (total of 62484 quartets) simulations are shown by their classification, and grouped by the in silico predicted base-pairing probability (BPP).
Tables
Table 1
Helix frequency estimates for single base-pair M2R, double base-pair M2R, LM2R experiments.
Median helix frequencies from Rfam simulations corresponding to each experimentally observed rescue factor are reported. The experimentally observed rescue factor for each helix was averaged across all tested base pairs. Full posterior distributions are presented in main text Figure 4 and Figure 7—figure supplement 1.
| Wild type* | In locked contexts† | ||||
|---|---|---|---|---|---|
| [adenine] | 0 mM | 5 mM | 0 mM | ||
| P1 | 53% | 79% | Lock P1 | P2 | 42% |
| P2 | 31% | 64% | P4B | 4% | |
| P3 | 73% | 56% | Lock P2 | P1 | 76% |
| P5 | 75% | 29% | P4A | 4% | |
| P1B | 44% | 3% | P4B | 4% | |
| P2B | 17% | 17% | Lock P4A | P1B | 9% |
| P4A | 48% | 4% | P2B | 6% | |
| P4B | 55% | 4% | P2 | 6% | |
| P4C | 68% | 4% | P4B | 55% | |
| P6 | 6% | 5% | Lock P1B | P2B | 53% |
| P8 | 9% | 4% | P4A | 55% | |
| P9 | 12% | 3% | P4B | 80% | |
| P10 | 3% | 3% | P3 | 82% | |
| P11 | 12% | 16% | Lock P4B | P1B | 8% |
| P12 | 10% | 6% | P2B | 4% | |
| P13 | 9% | 4% | P1 | 5% | |
| P14 | 4% | 4% | P2 | 6% | |
| P15 | 12% | 36% | P4A | 47% | |
| P16 | 14% | 8% | Mut P2 | P1 | 38% |
| P17 | 4% | 4% | P4A | 8% | |
| P4B | 13% | ||||
-
*Median helix frequencies inferred from mutate-map-rescue, compensatory rescue read out by chemical mapping across the transcript.
†Lock-mutate-map-rescue, mutate-map-rescue carried out in the context of mutations that 'lock' the specified helices.
Table 2
Helix-helix correlation estimates from LM2R experiments.
Median values are reported. Full posterior distributions are presented in main text Figure 6 and Figure 7—figure supplement 1.
| Helix-helix | Correlation value |
|---|---|
| P1-P4B | 0.052 |
| P2-P4B | 0.069 |
| P2-P4A | 0.089 |
| P1-P2 | 1.315 |
| P4A-P4B | 0.902 |
| P1B-P4A | 0.44 |
| P1B-P4B | 0.534 |
Additional files
-
Transparent reporting form
- https://doi.org/10.7554/eLife.29602.026
Download links
A two-part list of links to download the article, or parts of the article, in various formats.
Downloads (link to download the article as PDF)
Open citations (links to open the citations from this article in various online reference manager services)
Cite this article (links to download the citations from this article in formats compatible with various reference manager tools)
Allosteric mechanism of the V. vulnificus adenine riboswitch resolved by four-dimensional chemical mapping
eLife 7:e29602.
https://doi.org/10.7554/eLife.29602


