A comparative transcriptomic analysis of replicating and dormant liver stages of the relapsing malaria parasite Plasmodium cynomolgi
- Biomedical Primate Research Centre, Netherlands
- Novartis Institutes for BioMedical Research, Switzerland
- Novartis Institute for Tropical Diseases, Singapore
Figures
Figure 1 with 3 supplements
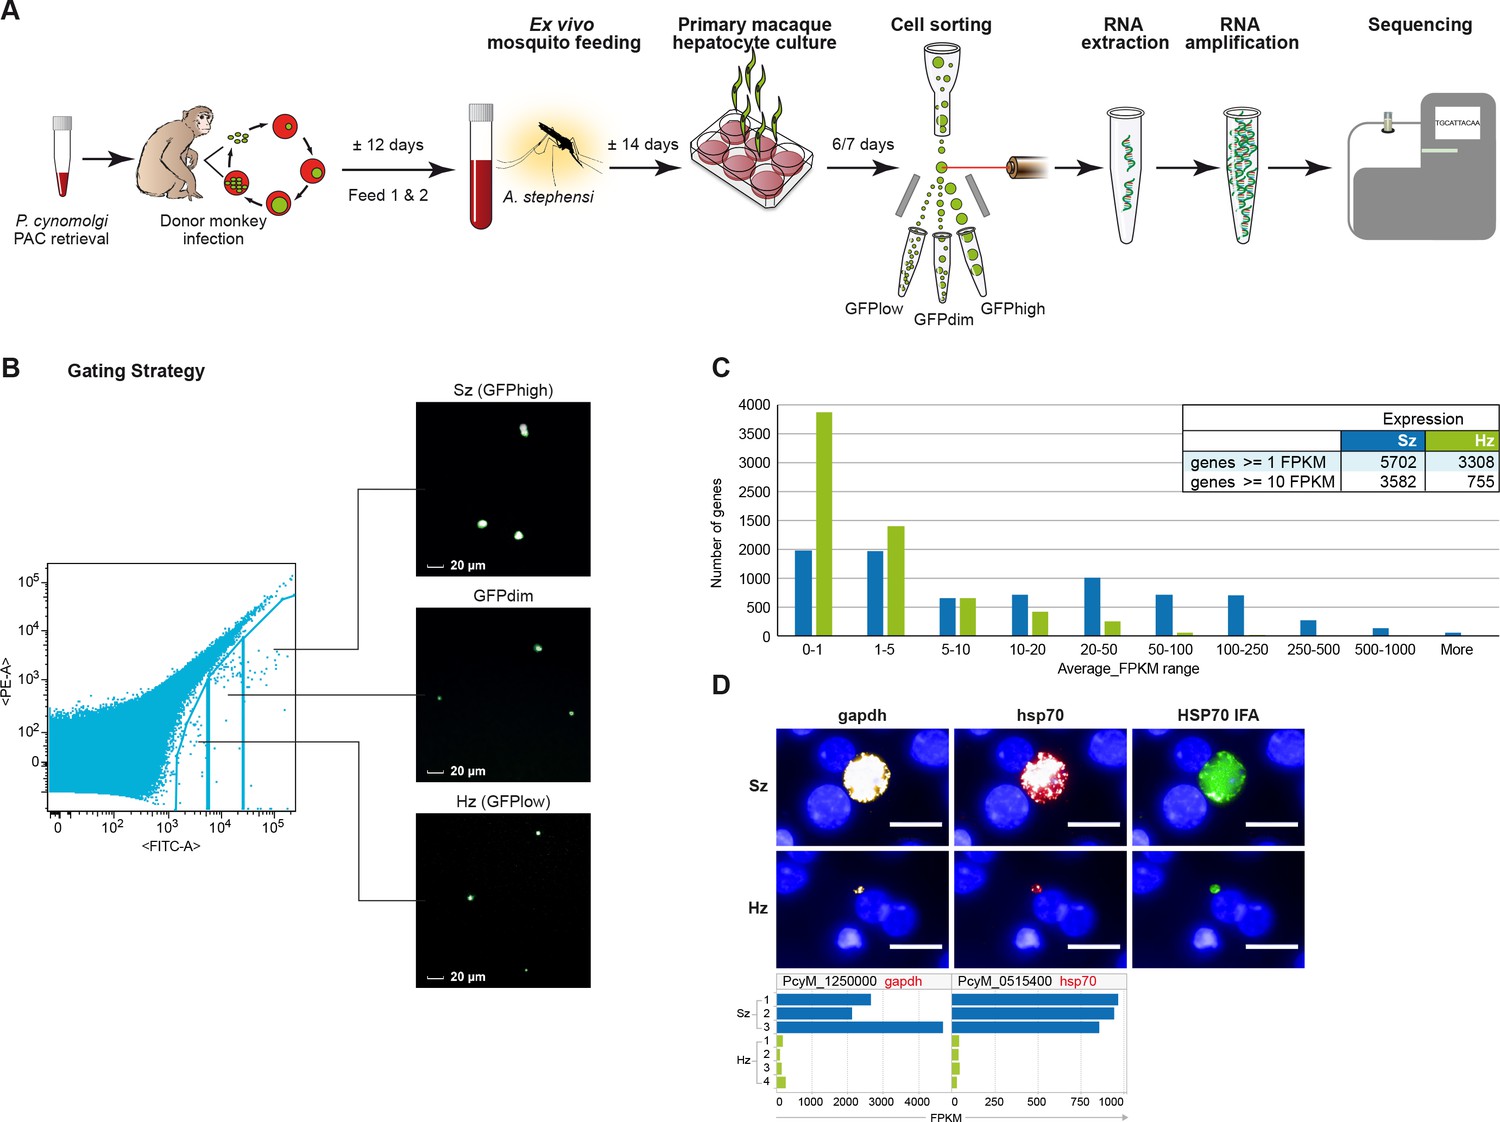
Transcriptomics of relapsing malaria liver stage parasites.
(A) Scheme of experimental approach for purification and RNA-sequencing of cultured P. cynomolgi M malaria liver stage schizonts (Sz) and hypnozoites (Hz). To enable FACS purification, P. cynomolgi parasites that stably express GFP using a Plasmodium Artificial Chromosome (PAC) were used. For further details, see Materials and methods. (B) Gating strategy included an extra gate, 'GFPdim', not used in subsequent RNA-seq analysis to ensure a strict separation of 'GFPlow' and 'GFPhigh' parasites. (C) Distribution of average gene expression values in the hypnozoite (green; n = 4) and schizont (blue; n = 3) samples. FPKM, Fragments per kilobase of transcript per million mapped reads. (D) Top panel showing RNA fluorescence in situ hybridization (RNA-FISH) of day 6 P. cynomolgi Sz and Hz with probes against gapdh (PcyM_1250000) and hsp70 (PcyM_0515400). Scale bars, 20 μm. Lower panel shows gene expression values (FPKM) for gapdh and hsp70 of individual Hz and Sz samples as determined by RNA-sequencing.
Figure 1—figure supplement 1
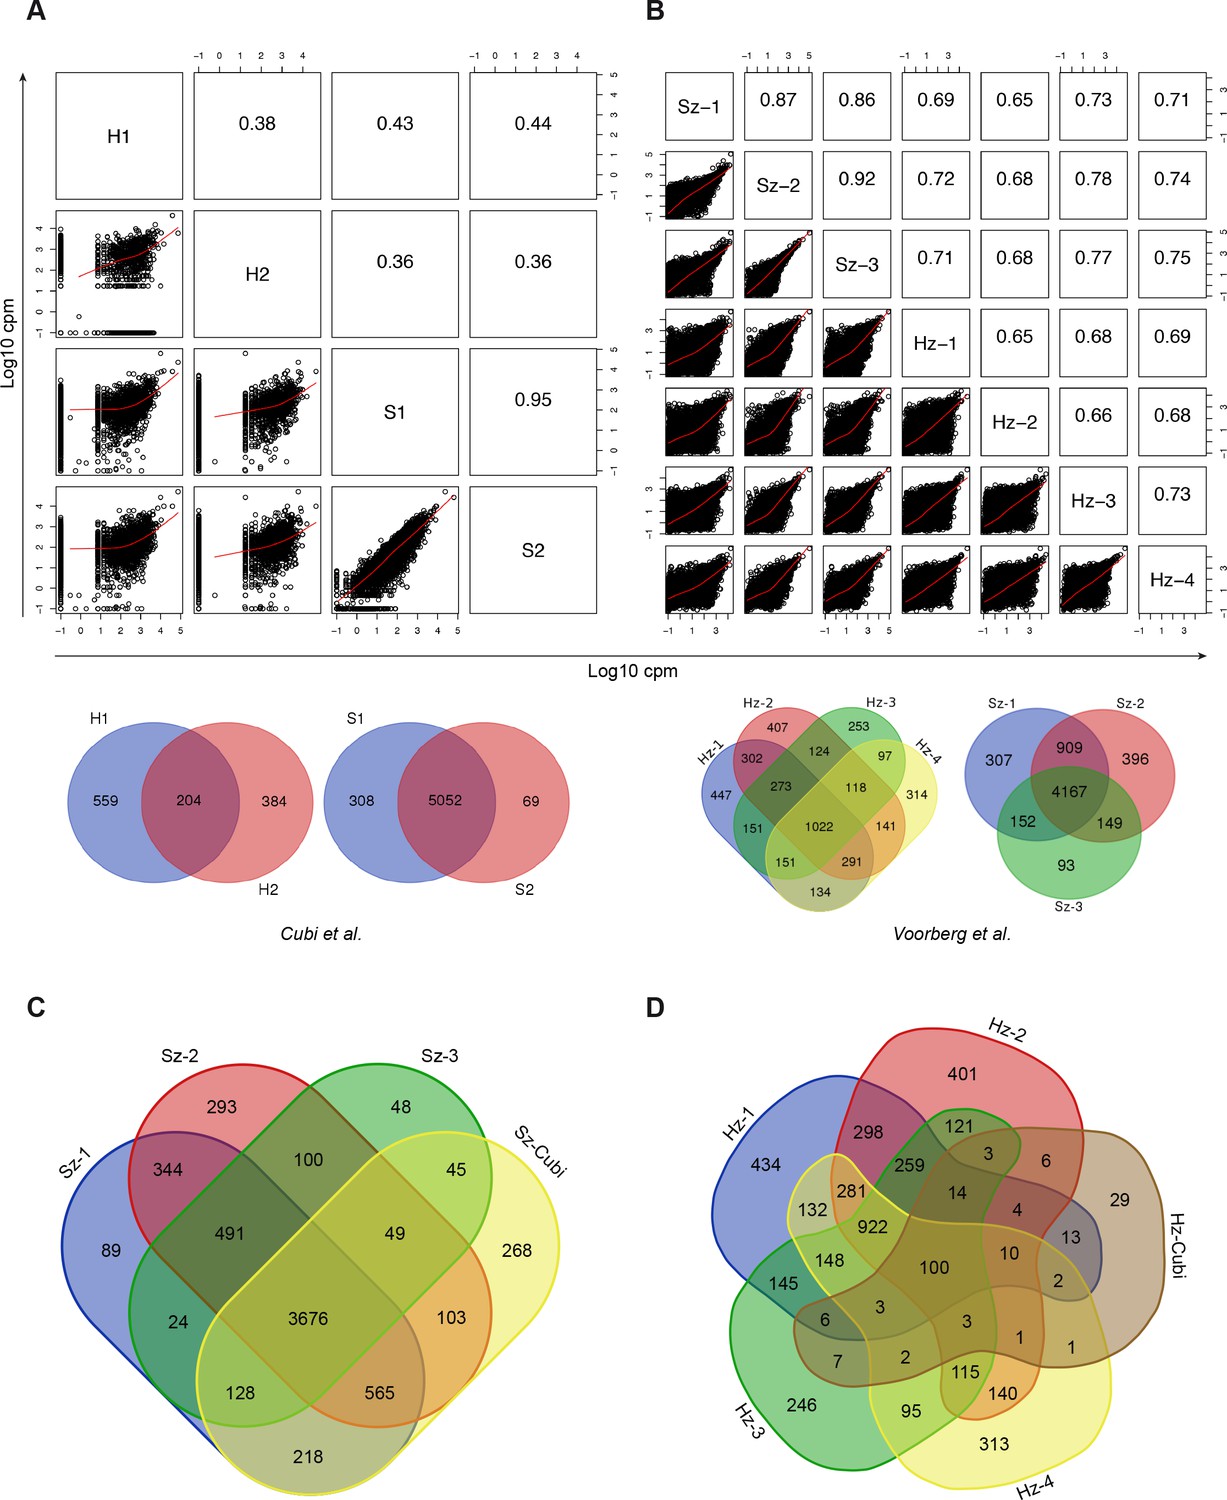
Comparison with published data.
(A) Scatter plot showing all pairwise log10 normalized CPM correlations between samples from Cubi et al. The upper right part of the panel shows the value of the calculated Pearson correlation coefficients. The Venn diagrams show the overlap of genes expressed above 1 FPKM in the hypnozoite samples and in the schizont samples, respectively. (B) Same as A, but showing data from this study. (C) Venn diagrams showing the overlap of genes expressed above 1 FPKM in the three schizont samples from this study and the 5502 genes shared by the two schizont samples from Cubi et al. (Sz-Cubi). (D) Venn diagrams showing the overlap of genes expressed above 1 FPKM in the four hypnozoite samples from this study and the 204 genes shared by the two hypnozoite samples from Cubi et al. (Hz-Cubi).
Figure 1—figure supplement 2
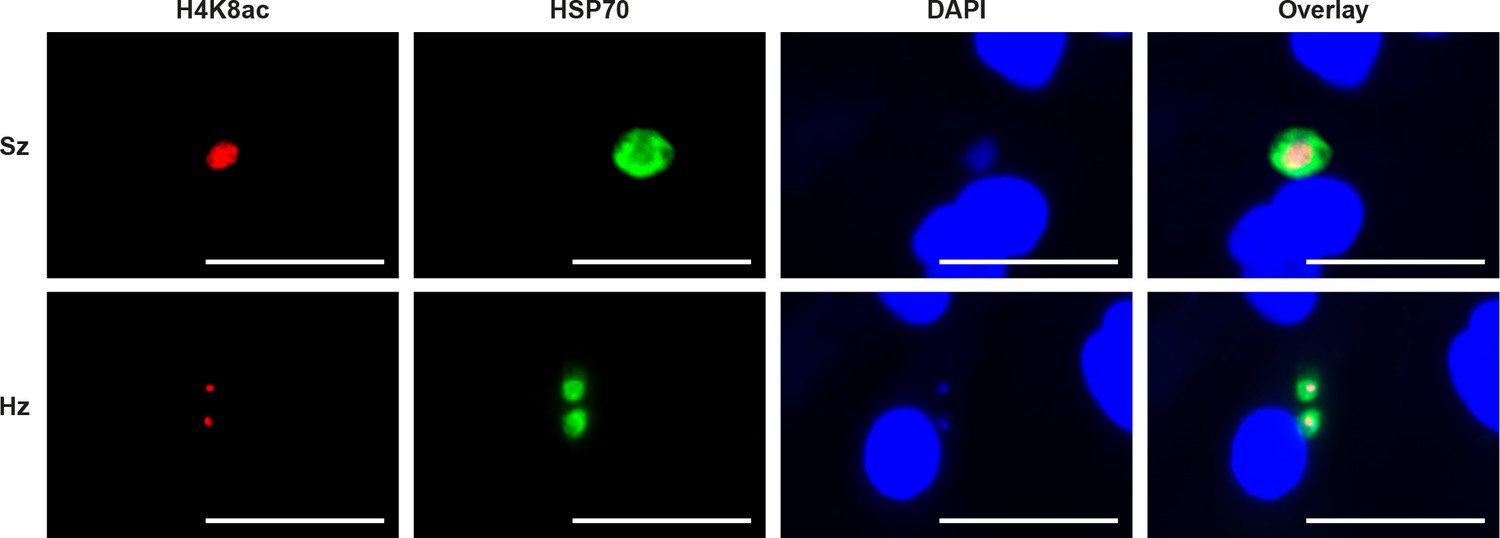
IFA staining of acetylated H4K8 in P.cynomolgi liver stages.
Immunofluorescence analysis of day 7 P. cynomolgi liver stage schizont (upper panel) and two hypnozoites (lower panel). Scale bar 25 μm.
Figure 1—figure supplement 3
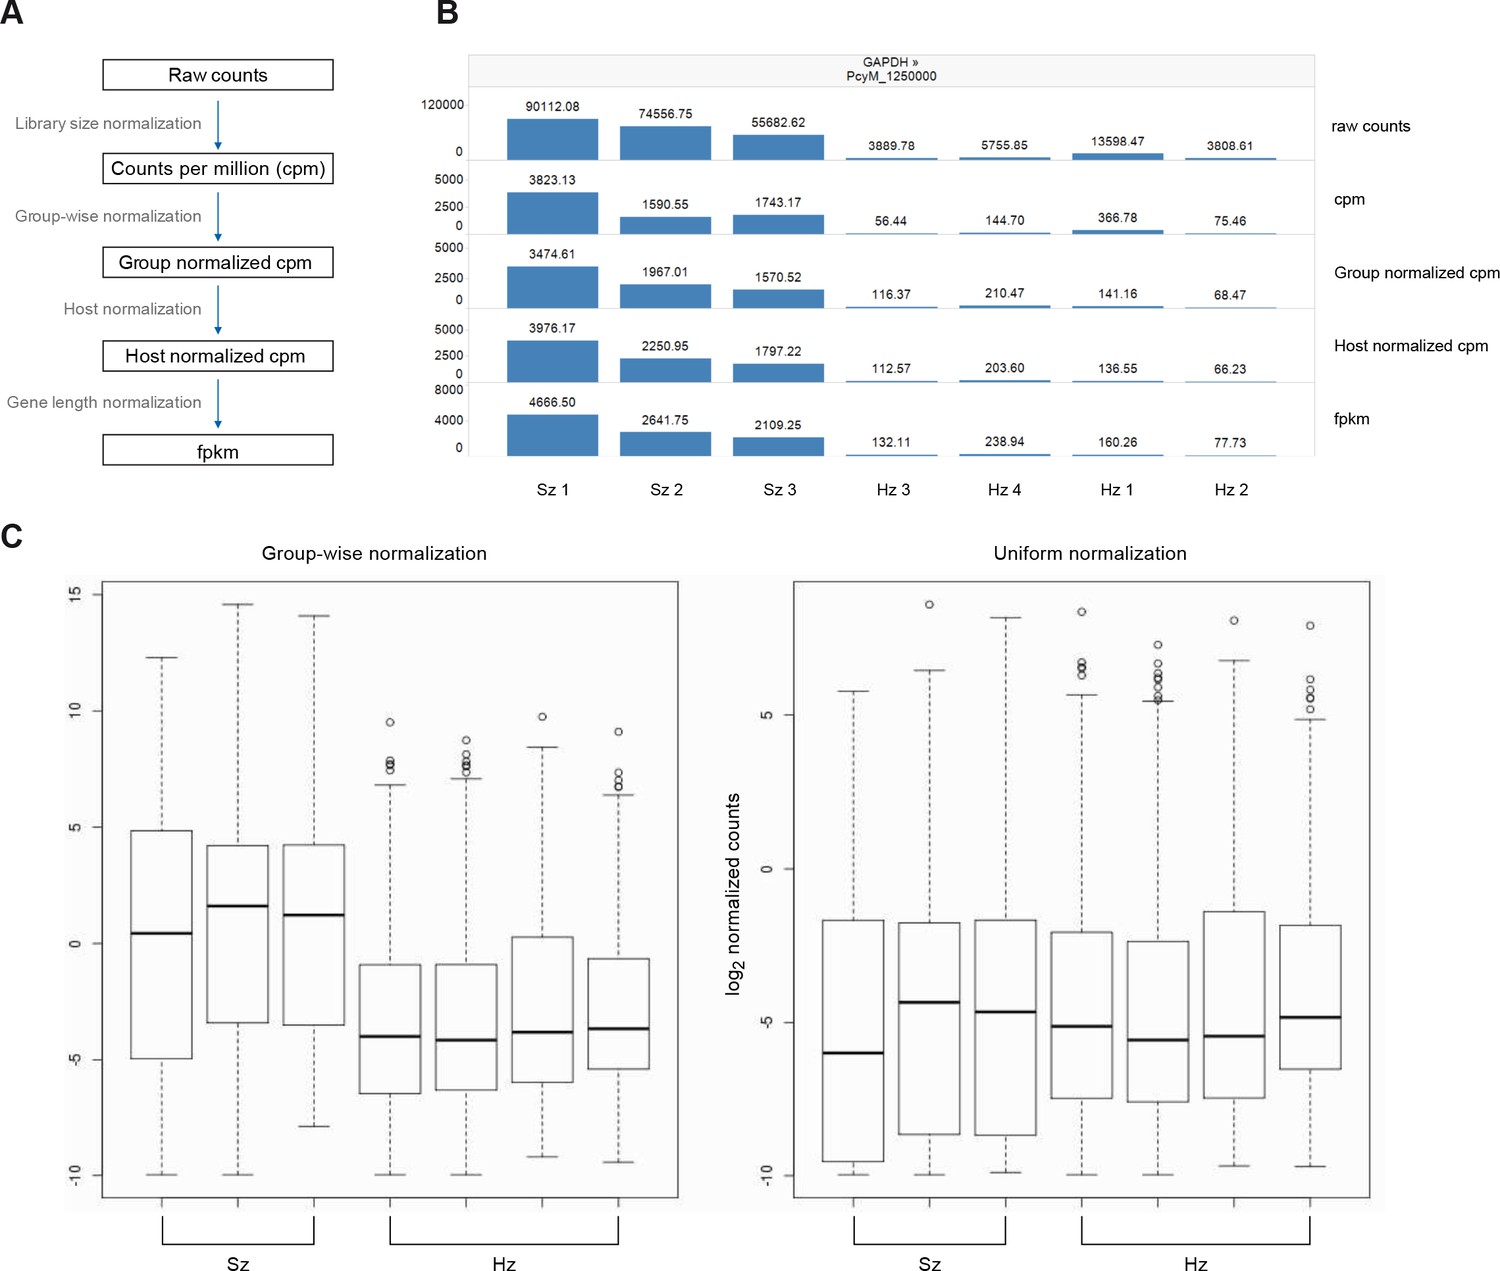
Normalization of gene expression values.
(A) Overview of the normalization process from raw counts to FPKMs. This process comprises four steps which are library size normalization, group-wise normalization, host normalization, and gene length normalization. See Materials and methods for a description of each step. (B) Effect of the normalization on gene expression levels. GAPDH is shown as an example. (C) Comparison of normalization strategies. Left: group-wise normalization is used to keep the expected difference in absolute level of gene expression between schizonts and hypnozoites. Right: uniform normalization (as applied by Cubi et al.) brings the distribution of the expression values of the hypnozoite and schizont samples onto equal levels.
-
Figure 1—figure supplement 3—source data 1
Normalization of selected Plasmodium genes.
- https://doi.org/10.7554/eLife.29605.006
Figure 2 with 1 supplement
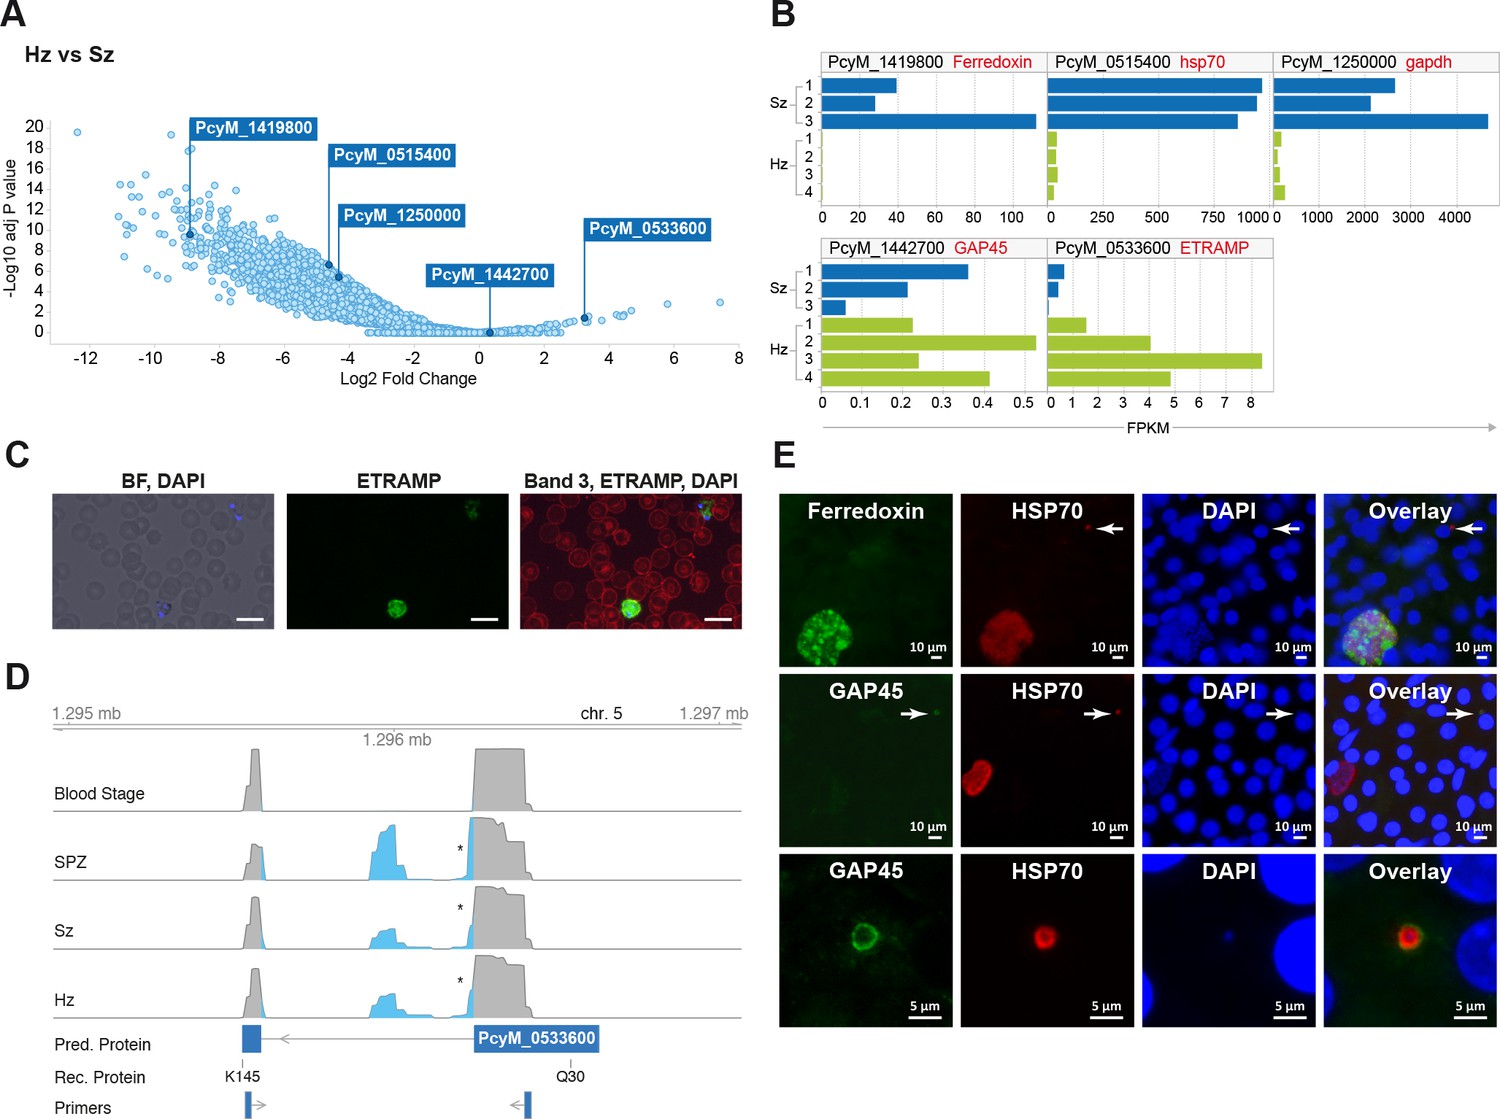
Relapsing malaria liver stages display low transcription levels and differ from developing stages.
(A) Volcano plot showing genes differentially expressed in hypnozoites (Hz, n = 4 biological replicates) versus schizonts (Sz, n = 3 biological replicates). The y-axis represents the significance as –log10 FDR-adjusted p-values and the x-axis represents the expression changes as log2 fold-change of Hz and Sz. Genes used for validation are marked. (B) Gene expression values (FPKM) of individual Hz and Sz samples from genes selected for validation. (C) Immunofluorescent staining of ETRAMP protein (green), DAPI (blue) and red blood cell (red) in P. cynomolgi blood stage parasites. Scale bars 25 μm. (D) Genome browser view of the etramp gene (PcyM_0533600) showing intron splicing events detected by sequencing of RT-PCR products in Blood stages, Sporozoites (SPZ), Schizonts (Sz) and Hypnozoites (Hz). Retained intron events are highlighted in blue; asterisk shows premature termination codons (PMTs). The predicted protein (Pred. Protein), the recombinant portion of the protein (Rec. Protein) used for antibody production (amino acids Q30-K145), and the positions of the primers used to generate the RT-PCR products are shown. (E) Immunofluorescent staining patterns of Ferredoxin (PcyM_1419800), GAP45 (PcyM_1442700), and HSP70 (PcyM_0515400) in day 6 P. cynomolgi liver schizonts and hypnozoites. Arrows, hypnozoites. Lower panel shows magnified image of GAP45 stained hypnozoite.
Figure 2—figure supplement 1
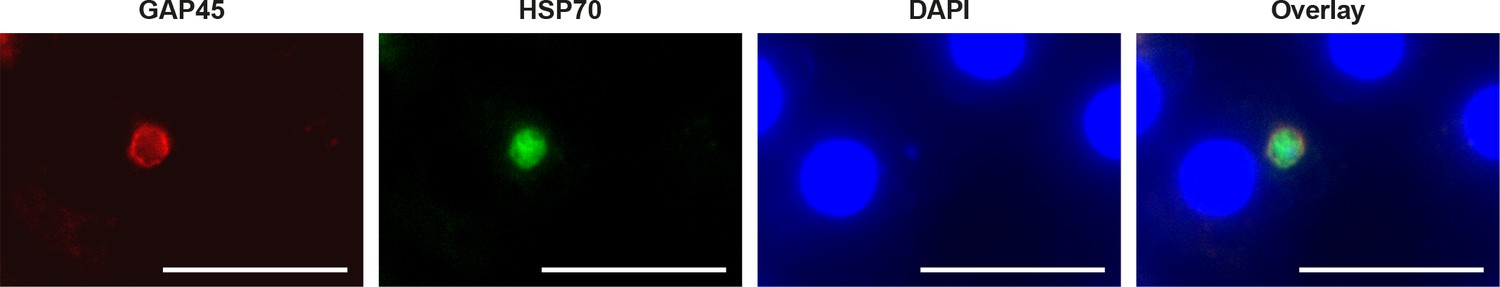
GAP45 protein expression in day 19 hypnozoite.
Staining of GAP45 protein (PcyM_1442700) in a 19 day P. cynomolgi hypnozoite parasite by immunofluorescence analysis (IFA). Scale bar 25 μm.
Figure 3 with 2 supplements
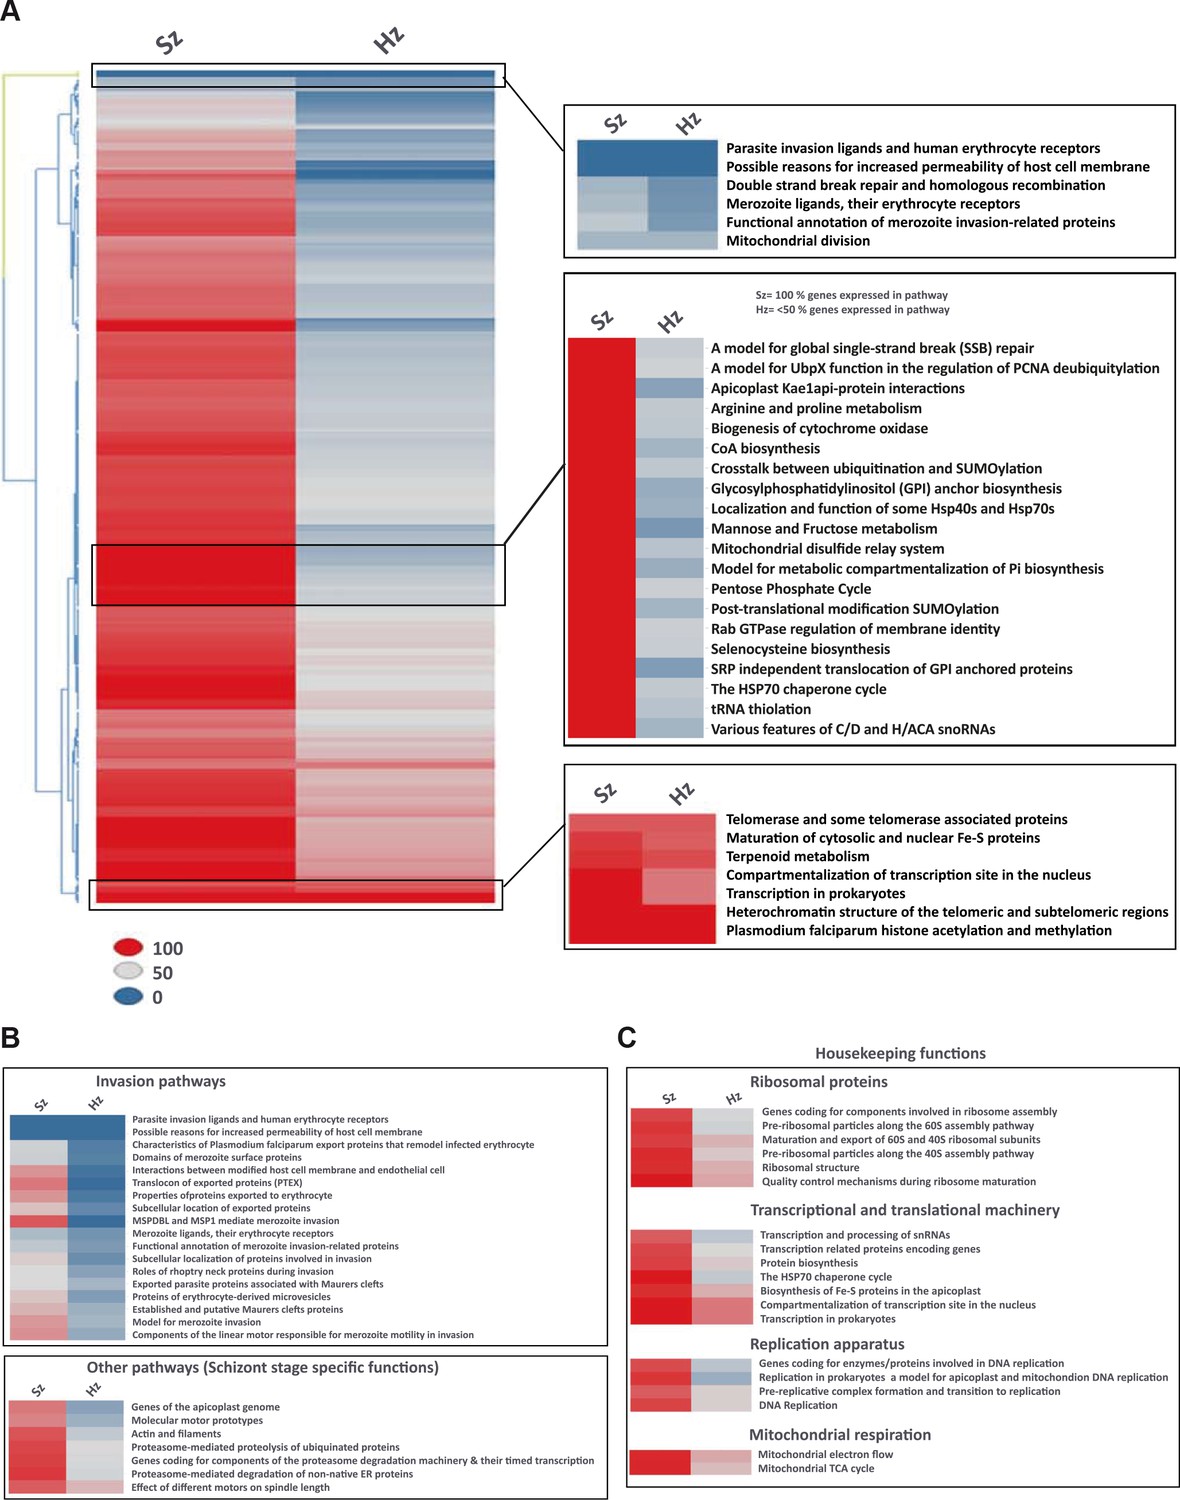
Pathway analysis of the malaria liver stages reveals the core biological functions required for hypnozoites maintenance.
(A) Heat map showing expression of Plasmodium pathways in schizonts and hypnozoites. A total of 257 pathways annotated in P. falciparum were assigned to P. cynomolgi through orthology (see Materials and methods). Pathways where the fraction of genes detected above the threshold of FPKM of 1 is 100% are shown in red, between 50% and 100% in grey, between 0% and 50% in blue. (B) Same as a) but showing only erythrocytic invasion and schizont specific pathways. (C) Same as a) but showing house-keeping pathways.
Figure 3—figure supplement 1
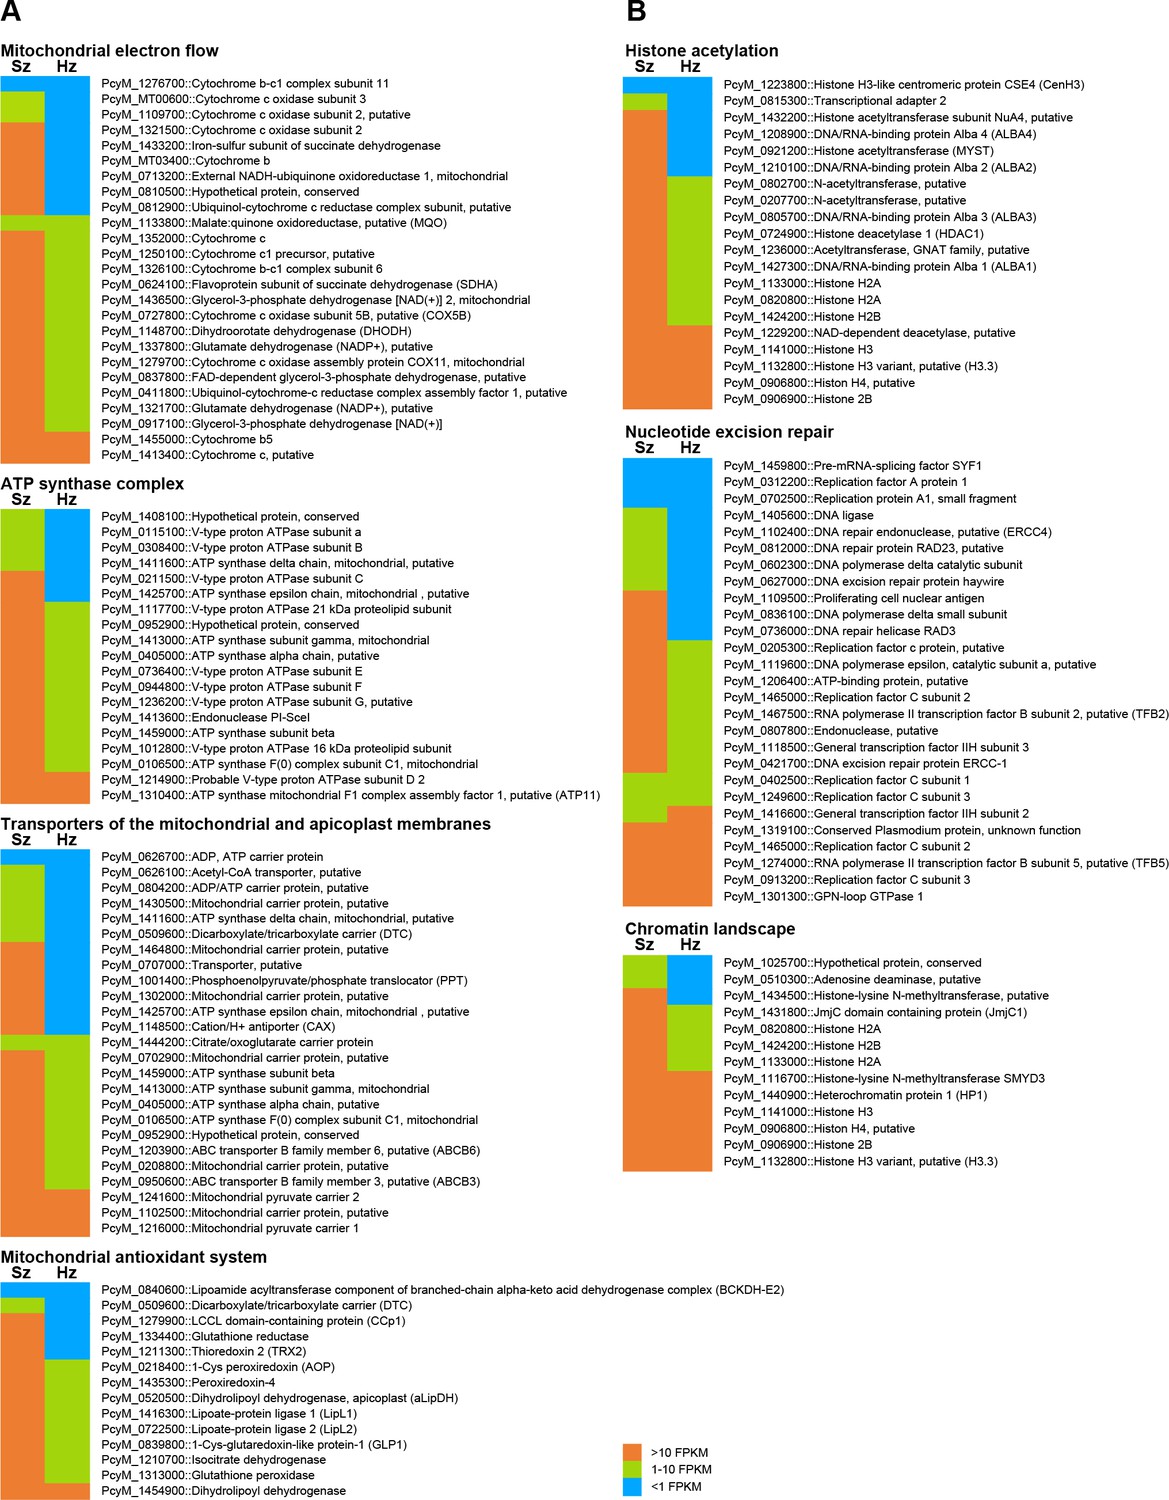
Liver stage schizont (Sz) and hypnozoite (Hz) gene expression values (FPKM) for pathways associated with quiescence.
(A) Pathways involved in maintenance of membrane potential and ATP biosynthesis. (B) Pathways involved in preservation of genome integrity.
Figure 3—figure supplement 2
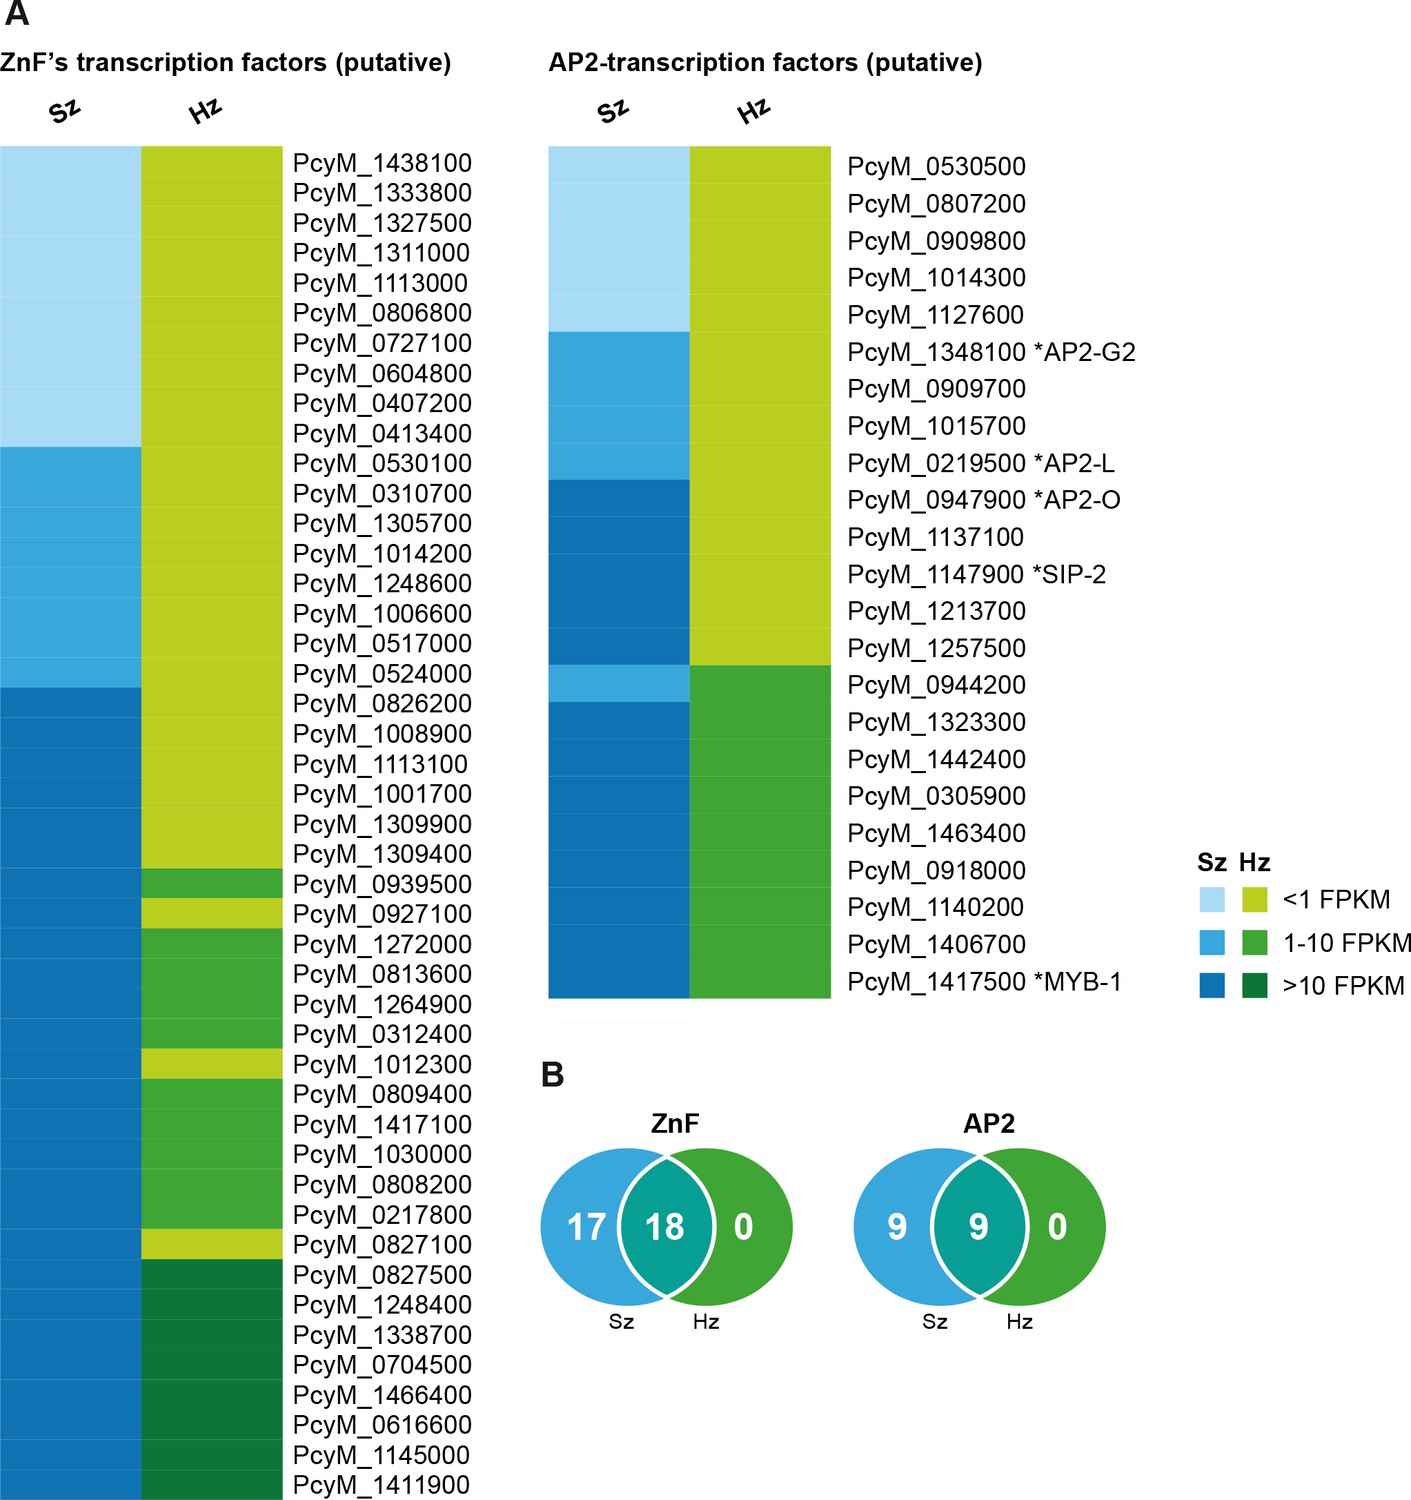
Expression of transcription factors in hypnozoites.
(A) Heat map illustrating the expression values of genes belonging to putative target classes such as ZnF’s and AP2-transcription factors. (B) Venn diagrams showing ZnF and AP2 transcription factors expressed in schizonts (Sz), hypnozoites (Hz), and both.
Figure 4
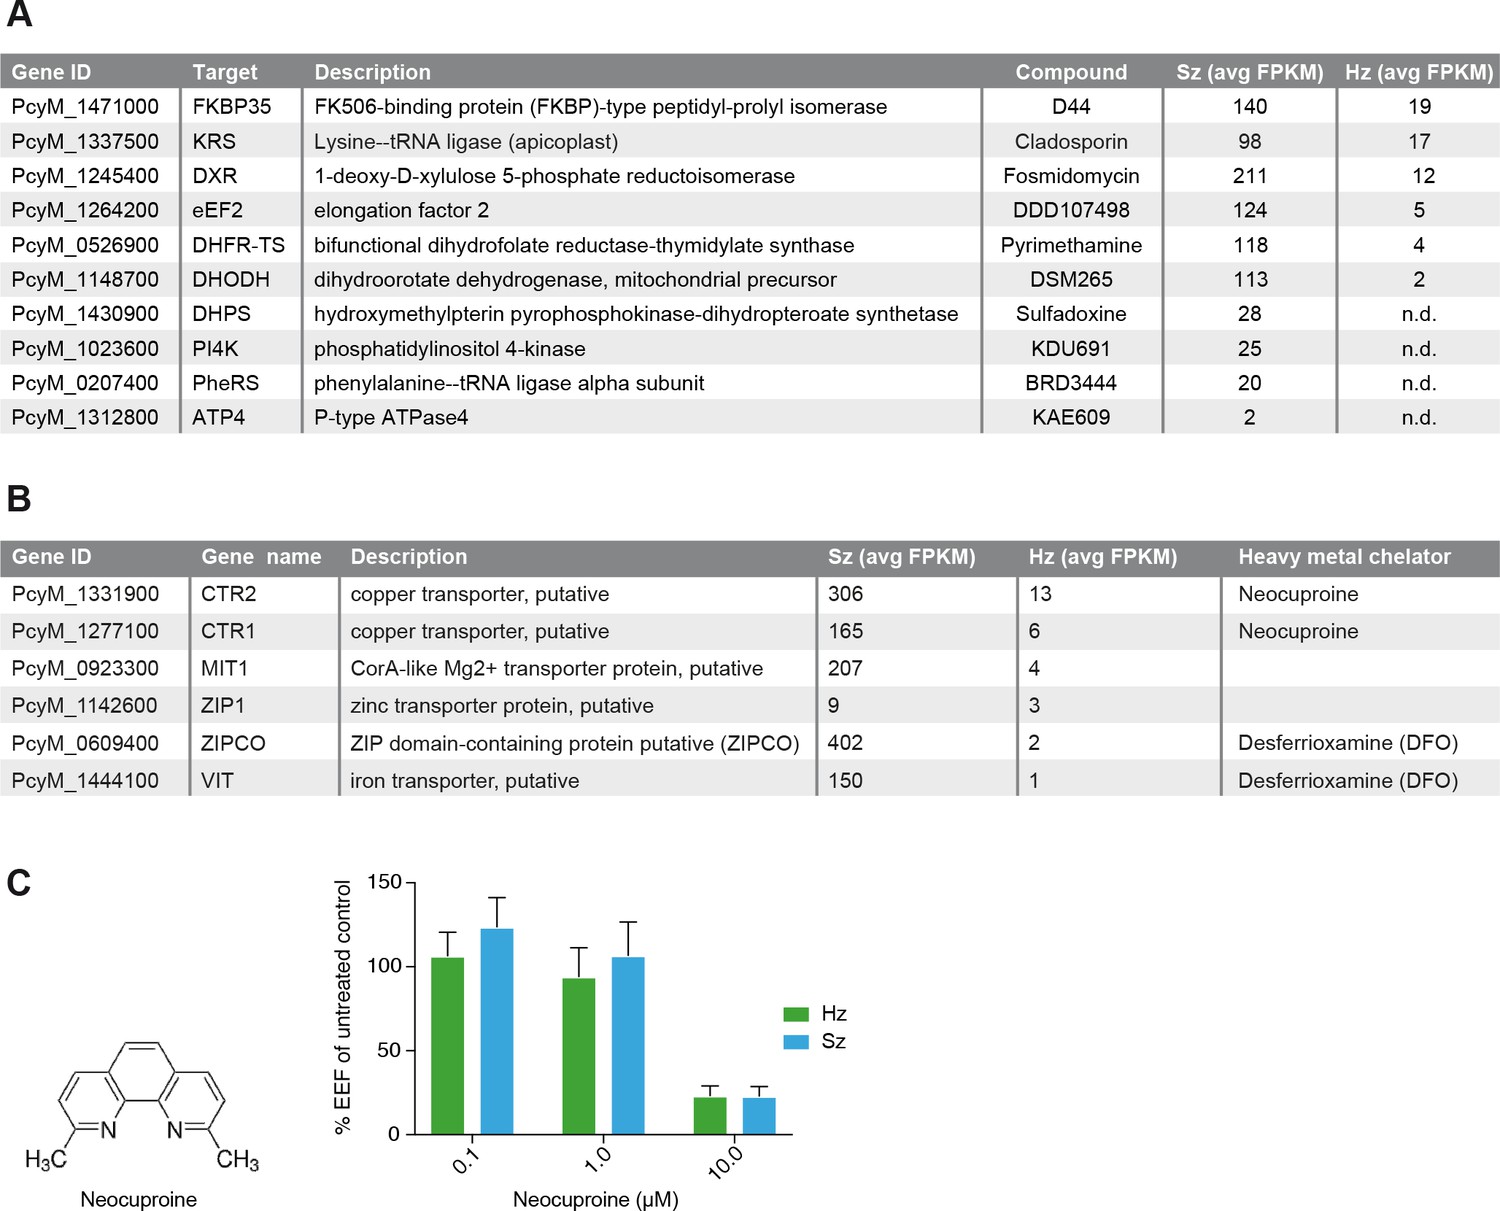
Expression of potential malaria drug targets in hypnozoites.
(A) Table showing the list of known malaria drug targets along their expression levels in the liver stages and the targeting compound. (B) Table showing list of putative heavy metal transporters with chelating agents and their expression levels in the P. cynomolgi liver stages. (C) Structure formula of the copper chelator neocuproine. Dose-dependent effect of day 0–6 neocuproine treatment on P. cynomolgi liver stage schizonts (Sz) and hypnozoites (Hz). Bar charts show averaged results of 3 independent assays (7 wells per compound dilution in total) with standard error of the mean (sem). List of Supplemental Tables.
-
Figure 4—source data 1
Neocuproine treatment of liver schizonts and hypnozoites.
Results of the three assays presented in Figure 4C.
- https://doi.org/10.7554/eLife.29605.013
Additional files
-
Supplementary file 1
P. cynomolgi samples used for RNAseq, related to Figure 1
- https://doi.org/10.7554/eLife.29605.014
-
Supplementary file 2
Reference genomes used in the analysis, related to Figure 1
- https://doi.org/10.7554/eLife.29605.015
-
Supplementary file 3
Alignment statistics per sample, related to Figure 1
- https://doi.org/10.7554/eLife.29605.016
-
Supplementary file 4
Gene expression values (FPKM after host normalization) generated by RNA-seq of hypnozoite (Hz) and liver schizont (Sz) samples, related to Figure 1
- https://doi.org/10.7554/eLife.29605.017
-
Supplementary file 5
List of differentially expressed genes between hypnozoite and liver schizont samples passing the cut-off of >2 fold change absolute value and a 10% false discovery rate, related to Figure 2
- https://doi.org/10.7554/eLife.29605.018
-
Supplementary file 6
Orthology groups obtained from the mapping of P. cynomolgi proteins to the proteomes of the following species: P. falciparum 3D7, P. berghei ANKA, P. knowlesi H, P. vivax Sal1, P. yoelii yoelii 17X, H. sapiens, D. melanogaster, M. musculus, R. norvegicus, and S. cerevisiae, related to Figure 3
- https://doi.org/10.7554/eLife.29605.019
-
Supplementary file 7
P. cynomolgi proteins linked to malaria pathways mapped from PlasmoDB, related to Figure 3
- https://doi.org/10.7554/eLife.29605.020
-
Supplementary file 8
Enrichment for genes expressed in the hypnozoite samples (Hz).
Gene sets from the Gene Ontology (GO) and PlasmoDB were used and mapped to P. cynomologi identifiers. p is the adjusted p-value (Benjamini-Hochberg), related to Figure 3
- https://doi.org/10.7554/eLife.29605.021
-
Supplementary file 9
Enrichment for genes expressed in the schizont samples (Sz).
Gene sets from the Gene Ontology (GO) and PlasmoDB were used and mapped to P. cynomologi identifiers. p is the adjusted p-value (Benjamini-Hochberg), related to Figure 3
- https://doi.org/10.7554/eLife.29605.022
-
Supplementary file 10
Gene expression values (>1 FPKM after host normalization) for putative transporters generated by RNA-seq of hypnozoite (Hz) and schizont (Sz) samples, related to Figure 4
- https://doi.org/10.7554/eLife.29605.023
-
Transparent reporting form
- https://doi.org/10.7554/eLife.29605.024
Download links
A two-part list of links to download the article, or parts of the article, in various formats.
Downloads (link to download the article as PDF)
Open citations (links to open the citations from this article in various online reference manager services)
Cite this article (links to download the citations from this article in formats compatible with various reference manager tools)
A comparative transcriptomic analysis of replicating and dormant liver stages of the relapsing malaria parasite Plasmodium cynomolgi
eLife 6:e29605.
https://doi.org/10.7554/eLife.29605


