Small conductance Ca2+-activated K+ channels induce the firing pause periods during the activation of Drosophila nociceptive neurons
- Kyoto University, Japan
Figures
Figure 1 with 1 supplement
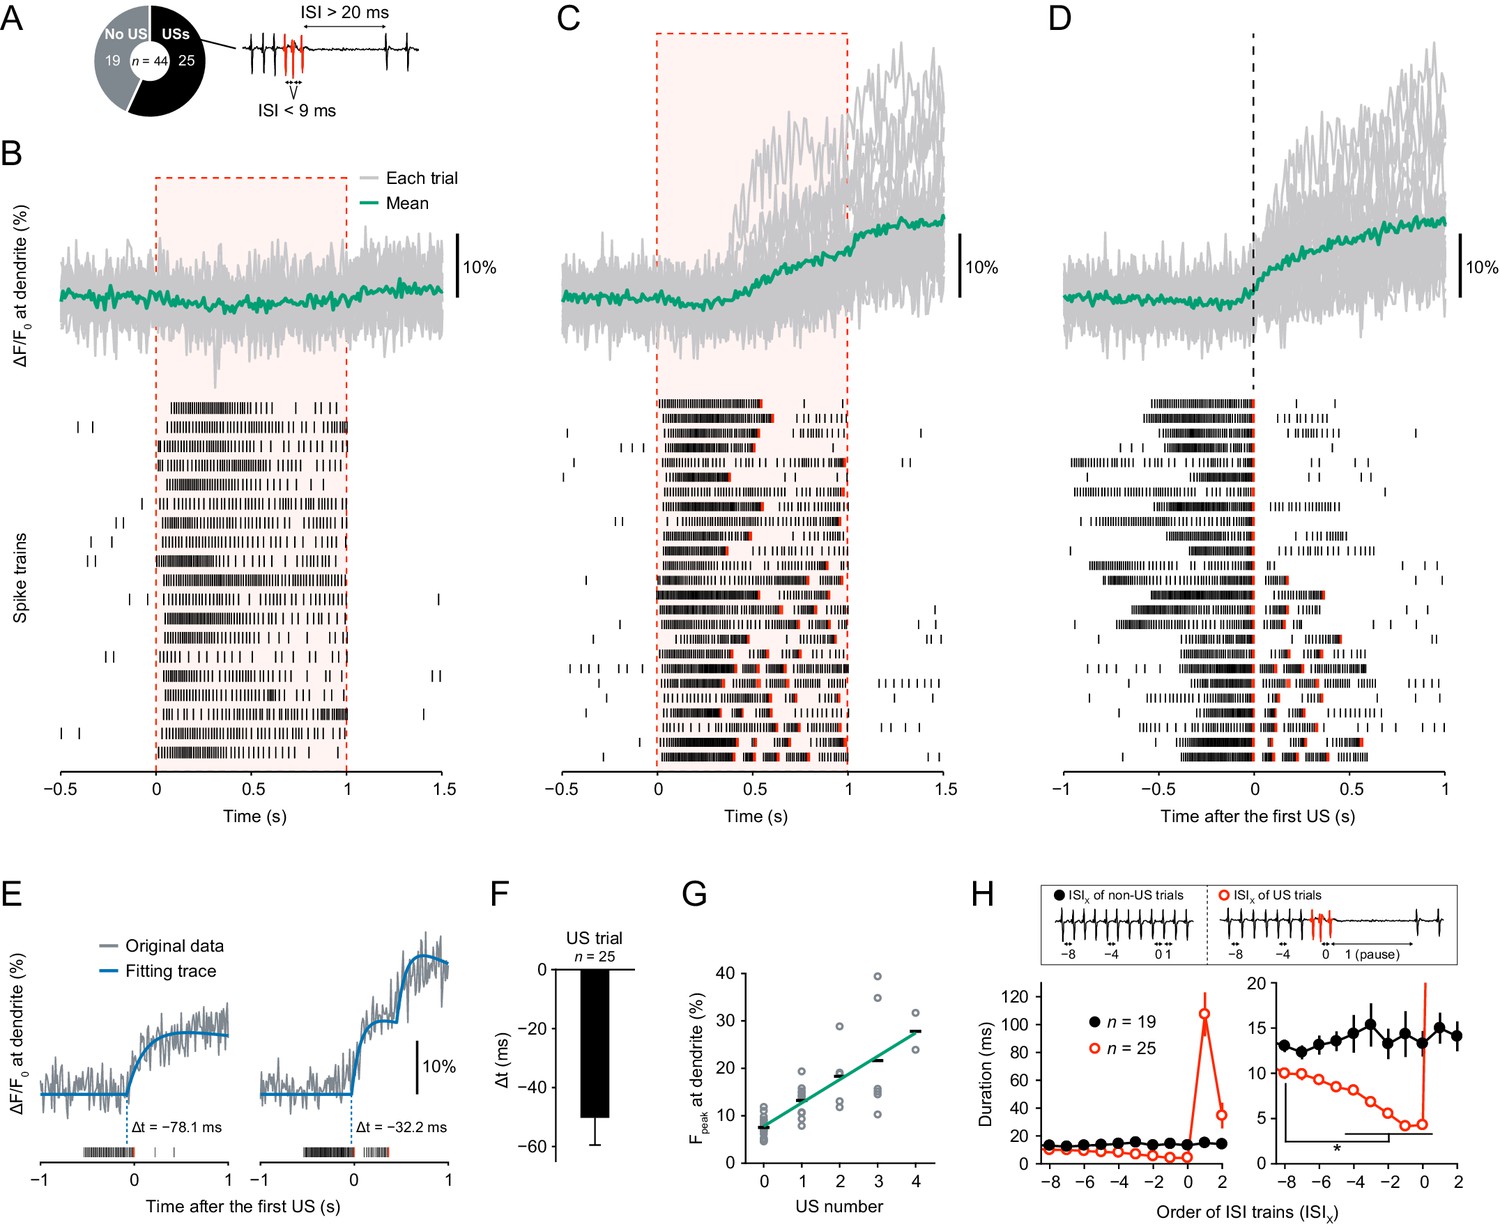
Dendritic Ca2+ transients precede unconventional spikes.
Dual recordings of Ca2+ dynamics and extracellular membrane potential in Class IV neurons expressing GCaMP5G. A 44 mW IR laser was focused onto the proximal dendritic arbors in filet preparations for 1 s (red-dashed boxes in B and C). (A) Pie chart of recordings (total n = 44 cells). To the right, the example illustrates the definition of unconventional spikes (USs, an index of the burst-and-pause firing patterns) as follows: (i) The first and second ISIs of four sequential spikes are less than 9 ms. (ii) The third ISI is longer than 20 ms. Here, sets of the three spikes except for the last one are designated as USs. (B–D) Time courses of Ca2+ levels at distal dendrites (top) and spike trains (bottom). Data are classified into trials without USs (B) and with USs (C–D). Gray lines indicate dendritic Ca2+ transients from each cell, and the green line represents the averaged amplitude. Red raster lines indicate USs. (B) Trials without USs did not generate Ca2+ transients (n = 19 cells; ΔF/F0 = 0.52 ± 0.87%, mean ± s.e.m. after laser irradiation). (C) Trials with USs generated Ca2+ transients (n = 25 cells; ΔF/F0 = 9.33 ± 1.57%, mean ± s.e.m. after laser irradiation). The first USs occurred at 0.55 ± 0.04 s (mean ± s.e.m.). (D)Data (C) are aligned at the first-US end timings. The onset of the increase in Ca2+ levels approximately coincided with the first-US timings. (E)Representative time course of Ca2+ transients (gray) and the fitting traces (blue). The onset of Ca2+ transients actually preceded the first-US timings, and the Ca2+ transients with multiple USs were stepwise (right). (F) Temporal differences between the onset of Ca2+ transients and the first-US timings. The former occurred earlier than the latter (Δt = − 50.3 ± 9.2 ms, mean ± s.e.m.). (G) Amplitudes of Fpeak are plotted against total US numbers for each trial. Short black bars indicate the averages of Fpeak, and the green line is a linear regression of plotted data (p=1.0 × 10⁻¹¹, rho = 0.82, Spearman’s rank correlation test). (H) Time course of ISIs. X of ISIX indicates the order of ISIs: (black) ISI−8–ISI2 are the minimum ISI trains of non-US trials in Figure 1B. (red) ISI0 indicates the ISIs of the first-US end, and ISI1 represents the pause periods in Figure 1C. At the right, the y-axis was magnified to show that ISIs became shorter before the occurrence of the pause (mean ± s.e.m.; *p<0.05, paired-sample t-test with Bonferroni correction).
-
Figure 1—source data 1
Source data for Figure 1.
- https://doi.org/10.7554/eLife.29754.004
-
Figure 1—source data 2
Source data for Figure 1—figure supplement 1.
- https://doi.org/10.7554/eLife.29754.005
Figure 1—figure supplement 1
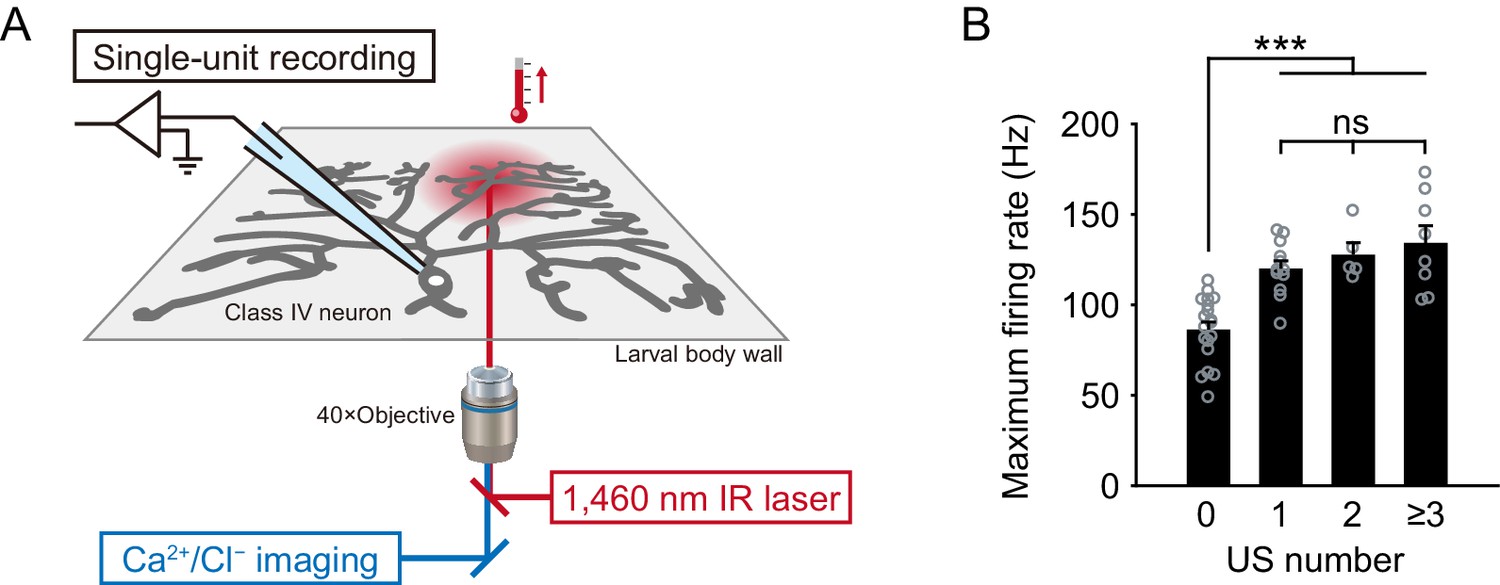
The recording system and maximum firing rates regarding the US number.
(A) A schematic diagram of the recording system. As a heating device, the IR-laser beam passes through an objective and targets Class IV neurons in whole- or filet-mounted larvae. We measured firing responses of the neuronal somata using an extracellular recording electrode in filet preparations, and acquired Ca2+ or Cl− dynamics in whole-mount or filet preparations. (B) Maximum firing rates from Figure 1B–C regarding the US number. The maximum firing rates of US trials (Figure 1C) was larger than that of non-US ones (Figure 1B; mean ± s.e.m.; ***p<0.001, Student’s t-test with Bonferroni correction), but it did not significantly change among trials with varying numbers of US.
Figure 2 with 2 supplements
Electrophysiological screen of Cl− and K+ channels.
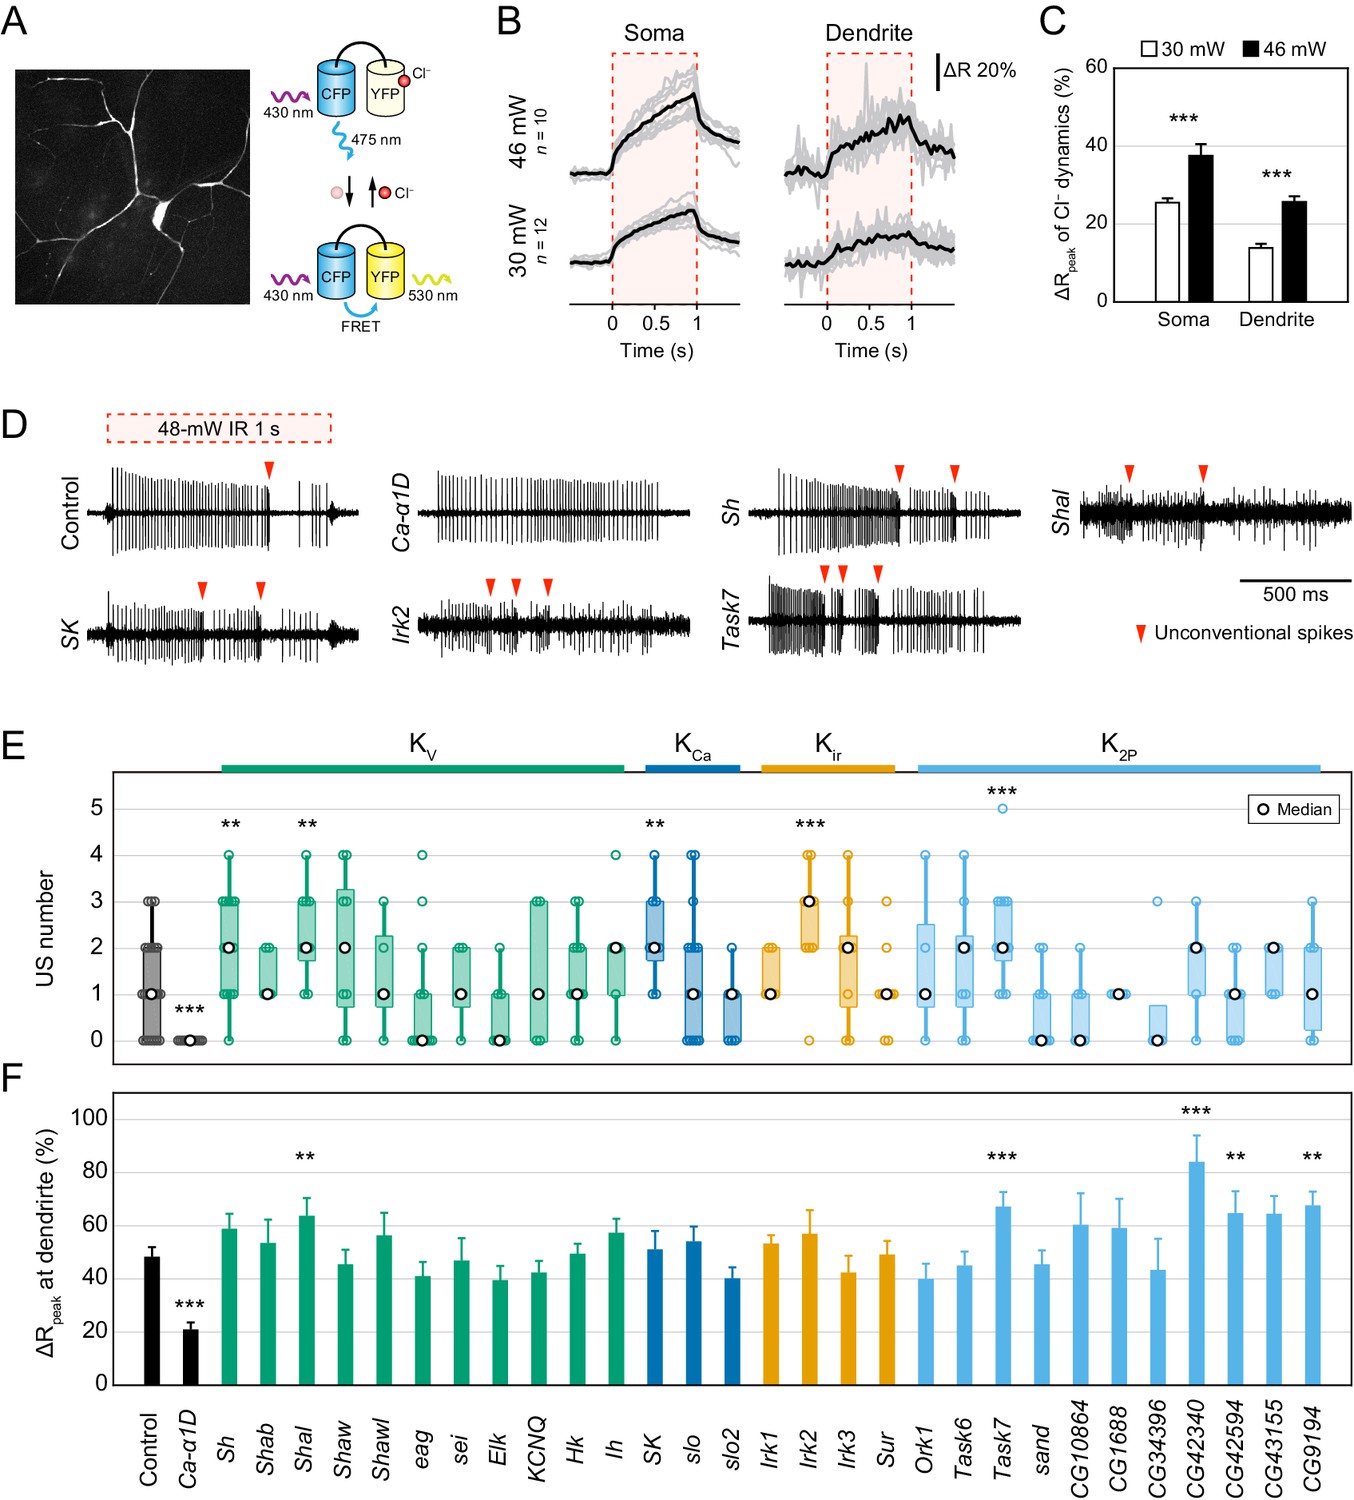
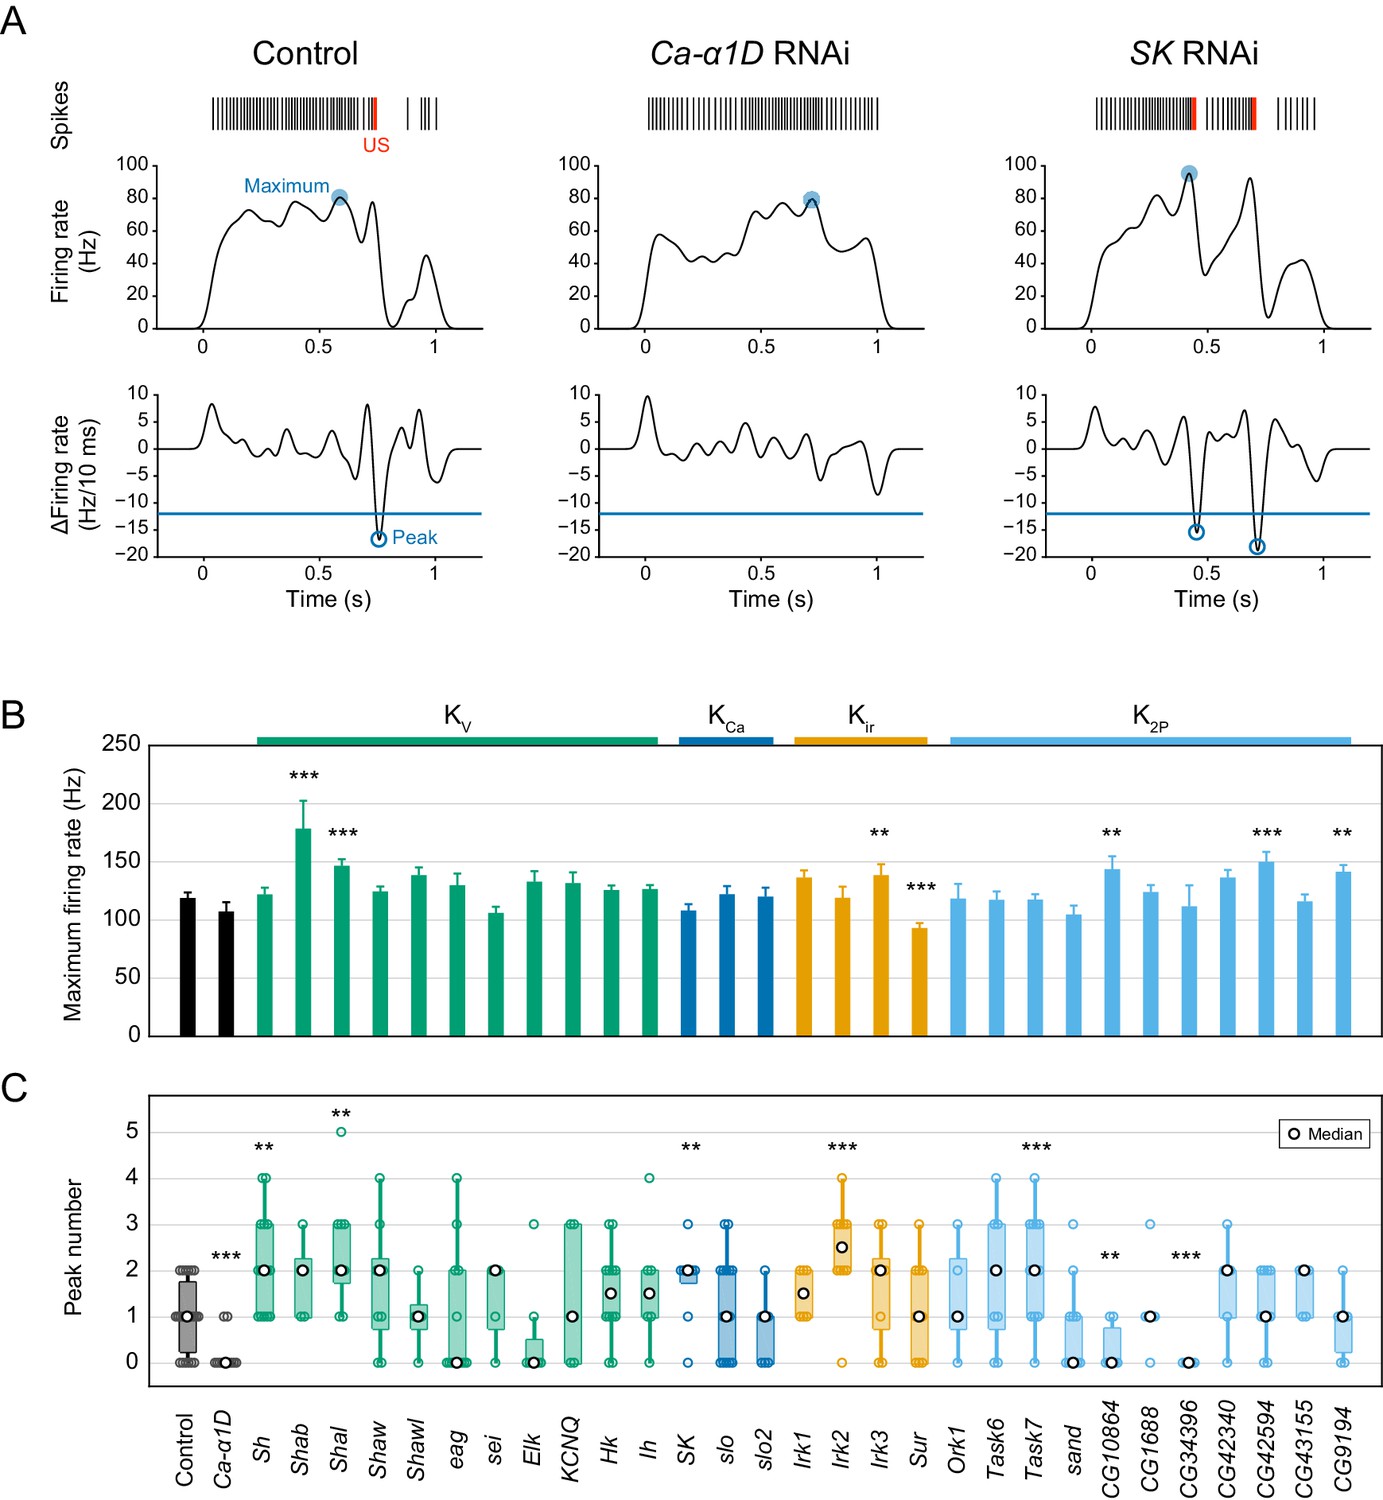
(A–C) Cl− dynamics of Class IV neurons expressing SuperClomeleon. The IR laser (30 and 46 mW) was focused onto the proximal dendritic arbors in whole-mount preparations for 1 s (red-dashed boxes in B). (A) A schematic diagram of Cl− indicator SuperClomeleon. The FRET ratio decreases upon an influx of Cl−, due to quenching of YFP fluorescence by reversible Cl− binding. Left is a representative CFP image before IR-laser irradiation. (B) Time courses of the FRET ratio at somata (left) and distal dendrites (right) in wild-type neurons. Both of them increased upon IR-laser irradiation. Gray lines indicate each of the Cl− changes, and black lines represent the averaged amplitudes. The apparent efflux of Cl− ions was unexpected. (C) Amplitudes of ΔRpeak of SuperClomeleon increased with IR-laser power (mean ± s.e.m.; ***p<0.001, Student’s t-test). (D–F) Responses of screened neurons expressing the Ca2+ indicator TN-XXL. The 48 mW IR laser was focused onto the proximal dendritic arbors in filet preparations for 1 s (red-dashed box in D). **p<0.05, ***p<0.01 versus control. (D) Representative recordings of control, Ca-α1D (L-type VGCC α1 subunit gene) RNAi and K+ channel-coding gene (Shaker, Shal, SK, Irk2 and Task7) RNAi neurons. (E) Boxplot of the total US number in screened neurons. The US number increased in five different gene knockdown neurons (Sh, Shal, SK, Irk2 and Task7; Wilcoxon rank sum test). (F) Amplitudes of the dendritic Ca2+ transients in screened channels. The amplitudes did not decrease except for Ca-α1D RNAi neurons (mean ± s.e.m.; Student’s t-test). Bottom horizontal labels indicate symbols of knocked down genes and upper labels represent channel families: Kv, voltage-gated K+ channel; KCa, Ca2+-activated K+ channel; Kir, Inward rectifier K+ channel; K2P, Two-pore domain K+ channel.
-
Figure 2—source data 1
Twenty-Nine K+ channels were screened.
w was a negative control and Ca-α1D was a positive control whose knockdown abolished burst-and-pause firing patterns.
- https://doi.org/10.7554/eLife.29754.009
-
Figure 2—source data 2
Source data for Figure 2.
- https://doi.org/10.7554/eLife.29754.010
-
Figure 2—source data 3
Source data for Figure 2—figure supplement 1.
- https://doi.org/10.7554/eLife.29754.011
-
Figure 2—source data 4
Source data for Figure 2—figure supplement 2.
- https://doi.org/10.7554/eLife.29754.012
Figure 2—figure supplement 1
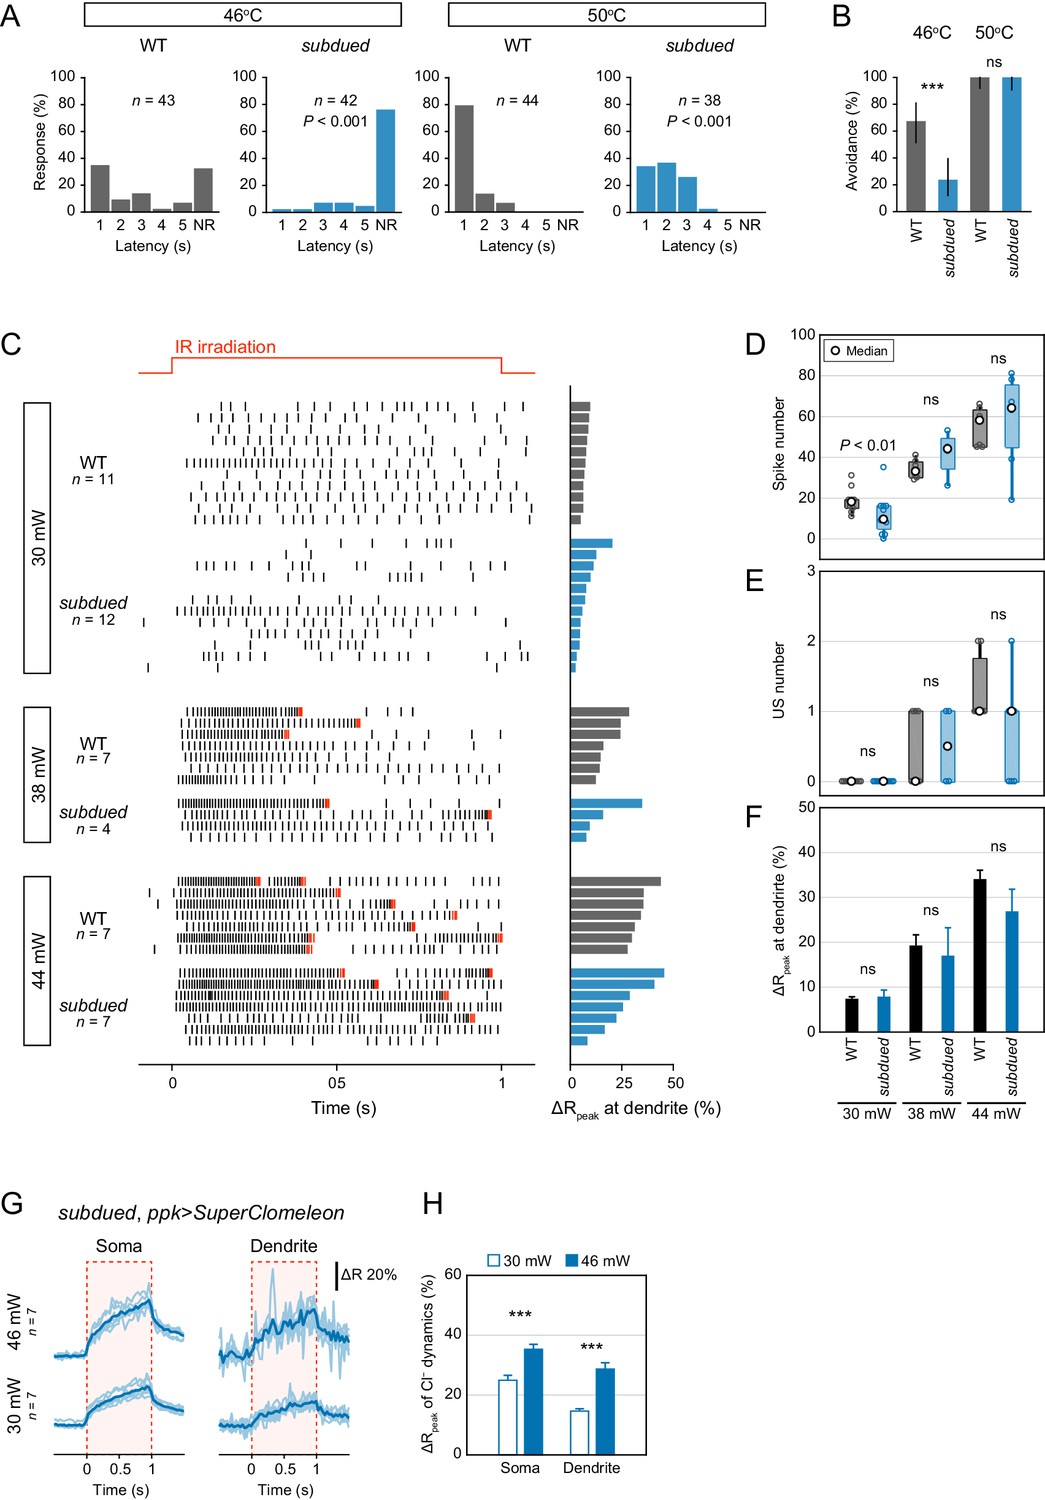
Behavioral and electrophysiological analysis of subdued mutants.
The gating property of subdued channels is dependent on heat, voltage and Ca2+, and the expression in Class IV neuron is required for larval heat avoidance behavior (Jang et al., 2015). Considering the results of the Cl− ion direction (Figure 2B–C), the possibility of subdued channels contributing to inhibitory currents is low, although an effect of the Subdued channels on neuronal activity cannot be completely excluded. (see below). (A–B) Avoidance behavior of wild-type and subdued mutant larvae expressing TN-XXL in response to thermal stimulation (46°C and 50°C). The onsets of avoidance behavior were delayed at both temperatures, and the fraction of no response was increased in mutant larvae at 46°C. (A) The distribution of response latency (Wilcoxon rank sum test). NR, no response group. (B) Percentage of larvae responding within 5 s with 95% Clopper-Pearson confidence intervals (Fisher’s exact test). (C–F) Responses of wild-type and subdued mutant neurons expressing TN-XXL with different IR-laser power (30, 38 and 44 mW). The IR laser was focused onto the proximal dendritic arbors in filet preparations for 1 s (upper red line in C). (C) Raster plots of firing (left) and magnitudes of the ΔRpeak corresponding to dendritic Ca2+ transients (right). Trials are sorted by descending order of the magnitude of the ΔRpeak. Red raster lines indicate USs. (D) Spike numbers decreased in subdued mutant neurons only at low IR-laser power (30 mW; boxplot; Student’s t-test). (E–F) subdued mutant neurons did not significantly change the number of USs (E; boxplot, Wilcoxon rank sum test) or the amplitudes of the dendritic Ca2+ transients (F; mean ± s.e.m., Student’s t-test). (G–H) Cl− dynamics of subdued mutant neurons expressing SuperClomeleon. The IR laser (30 and 46 mW) was focused onto the proximal dendritic arbors in whole-mount preparations for 1 s (red-dashed boxes in G). (G) Time courses of the FRET ratio of SuperClomeleon at somata (left) and distal dendrites (right) in subdued mutant neurons. The ratio increased upon IR irradiation. Light blue lines indicate each of the Cl− changes, and dark lines represent the averaged amplitudes. (H) Amplitudes of the ΔRpeak for SuperClomeleon increased with IR-laser power in subdued mutant neurons (mean ± s.e.m., Student’s t-test), but they were not significantly different from the values obtained for wild-type neurons in Figure 2C. Furthermore, there were no changes in physiological activities in subdued knockdown neurons (data not shown). These results suggested that Subdued channels can contribute to membrane excitation in Class IV neurons, although their function may be rather limited; in any case, the channels were not a source of inhibitory currents. *p<0.05, **p<0.01, ***p<0.001.
Figure 2—figure supplement 2
Quantification of the maximum firing rate and the peak number.
(A) Representative traces of control, Ca-α1D, and SK RNAi neurons. Firing rates (middle) were computed from spike trains (top) by Gaussian kernel methods (σ = 25 ms; Shimazaki and Shinomoto, 2010). The temporal differences in the firing rate were calculated (bottom, per 10 ms), and peaks of the time derivative were specified below a threshold (−12 Hz/10 ms) where the firing rate decreased by 60 Hz for 50 ms. The local minimum was more closely matched to detect burst-and-pause firing patterns than the local maximum that was used in our previous work (Terada et al., 2016). (B) Bar plots of the maximum firing rates in screened neurons (mean ± s.e.m., Student’s t-test). (C) Boxplots of the peak numbers in screened neurons. The peak number increased in five different gene knockdown neurons (Sh, Shal, SK, Irk2 and Task7; Wilcoxon rank sum test). Bottom horizontal labels indicate symbols of knocked down genes and upper labels indicate channel families: Kv, voltage-gated K+ channel; KCa, Ca2+-activated K+ channel; Kir, Inward rectifier K+ channel; K2P, Two-pore domain K+ channel. **p<0.05, ***p<0.01 versus control.
Figure 3 with 5 supplements
SK channels generate pause periods.
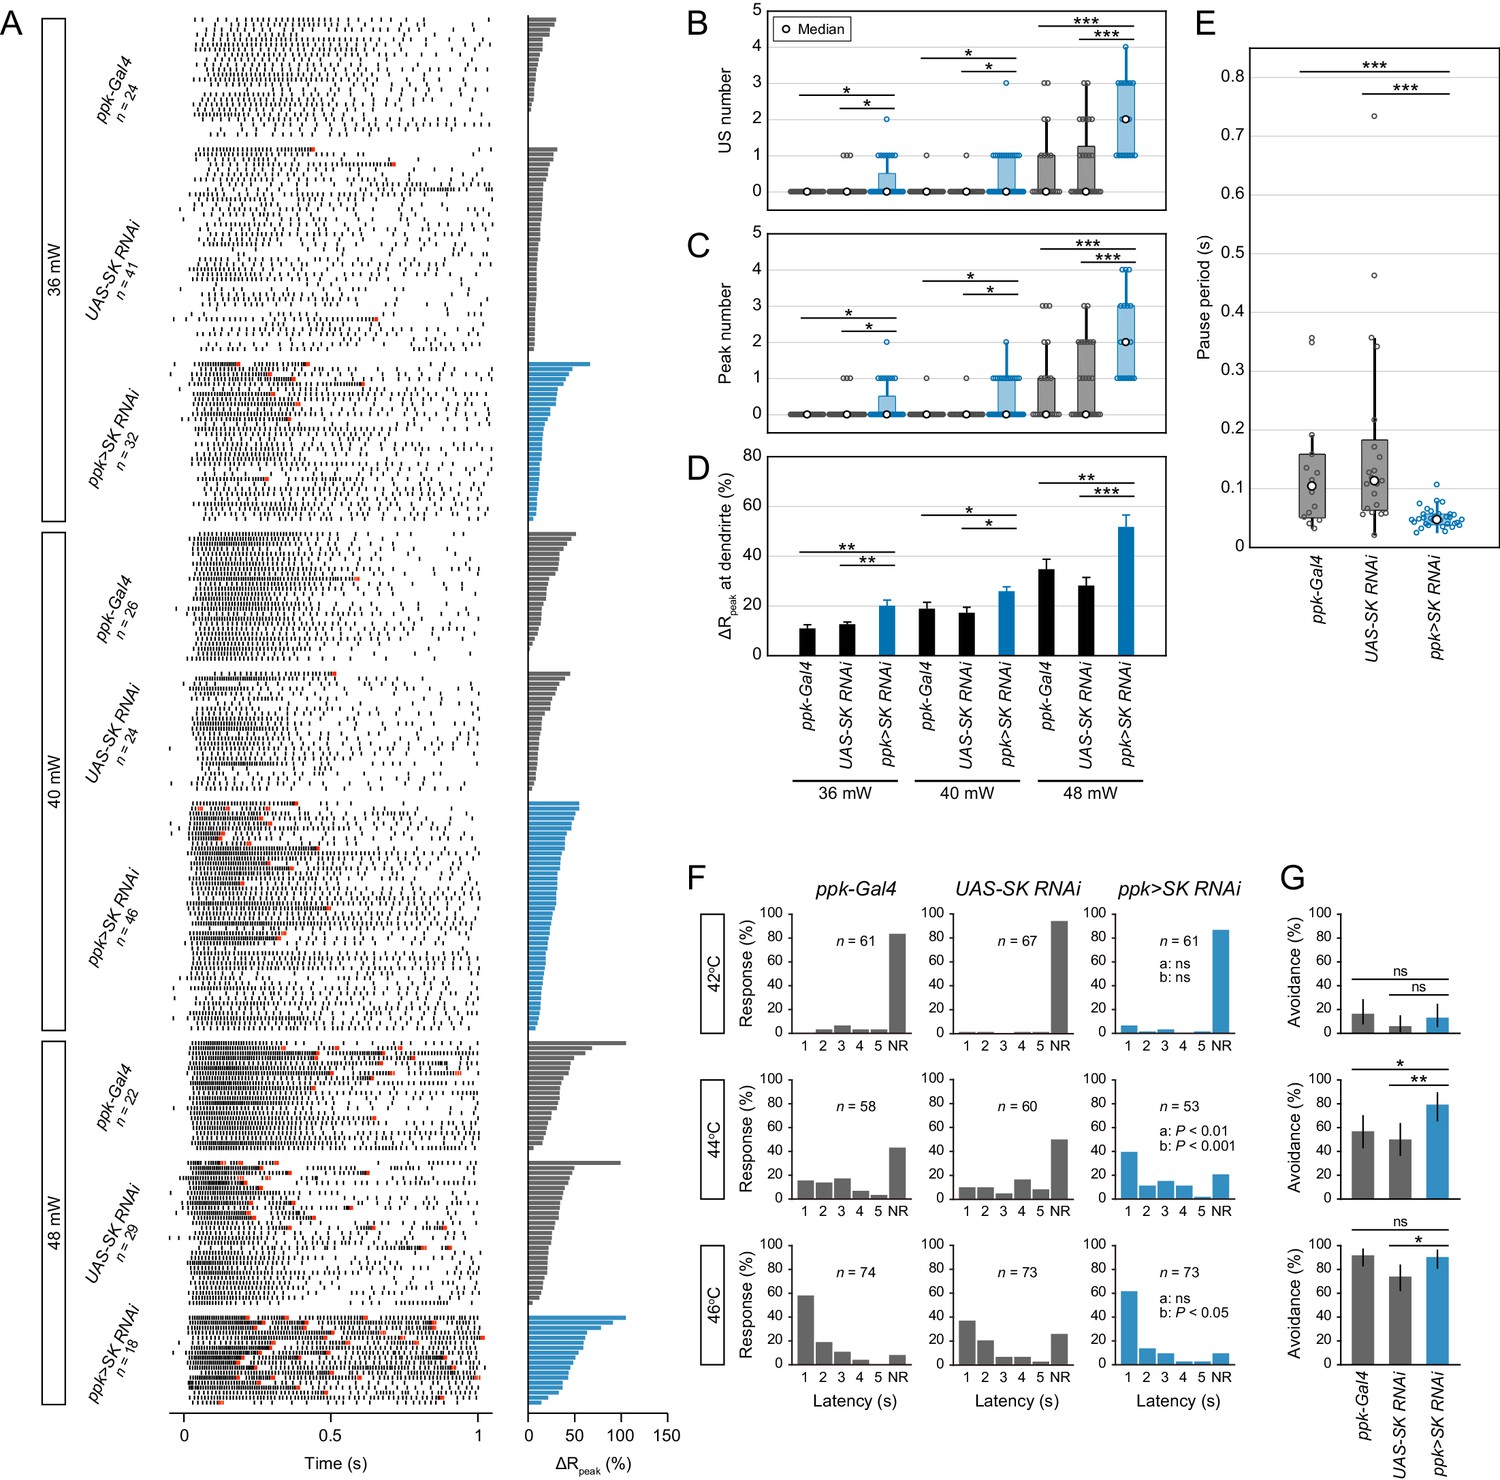
(A–E) Responses of two control neurons (ppk-Gal4 and UAS-SK RNAiHMJ21196) and SK knockdown neurons (ppk>SK RNAiHMJ21196) with different IR-laser power settings (36, 40 and 48 mW). The IR laser was focused onto the proximal dendritic arbors in filet preparations for 1 s. (A)Raster plots of firing (left) and magnitudes of the ΔRpeak corresponding to dendritic Ca2+ transients (right). Trials are sorted in descending order of the magnitude of the ΔRpeak. Red raster lines indicate USs. (B–D) SK knockdown neurons increased the US number, peak number (B and C; boxplots; Wilcoxon rank sum test with Holm correction), and amplitude of the dendritic Ca2+ transients (D; mean ± s.e.m.; Student’s t-test with Holm correction) with three different laser powers. (E) Boxplots of the pause periods triggered by the 48 mW IR laser. Pause periods were shortened in SK knockdown neurons (median: [ppk-Gal4] 103.9 ms (n = 14), [UAS-SK RNAi] 112.9 ms (n = 21), [ppk >SK RNAi] 46.75 ms (n = 34); Student’s t-test with Holm correction). (F–G) Avoidance behavior of two control larvae and SK knockdown larvae in response to thermal stimulation (42, 44, and 46°C). (F) The distribution of response latency. SK knockdown larvae displayed fast onsets of responses upon moderate stimulation (44°C; median: [ppk-Gal4] 3.80 s, [UAS-SK RNAi] 4.86 s, [ppk>SK RNAi] 1.80 s; Wilcoxon rank sum test with Holm correction). Neither control nor SK knockdown larvae showed avoidance behavior upon lower stimulation (42°C), whereas most of the larvae displayed it with higher stimulation (46°C). NR, no response group. ‘a’ is a P value versus ppk-Gal4, and ‘b’ is that versus UAS-SK RNAi. (G) Percentage of larvae responding within 5 s with 95% Clopper-Pearson confidence intervals. The response rate of SK knockdown larvae increased upon moderate stimulation (44°C: [ppk-Gal4] 56.9%, [UAS-SK RNAi] 50.0%, [ppk>SK RNAi] 79.2%; Fisher’s exact test with Holm correction). *p<0.05, **p<0.01, ***p<0.001.
-
Figure 3—source data 1
Source data for Figure 3.
- https://doi.org/10.7554/eLife.29754.019
-
Figure 3—source data 2
Source data for Figure 3—figure supplement 1.
- https://doi.org/10.7554/eLife.29754.020
-
Figure 3—source data 3
Source data for Figure 3—figure supplement 2.
- https://doi.org/10.7554/eLife.29754.021
-
Figure 3—source data 4
Source data for Figure 3—figure supplement 3.
- https://doi.org/10.7554/eLife.29754.022
-
Figure 3—source data 5
Source data for Figure 3—figure supplement 4.
- https://doi.org/10.7554/eLife.29754.023
-
Figure 3—source data 6
Source data for Figure 3—figure supplement 5.
- https://doi.org/10.7554/eLife.29754.024
Figure 3—figure supplement 1
Maximum firing rates regarding the presence of USs and the effect of SK knockdown.
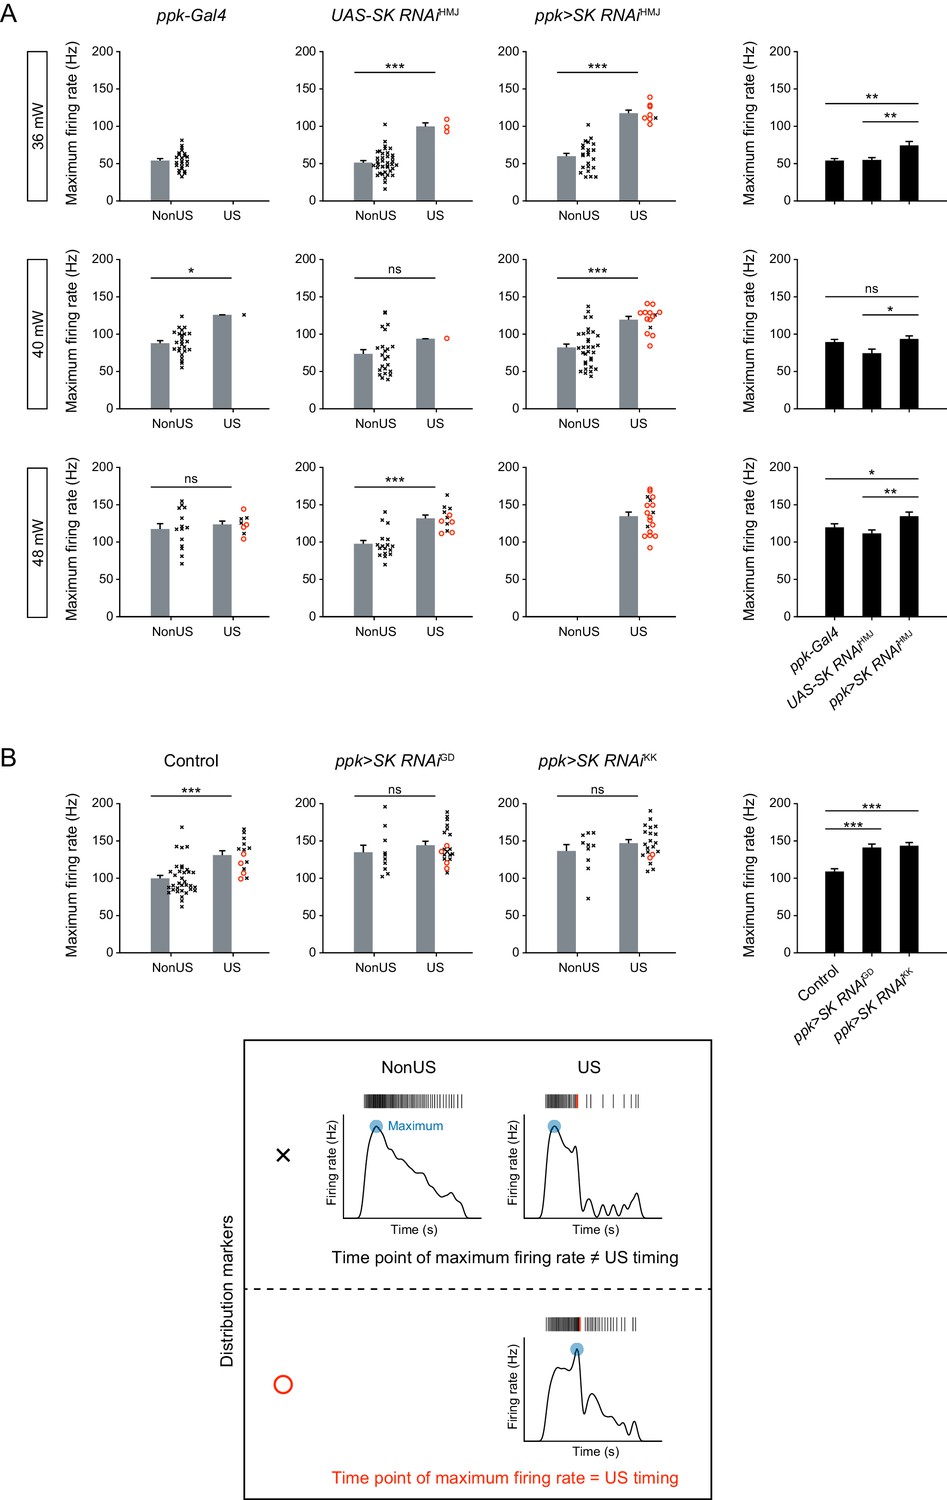
(Left 3 columns) Data were classified into two groups: non-US and US. When USs occurred, the maximum firing rate tended to increase and several time points of the maximum firing rate overlapped with US timings. Gray bars indicate mean + s.e.m., and the right scatter plots show the distribution of all trials (see the bottom box). (Right 1 column) Maximum firing rate including both non-US and US trials. SK knockdown tended to increase the maximum firing rates upon all laser powers tested. Black bars indicate mean +s.e.m. (A) Quantification of Figure 3A. (B) Quantification of Figure 3—figure supplement 2A. *p<0.05, **p<0.01, ***p<0.001, Student’s t-test with Holm correction.
Figure 3—figure supplement 2
Analysis of two different SK knockdowns.
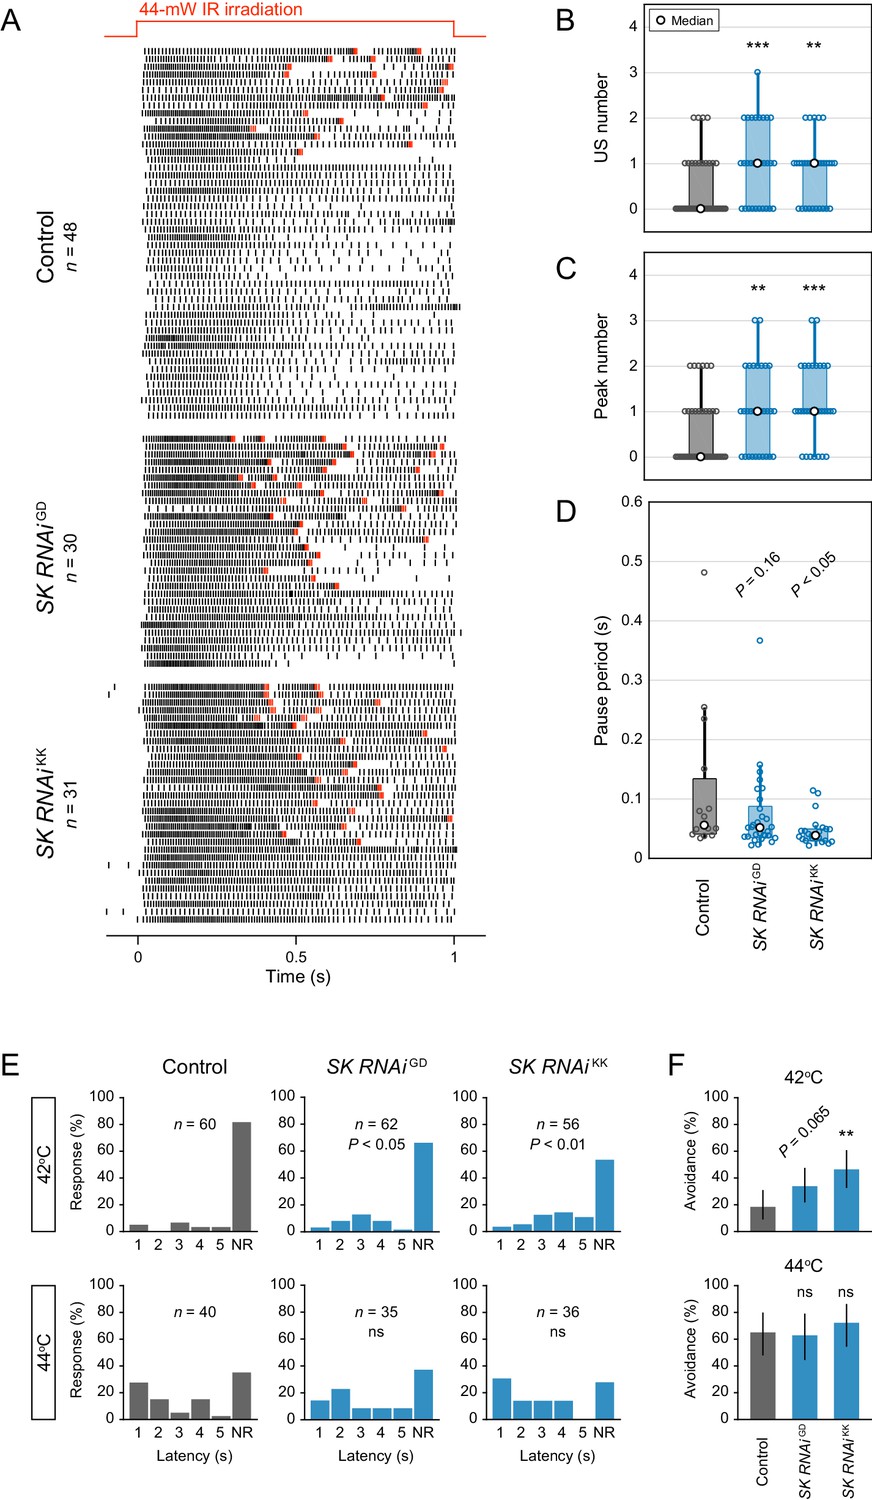
(A–D) Responses of control neurons and two different SK knockdown neurons (ppk>SK RNAiGD12601, ppk>SK RNAiKK107699) with different target sequences. The 44 mW IR laser was focused onto the proximal dendritic arbors in filet preparations for 1 s (upper red line in A). (A) Raster plots of firing. Red raster lines indicate USs. (B and C) Both SK knockdowns increased the US number and peak number in Class IV neurons (Wilcoxon rank sum test with Holm correction). (D) Boxplots of the pause periods. Pause periods tended to decrease in the SK knockdown neurons (median: [Control] 55.3 ms (n = 15), [SK RNAiGD] 51.1 ms (n = 29), and [SK RNAiKK] 38.1 ms (n = 24); Student’s t-test with Holm correction). (E–F) Avoidance behavior of control and the two SK knockdown larvae in response to thermal stimulation (42°C and 44°C). The SK knockdown larvae displayed faster onsets of responses, and the frequency of responses tended to increase compared to the control (42°C). (E) The distribution of response latency (Wilcoxon rank sum test with Holm correction). NR, no response group. (F) Percentage of larvae responding within 5 s with 95% Clopper-Pearson confidence intervals (Fisher’s exact test with Holm correction). The pause periods were not completely abolished upon SK knockdown (see also Figure 3E), which raised the possibility that other Ca2+-activated K+ channels (e.g., slowpoke and slo2) could compensate for the loss of SK function. However, the pause periods of SK knockdown neurons did not decrease further by adding charybdotoxin (1 µM; KCa blocker; data not shown). *p<0.05, **p<0.01, ***p<0.001.
Figure 3—figure supplement 3
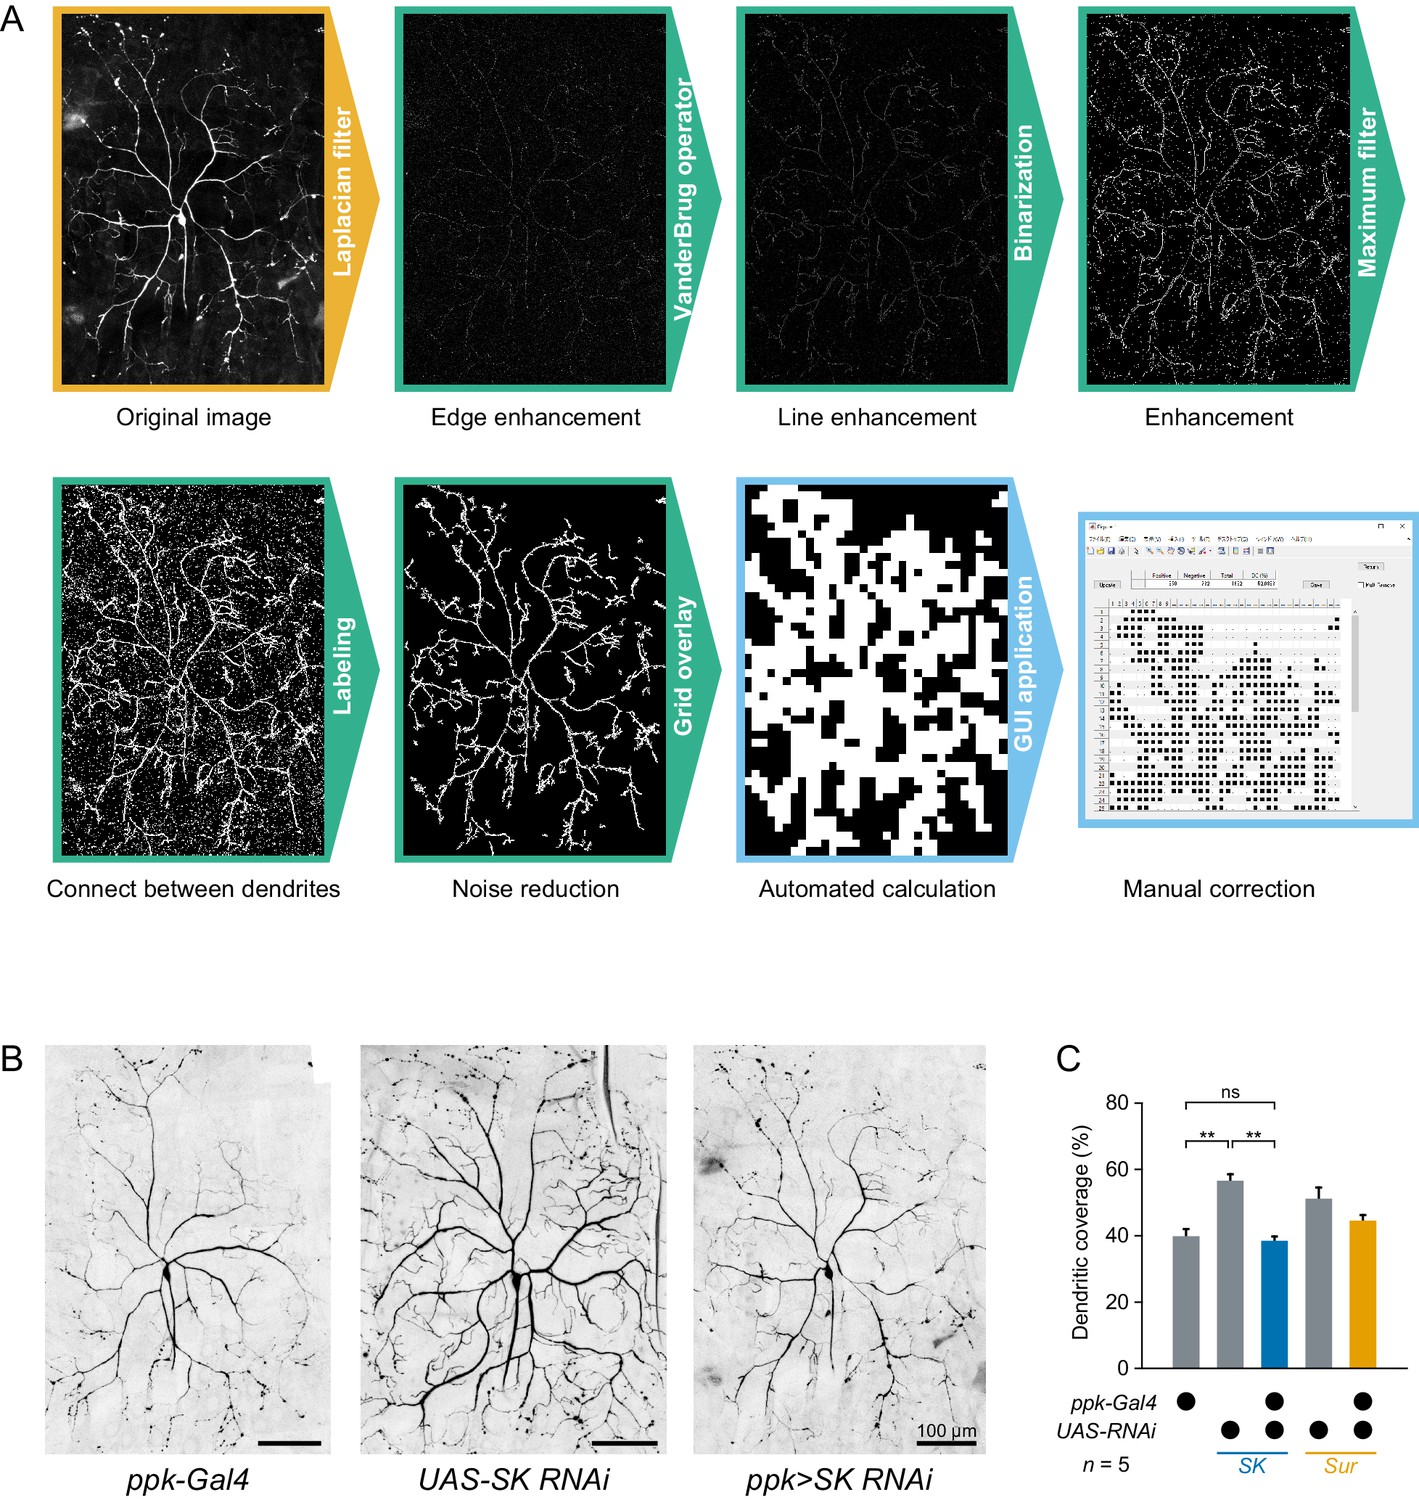
Dendritic morphology of SK knockdown Class IV neurons.
It was recently reported that heat avoidance behavior is impaired in neuropeptide knockdown larvae, which show defects in the dendritic morphology of Class IV neurons (Honjo et al., 2016). This observation raised the possibility that such morphological defects might affect electrophysiological responses of the neurons. Therefore, we examined whether the SK knockdown also caused gross morphological defects in the neurons or not. To quantify dendritic morphology, we measured dendritic coverage (Honjo et al., 2016) with modifications. (A)Image processing for measuring dendritic coverage (see also Materials and methods). (B)Representative images of two control neurons and SK knockdown neurons. Here black and white in the original images are inverted to facilitate visualization. (C)Quantification of dendritic coverage ([ppk-Gal4] 39.8 ± 2.2%, [UAS-SK RNAi] 56.6 ± 2.0%, [ppk>SK RNAi] 38.4 ± 1.3%, mean ± s.e.m.; **p<0.01, Student’s t-test with Holm correction). Dendritic coverage of SK knockdown neurons did not increase compared to those of the two controls. These results indicate that the physiological alterations of SK knockdown neurons are not simply due to morphological defects of dendritic arbors, but are a direct consequence of the different composition of K+ channels. Although the dendritic coverage of UAS-SK RNAi was relatively higher than ppk-Gal4 and ppk>SK RNAi, the difference may be explained by the observation that the coverage of other transgenic neurons were different in the absence or presence of ppk-Gal4 drivers ([UAS-Sur RNAi] 51.2 ± 3.4%, [ppk>Sur RNAi] 44.6 ± 1.6%, mean ± s.e.m.).
Figure 3—figure supplement 4
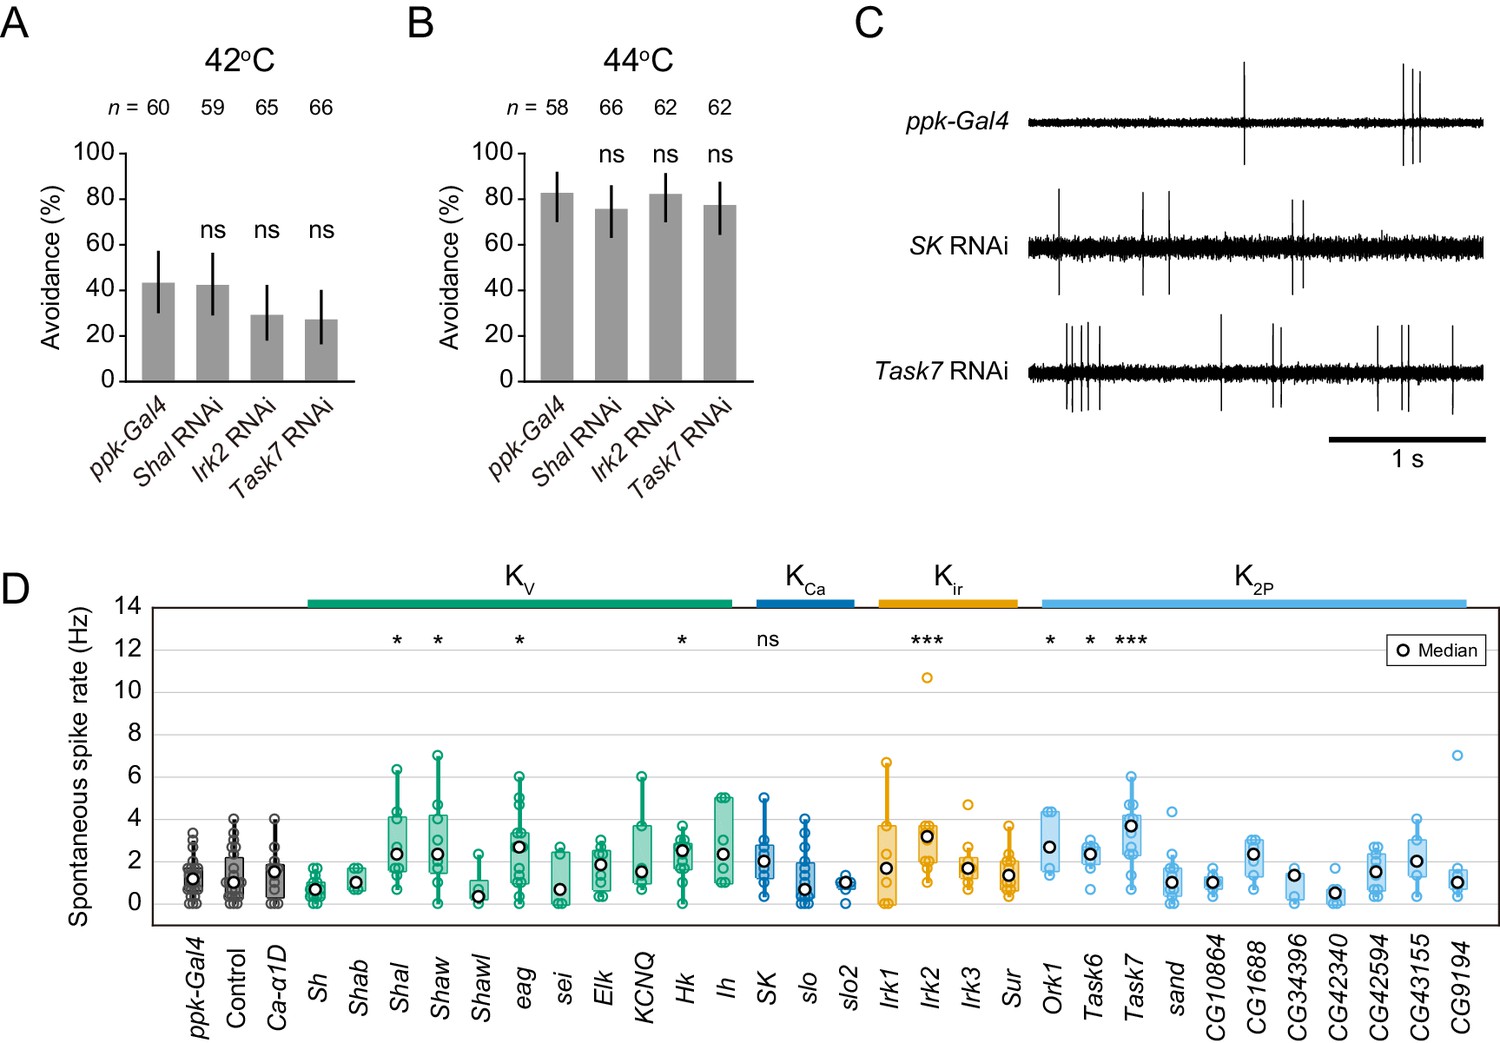
Avoidance behavior and spontaneous spikes upon knockdown of the other K+ channels.
(A–B) Avoidance behavior of driver control larvae (ppk-Gal4) and the knockdown larvae of three K+ channels (Shal, Irk2, and Task7 RNAi) in response to thermal stimulation (A: 42°C, B: 44°C). Percentage of larvae responding within 5 s did not change significantly in the knockdown larvae (Fisher’s exact test). Black bars indicate 95% Clopper-Pearson confidence intervals. We could not investigate the behavior of Sh knockdown larvae because they hardly developed into mature larvae. (C) Representative recordings of spontaneous spikes in knockdown Class IV neurons. (D) Spontaneous spike rate in knockdown neurons. The rates were quantified from the spike trains for 3 s before stimulation ([ppk-Gal4] n = 22, [others] see Figure 2—source data 1). The rates increased upon Shal, Irk2 and Task7 knockdowns; however, that of SK knockdown did not change significantly (Wilcoxon rank sum test compared to ppk-Gal4 driver control). Bottom horizontal labels indicate symbols of knocked down genes and upper labels represent channel families: Kv, voltage-gated K+ channel; KCa, Ca2+-activated K+ channel; Kir, Inward rectifier K+ channel; K2P, Two-pore domain K+ channel. *p<0.05, **p<0.01, ***p<0.001.
Figure 3—figure supplement 5
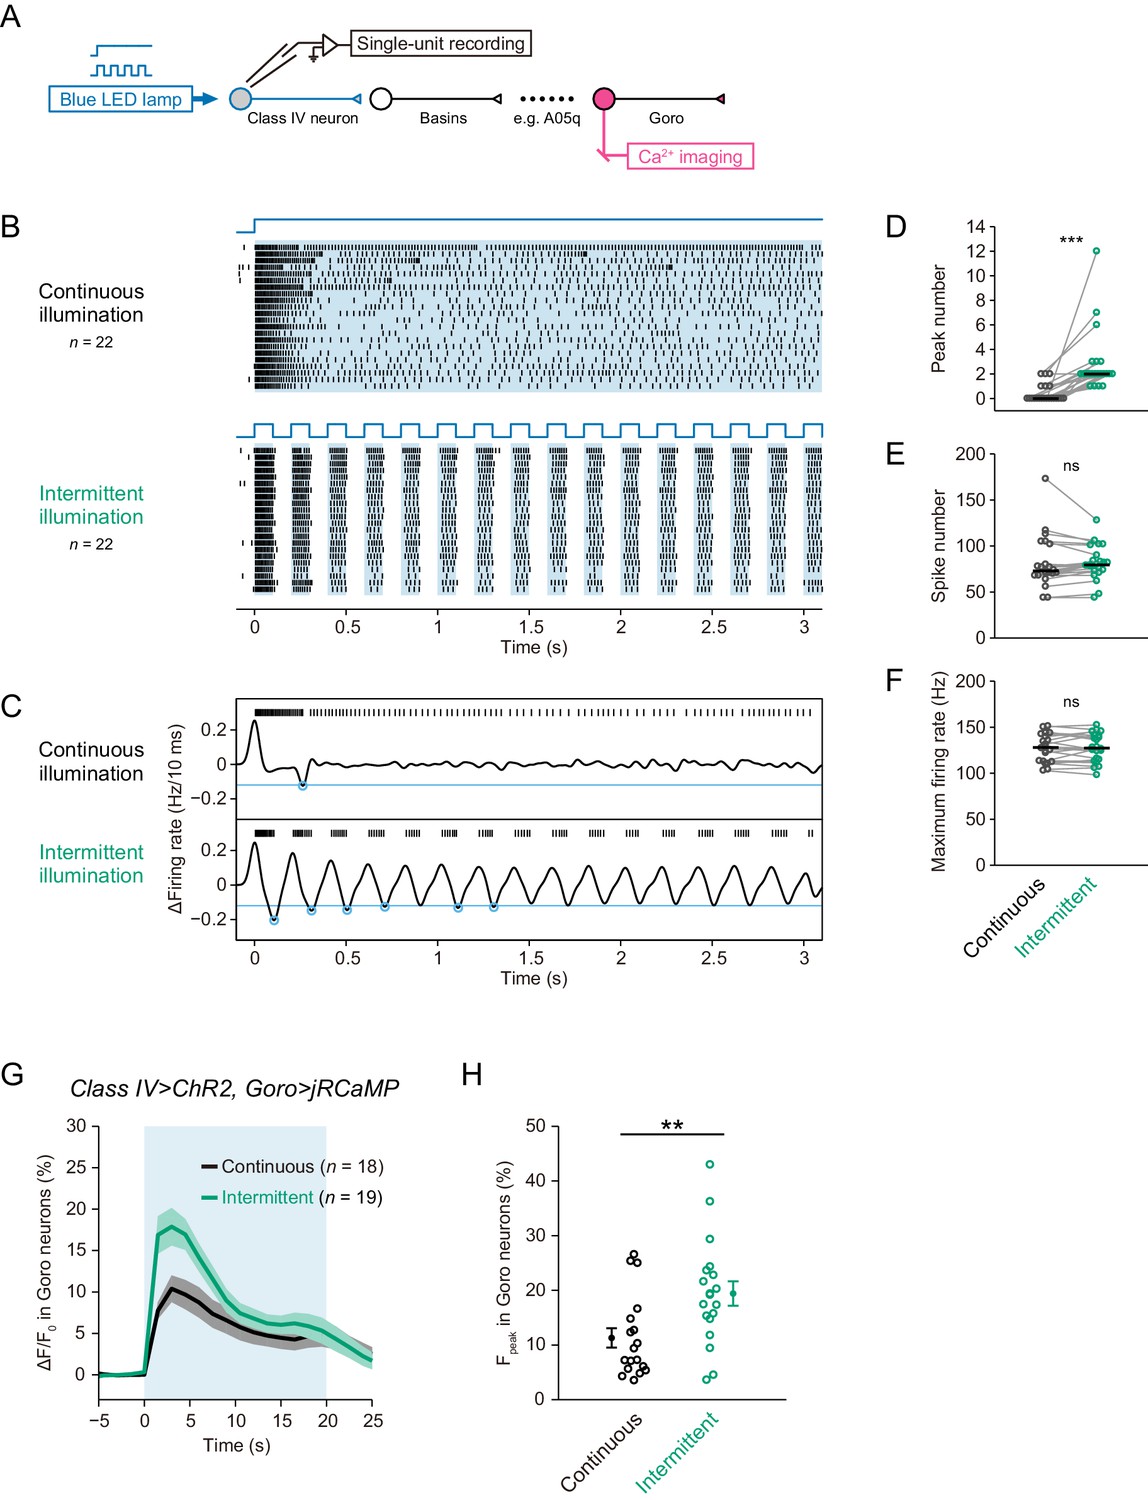
Differential Ca2+ dynamics of downstream neurons induced by optogenetic activations of Class IV neurons.
(A) A schematic diagram of the recording system. We activated ChR2-expressing Class IV neurons by blue LED illumination (0.37 mW/mm2) and measured the firing responses by extracellular recording in filet preparations. We also acquired Ca2+ dynamics of jRCaMP-expressing downstream neurons in optimized preparations. (B–F) Responses of Class IV neurons activated with a blue LED for 3 s in a continuous fashion (‘continuous illumination’) or in a pulsatile one (‘intermittent illumination’). Each cell was stimulated by two illumination patterns temporally separated by a short resting interval of at least 1.5 min. (B)Raster plots of firing. Upper blue lines indicate the time course of LED illumination. (C) Representative traces of spike trains and the time derivative. Blue circles indicate negative peaks of the time derivative below a threshold (blue line, −12 Hz/10 ms). Even continuous illumination induced one or two peaks in some trials possible because of endogenous L-type VGCCs, but the number was much less than that upon intermittent illumination. (D–F) Intermittent illumination induced more peak number in Class IV neurons than continuous illumination did (D; Wilcoxon signed-rank sum test); however, the two illumination patterns did not change total spike number (E; Wilcoxon signed-rank sum test) and maximum firing rate (F; Paired-sample t-test). Black short bars indicate median. (G–H) Ca2+ dynamics of jRCaMP-expressing Goro neurons induced by optogenetic activations of Class IV neurons with a blue LED for 20 s (blue shade in G). Each sample was illuminated with a continuous or intermittent pattern. (G) Time courses of Ca2+ levels at soma (mean ± s.e.m.). The fluorescence rapidly increased within the first 3 s upon both illuminations. (H)Maximum amplitudes of Ca2+ rises were larger upon intermittent activation than a continuous one (Welch’s t-test). Dots and bars are mean ± s.e.m. *p<0.05, **p<0.01, ***p<0.001.
Figure 4 with 1 supplement
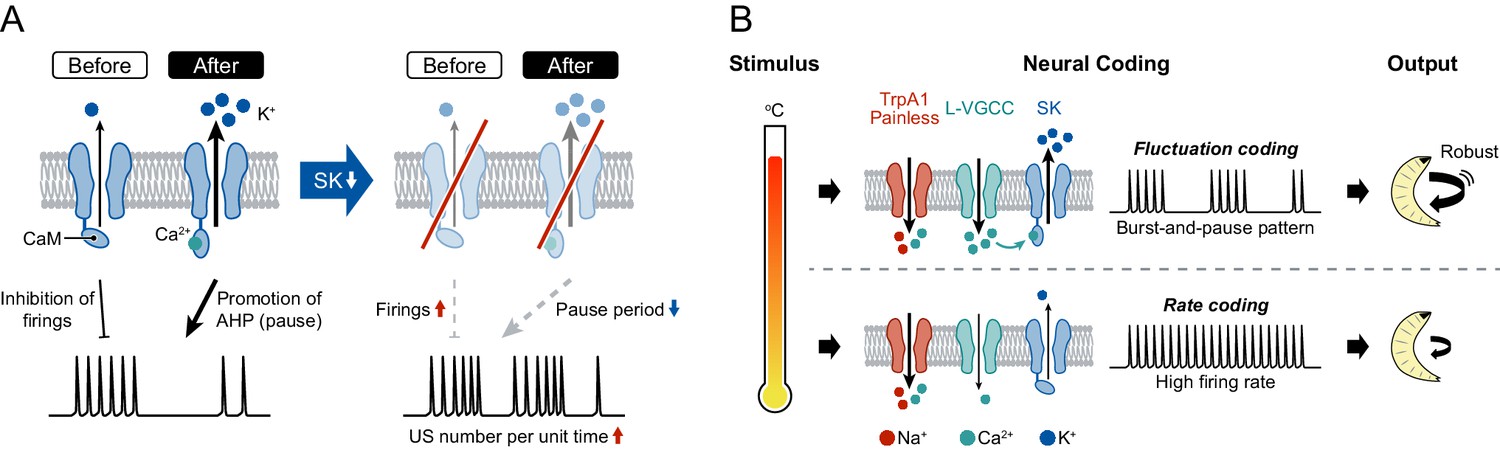
A model of information processing.
(A) Two states of SK channels, and the activation level. Here, calmodulin (CaM, ellipses) is illustrated by tethering to the intracellular terminus of the SK channels. Before USs (or without USs), the small SK current inhibits the incidence of firings during burst periods. After USs, the large SK current promotes after-hyperpolarization (AHP), which induces pause periods. See further explanation in Discussion. (B) The regulatory mechanism of burst-and-pause firing patterns by functional coordination between L-type VGCCs and SK channels in Class IV neurons. General rate coding occurs in Class IV neurons at relatively low temperatures; this is mediated by thermoTRPs (TrpA1 and Painless) and many types of voltage-gated ion channels (not illustrated here). At higher temperature, however, L-type VGCCs and SK channels convert the firing from continuous high-frequency patterns into burst-and-pause patterns. This mechanism allows fluctuation coding in sensory neurons.
Figure 4—figure supplement 1
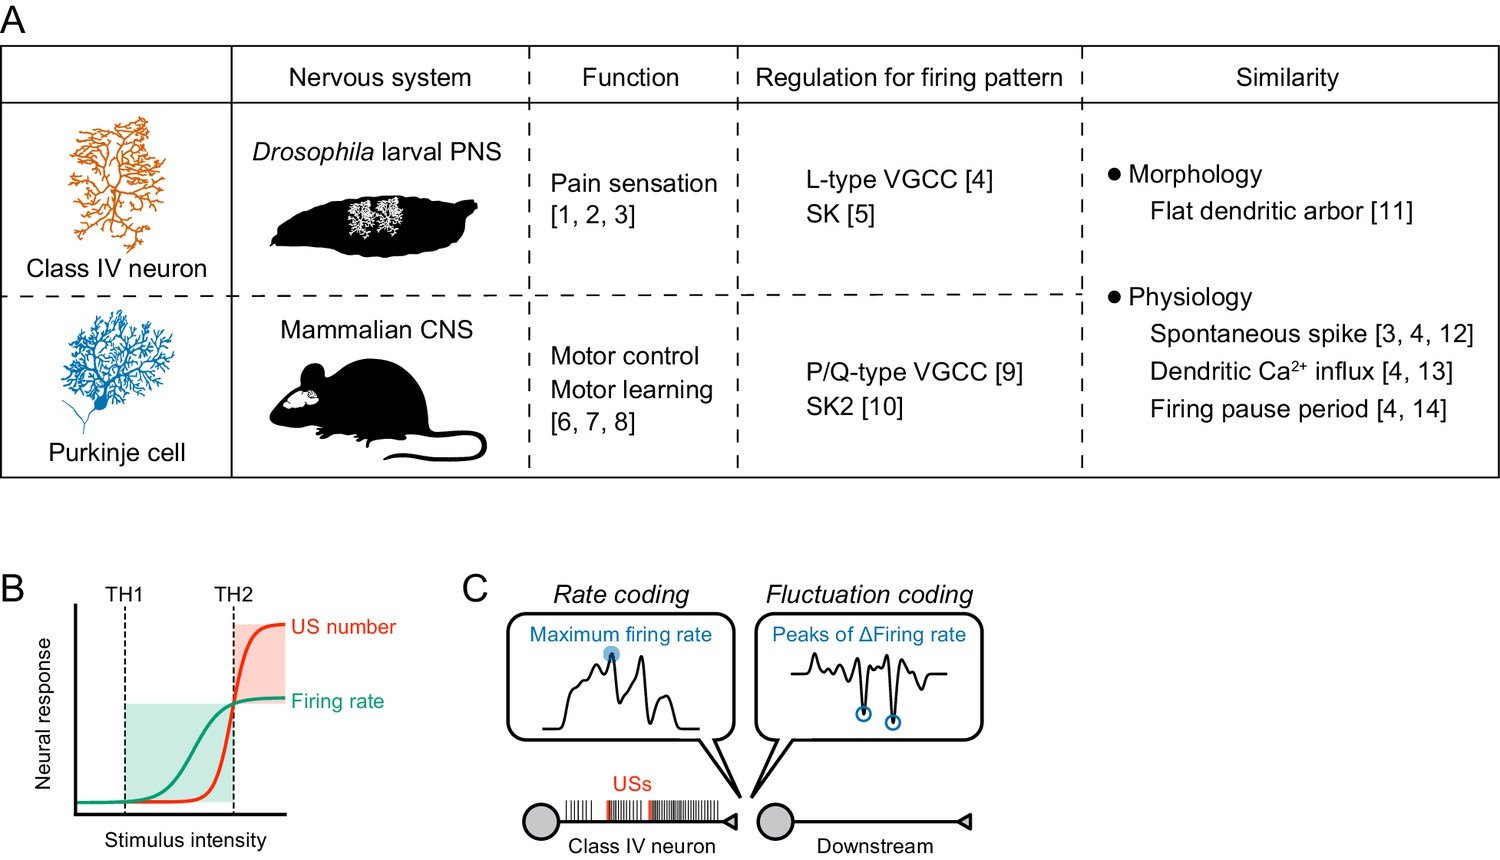
Information processing by the burst-and-pause firing pattern.
(A) Comparison between Class IV neurons and Purkinje cells. These two neuronal types have similar profiles in both morphology and physiology. We suggest that the regulatory mechanism of the former burst-and-pause firing pattern is similar to that of the latter complex spike. The image of a Purkinje cell was modified from Hong and De Schutter (2008). References: [1] Hwang et al. (2007), [2] Tracey et al., 2003, [3] Xiang et al. (2010), [4] Terada et al., 2016, [5] This study, [6] Nguyen-Vu et al. (2013), [7] Porras-García et al. (2013), [8] Vogel et al. (2007), [9] Davie et al., 2008, [10] Grasselli et al. (2016), [11] Grueber et al. (2002), [12] Raman and Bean (1999), [13] Lev-Ram et al., 1992, and [14] Llinás and Sugimori (1980). (B) Sensory transduction model in Class IV neurons. The firing rate increases with stimulus intensity above the threshold of activation in neurons (TH1), but it saturates at much higher intensity. In contrast, the US number increases above the threshold, thereby inducing dendritic Ca2+ transients (TH2). (C) Reading model for burst-and-pause firing patterns in downstream neurons. Our present and previous study (Terada et al., 2016) suggest that the US number should be read out as peaks of firing rate fluctuations downstream of Class IV neurons, and that fluctuation coding occurs in the sensory nervous system. When USs occur, the maximum firing rate also tends to increase, and several time points of the maximum firing rate overlap with US timings (Figure 1—figure supplement 1B, Figure 3—figure supplement 1). These results suggest that the USs could still be read out in accordance with rate coding. However, L-type VGCC knockdown did not change the maximum firing rate (Figure 2—figure supplement 2B) but delayed avoidance behavior (Terada et al., 2016), which demonstrates that the rate coding itself cannot explain our findings, and supports our view that fluctuation coding occurs in Class IV neurons.
Additional files
-
Transparent reporting form
- https://doi.org/10.7554/eLife.29754.027
Download links
A two-part list of links to download the article, or parts of the article, in various formats.
Downloads (link to download the article as PDF)
Open citations (links to open the citations from this article in various online reference manager services)
Cite this article (links to download the citations from this article in formats compatible with various reference manager tools)
Small conductance Ca2+-activated K+ channels induce the firing pause periods during the activation of Drosophila nociceptive neurons
eLife 6:e29754.
https://doi.org/10.7554/eLife.29754


