A double-sided microscope to realize whole-ganglion imaging of membrane potential in the medicinal leech
- California Institute of Technology, United States
Figures
Figure 1 with 3 supplements
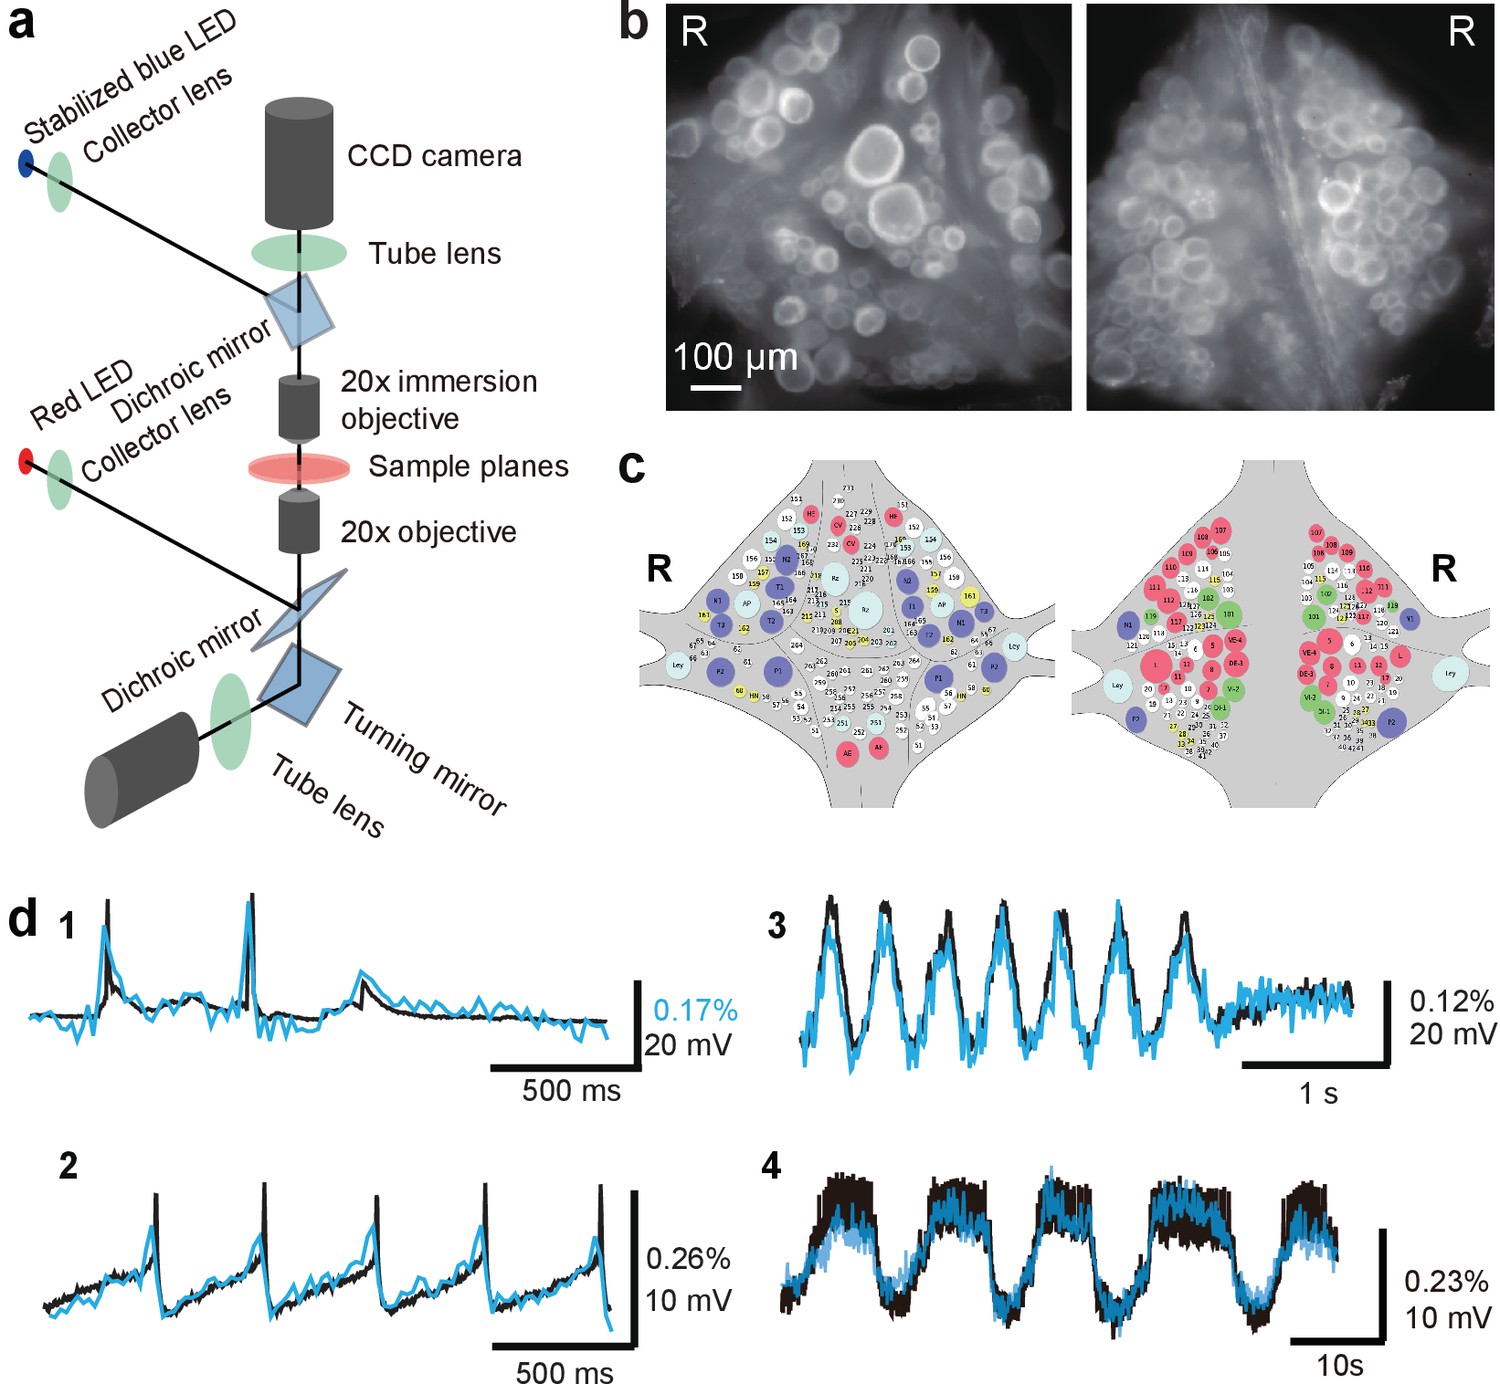
Double-sided voltage sensitive dye imaging.
(a) Schematic of the double-sided microscope. (b) Images of the ventral (left) and dorsal (right) aspects of a leech ganglion simultaneously acquired using this microscope. ‘R’ indicates the right side of the ganglion. ('Right' is the animal's right side when oriented dorsal side up) (c) Canonical maps of the ventral (left) and dorsal (right) aspects of the ganglion. (d) Single-sweep recordings of neuronal activity. Optical signals from VSD imaging (blue) are overlaid with simultaneous intracellular recordings (black). 1. Action potentials and subthreshold potentials in a Retzius cell; 2. Spontaneous regular firing in an AP cell; 3. Swimming pattern in a DE-3 motor neuron; 4. Crawling pattern in an AE cell.
Figure 1—figure supplement 1
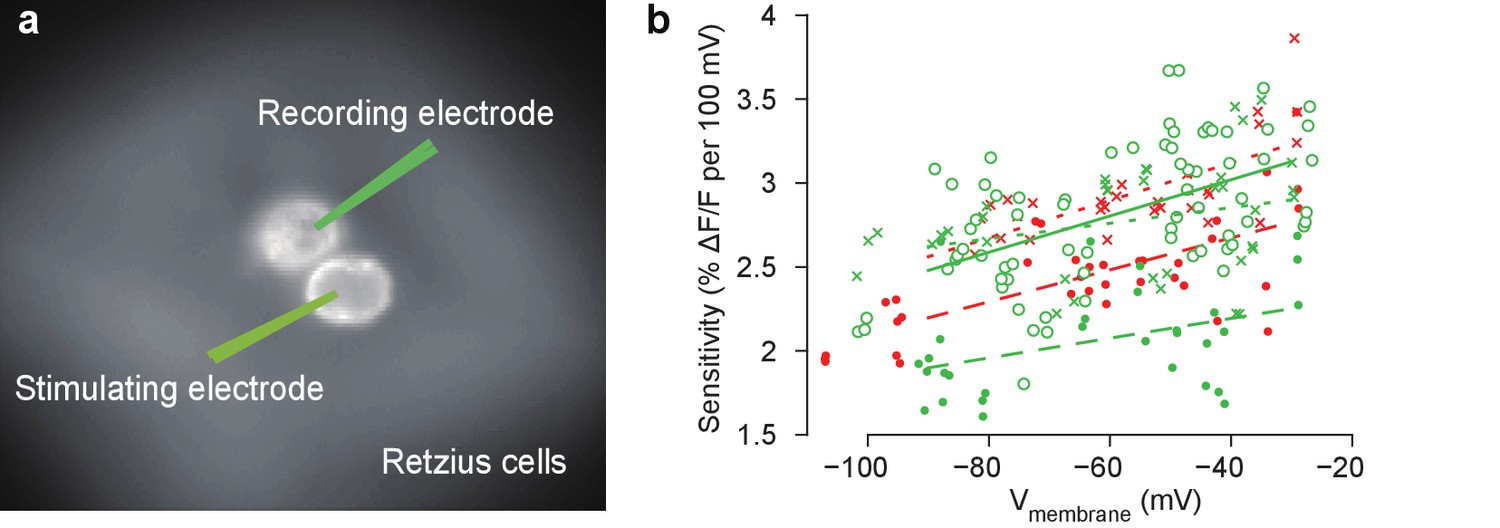
Measurements of the sensitivity of the VoltageFluor voltage-sensitive dye VF2.1(OMe).H in a leech Retzius cell.
(a) Schematic of intracellular current injection and recording during VSD imaging from a stained ganglion. Depolarization or hyperpolarization current was injected into one Retzius cell, which causes a voltage change in the other because of a strong non-rectifying gap junction. This voltage was monitored using a second electrode as well as VSDs. (b) The sensitivity of the VSD as a function of membrane potential. Data and linear fits from five ganglia (symbols and line styles) from two animals (colors). Data available from the Dryad Digital Repository: https://doi.org/10.5061/dryad.m20kh/4 (title: Supplementary, Tomina and Wagenaar, 2017).
Figure 1—figure supplement 2
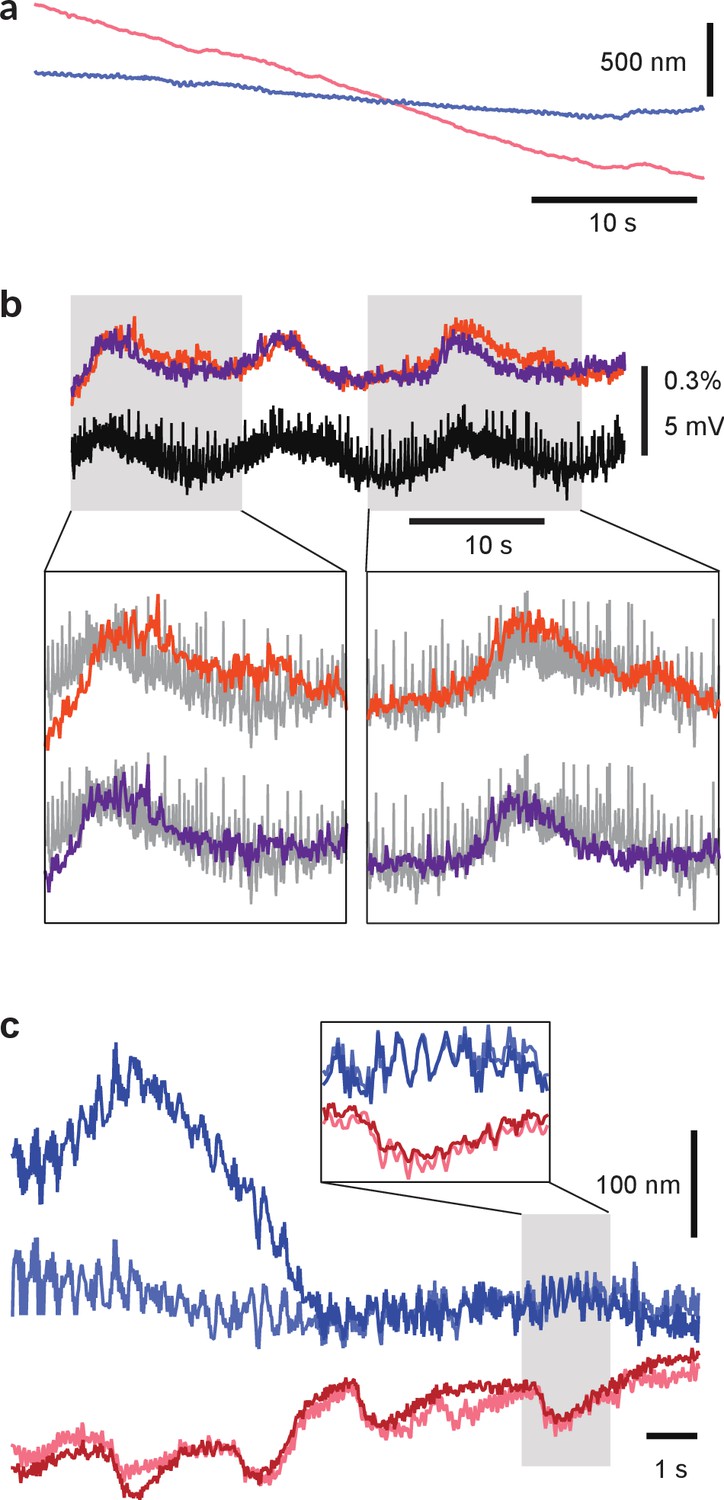
Correction of micro-motion in images.
(a) Example of a relatively large motion artifact. Curves represent estimated motion in the x-direction (red) and in the y-direction (blue). (b) Improvement of VSD signal associated with a fictive behavior by micro-motion correction. The VSD signal was obtained from the same trial as (a). The VSD signal from an AE cell before motion correction (orange) and after motion correction (purple) compared to simultaneously recorded intracellular voltage (downfiltered to the VSD frame rate of 100 Hz; black). Motion correction improved correspondence between VSD signal and intracellular recording. Insets show details. (c) Example of a relatively small motion artifact as seen by both cameras. Curves represent motion in the x-direction (reds) and in the y-direction (blues) for top (light colors) and bottom (dark colors) cameras. The strong correlation between the estimates for the two cameras indicates correctly estimated movement of the microscope relative to the stage. The estimated motion is not identical for the two cameras due to internal movement of the imaged ganglion. Codes available from the Dryad Digital Repository: https://doi.org/10.5061/dryad.m20kh/4 (title: Supplementary, Tomina and Wagenaar, 2017).
Figure 1—figure supplement 3
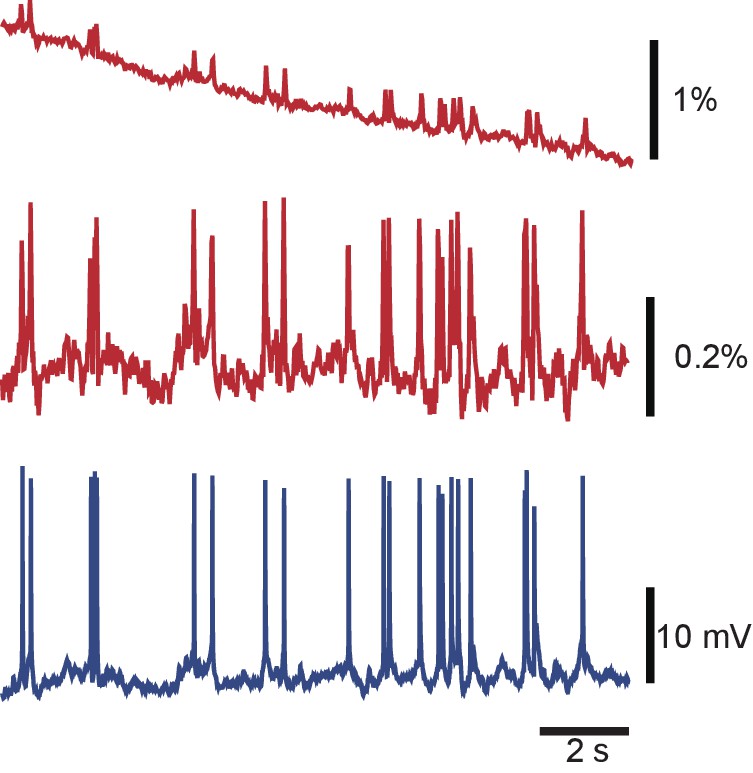
Debleaching VSD signals by local curve fitting.
A typical VSD signal from a Retzius cell before (top) and after (middle) debleaching, and the corresponding intracellular recording (bottom). Codes available from the Dryad Digital Repository: https://doi.org/10.5061/dryad.m20kh/4 (title: Supplementary, Tomina and Wagenaar, 2017).
Figure 2 with 1 supplement
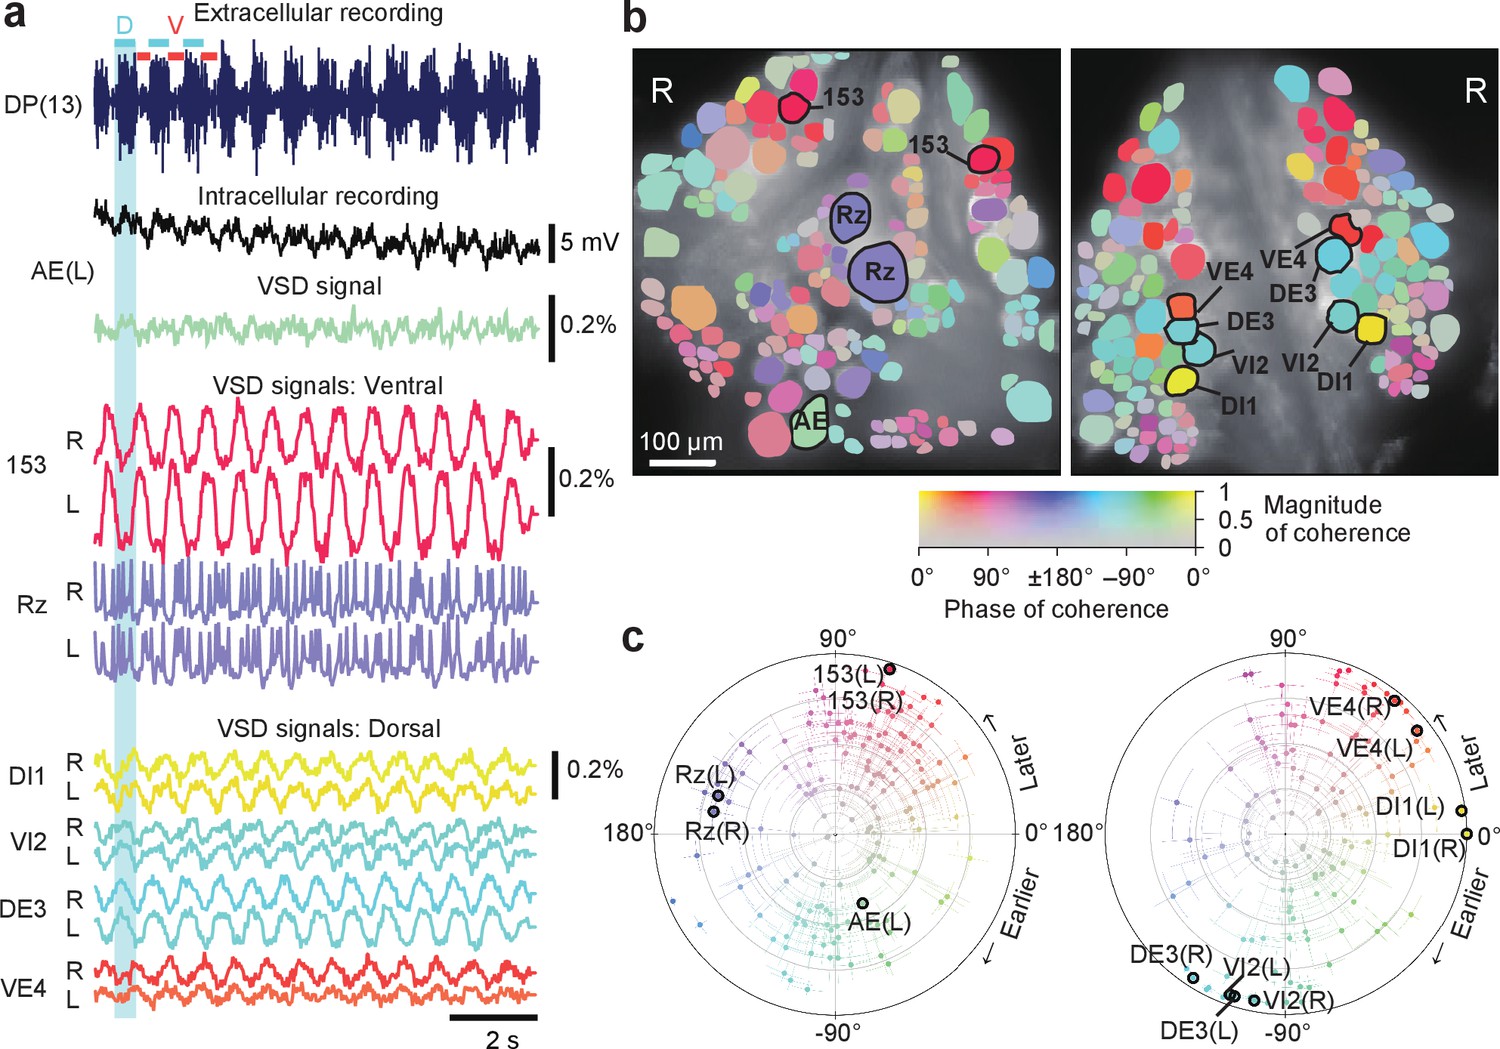
Neuronal activity during fictive swimming.
(a) Selected electrophysiological and VSD traces during fictive swimming. Extracellular recording from a nerve root in a posterior segment (DP(13)) showed rhythmic dorsal motor neuron bursts characteristic of swimming (top). Intracellular recording and simultaneous optical signal from an AE neuron show matching membrane potential oscillations. VSD signals from the ventral surface: bilateral cells 153 (a sensory neuron) and the Retzius cell (a neuromodulatory neuron). VSD signals from the dorsal surface: dorsal and ventral inhibitory and excitatory motor neurons DI-1, VI-2, DE-3, and VE-4. (b) Coherence of the optically recorded signals of all cells on the ventral (left) and dorsal (right) surfaces of the ganglion with the swim rhythm. Cells used in (a) are marked. (c) Magnitude (radial axis from 0 to 1) and phase (angular coordinate) of the coherence of each neuron’s activity with the swim rhythm; same data as in (b). Error bars indicate confidence intervals based on a multi-taper estimate. Data available from the Dryad Digital Repository: https://doi.org/10.5061/dryad.m20kh/7 (title: Figure 2, Tomina and Wagenaar, 2017).
Figure 2—figure supplement 1

Comparison of fictive swimming between single- and double-sided imaging.
(a) Coherence maps for the dorsal side of ganglia during fictive swimming: imaged with a single camera when only the dorsal side was stained (left); imaged with the top camera when both sides were stained (and the ventral side was simultaneously imaged with the bottom camera; center); imaged with the bottom camera when both sides were stained and imaged (right; image reproduced from Figure 2b). Inhibitory motor neuron DI-1R was used as a reference of coherence analysis. Scale bars: 100 μm. (b) VSD signals from DI-1R during the same fictive swimming episodes; imaging conditions as in the corresponding images in (a). Black traces indicate recorded VSD signal, while overlaying blue traces show fitted curve. Scale bars: 2 s for time and 0.2% for ΔF/F. (c) Comparison of fitted peak-to-peak signal amplitude in DI-1R during fictive swimming between the three imaging conditions; mean ±SEM from N = 10 single-sided imaging experiments; six double-sided experiments in which top camera was used to image the dorsal side of the ganglion; and 10 experiments in which the bottom camera was used. (d) Comparison of RMS noise in DI-1R between the three conditions. (e) Signal-to-noise ratio in DI-1R in the three conditions. (f) Magnitude of coherence between DI-1R and DI-1L in the three conditions. In (c–f), no significant differences were found between imaging conditions (one-way ANOVAs, all p>0.05; amplitude: p=0.752, RMS noise: p=0.126, signal-to-noise ratio: p=0.777, coherence magnitude: p=0.347). Data available from the Dryad Digital Repository: https://doi.org/10.5061/dryad.m20kh/4 (title: Supplementary, Tomina and Wagenaar, 2017).
Figure 3 with 1 supplement
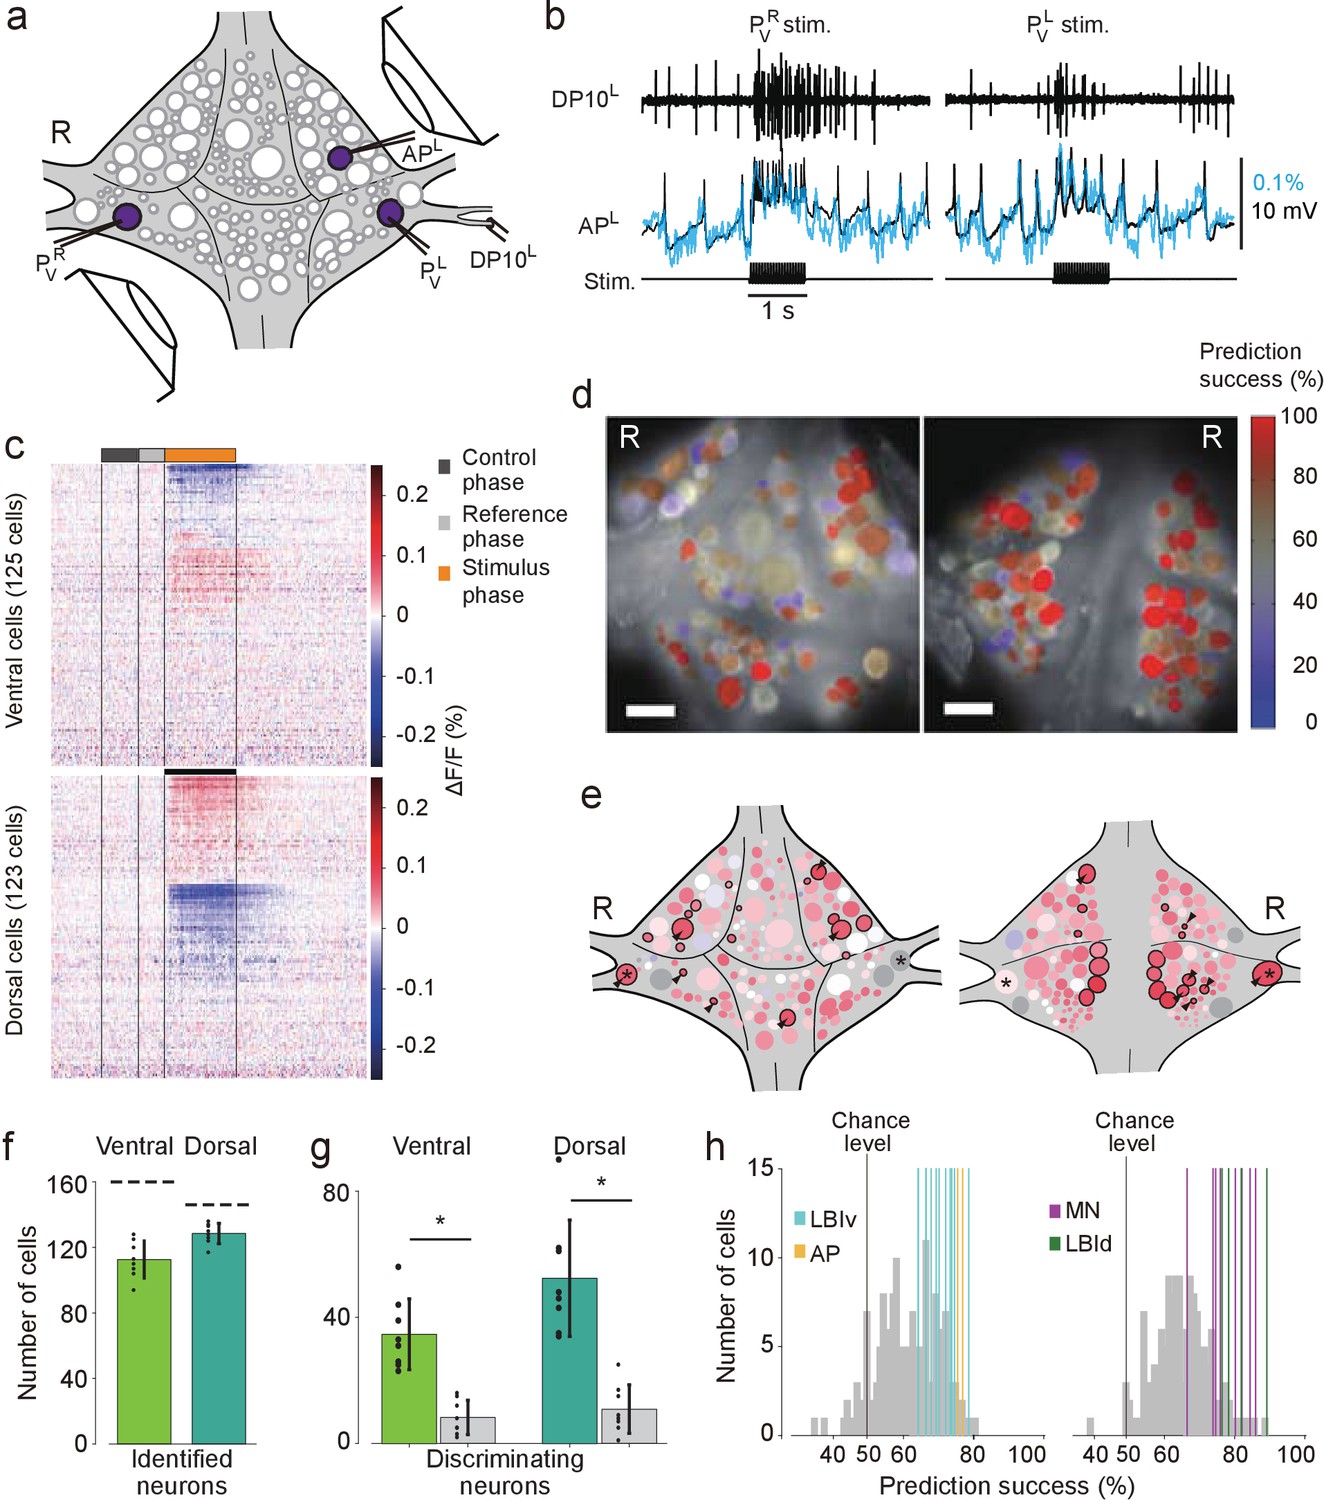
Differential activation during left and right local bend responses.
(a) Schematic of the setup. Microelectrodes were inserted into left and right PV cells for stimulation and into the right AP cell for recording. A suction electrode around the right DP nerve confirmed the execution of a (fictive) local bend. (b) Simultaneously recorded motor activity from the DP nerve (top), membrane potential from the AP neuron (middle, black) and its corresponding VSD trace (blue) in response to stimuli to PVR (left) and PVL (right). Stimulus duration was 1 s (bottom). (c) Time series of averaged difference between PVL (n = 10) and PVR (n = 10) trials in the activity of all 248 recorded cells. Positive (red) indicates more depolarization (or less hyperpolarization) in response to PVL stimulation. Scale bar: 1 s. (d) Stimulus discriminability score overlaid on images of the ventral (left) and dorsal (right) aspects of the ganglion. Scale bars: 100 μm. (e) Averaged discriminability results across eight animals. Color scale as in (d). Motor neurons (MNs) and LBIs are marked (black circles) as are other cells that strongly discriminate between stimuli (≥75% prediction success; circles and arrow heads). *: Leydig cell; see Discussion. (f) Number of cells that could be mapped to identified neurons; mean and SD of 8 preparations and individual results (dots). Dashed lines indicate total number of cells in the canonical maps. (g) Number of cells that strongly discriminate between stimuli (≥75% prediction success) compared to control (grey bars). (*: p<10–4; ventral: p=1.13×10⁻⁵, dorsal: p=4.72×10⁻⁵; Paired sample T-test) (h) Discriminability scores for all neurons on the ventral (left) and dorsal (right) surfaces. 50% prediction success represents a chance level. Colored lines mark the scores of LBIs, AP cells and MNs. Data available from the Dryad Digital Repository: https://doi.org/10.5061/dryad.m20kh/1 (title: Figure 3, Tomina and Wagenaar, 2017).
Figure 3—figure supplement 1
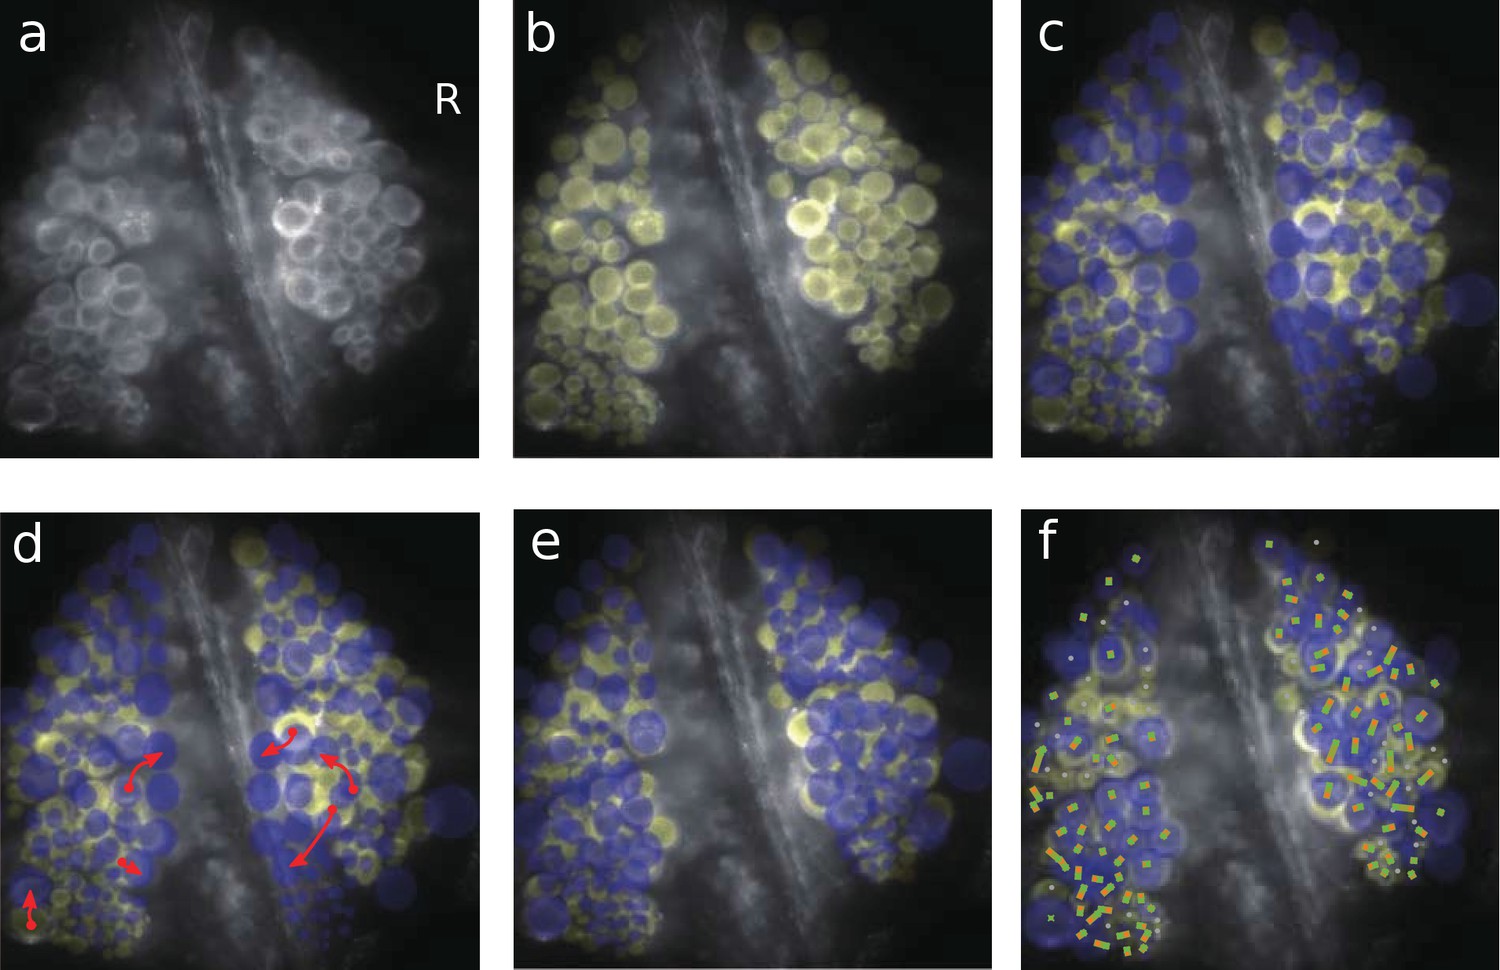
Mapping imaged cells to identified neurons using a graphical user interface.
(a) Dorsal surface of a ganglion (same image as in Figure 1b). (b) All visible cells manually marked as regions of interest (translucent yellow). (c) The canonical map of all known neurons (translucent blue) overlaid on the image, but not yet aligned. (d) Visual identification of selected cells by a human expert using a drag-and-drop process (illustrated by red arrows). (e) Automatic coarse alignment between the canonical map and the actual image. (f) After a further automatic fine alignment, the remaining ROIs are automatically assigned to hitherto unassigned known neurons based on geometry. The assignment of ROIs (orange dots) to neurons on the canonical map (green cross marks) is indicated by lines connecting dots and cross marks. Codes available from the Dryad Digital Repository: https://doi.org/10.5061/dryad.m20kh/4 (title: Supplementary, Tomina and Wagenaar, 2017).
Figure 4
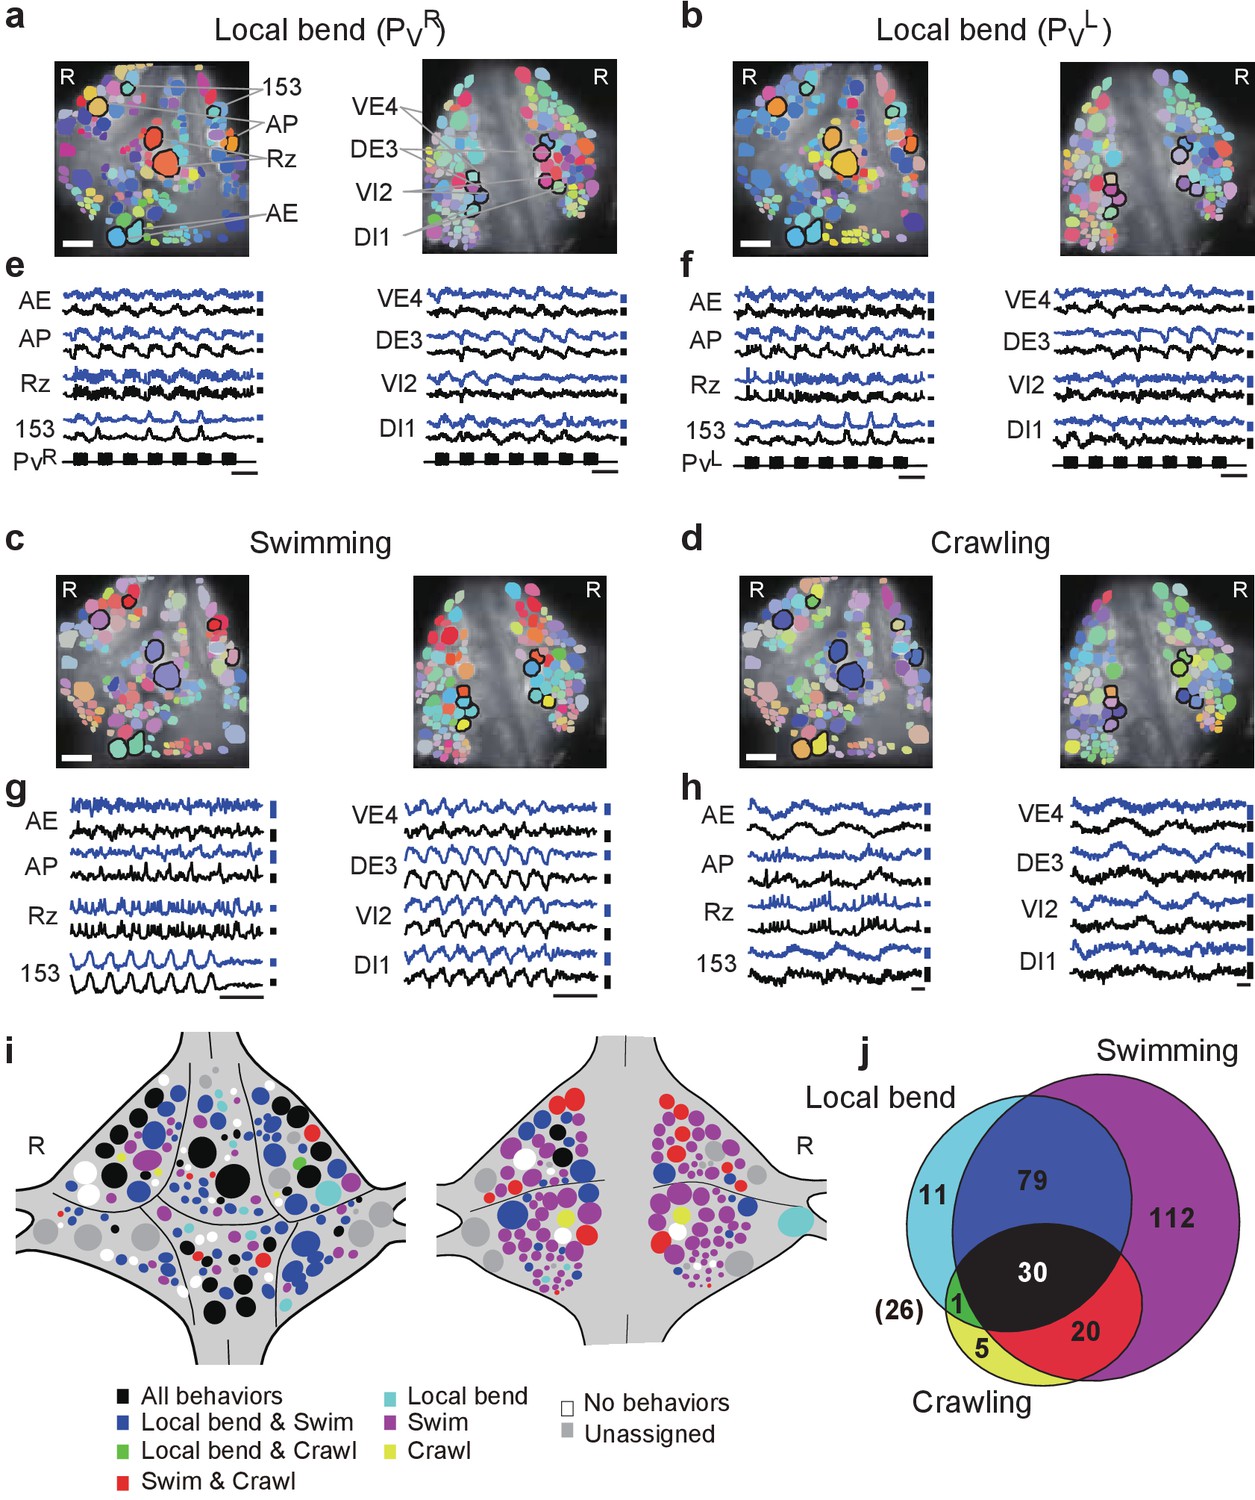
Neuronal activity during multiple behaviors.
(a–d) Coherence of optically recorded signals of all cells on the ventral (left) and dorsal (right) surfaces of a ganglion with (a) PVR-induced local bending, (b) PVL-induced local bending, (c) fictive swimming, and (d) fictive crawling. Color map as in Figure 2b. (e–h) VSD signals of cells indicated in (a–d) during those behaviors. Scale bars: 2 s for time and 0.2% for ΔF/F. Blue and black traces represent the cells on the right and the left sides, respectively. (i) Summary maps of the involvement of identified neurons on the ventral (left) and dorsal (right) surface of the ganglion. Colors indicate which behavior each neuron was involved in. (j) Venn diagram showing the total number of identified neurons that oscillated with each individual behaviors or combinations of behaviors. The number (26) with parentheses outside of the diagram indicates the number of cells determined to be involved in none of the three behaviors. Colors as in (i). Data available from the Dryad Digital Repository: https://doi.org/10.5061/dryad.m20kh/2 (title: Figure 4, Tomina and Wagenaar, 2017).
Figure 5
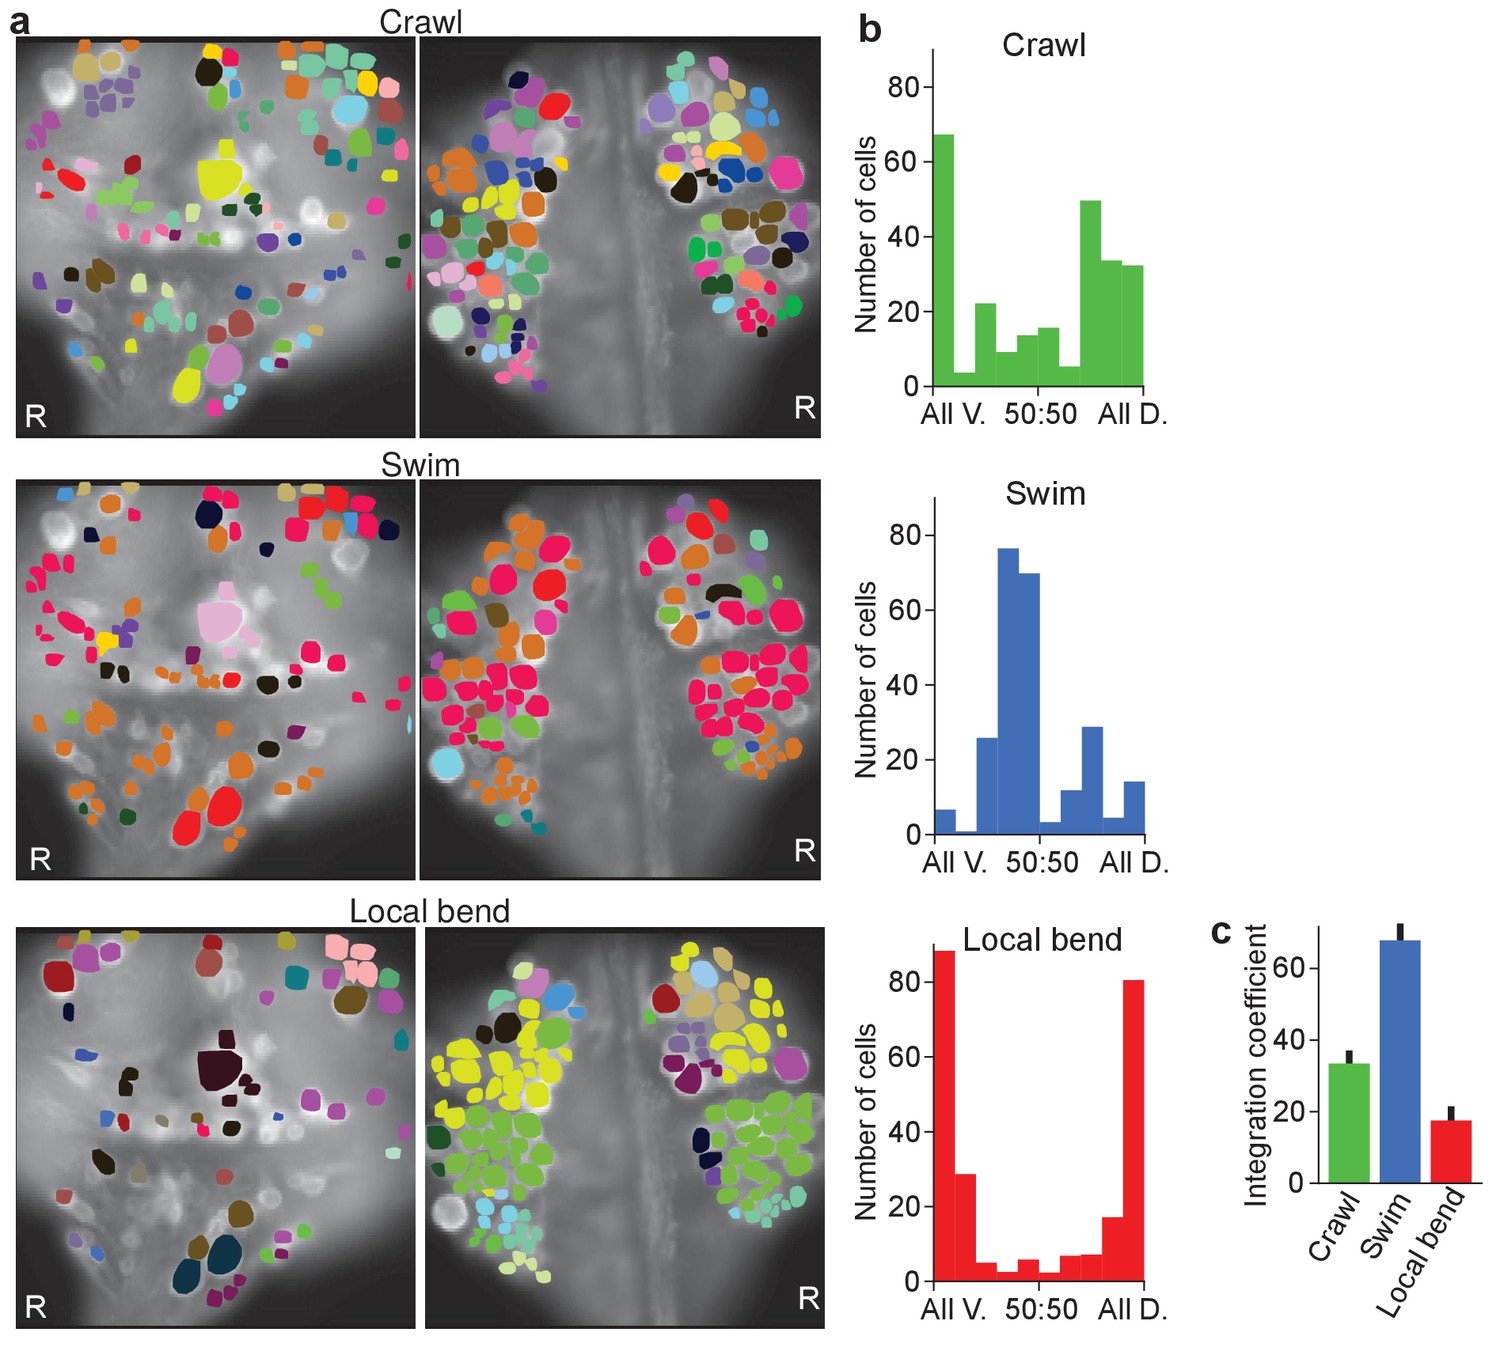
Clustering cells based on their activity in different behaviors.
(a) Cluster assignments of all cells recorded in one animal based on the correlation matrix of their activity during fictive crawling (left), swimming (center), and local bending (right). (b) Degree to which cells within a cluster were fully contained on the ventral side (‘All V.”), fully on the dorsal side (‘All D.”), or equally distributed (‘50:50’). To prevent overrepresentation of small clusters, each cell is an entry in the histogram, not each cluster. Clusters with fewer than three members were excluded. Data from N = 6 leeches. (c) Quantification of the degree to which members of clusters were distributed across surfaces in the three behaviors tested (mean ± SEM, N = 6). All differences were significant (ANOVA, F(2,15) = 63.4, p<10–7, followed by Tukey). Data available from the Dryad Digital Repository: https://doi.org/10.5061/dryad.m20kh/3 (title: Figure 5, Tomina and Wagenaar, 2017).
Videos
Video 1
Animated versions of Figure 4a, showing dynamics during PVR-induced local bending.
https://doi.org/10.7554/eLife.29839.011
Video 2
Animated versions of Figure 4b, showing dynamics during PVL-induced local bending.
https://doi.org/10.7554/eLife.29839.012
Video 3
Animated versions of Figure 4c, showing dynamics during fictive swimming
https://doi.org/10.7554/eLife.29839.013
Video 4
Animated versions of Figure 4d, showing dynamics during fictive crawling.
https://doi.org/10.7554/eLife.29839.014Additional files
-
Transparent reporting form
- https://doi.org/10.7554/eLife.29839.017
Download links
A two-part list of links to download the article, or parts of the article, in various formats.
Downloads (link to download the article as PDF)
Open citations (links to open the citations from this article in various online reference manager services)
Cite this article (links to download the citations from this article in formats compatible with various reference manager tools)
A double-sided microscope to realize whole-ganglion imaging of membrane potential in the medicinal leech
eLife 6:e29839.
https://doi.org/10.7554/eLife.29839


