Cell-specific gain modulation by synaptically released zinc in cortical circuits of audition
- University of Pittsburgh, United States
- Central South University, China
Figures
Figure 1 with 1 supplement

Synaptic, ZnT3-dependent zinc, decreases the gain of A1 sound-evoked responses in awake mice.
(a) Schematic of experimental setup illustrating transcranial imaging using GCaMP6s in a head-fixed awake mouse (left panel). Sounds are delivered through a calibrated speaker (top left panel). A 5 kHz 50 dB SPL tone triggered GCaMP6s fluorescence responses in two regions of the auditory cortex representing A1 (bottom panel) and the anterior auditory field (AAF; D stands dorsal and R for rostral). ZX1-containing pipette was inserted into the cortex adjacent to A1 (top right panel). (b–e) A1 GCaMP6s fluorescence response to 12 kHz 80 or 50 dB SPL sounds before and after ZX1. (f) Average effect of control (black) and ZX1 (red), on A1 responses to 12 kHz sounds of different intensities (control vs. ZX1 for 70 dB: p=0.003; 80 dB: p=0.03, paired t-test, n = 7 mice). (g) Regression fit to normalized sound-evoked responses in control vs. ZX1 in WT; responses were normalized to the maximum response in control. (h) Regression slope (vs. 1, p=0.007, one sample t-test, n = 7 mice). (i) Regression y-intercept. (j) Same as in (f) but in ZnT3 KO (control is blue, n = 6 mice). (k) Same as in g) but in ZnT3 KO (n = 6 mice). (l) Same as in (h) but in ZnT3 KO (n = 6 mice). (m) Same as in (i) but in ZnT3 KO (n = 6 mice). For all the figures, asterisks indicate p<0.05 and error bars indicate SEM. For all the figures, see end of the manuscript for detailed values, Appendix 1.
Figure 1—figure supplement 1
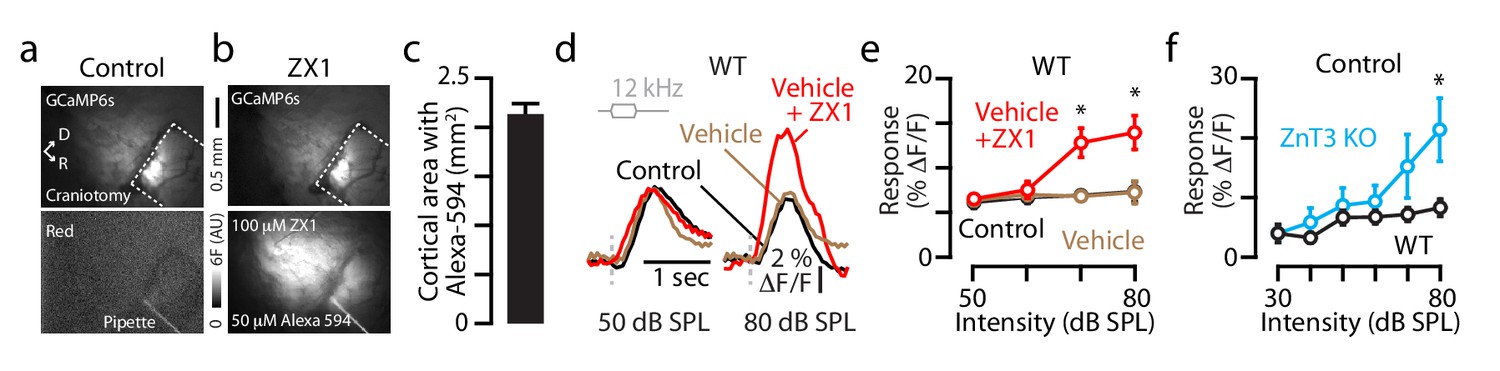
ZX1 diffusion throughout the auditory cortex; ZnT3 KO mice show enhanced gain.
(a) Image illustrating transcranial green fluorescence from GCaMP6s-expressing cortical neurons (top), and red fluorescence restricted to the ZX1 solution in the pipette inserted into the cortex in control condition, prior to ZX1 infusion (bottom). (b) Image illustrating GCaMP6s green fluorescence after ZX1 infusion (top) and widespread red fluorescence due to Alexa-594 diffusion also contained in the infused ZX1 solution. (c) Average surface area of cortex with red fluorescence 10 min after ZX1 infusion (2.1 ± 0.1 mm2, n = 8 mice). (d) Transcranial fluorescence responses of A1 neurons to 12 kHz sounds of 50 and 80 dB SPL before (control, black), after vehicle (orange), and after ZX1 infusion (red). (e) Average effect of vehicle (orange) and subsequent ZX1 (red) infusion on A1 sound-evoked responses (vehicle vs. ZX1: 70 dB SPL p=0.04, 80 dB SPL p=0.01, n = 3 mice, paired t-tests). (f) Average A1 responses to 12 kHz sounds of different intensities (replotted from Figure 1fj: WT vs. ZnT3 KO for 80 dB: p=0.02; t-test, n = 7 WT and n = 6 ZnT3 KO mice). For all the figure supplements, asterisks indicate p<0.05 and error bars indicate SEM.
Detailed values: (c) Area with Alexa-594: 2.11 ± 0.12 mm2, n = 8 mice. (e) Control vs. vehicle: 50 dB SPL control: 6.2 ± 0.7%, vehicle 6.4 ± 0.6%, p=0.56; 60 dB SPL: control: 6.7 ± 0.7%, vehicle 7.0 ± 0.6%, p=0.75; 70 dB SPL: control: 7.0 ± 0.5%, vehicle 6.8 ± 0.5%, p=0.38; 80 dB SPL control: 7.4 ± 1.1%, vehicle 7.3 ± 1.3%, p=0.66, n = 3 mice, paired t-tests. ZX1 vs vehicle: 50 dB SPL ZX1: 6.2 ± 0.7%, p=0.53, 60 dB SPL ZX1: 7.6 ± 1.0%, p=0.57, 60 dB SPL ZX1: 12.9 ± 1.6%, p=0.04, 80 dB SPL ZX1: 14.0 ± 1.9%, p=0.01, n = 3 mice, paired t-tests. (f) WT (black) vs. ZnT3 KO (blue) values from Figure 1fj: 30 dB SPL, p=0.98, 40 dB SPL, p=0.24, 50 dB SPL, p=0.51, 60 dB SPL, p=0.37, 70 dB SPL, p=0.13, 80 dB SPL, p=0.03, t-tests, n = 7 mice for WT, n = 6 mice for ZnT3 KO.
Figure 2 with 1 supplement

Synaptic zinc increases the gain of principal neurons but decreases the gain of PV and SOM interneurons.
(a) Transcranial fluorescence responses of principal neurons to 12 kHz sounds of 40 and 70 dB SPL before and after ZX1. (b) Average effect of control (black) and ZX1 (red), on principal neuron responses to 12 kHz sounds of different intensities (control vs. ZX1 for 60 dB: p=0.02, 70 dB: p=0.001; 80 dB: p=0.003, n = 10 mice, paired t-tests). (c) Left: Regression fit to normalized sound-evoked responses in control vs. ZX1 in principal neurons. Right: The slope and y-intercept of the regression (regression slope vs. 1: p=0.001). (d) Same as in (a) but for PV neurons. (e) Same as in b) but for PV neurons (control vs. ZX1 for 30 dB: p=0.009, 40 dB: p=0.004, 50 dB: p=0.04, 60 dB: p=0.006, 70 dB: p=0.017; 80 dB: p=0.011, n = 4 mice, paired t-tests). (f) Same as in c) but for PV neurons (regression slope vs. 1: p=0.03). (g) Same as in (a) but for SOM neurons. (h) Same as in b) but for SOM neurons (control vs. ZX1 for 30 dB: p=0.01, 40 dB: p=0.04, 50 dB: p=0.03, 60 dB: p=0.03, n = 4 mice, paired t-tests). (i) Same as in (c) but for SOM neurons (regression y-intercept vs. 0: p=0.01). (j) Same as in (a) but for VIP neurons. (k) Same as in (b) but for VIP neurons (control vs. ZX1 for 60 dB: p=0.03, 70 dB: p=0.008; 80 dB: p=0.009, n = 7 mice, paired t-tests). (l) Same as in (c) but for VIP neurons (n = 7 mice).
Figure 2—figure supplement 1

Cell-specific expression of GCaMP6f in A1; ZnT3-dependence of gain effects on principal neurons; and intensity-dependent effects of ZX1.
(a) 2-photon images of coronal brain slices of A1 showing cell-type specific expression of GCaMP6f following AAV-CaMKII-GCaMP6f injections into WT mice and AAV-Flex-GCaMP6f injections into PV-, SOM-, and VIP-Cre mice. (b) Transcranial fluorescence responses of principal neurons to sounds of 12 kHz at 40 and 70 dB SPL before and after ZX1 in ZnT3 KO mice. (c) Average responses of principal neurons to 12 kHz sounds of different intensities in ZnT3 KO mice in control (blue) and ZX1 (red, n = 3 mice). (d) Average effect of ZX1 application on different classes of neurons in A1 in response to sounds of low (30–40 dB SPL) and high (70–80 dB SPL) intensity (low vs. high intensity: CaMKII (green), p=0.04 n=10 mice; PV (brown), p=0.001, n = 4 mice; SOM (pink), p=0.001, n = 4 mice; VIP (blue), p=0.04, n = 4 mice, paired t-tests).
Detailed values: (c) 30 dB SPL: control: 5.7 ± 1.4% ΔF/F, ZX1: 6.0 ± 1.1% ΔF/F, p=0.51; 40 dB SPL: control: 6.3 ± 1.3% ΔF/F, ZX1: 6.3 ± 0.8% ΔF/F, p=0.99; 50 dB SPL: control: 8.0 ± 1.9% ΔF/F, ZX1: 6.3 ± 0.9% ΔF/F, p=0.45; 60 dB SPL: control: 10.7 ± 2.3% ΔF/F, ZX1: 10.9 ± 1.8% ΔF/F, p=0.82, 70 dB SPL: control: 12.7 ± 3.0% ΔF/F, ZX1: 12.0 ± 2.1% ΔF/F, p=0.53; 80 dB SPL: control: 15.3 ± 3.9% ΔF/F, ZX1: 16.3 ± 3.6% ΔF/F, p=0.07, paired t-tests, n = 5 mice. (d) Effect of ZX1 vs. control: CaMKII (green), low intensity sounds: 93.1 ± 13.8%, high intensity sounds: 70.9 ± 3.8%, p=0.04, paired t-test, n = 10 mice. PV (red), low intensity sounds: 217.9 ± 20.5%, high intensity sounds: 318.1 ± 27.9%, p=0.001, paired t-test, n = 4 mice. SOM (pink), low intensity sounds: 194.2 ± 17.1%, high intensity sounds: 107.6 ± 5.6%, p=0.001, paired t-test, n = 4 mice. VIP (blue), low intensity sounds: 112.9 ± 17.1%, high intensity sounds: 144.8 ± 8.0%, p=0.04, paired t-test, n = 4 mice.
Figure 3 with 1 supplement

Non-NMDAR signaling mediates zinc inhibition of the sound-evoked responses of principal and PV neurons.
(a) In the presence of APV, fluorescence responses of principal neurons (left) and PV neurons (right) to 12 kHz sounds of 70 dB SPL before and after ZX1. (b) In the presence of APV, average responses of principal neurons to 12 kHz sounds of different intensities in control (APV, black) and after ZX1 (red) (control vs. ZX1 for 70 dB: p=0.04; 80 dB: p=0.01, n = 6 mice, paired t-tests). (c) Same as in b) but for PV neurons (control vs. ZX1 for 30 dB: p=0.04, 40 dB: p=0.03, 50 dB: p=0.02, 60 dB: p=0.04, 70 dB: p=0.01; 80 dB: p=0.01, n = 7 mice, paired t-tests). (d) Same as in (a) but for SOM and VIP neurons. (e) Same as in (b) but for SOM neurons (n = 4 mice). (f) Same as in (b) but for VIP neurons (n = 4 mice).
Figure 3—figure supplement 1
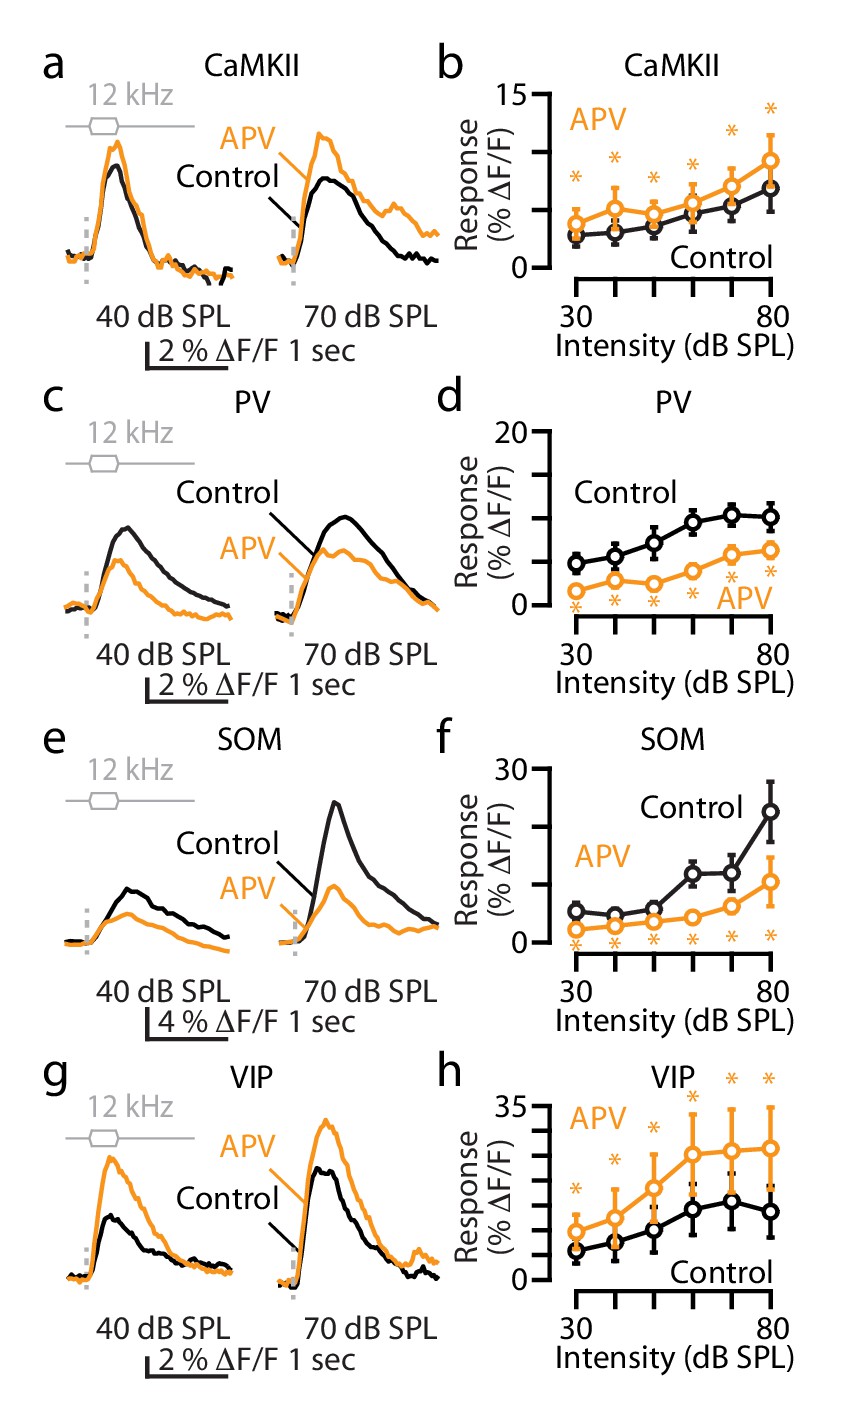
The effect of APV on the sound-evoked responses of principal, PV, SOM and VIP neurons.
(a) Transcranial fluorescence responses of principal neurons to 12 kHz sounds of 40 and 70 dB SPL before and after APV infusion. (b) Average responses of principal neurons to 12 kHz sounds of different intensities in control (black) and after APV (gold; control vs. APV for 30 dB: p=0.005, 40 dB: p=0.016, 50 dB: p=0.039, 60 dB: p=0.006, 70 dB: p=0.042; 80 dB: p=0.014, n = 6 mice, paired t-tests). (c) Same as in (a) but for PV neurons. (d) Same as in (b) but for PV neurons (control vs. APV for 30 dB: p=0.001, 40 dB: p=0.017, 50 dB: p=0.003, 60 dB: p=0.005, 70 dB: p=0.001; 80 dB: p<0.001, n = 6 mice, paired t-tests). (e) Same as in (a) but for SOM neurons. (f) Same as in (b) but for SOM neurons (control vs. APV for 30 dB: p=0.018, 40 dB: p=0.036, 50 dB: p=0.039, 60 dB: p=0.001, 70 dB: p=0.024; 80 dB: p=0.011, n = 4 mice, paired t-tests). (g) Same as in (a) but for VIP neurons. (h) Same as in (b) but for VIP neurons (control vs. APV for 30 dB: p=0.005, 40 dB: p=0.016, 50 dB: p=0.039, 60 dB: p=0.006, 70 dB: p=0.033; 80 dB: p=0.042 n=4 mice, paired t-tests). Detailed values: (b) 30 dB SPL: control: 2.6 ± 0.5% ΔF/F, vs APV, p=0.005; 40 dB SPL: control: 2.8 ± 0.6% ΔF/F, vs. APV, p=0.01; 50 dB SPL: control: 3.3 ± 0.9% ΔF/F, vs. APV, p=0.04; 60 dB SPL: control: 4.3 ± 1.4% ΔF/F, vs. APV, p=0.006, 70 dB SPL: control: 4.9 ± 1.2% ΔF/F, vs. APV, p=0.04; 80 dB SPL: control: 6.3 ± 1.9% ΔF/F, vs APV, p=0.01, paired t-tests, n = 6 mice. (c) 30 dB SPL: control: 4.4 ± 0.7% ΔF/F, vs. APV, p=0.001; 40 dB SPL: control: 5.1 ± 1.1% ΔF/F, vs. APV, p=0.001; 50 dB SPL: control: 6.6 ± 1.3% ΔF/F, vs. APV, p=0.003; 60 dB SPL: control: 8.8 ± 1.3% ΔF/F, vs. APV, p=0.005, 70 dB SPL: control: 9.5 ± 1.5% ΔF/F, vs. APV, p=0.001; 80 dB SPL: control: 9.3 ± 1.5% ΔF/F, vs. APV, p=0.001, paired t-tests, n = 6 mice. (e) 30 dB SPL: control: 5.3 ± 1.5% ΔF/F, vs. APV, p=0.02; 40 dB SPL: control: 4.7 ± 1.2% ΔF/F, vs. APV, p=0.04; 50 dB SPL: control: 5.8 ± 1.2% ΔF/F, vs APV, p=0.04; 60 dB SPL: control: 11.8 ± 3.1% ΔF/F, vs. APV, p=0.001, 70 dB SPL: control: 12.0 ± 3.1% ΔF/F, vs. APV, p=0.02; 80 dB SPL: control: 22.5 ± 5.2% ΔF/F, vs. APV, p=0.01, paired t-tests, n = 4 mice. (f) 30 dB SPL: control: 5.4 ± 2.3% ΔF/F, vs. APV, p=0.03; 40 dB SPL: control: 7.0 ± 3.4% ΔF/F, vs. APV, p=0.009; 50 dB SPL: control: 9.3 ± 4.2% ΔF/F, vs. APV, p=0.03; 60 dB SPL: control: 13.0 ± 4.7% ΔF/F, vs. APV, p=0.03, 70 dB SPL: control: 14.6 ± 5.2% ΔF/F, vs. APV, p=0.03; 80 dB SPL: control: 12.6 ± 4.8% ΔF/F, vs. APV, p=0.04, paired t-tests, n = 4 mice.
Figure 4
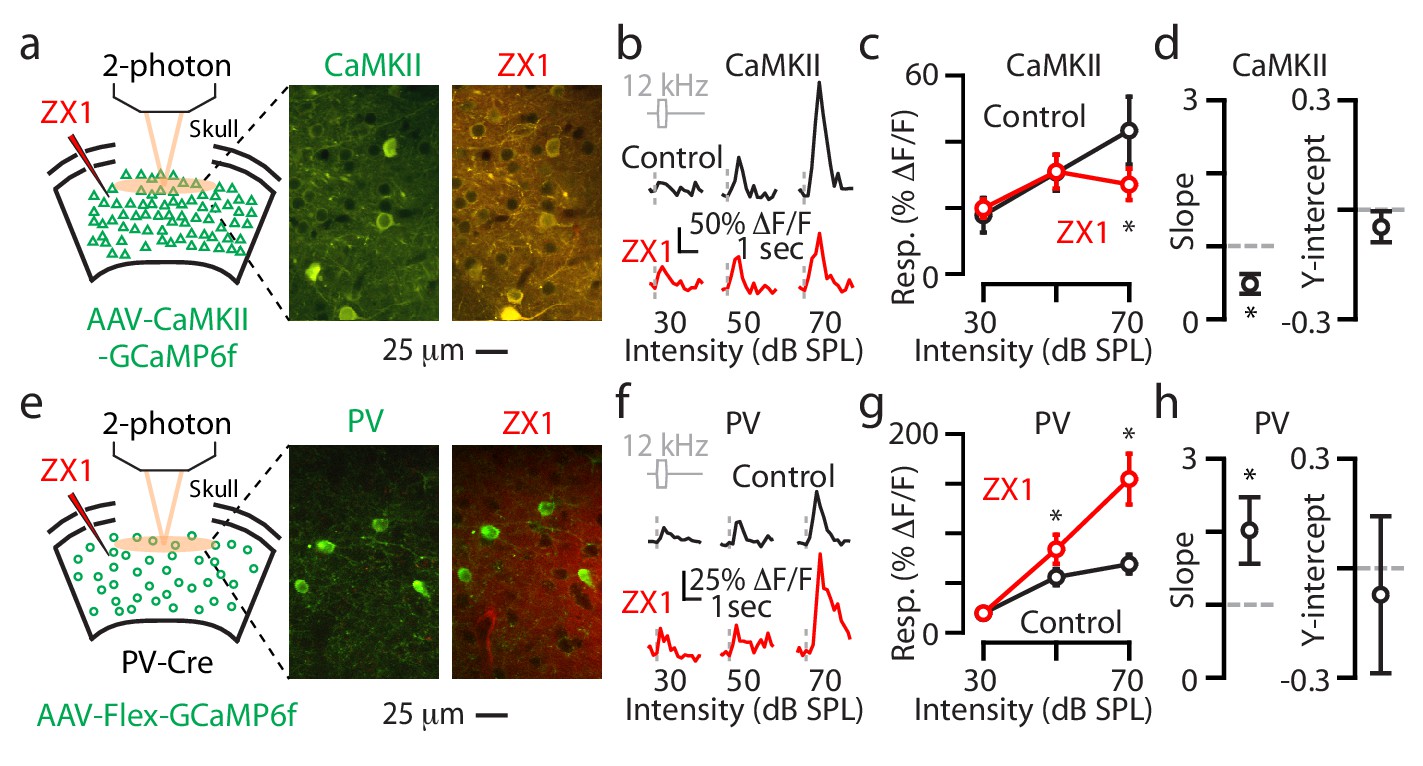
Synaptic zinc increases the gain of individual L2/3 principal neurons and decreases the gain of individual L2/3 PV neurons.
(a) Left: Schematic of experimental setup illustrating 2-photon imaging of GCaMP6f in principal neurons. Middle: Image of a population of A1 L2/3 principal neurons. Right: The same neurons as in the middle panel after ZX1 infusion. (b) Representative example of the sound evoked responses from a L2/3 principal neuron in control (black) and after ZX1 infusion (red). (c) Average responses of principal neurons to 12 kHz sounds of different intensities in control (black) and after ZX1 (red) (control vs. ZX1, 70 dB: p=0.04, signed-rank test, n = 86 neurons from 5 mice). (d) Regression analysis of the sound-evoked responses in control vs. ZX1 in principal neurons. Left: linear regression slope (vs. 1, p=0.001, n = 86 neurons from 5 mice, one sample t-test). Right: linear regression y-intercept. (e) Same as in (a) but for PV neurons. (f) Same as in (b) but for PV neurons. (g) Same as in (c) but for PV neurons (ZX1 vs. control (black), 50 dB: p=0.02 70 dB: p=0.001, signed-rank test, n = 40 neurons from 7 mice. (h) Same as in (d) but for PV neurons (regression slope vs. 1: p=0.04, n = 40 neurons from 6 mice, one sample t-test).
Figure 5
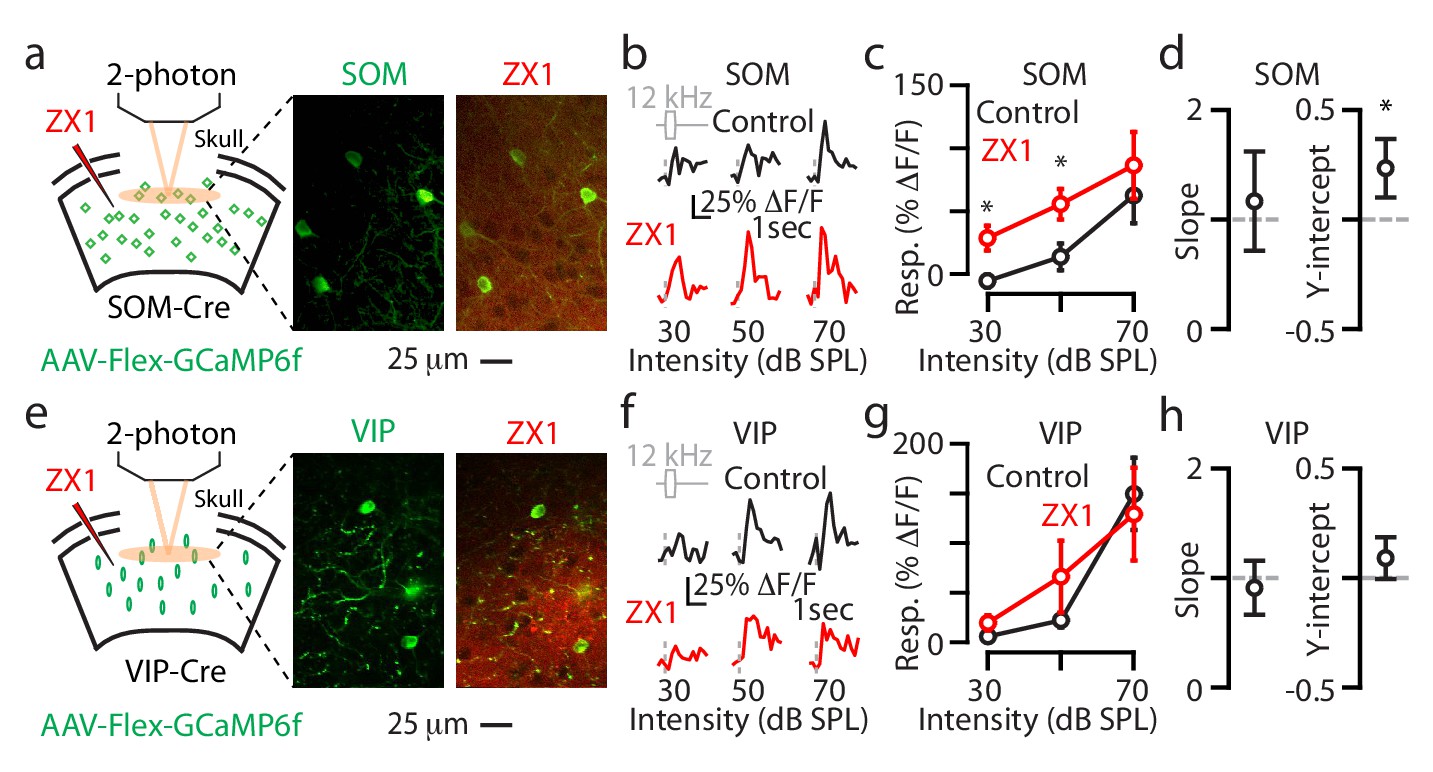
Synaptic zinc decreases the gain of individual L2/3 SOM neurons and does not affect the gain of individual L2/3 VIP neurons.
(a) Left: Schematic of experimental setup illustrating 2-photon imaging of GCaMP6f in SOM neurons. Middle: Image of a population of A1 L2/3 SOM neurons. Right: The same neurons as in the middle panel after ZX1 infusion. (b) Representative example of the sound evoked responses from a L2/3 SOM neuron in control (black) and after ZX1 infusion (red). (c) Average responses of L2/3 SOM neurons to 12 kHz sounds of different intensities in control (black) and ZX1 (red) (control vs. ZX1 , 30 dB: p=0.02, 50 dB: p=0.003, signed-rank test, n = 12 neurons from 4 mice). (d) Regression analysis of the sound-evoked responses in control vs. ZX1 in SOM neurons. Left: linear regression slope. Right: linear regression y-intercept (vs. 0, p=0.001, n = 12 neurons from 4 mice, one sample t-test). (e) Same as in (a) but for VIP neurons. (f) Same as in (b) but for VIP neurons. (g) Same as in (c) but for VIP neurons (n = 30 neurons from 5 mice). (h) Same as in (d) but for VIP neurons (n = 30 neurons from 6 mice).
Additional files
-
Transparent reporting form
- https://doi.org/10.7554/eLife.29893.011
Download links
A two-part list of links to download the article, or parts of the article, in various formats.
Downloads (link to download the article as PDF)
Open citations (links to open the citations from this article in various online reference manager services)
Cite this article (links to download the citations from this article in formats compatible with various reference manager tools)
Cell-specific gain modulation by synaptically released zinc in cortical circuits of audition
eLife 6:e29893.
https://doi.org/10.7554/eLife.29893


