Negative regulation of G2-M by ATR (mei-41)/Chk1(Grapes) facilitates tracheoblast growth and tracheal hypertrophy in Drosophila
- Institute for Stem Cell Biology and Regenerative Medicine, India
- SASTRA University, India
Figures
Figure 1 with 2 supplements

Tracheal progenitors arrested in G2 express Cdc25/String.
(A) Diagram of a third instar larva (L3) showing the tracheal branches in the second thoracic metamere, Tr2 (green). Dashed lines indicate the Tr2 Dorsal Trunk (DT) segment. (B–F) Expression of FUCCI reporters E2F1-GFP (green, arrowheads B(i)-F(i)) and CyclinB-RFP (red, filled arrows (B(ii)-F(ii)) at different larval stages. Double-positive cells are indicated with open arrows. Scale bar = 50 µm. (G) Comparison of the DNA content of mitotically active cells in G1 and G2 (left panel, cells from Tr2 DT at the wandering L3 stage staged using FUCCI) and G2-paused cells in Tr2 DT at L2 (middle panel) and 0–8 h L3 (right panel). DNA content was estimated using DRAQ5 fluorescence intensity (see methods). Plotted in the histogram are DNA content measurements from WL3 G1 (n = 13 nuclei) WL3 G2 (yellow, n = 15 nuclei), L2 (n = 23 nuclei) and 0–8 h L3 (n = 14 nuclei). (H) Cartoon showing the cell cycle program of cells in Tr2 DT at different larval stages. (I) Numbers of cells (grey bars) and Stg mRNA levels (quantitative PCR (brown bars)) in Tr2 DT at different larval stages. Graph shows cell numbers (mean ± standard deviation, n ≥5 tracheae per timepoint, grey axes) and fold change in mRNA levels with respect to L2 (mean ± standard deviation, brown axes). (J) Stg immunostaining (red) in Tr2 DT in wild type at different stages. Also shown are Tr2 DT from Btl-StgRNAi and from wild type larvae stained with the secondary antibody alone (far right panels). The distribution of Stg in the nucleus and cytoplasm can be seen in the higher magnification views of single nuclei below each panel. (K) Effect of heat shock-dependent co-expression of Stg, Cdc2 and CyclinB on cell number in Tr2 DT (mean ± standard deviation, n ≥ 5 tracheae per timepoint). DT = Dorsal Trunk,DB = Dorsal Branch, TC = Transverse Connective.Scale bar = 10 µm. Student's paired t-test: *p<0.05. n.s = not significant.
-
Figure 1—source data 1
Figure 1G: Background intensity corrected values for DRAQ5 intensities at L2, 0–8 h L3 and WL3 Figure 1I: Numerical data for number of cells in Tr2 DT of wild type larvae at different stages.
- https://doi.org/10.7554/eLife.29988.006
Figure 1—figure supplement 1
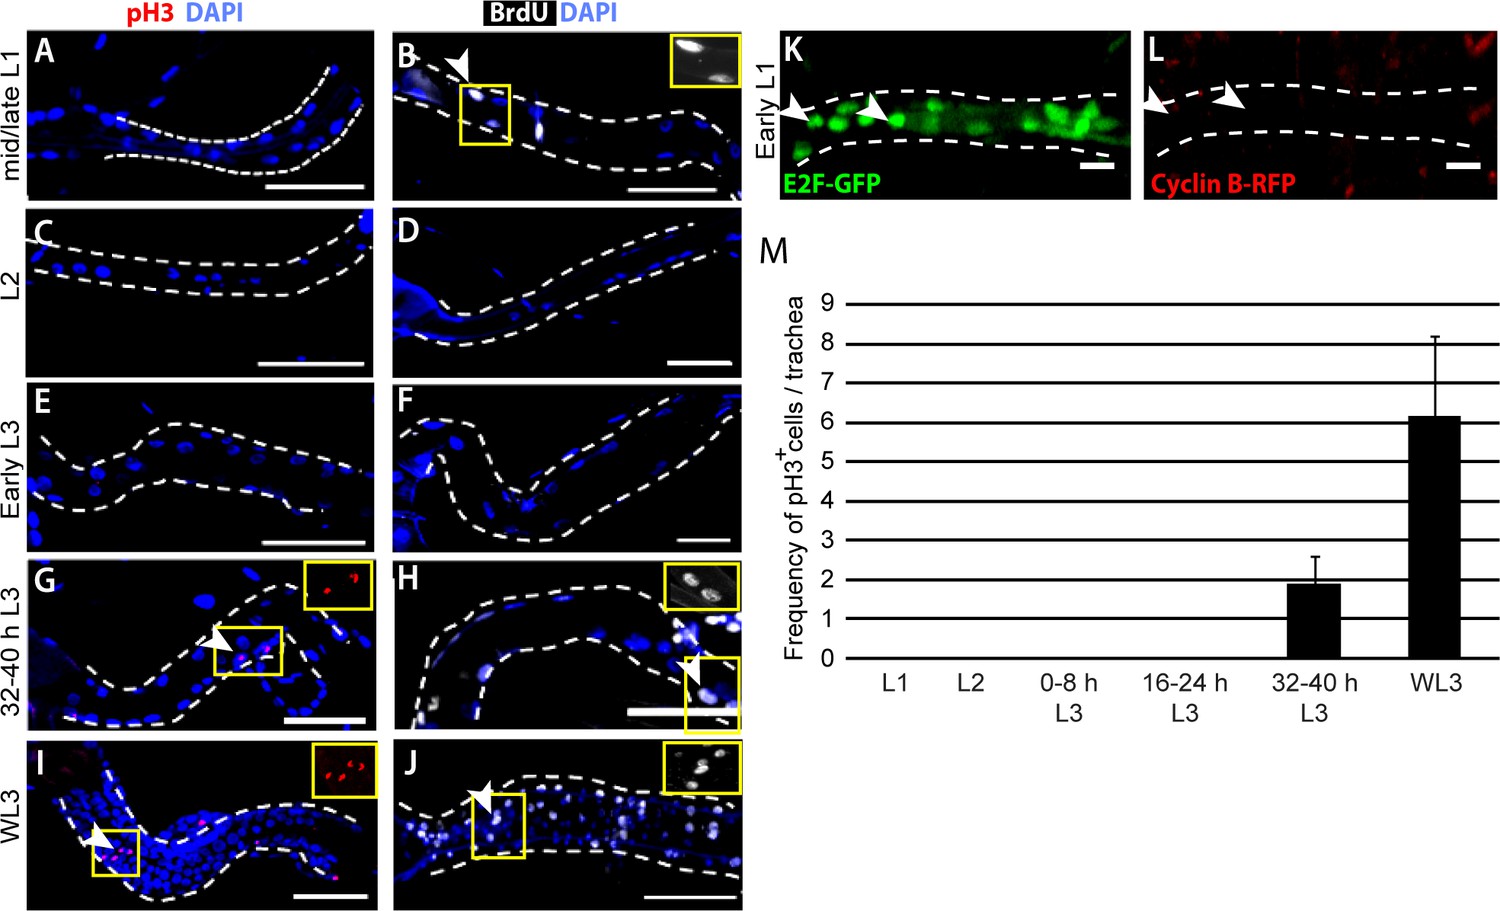
Tr2 tracheoblasts enter S phase in L1 and enter M phase mid L3, after a period of ~48–56 h.
(A–J) Characterization of the cell cycle phasing of cells in Tr2 DT at different larval stages. (A,C,E,G,I) Phospho-Histone H3 immunostaining at different larval stages indicated (pH3, red, arrowheads; DAPI, blue). (B,D,F,H,J) BrdU immunostaining at different larval stages indicated (BrdU, white arrowheads; DAPI, blue). Scale bar = 50 µm. (K–L) Expression of FUCCI reporters E2F1-GFP (green, arrowheads) and CyclinB-RFP (red) in Tr2 DT in early L1. (M) Mitotic indices of Tr2 DT in wild type larvae at different larval stages. Graph shows the frequency of pH3+ nuclei in Tr2 DT at indicated stages (mean ± standard deviation, n = 6 tracheae per timepoint). Scale bar = 10 µm.
Figure 1—figure supplement 2
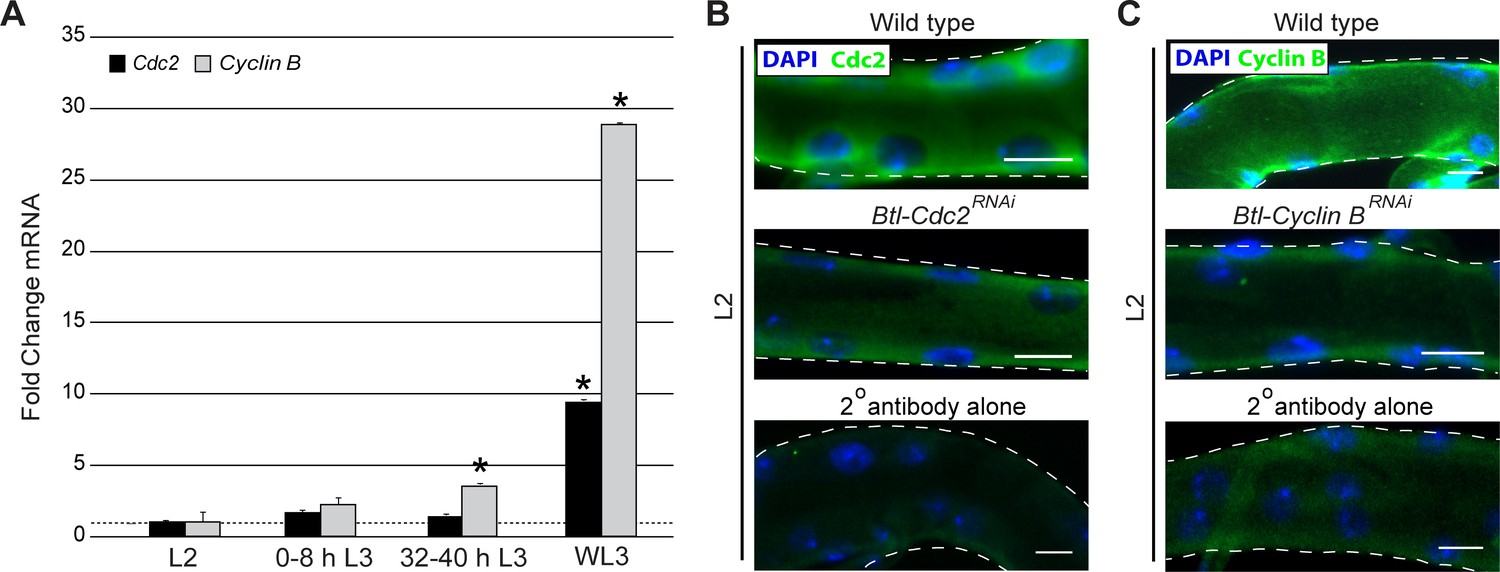
Tr2 tracheoblasts arrested in G2 express Cdc2/Cdk1 and Cyclin B.
(A) Quantitative PCR analysis of Cdc2/Cdk1 and CycB mRNA levels in micro-dissected Tr2 DT fragments at different larval stages. Graph shows fold change in mRNA levels (mean ± standard deviation) with respect to L2 (indicated by dashed line). (B) Cdc2 immunostaining (green) in Tr2 DT in wild type and Cdc2RNAi expressing larvae in L2. Also shown is Tr2 DT in L2 stained with the secondary antibody alone (bottom panel). (C) CyclinB immunostaining (green) in Tr2 DT in wild type and CyclinBRNAi expressing larvae at L2. Also shown is Tr2 DT in L2 stained with the secondary antibody alone (bottom panel). The staining for Cdc2 and CycB representative of 2 independent immunohistochemical experiments in which at least 6 tracheae from each of the conditions shown were stained and imaged. In addition, we have also examined levels of Cdc2 and CycB in 6 tracheae each at 0–8 h L3, 32–40 h L3 and Wandering L3 in two independent experiments (data has been shown). Scale bar = 10 µm. Student's paired t-test: *p<0.05.
Figure 2 with 1 supplement
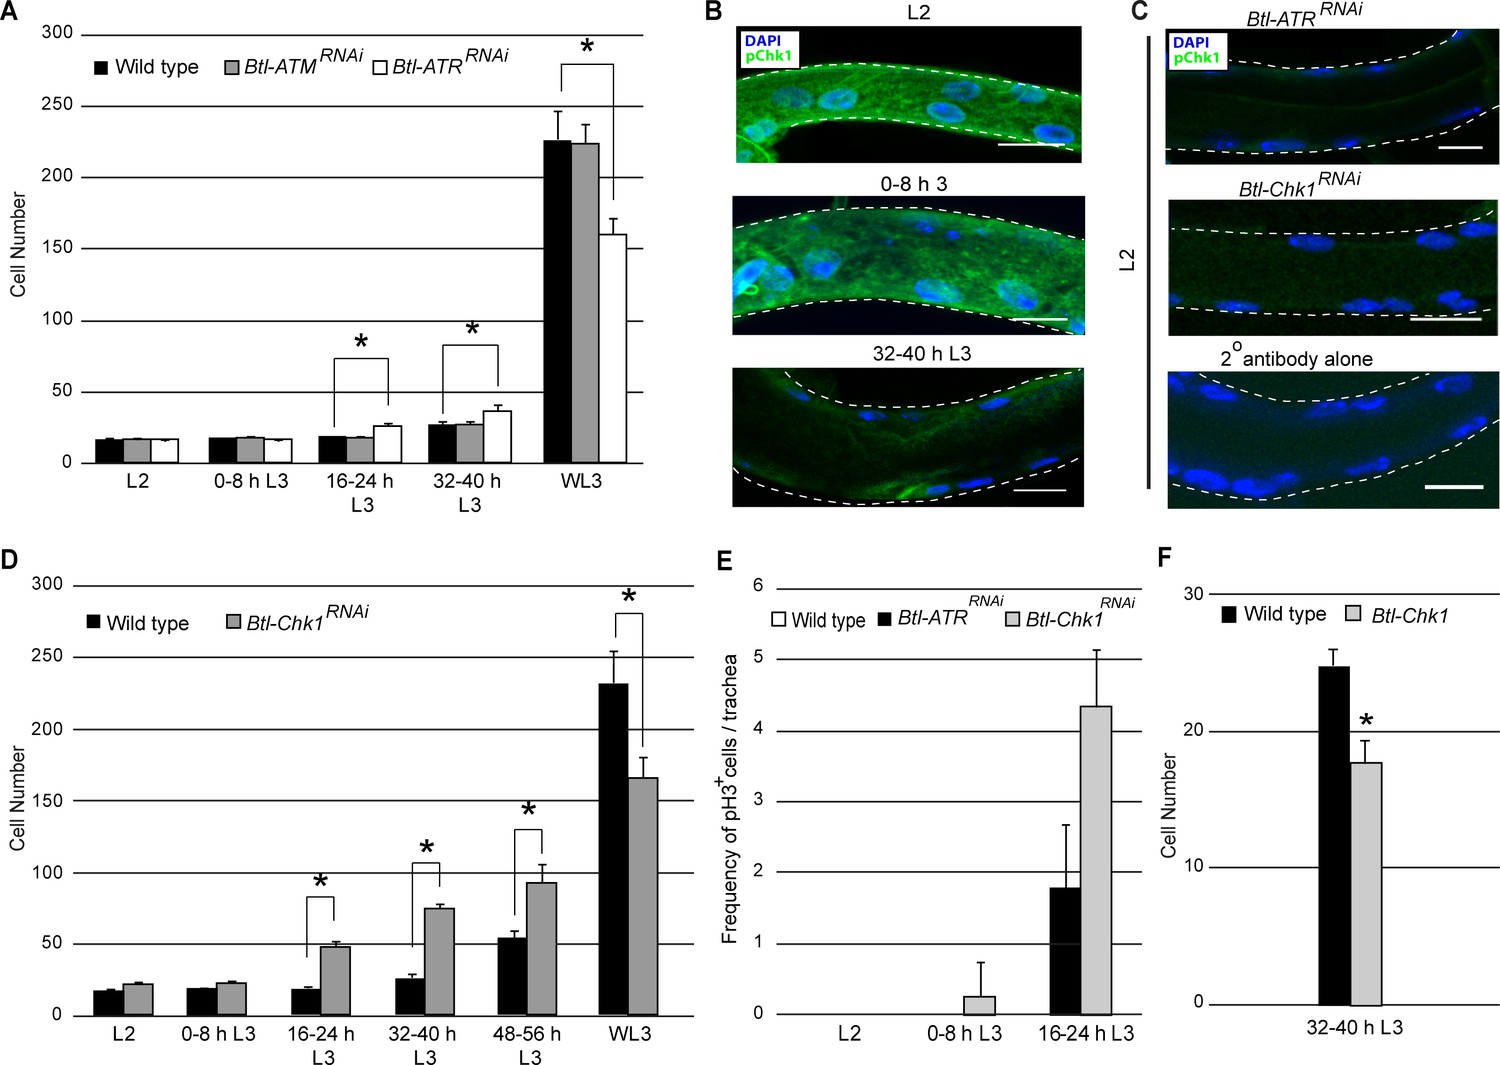
ATR and its effector Checkpoint kinase 1 regulate G2 arrest.
(A) Effect of reduction of ATR or ATM expression on cell number in Tr2 DT. Graph shows cells numbers in wild type (Btl-Gal4/+; UAS-nuGFP), Btl-ATRRNAiand Btl-ATMRNAi at different stages (mean values ± standard deviation, n = 7 tracheae per condition per timepoint). (B–C) Activated Chk1(phospho-Chk1Ser345) immunostaining (green) in Tr2 DT in wild type, Btl-ATRRNAi and Btl-Chk1RNAi. (B) phospho-Chk1Ser345 immunostaining in Tr2 DT in wild type (Btl-Gal4/+; UAS-nuGFP) at different stages (C) phospho-Chk1Ser345 immunostaining in Tr2 DT in L2 larvae from Btl-ATRRNAi (top panel) in Btl-Chk1RNAi (middle panel) and wild type treated with secondary antibody alone (bottom panel). (D) Effect of reduction in Chk1 expression in tracheae on cell number in Tr2 DT. Graph shows cells numbers in Tr2 DT in wild type (Btl-Gal4/+; UAS-nuGFP) and Btl-Chk1RNAi at different stages (mean values ± standard deviation, n = 10 tracheae per condition per timepoint). (E) Mitotic indices of Tr2 DT in wild type, Btl-ATRRNAi and Btl-Chk1RNAi expressing larvae at different stages. Graph shows the frequency of pH3+ nuclei/tracheae at the indicated stages (mean values ± standard deviation, n = 7 tracheae per condition per timepoint. (F) Effect of overexpression of Chk1 on cell number in Tr2 DT. Graph shows cells numbers in Tr2 DT in wild type (Btl-Gal4/+; UAS-nuGFP) and Btl-Chk1at 32–40 h (mean values ± standard deviation, n = 10 tracheae per condition). DAPI, blue. Scale bar = 10 µm. Student's paired t-test: *p<0.05.
-
Figure 2—source data 1
Figure 2D: Numerical data for number of cells in Tr2 DT of wild type and Chk1RNAi -expressing larvae at different stages.
- https://doi.org/10.7554/eLife.29988.009
Figure 2—figure supplement 1
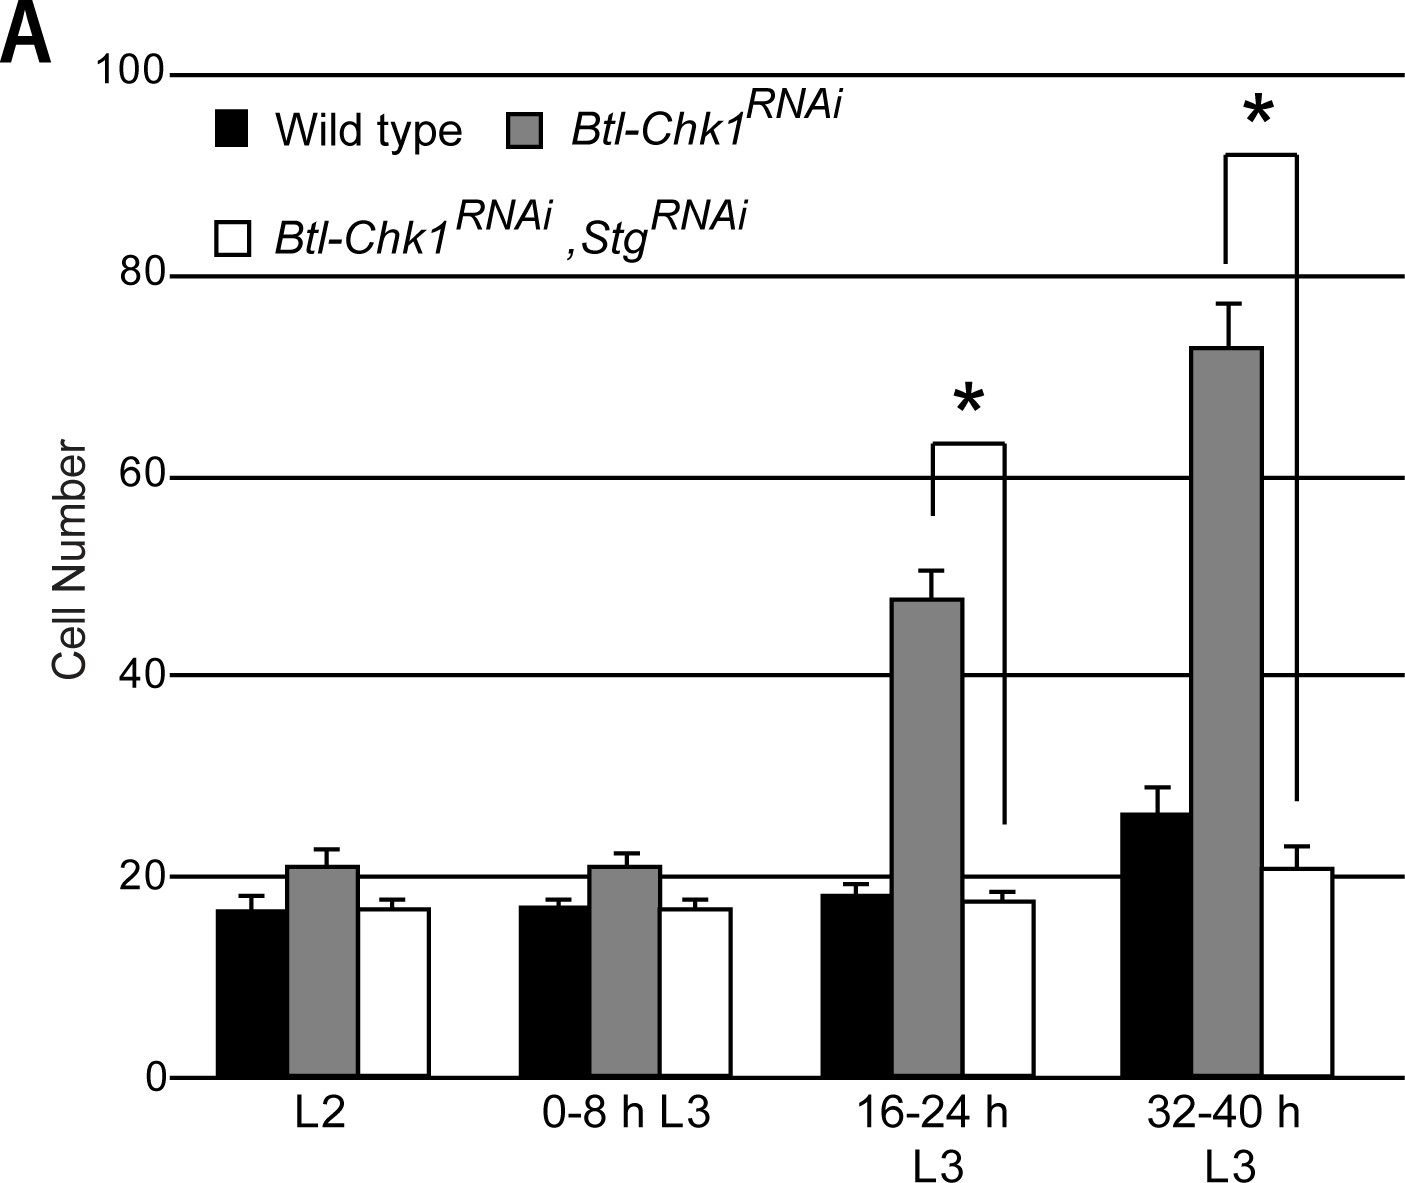
Precocious proliferation in Chk1 mutants is dependent on Stg.
(A). Effect of reduction in Chk1 and Stg expression on cell number in Tr2 DT. Graph shows cell number in Tr2 DT at different stages (mean values ± standard deviation, n = 10 tracheae per condition per timepoint). Student's paired t-test: *p<0.05.
Figure 3

Role for Chk1 in the regulation of tracheoblast proliferation post mitotic entry.
(A). Graph shows cell numbers in Tr2 DT at WL3 in tub-Gal80ts/UAS-Chk1RNAi; Btl-Gal4/+larvae grown at 18°C (uninduced (wild type), black) or grown at 29°C from the embryonic period (constitutively induced, grey) (mean ± standard deviation, n = 10 tracheae per condition). (B) Graph shows cell numbers in Tr2 DT at WL3 in tub-Gal80ts/UAS-Chk1RNAi; Btl-Gal4/+larvae grown at 18°C (uninduced (wild type), black, same as (A)) or grown at 29°C from the embryonic period till 24 h L3 then shifted to 18°C till WL3 (conditionally induced, grey) (mean ± standard deviation, n = 10 tracheae per condition). (C) Graph showing relative frequencies of BrdU+ or pH3+ cells in Tr2 DT in wild type (UAS-nuGFP; Btl-Gal4/TM3,Ser)and Btl-Chk1RNAi at 48–56 h (mean ± standard deviation, n = 10 tracheae per timepoint). (D) Graph showing frequency of cleaved-Caspase 3+cells in Tr2 DT in wild type (UAS-nuGFP; Btl-Gal4/TM3,Ser) and Btl-Chk1RNAi WL3 larvae (mean ± standard deviation, n = 13 tracheae each). Student's paired t-test: *p<0.05. n.s = not significant.
Figure 4
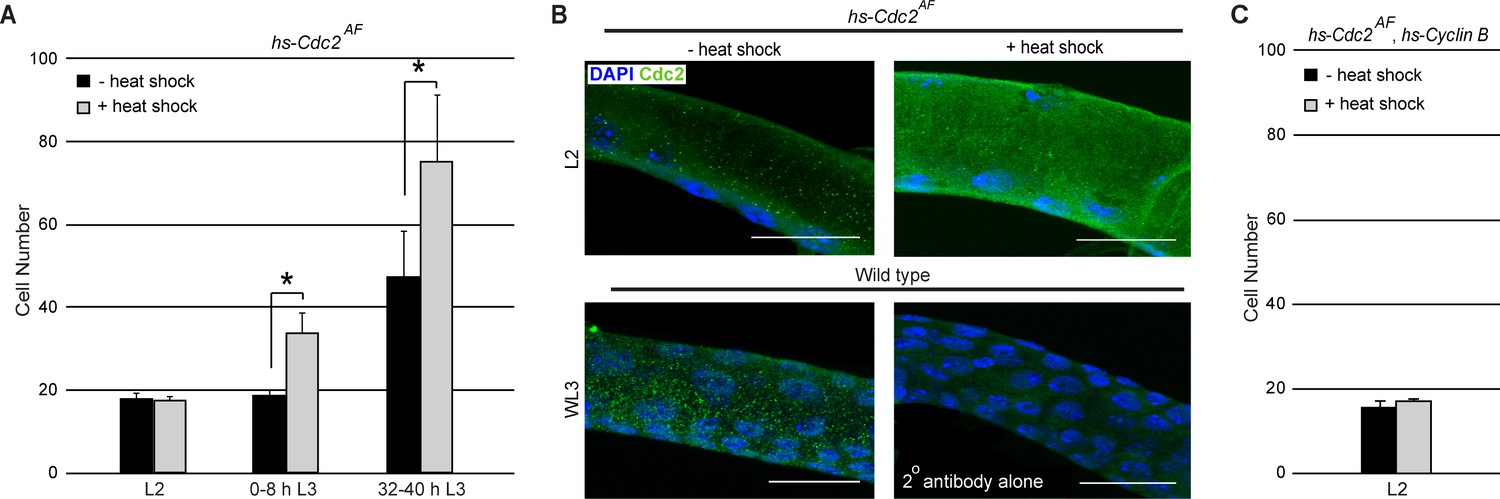
Expression of an activated Cdc2 (Cdc2AF) is unable to induce mitosis in L2.
(A) Effect of heat shock-dependent expression of Cdc2AF on cell number in Tr2 DT at different stages. Graph shows cell numbers in uninduced (black bars) or induced (grey bars) larvae (mean ± standard deviation, n = 10 tracheae per condition per timepoint). (B) Cdc2 immunostaining (green) in Tr2 DT in hs-Cdc2AF uninduced (top left panel) and induced (top right panel) larvae in L2. Shown in the bottom panels are Cdc2 immunostaining of wild type Tr2 DT at WL3 (bottom left panel) and of wild type Tr2 DT stained with the secondary antibody alone (bottom right panel). (C) Effect of heat shock-dependent co-overexpression of Cdc2AF and Cyclin B on cell number in Tr2 DT in L2. Graph shows cell numbers in uninduced (black bars) or heat-shock induced (grey bars) larvae (mean ± standard deviation, n = 5 tracheae per condition per timepoint). Scale bar = 20 µm. Student's paired t-test: *p<0.05.
-
Figure 4—source data 1
Figure 4A: Numerical data for number of cells in Tr2 DT of hs-Cdc2AF expressing larvae with or without heat shock exposure at different stages.
- https://doi.org/10.7554/eLife.29988.012
Figure 5
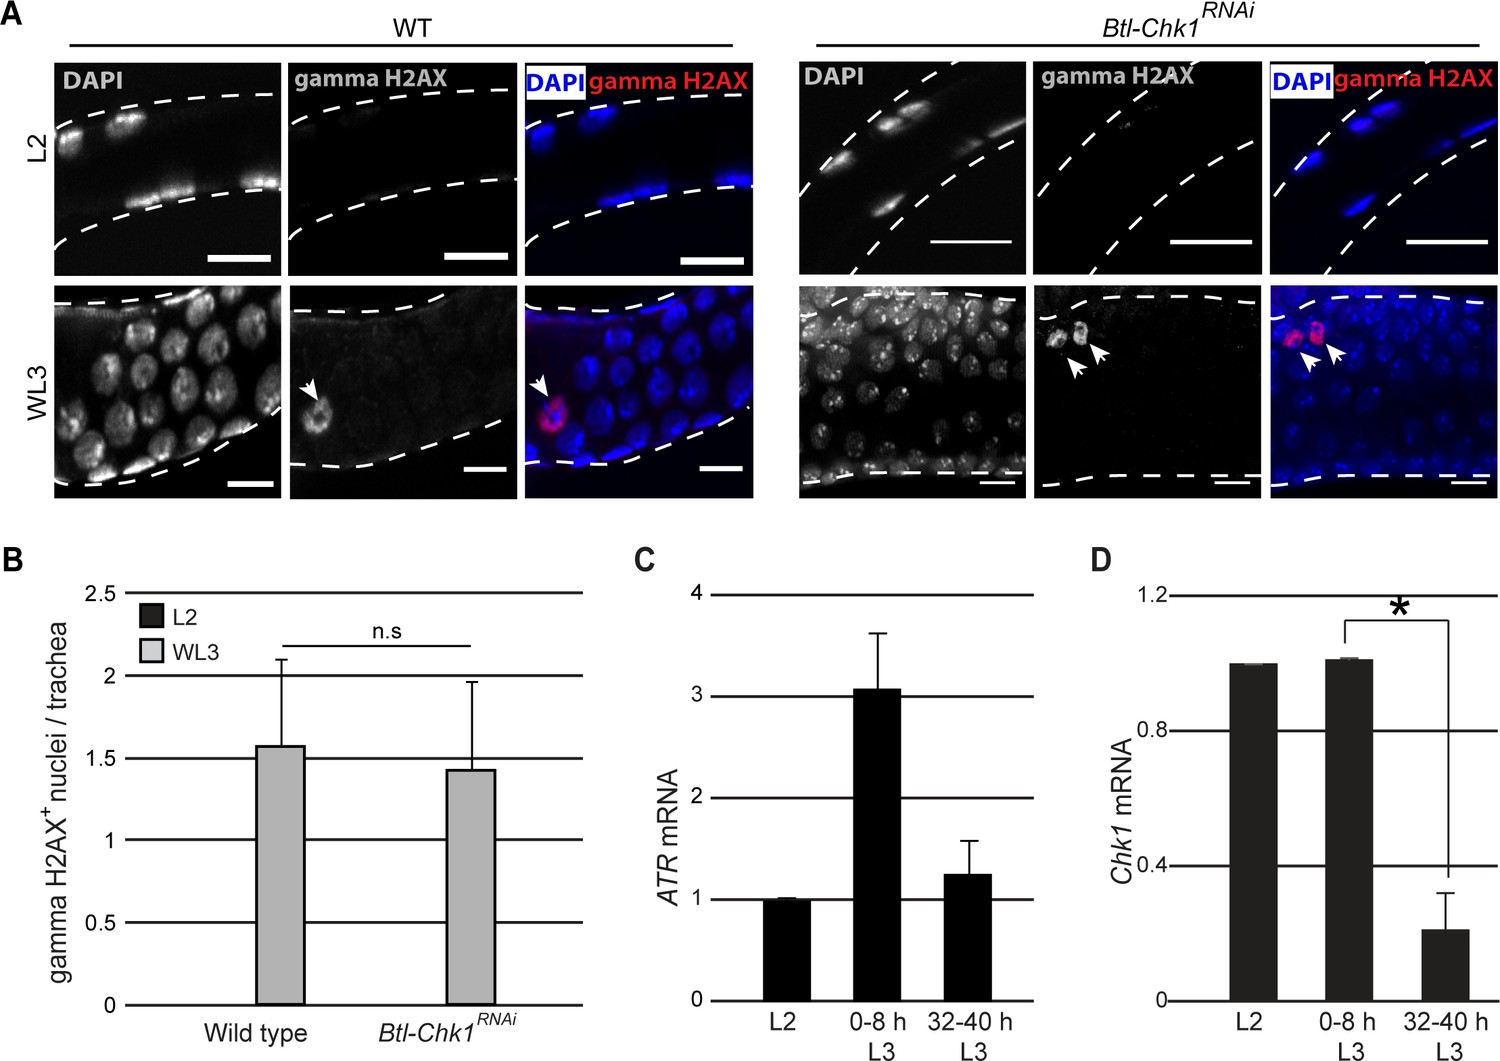
Chk1 is regulated at a transcriptional level in Tr2 tracheoblasts.
(A) gamma-H2AXSer139 immunostaining (red, arrowhead) in Tr2 DT in wild type (Btl-Gal4/+; UAS-nuGFP, left panels, arrowheads) and Btl-Chk1RNAi (right panels) at L2 and WL3. (B) Frequencies of gamma-H2AX stained nuclei in Tr2 DT of wild type and Chk1RNAi-expressing larvae at L2 (black bars) or WL3 (grey bars) (mean ± standard deviation, n = 7 tracheae per condition per timepoint).(C) Quantitative PCR analysis of ATR mRNA levels in Tr2 DT fragments at different stages. Graph shows fold change in mRNA levels with respect to L2 (mean ± standard deviation). (D) Quantitative PCR analysis of Chk1 mRNA levels in Tr2 DT fragments at different stages. Graph shows fold change in mRNA levels with respect to L2 (mean ± standard deviation). Scale bar = 10 µm. Student's paired t-test: *p<0.05.
Figure 6 with 1 supplement

Induction of precocious mitoses interferes with growth of Tr2 DT.
(A) Graph shows length (μm) of Tr2 DT at different stages (mean ± standard deviation, n = 7 tracheae per timepoint). (B) Graph shows width of Tr2 DT (µm) at different stages (mean ± standard deviation, n = 7 tracheae per timepoint). (C) Graph shows area (µm2) of cells in Tr2 DT at different stages (mean ± standard deviation, n = 15 cells per timepoint). (D) Effect of Chk1RNAi or Chk1 expression in size of Tr2 DT at 32–40 h L3. Scatter plot shows length and width of Tr2 DT in tracheae from wild type (n = 6), Btl-Chk1RNAi (n = 11) and Chk1-expressing larvae (n = 7) at 32–40 h L3. (E) Model for the regulation of proliferation and growth in Tr2 DT. We propose that negative regulation of G2-M by ATR/Chk1 and by other mechanisms that regulate Cdc2/Cdk1 activity facilitate cellular growth and tracheal hypertrophy. Student's paired t-test: *p<0.05.
-
Figure 6—source data 1
Figure 6A-C: Numerical data for measurements of length (6A), width (6B) and cell area in wild type (6C) larvae at different stages.
Figure 6D: Numerical data for measurements of length and width in wild type and Chk1RNAi or Chk1-expressing larvae at 32–40 h L3.
- https://doi.org/10.7554/eLife.29988.016
Figure 6—figure supplement 1
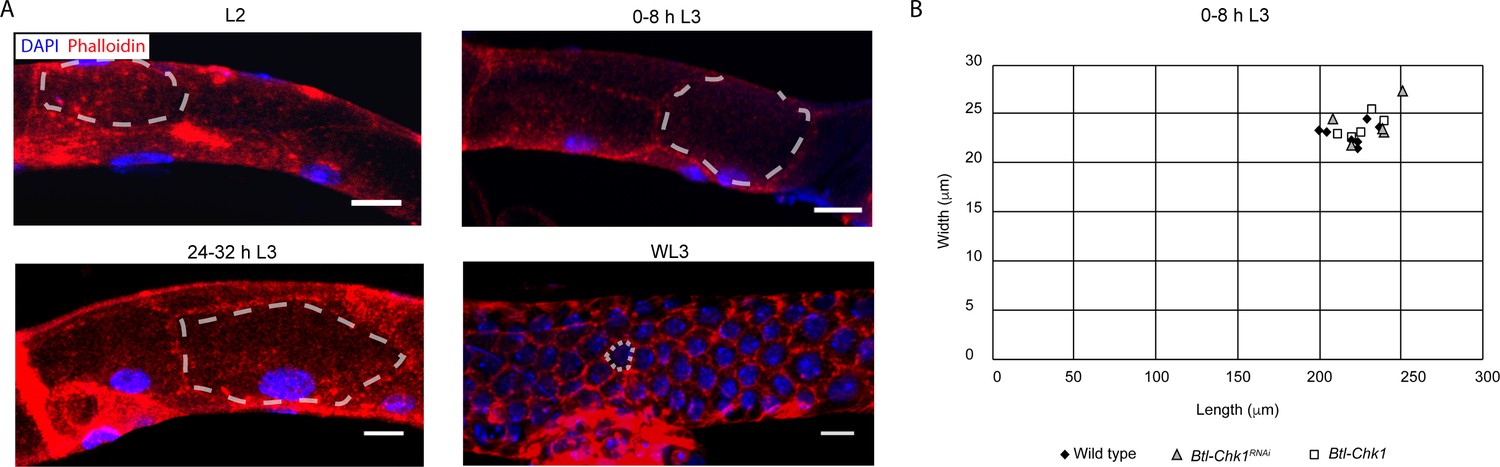
Cell and tracheal size changes in Tr2 DT.
(A) Phalloidin (red) and DAPI (blue) immunostaining of Tr2 DT in wild type larvae at different stages. Dashed line is apposed to the cell margin. Scale bar = 10 µm. (B) Effect of Chk1RNAi or Chk1 expression on size of Tr2 DT at 0–8 h L3. Scatter plot shows length and width of Tr2 DT in tracheae from wild type (n = 7), Btl-Chk1RNAi (n = 5) and Chk1-expressing larvae (n = 5) at 0–8 h L3.
Author response image 1
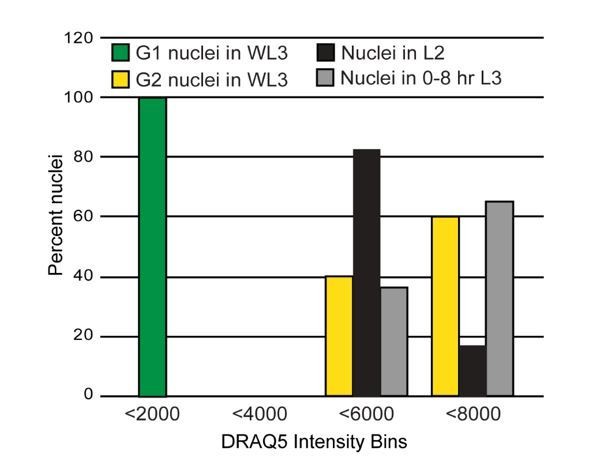
Comparison of the DNA content of actively dividing cells in Tr2 DT in G1 and G2 at the wandering L3 stage (FUCCI) and cells in Tr2 DT at L2 and 0-8 h L3.
Histogram shows percent nuclei from WL3 in G1 (green, n=13) or G2 (yellow, n=15), L2 (black, n=23) and 0-8 h L3 (grey, n=14) in each DRAQ5 intensity bin (DNA content). We have also repeated our BrdU incorporation studies in animals in L2, L3 and in animals fed BrdU through the L2-L3 molt. We do not detect any BrdU incorporation in Tr2 DT in any of these conditions.
Author response image 2

Author response image 3
Download links
A two-part list of links to download the article, or parts of the article, in various formats.
Downloads (link to download the article as PDF)
Open citations (links to open the citations from this article in various online reference manager services)
Cite this article (links to download the citations from this article in formats compatible with various reference manager tools)
Negative regulation of G2-M by ATR (mei-41)/Chk1(Grapes) facilitates tracheoblast growth and tracheal hypertrophy in Drosophila
eLife 7:e29988.
https://doi.org/10.7554/eLife.29988


