Risk of punishment influences discrete and coordinated encoding of reward-guided actions by prefrontal cortex and VTA neurons
- University of Pittsburgh, United States
- Oregon Health and Science University, United States
Figures
Figure 1 with 1 supplement

Punishment risk induces anxiety-like changes in reward-seeking behavior.
(a) A schematic diagram illustrating the task. Punishment risk varied across blocks – Block1, P(S|A)=0; Block2, P(S|A)=0.06; Block3, P(S|A)=0.1. Every nose poke procured reward across all blocks – P(R|A)=1. (b) Representative behavioral trajectories in block 1 (left, 10 trials) and block 3 (right, 10 trials). (c) Significant increases in response time (RT, filled bars, mean ±s.e.m.) and immobile RT (slashed bars – time elapsed motionless during RT) were observed as a function of punishment risk. (Inset) Latency from reward delivery to retrieval (reward RT) did not differ across blocks. 17 rats performed this task with electrophysiological recording. (d) RT, immobile RT, and reward RT did not change across blocks in the absence of punishment (no-shock control session). 12 out of the 17 rats performed this task with electrophysiological recording before they ever received an electrical foot shock. (e) A separate group of rats (N = 9) performed three sessions of the task with pretreatment of saline (Day 1) – diazepam (2 mg/kg) – saline (Day 2). Pretreatment of an anxiolytic diazepam (2 mg/kg) but not saline injection averted punishment-induced increase in the mean RT. **p<0.005; post hoc test. (Inset) Injections did not influence reward RT.
Figure 1—figure supplement 1
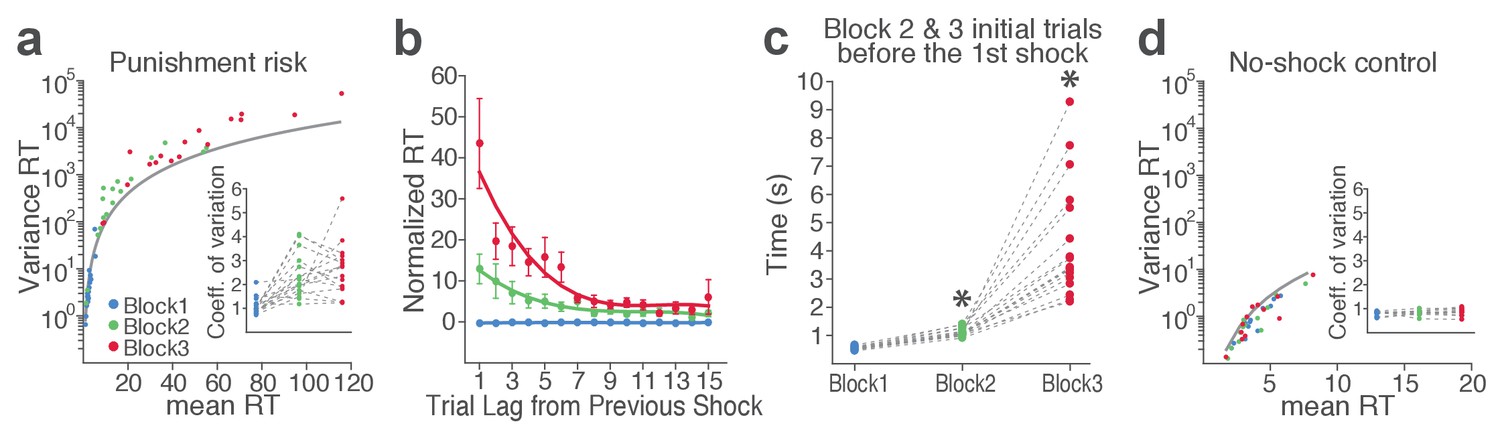
Punishment risk increases trial-to-trial variability in RT.
(a) Colored dots represent individual animals’ variance RT across trials in different blocks as a function of mean RT. The gray curve indicates expected variance RT given the mean RT, considering RT as time intervals in Poisson point process. Note that variances of RT in block 2 and 3 appear above the gray curve. (Inset) Coefficients of variation significantly increase as a function of punishment. (b) RT varied systematically as a function of the trial lag (distance) from the previously punished trial in blocks 2 and 3. Each dot represents RT normalized to the mean and the standard deviation RT of the block 1 plotted as a function of the trial lag from the previous shock trial. Each curve represents the polynomial fit of each block’s data. (c) To examine whether animals predicted upcoming increase in punishment risk based on learning from previous sessions, we compared the RTs of initial trials of block 2 and 3 prior to the 1st shock in each block. Asterisks indicate a significant increase from the block 1 mean RT (GLM repeated measures, post hoc pairwise comparisons, p<0.001). (d) Individual mean and variance RT of the no-shock control session exhibit lack of change across blocks. (Inset) Coefficients of variation did not differ across blocks in the absence of risk.
Figure 2 with 2 supplements
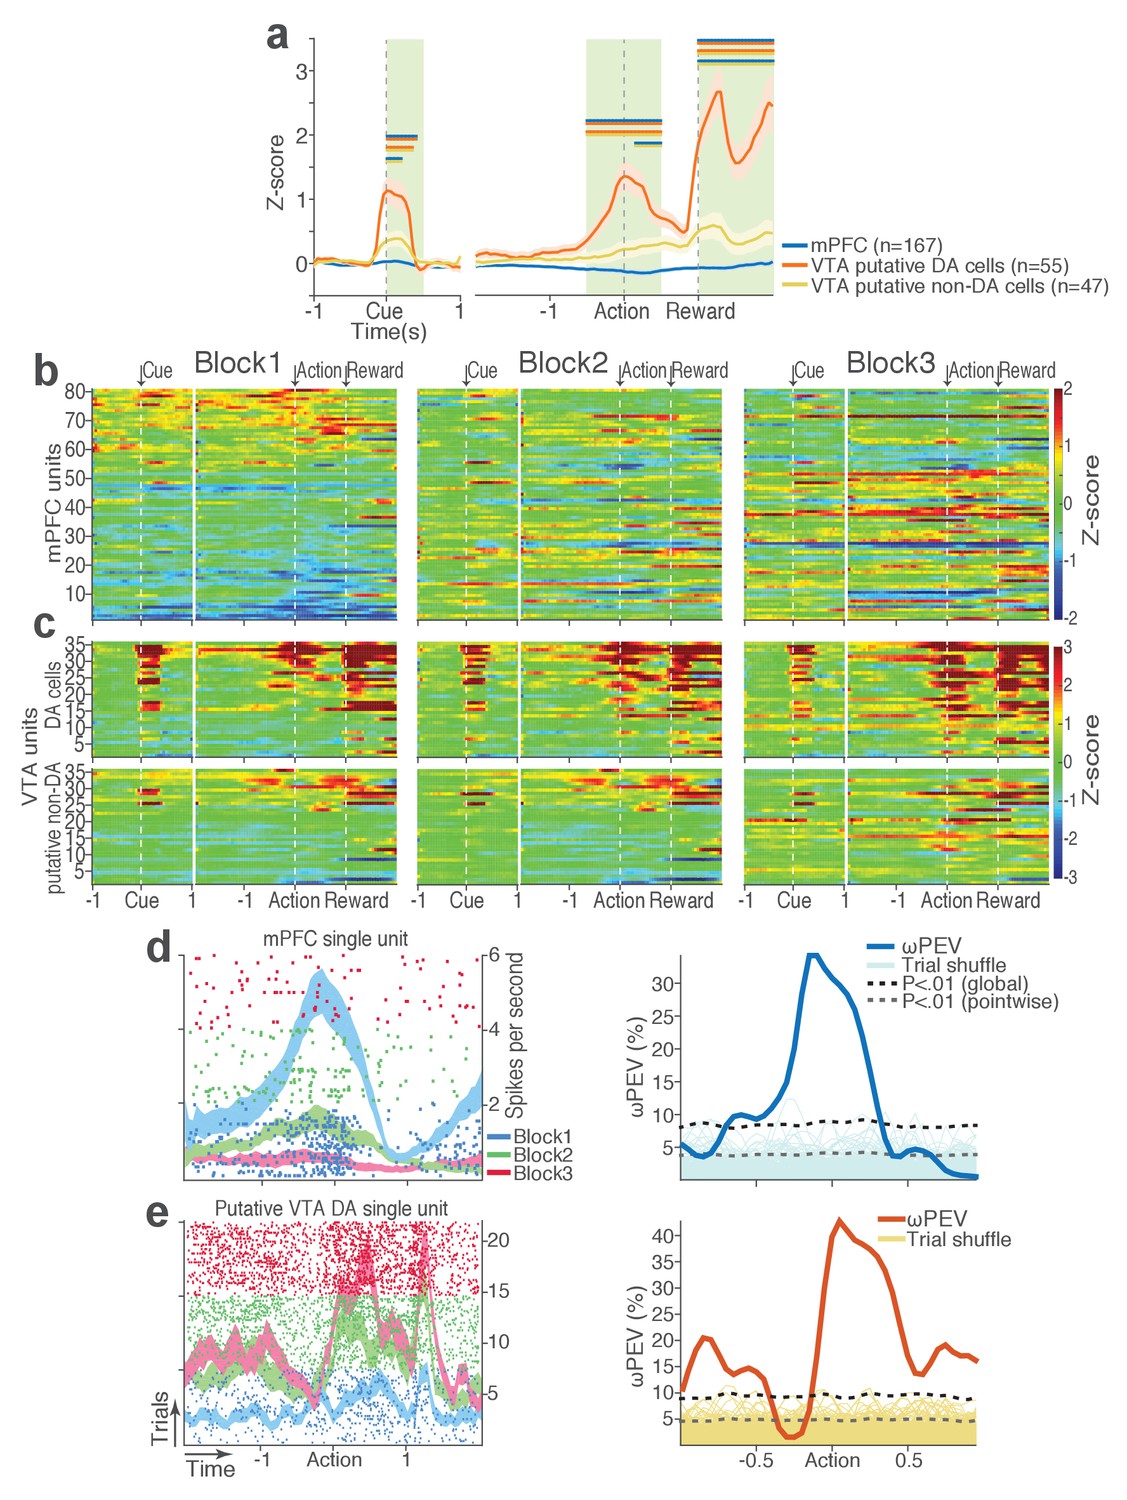
mPFC, VTA putative DA, and non-DA single units respond to task events and punishment.
(a) Peri-event activity averaged across all trials and all units within each neuron group. Dual-colored bars above indicate significant pairwise differences at corresponding time bins according to the post hoc analysis (p<0.05). The green shadows indicate time windows of statistical analyses. (b) Baseline-normalized peri-event firing rates of mPFC units are plotted per block to reveal neuronal responses to punishment. Only units with significant activity modulation are plotted – that is, punishment-encoding units (Figure 3—figure supplement 1). (c) Peri-event activity of VTA putative DA (top panels) and non-DA (bottom panels) punishment-encoding units. (d-e) Identification of single units discriminating their firing rates across different blocks as a function of punishment. (d) Left, A raster plot showing a representative mPFC unit’s peri-action spike activity across blocks with spike density functions of different blocks superimposed. Right, To quantify each unit’s encoding, percent variance in the unit’s firing rate explained by blockwise change in punishment contingency (ωPEV) was calculated. To determine the global ωPEV band, trial-shuffled surrogate ωPEV distribution (light blue curves) was acquired, and the pointwise and global ωPEV bands were found from the distribution at α = 0.01 (Materials and methods). A unit whose ωPEV curve crosses the global band was determined as a punishment-encoding unit. (e) Left, A representative VTA unit’s peri-action activity across blocks. Right, This VTA unit satisfied the punishment-encoding criterion.
Figure 2—figure supplement 1
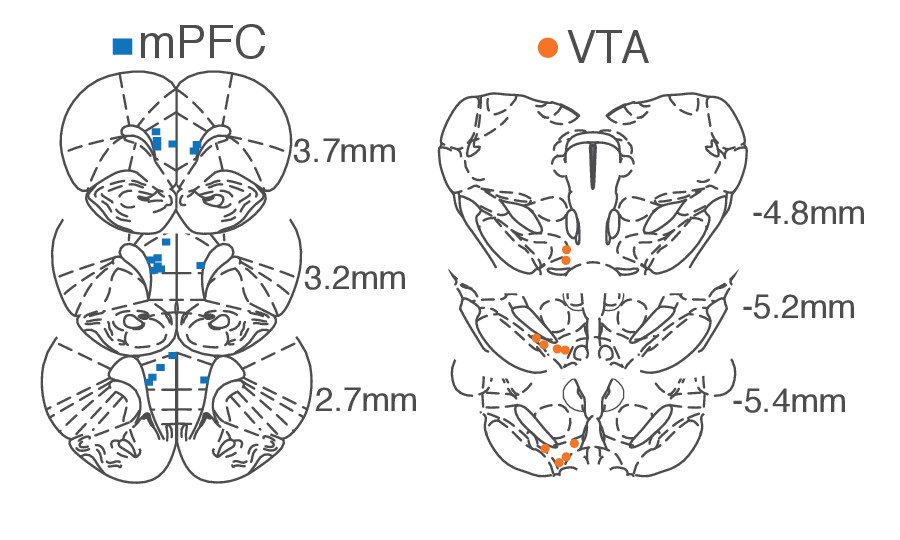
Histologically verified placements of mPFC and VTA electrodes.
We recorded activity of ipsilateral VTA and mPFC (N = 10) or bilateral mPFC (N = 4). Coordinates are relative to the bregma.
Figure 2—figure supplement 2
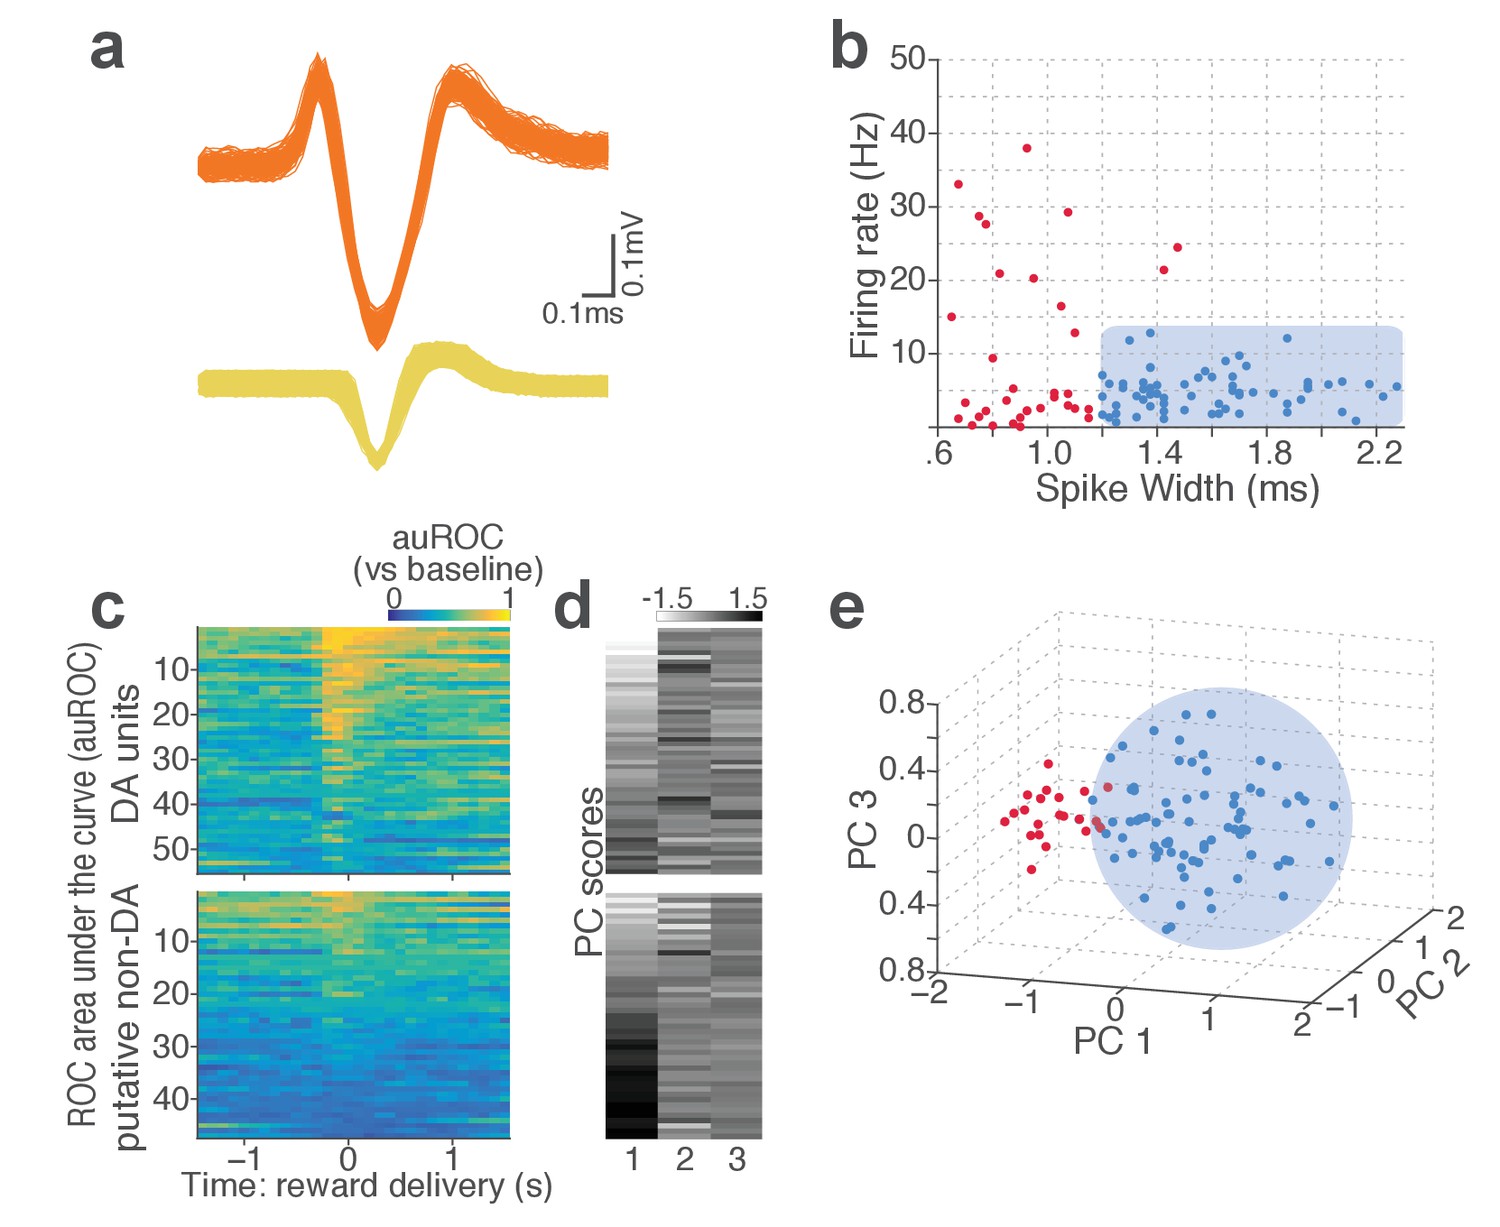
Classification of VTA single units to putative DA or non-DA units.
(a) Representative spike waveforms of a putative DA (top) and a non-DA (bottom) units. (b) Units were first classified based on their mean baseline firing rate and width of the spike waveform. Units whose mean baseline firing rate slower than 12 Hz, waveform width greater than 1.2 ms were considered to be putative DA units (blue circles). (c) To characterize each unit’s reward response, ROC curves were calculated by comparing the firing-rate distributions of reward delivery vs baseline epochs. (d) Principal component analysis (PCA) was conducted on auROC values. (e) Units were mapped onto a 3-d space comprising the top three principal components. Unsupervised clustering was conducted by fitting Gaussian mixture models which yielded two clusters of units: one with phasic excitation to reward (blue circles), the other with sustained excitation or suppression to reward (red circles). Units in the former cluster were classified as putative DA units. Only the units satisfying both criteria (b) and (e) were finally labelled as putative DA units, and the rest of units were putative non-DA units.
Figure 3 with 1 supplement
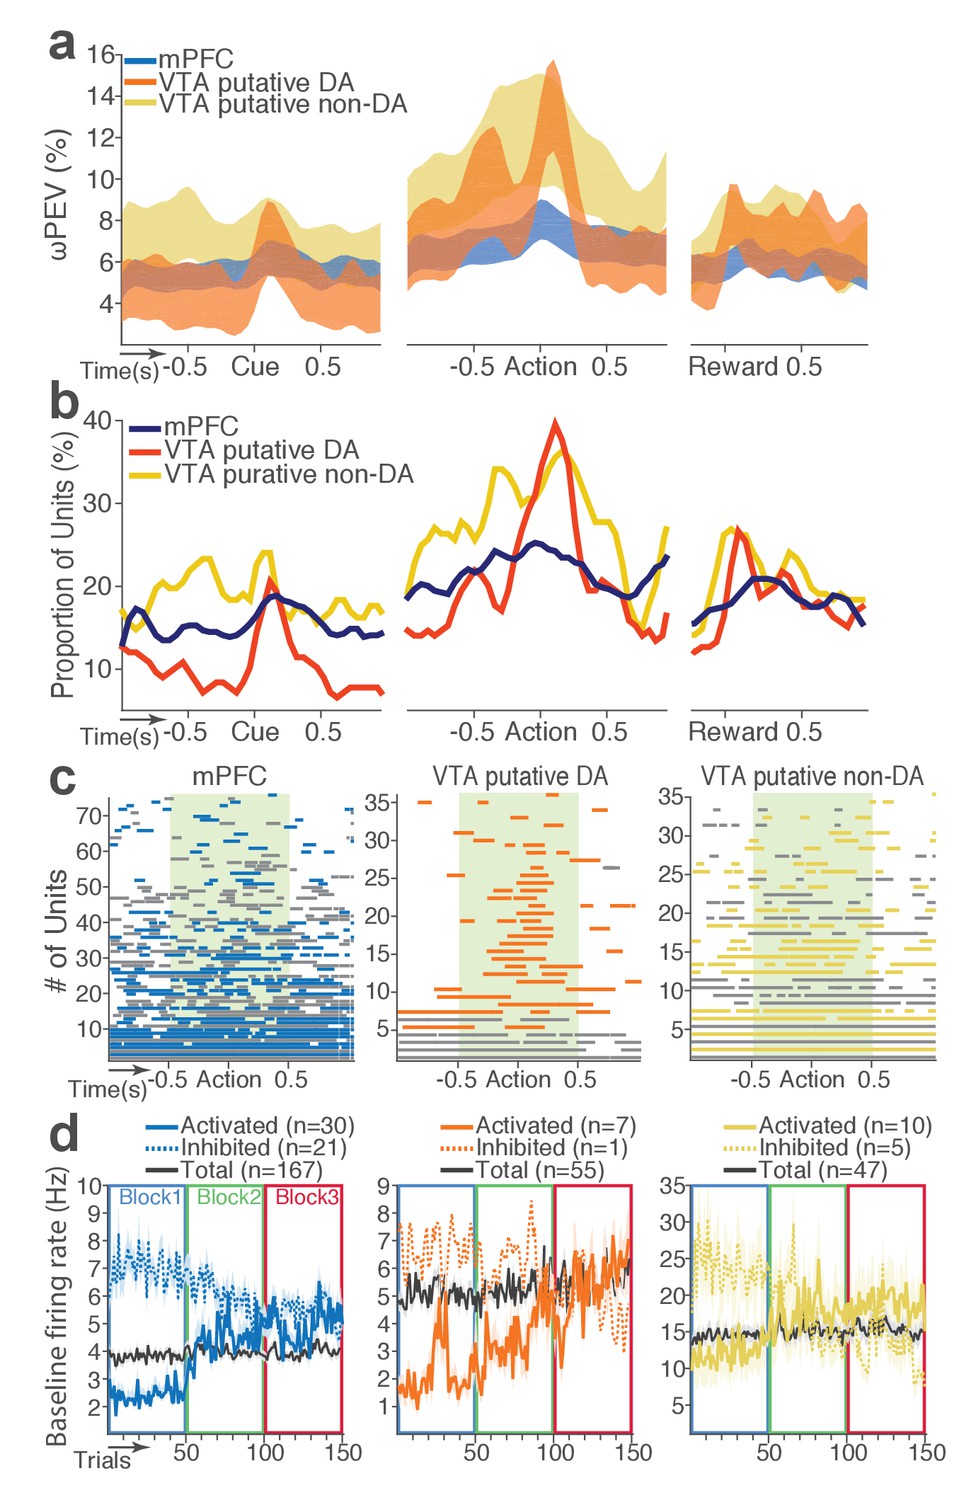
mPFC, VTA putative DA, and non-DA single units encode punishment risk by modulating their peri-event and baseline firing rates.
(a) Shaded areas indicate the mean ±s.e.m. ωPEV averaged across all units in each neuron group across time. (b) Line plots indicate proportions of punishment-encoding units. (c) To reveal time points of punishment encoding, crossing of the global ωPEV band by each unit is marked with a line segment (Materials and methods). Only the units with at least one crossing are included in each plot. Single units with significant change in their baseline firing rate are marked with gray lines (see below). (d) Subpopulations of single units represented punishment with significant excitatory or inhibitory modulation of their baseline (inter-trial interval) activity. The mean ±s.e.m. baseline firing rates are plotted across trials and blocks.
Figure 3—figure supplement 1
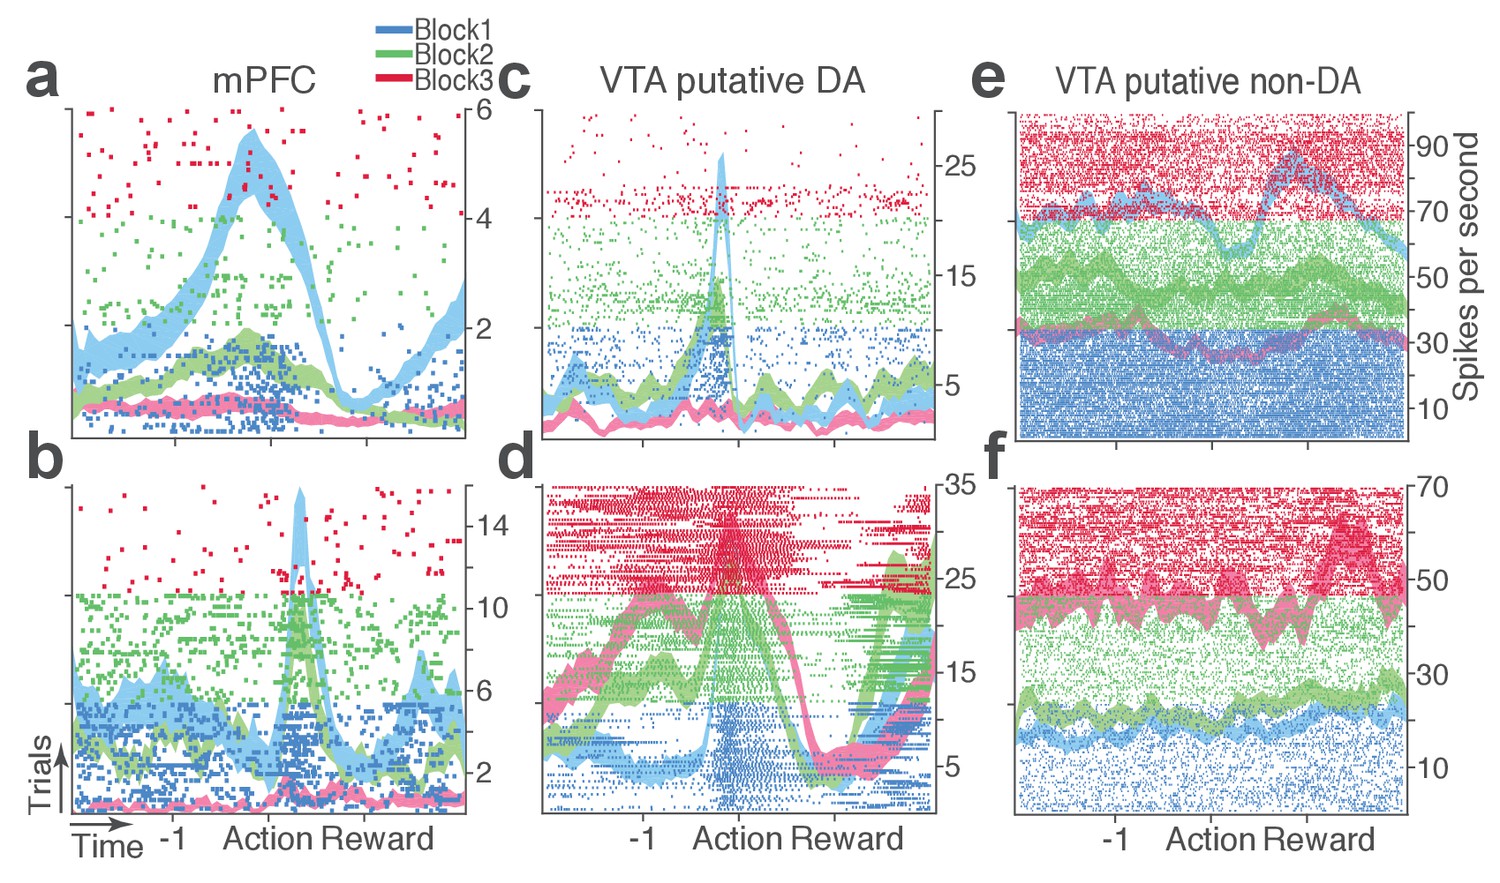
Representative punishment-encoding mPFC (a-b), VTA putative DA (c-d), and non-DA (e-f) single units.
In each plot, data are for 150 trials of action with three different levels of punishment contingency. Each row represents each trial. Ticks mark spike times. The horizontal axis represents time around the action occurring at time = 0. Spike density functions of different blocks are superimposed as mean ±s.e.m. (shaded area).
Figure 4
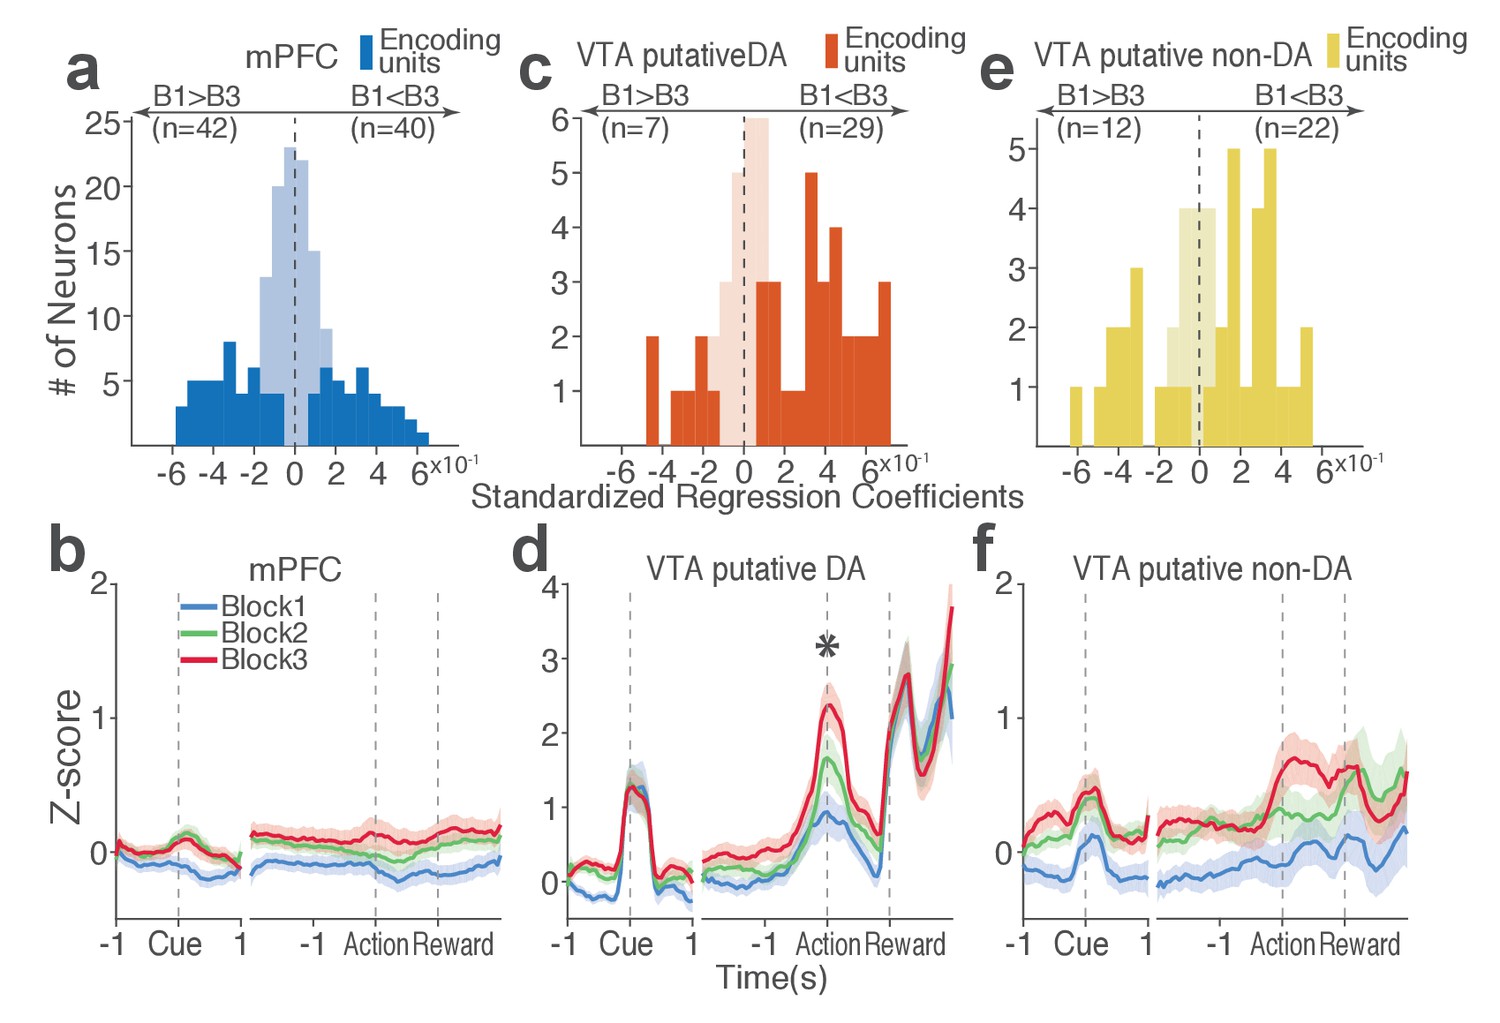
Distinct subpopulations of single units represent punishment risk with excitatory or inhibitory activity modulation.
(a, c, e) Units are distributed horizontally based on modulation of their peri-action activity across blocks as a function of punishment. Standardized regression coefficients (SRC) were computed for a normalized quantification of each unit’s peri-action activity modulation by punishment (Materials and methods). In each distribution, units with excitatory or inhibitory activity modulation are located in the right or left portion of the distribution. Punishment-encoding units are solid-colored, while non-encoding units are pale-colored. (a) Direction of the mPFC neuronal activity modulation. (b) The baseline-normalized activity of the mPFC encoding units per block (mean ±s.e.m.). (c) Direction of the VTA putative DA neuronal activity modulation. (d) The activity of the VTA DA encoding units per block (mean ±s.e.m.). Asterisk indicates a significant effect of block on the peri-action activity (p<0.05). (e) Direction of the VTA putative non-DA neuronal activity modulation. (f) The activity of the VTA non-DA encoding units per block (mean ±s.e.m.).
Figure 5
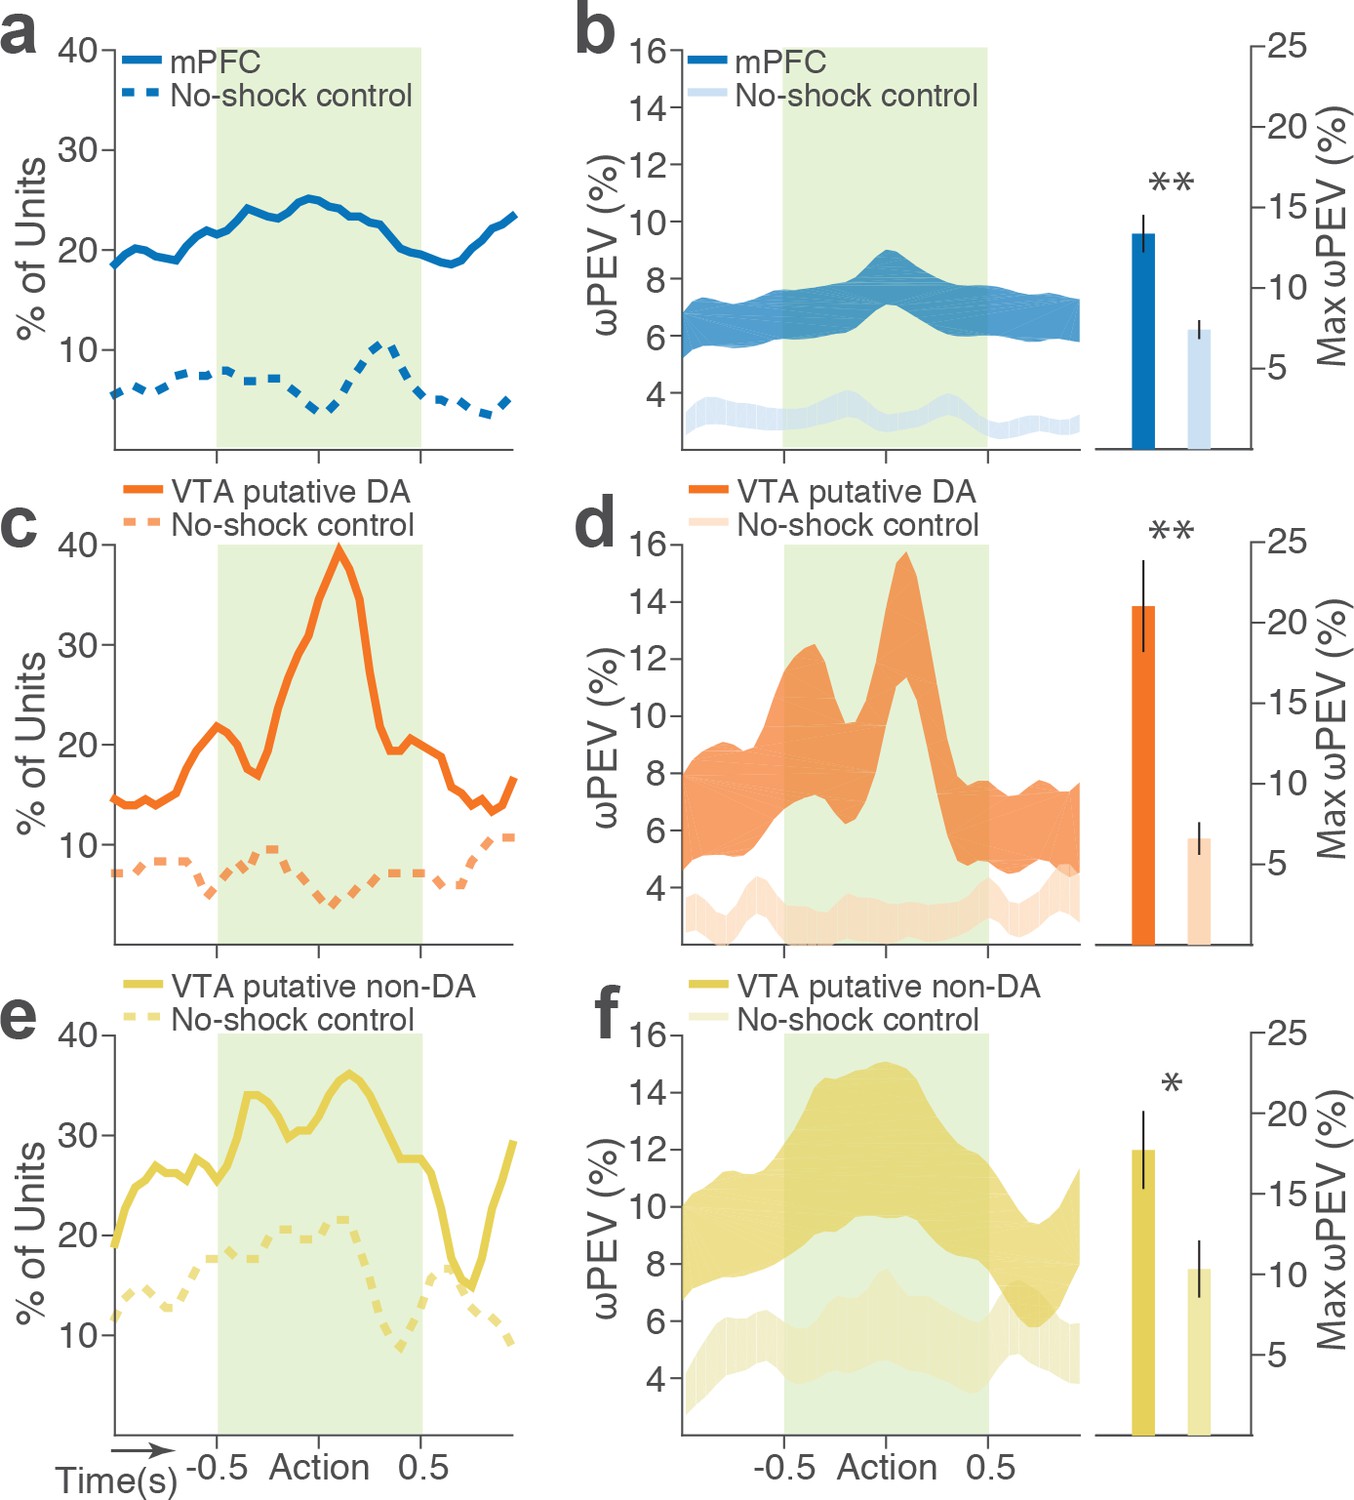
Blockwise firing rate changes in the presence vs absence of punishment risk.
(a) Proportion of mPFC units showing significant firing-rate changes across blocks during the peri-action epoch in the presence vs absence (no-shock control) of punishment. (b) Left, Percent variance in the mPFC unit firing rates explained by the block shift (ωPEV) in the presence vs absence of punishment (mean ±s.e.m.). Right, Maximum peri-action ωPEV of mPFC units differed in the presence vs absence of punishment (Student’s t-test, t291 = 3.81, p<0.001). (c) Proportion of VTA putative DA units showing significant firing-rate changes across blocks. (d) Left, ωPEV of VTA putative DA units. Right, Maximum peri-action ωPEV of VTA putative DA units (t81 = 4.19, p<0.001). (e) Proportion of VTA putative non-DA units showing significant firing-rate changes across blocks. (f) Left, ωPEV of VTA putative non-DA units. Right, Maximum peri-action ωPEV of VTA putative non-DA units (t74 = 2.25, p=0.028). *p<0.05, **p<0.005.
Figure 6 with 2 supplements
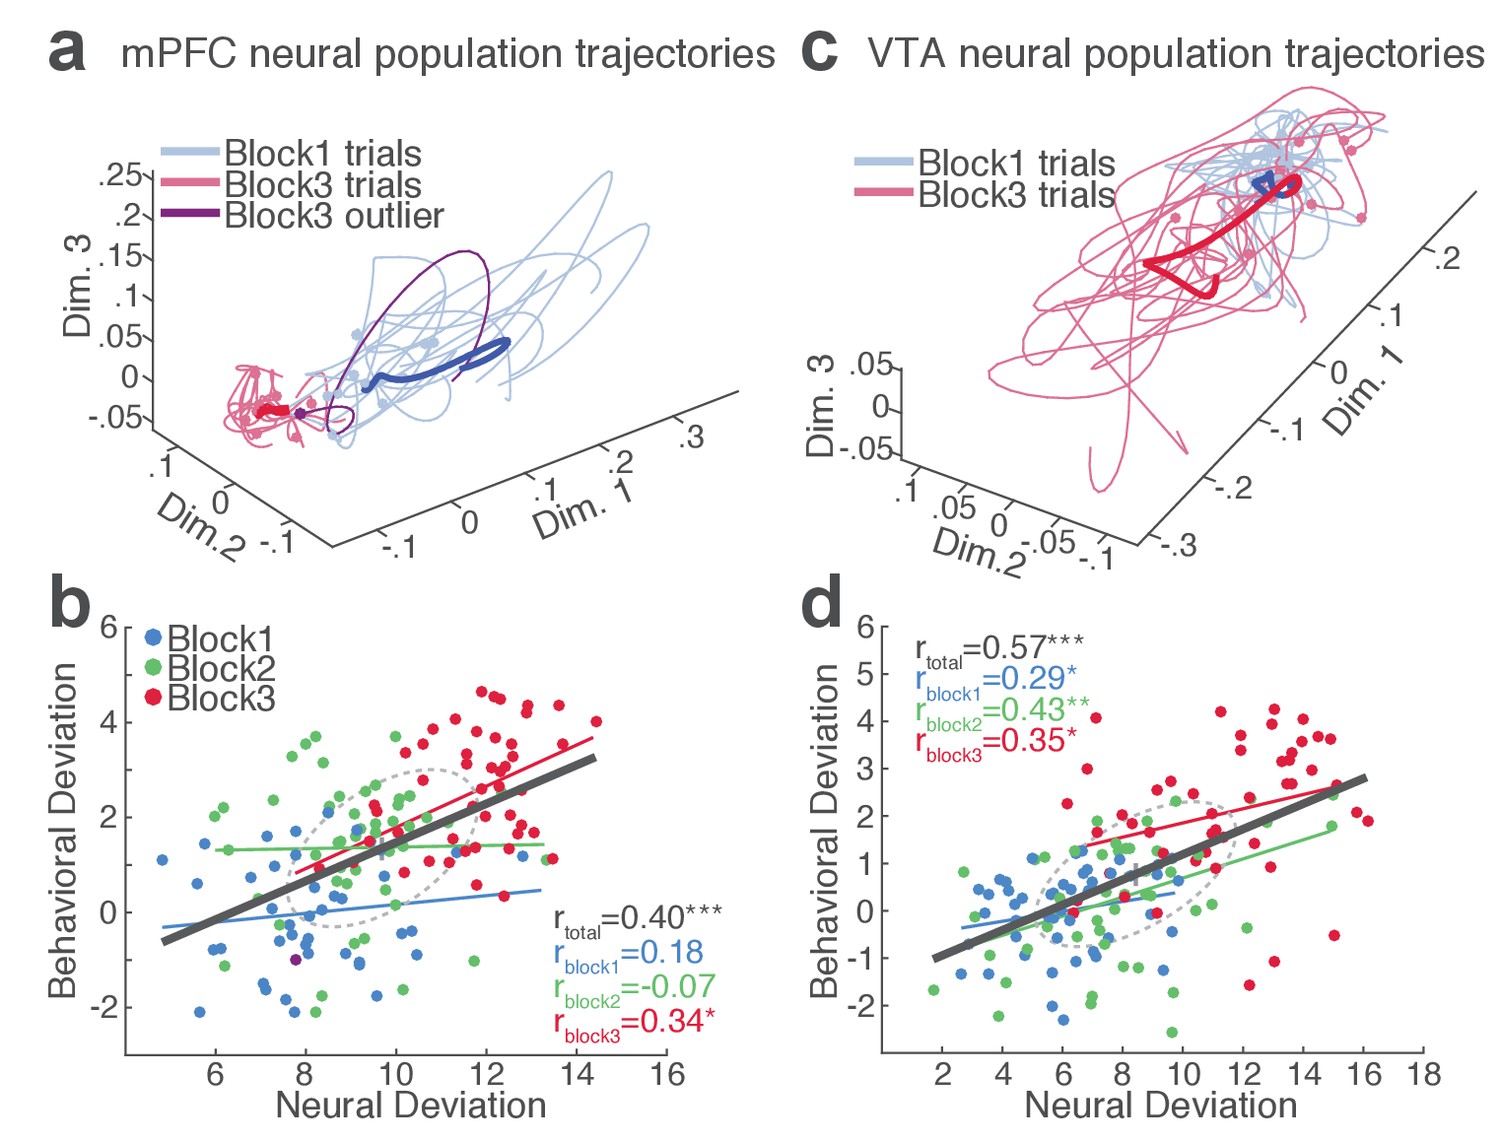
mPFC and VTA neuronal populations track the trial-to-trial variability in RT.
(a) Trial-by-trial trajectories of an mPFC neuronal population (16 units) activity were extracted using the GPFA (Materials and methods). Trajectories of trials in block 1 and 3 are visualized in a population state space comprising the top three ortho-normalized dimensions. For simplicity, ten trials were randomly selected per block. The dimensionality of state space was determined to be five for all populations, based on the cross-validated data likelihood (Materials and methods). Each trajectory corresponds to −0.5 to 0.5 s peri-action epoch (action occurring at time = 0). Filled circles indicate initial points of neural trajectories. Heavy lines indicate the mean trajectory averaged across all trials in each block. The purple-colored block 3 neural trajectory represents a single trial with an outlying RT similar to a block 1 trial. (b) A scatter plot indicating behavioral deviation from the block 1 mean RT and neural deviation from the block 1 mean trajectory of the mPFC population shown in (a). RT was log transformed for proper scaling. Superimposed color-coded lines indicate regression slopes per block. The dark gray line indicates the regression slope for total trials pooled across blocks. The behavioral and neural correlation coefficients calculated on total trials and trials per block are indicated. *p<0.05, **p<0.005. (c) Neural population trajectories of a representative VTA population comprising 10 units. (d) A scatter plot indicating behavioral deviation from the block 1 mean RT vs neural deviation from the block 1 mean trajectory of the VTA population shown in (c).
Figure 6—figure supplement 1
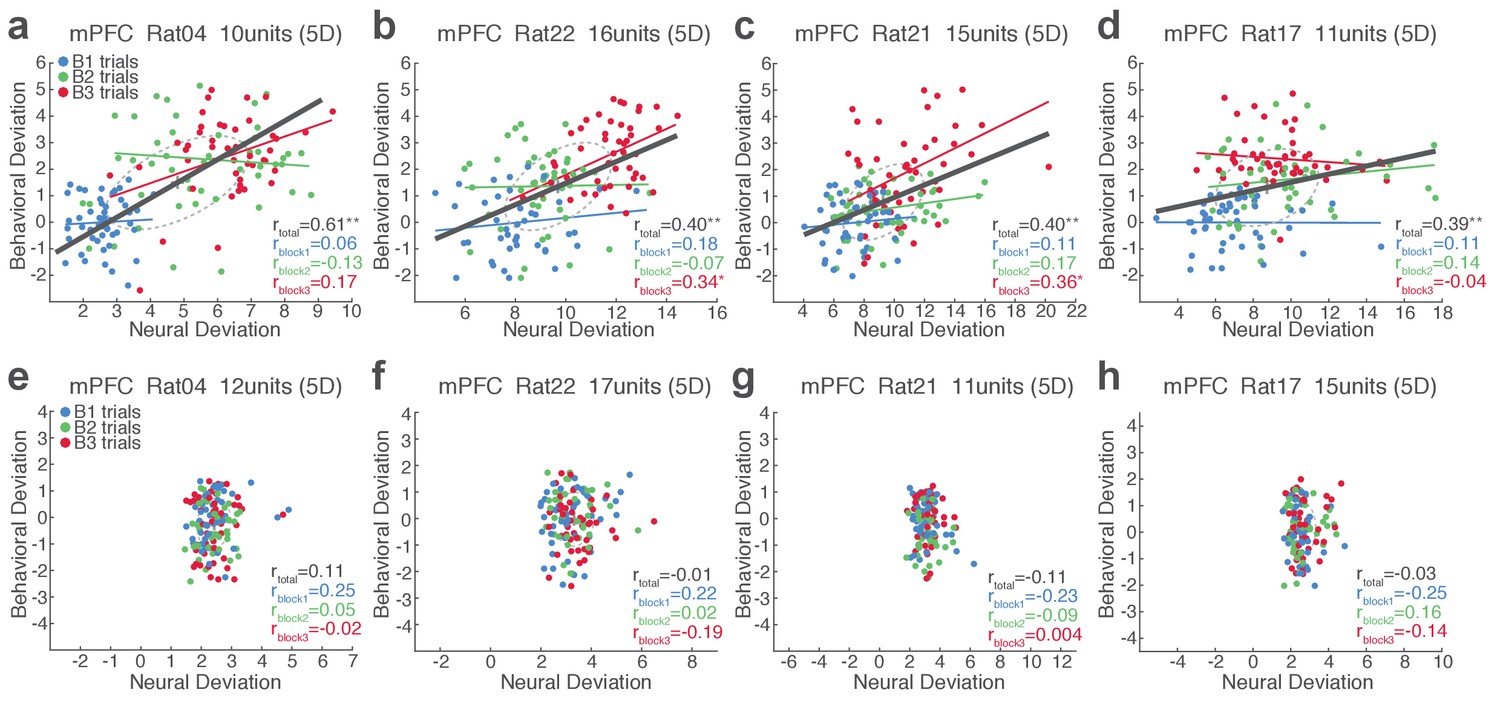
Single-trial analysis of mPFC neuronal population activity reveals the linkage between neural and behavioral variability during risky reward-seeking.
(a-d) Scatter plots represent each animal’s behavioral deviation from the block 1 mean RT vs neural deviation from the block 1 mean neural population trajectory. RT was log transformed for proper scaling. In each plot, the animal’s ID, the number of units comprising the neuronal population, and the state space dimensionality are indicated. Superimposed color-coded lines indicate regression slopes per block. The dark gray line indicates the regression slope for total trials pooled across blocks. The behavioral and neural correlation coefficients calculated on total trials and trials per block are indicated. *p<0.05, **p<0.005. (e-h) Data from no-shock control sessions. Note the lack of behavioral and neural correlation in the absence of risk.
Figure 6—figure supplement 2
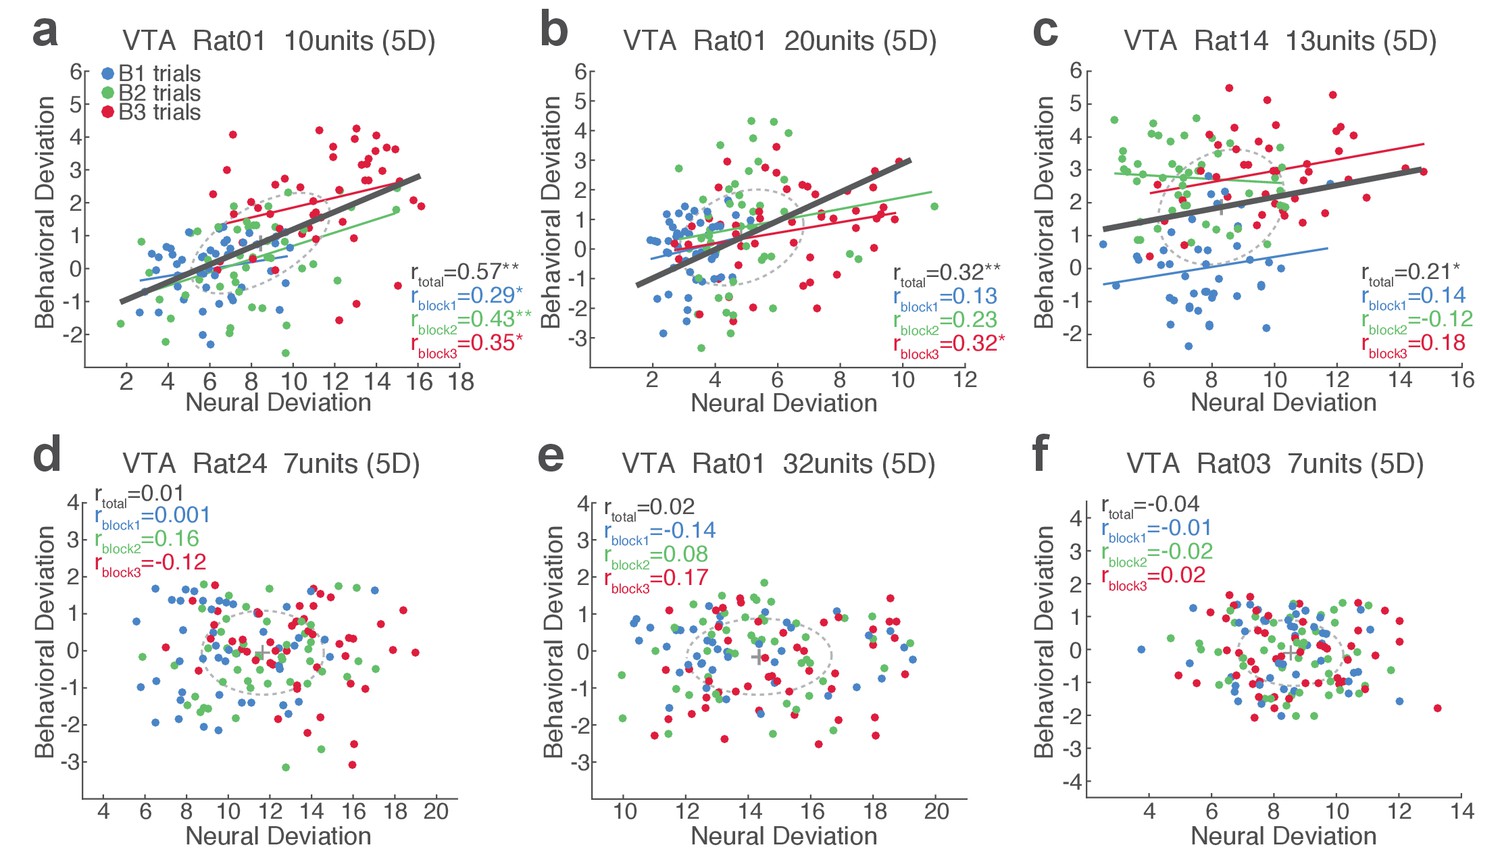
Single-trial analysis of VTA neuronal population activity reveals the linkage between neural and behavioral variability during risky reward-seeking.
(a-c) Scatter plots represent each animal’s behavioral deviation from the block 1 mean RT vs neural deviation from the block 1 mean neural population trajectory. (d-f) Data from no-shock control sessions, indicating the lack of behavioral and neural correlation in the absence of punishment risk.
Figure 7 with 1 supplement
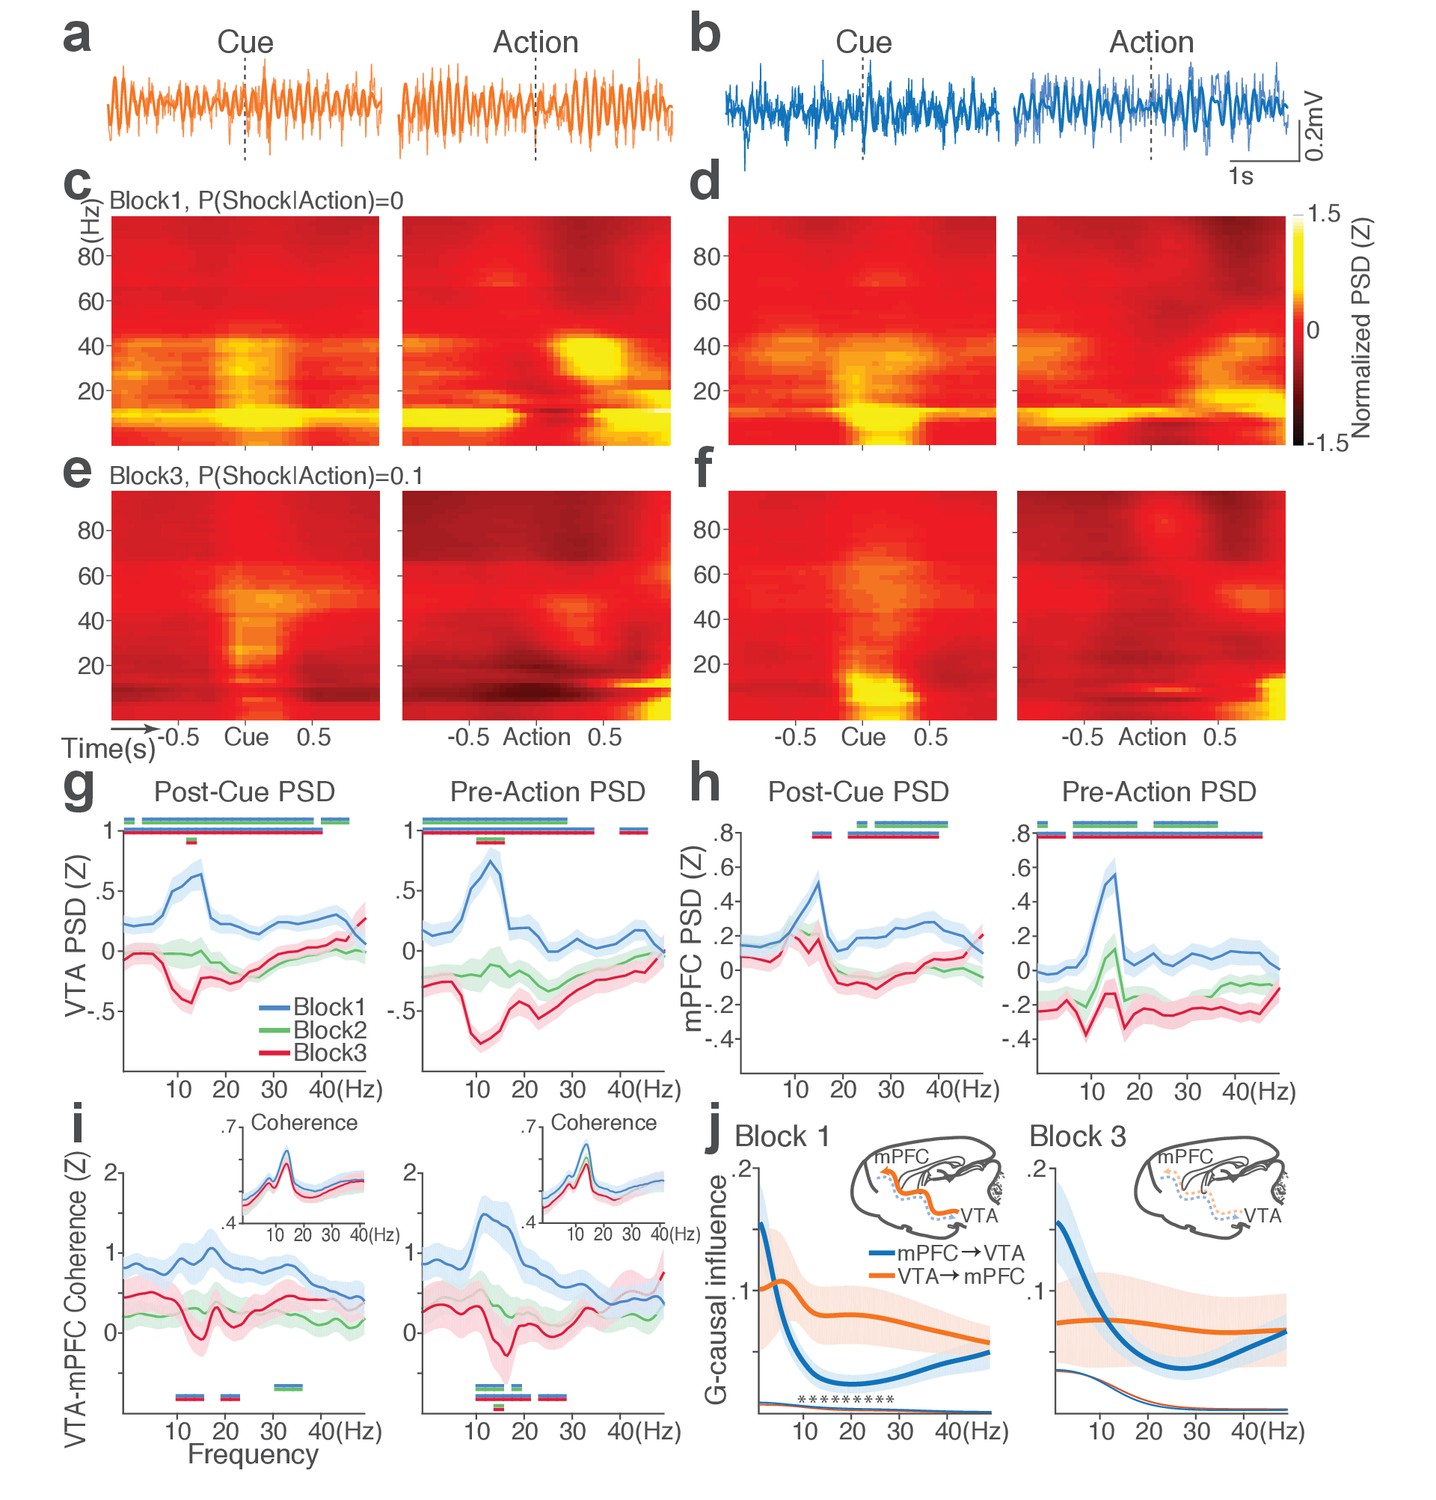
Punishment diminishes theta oscillation-mediated neural synchrony in the VTA-mPFC circuit.
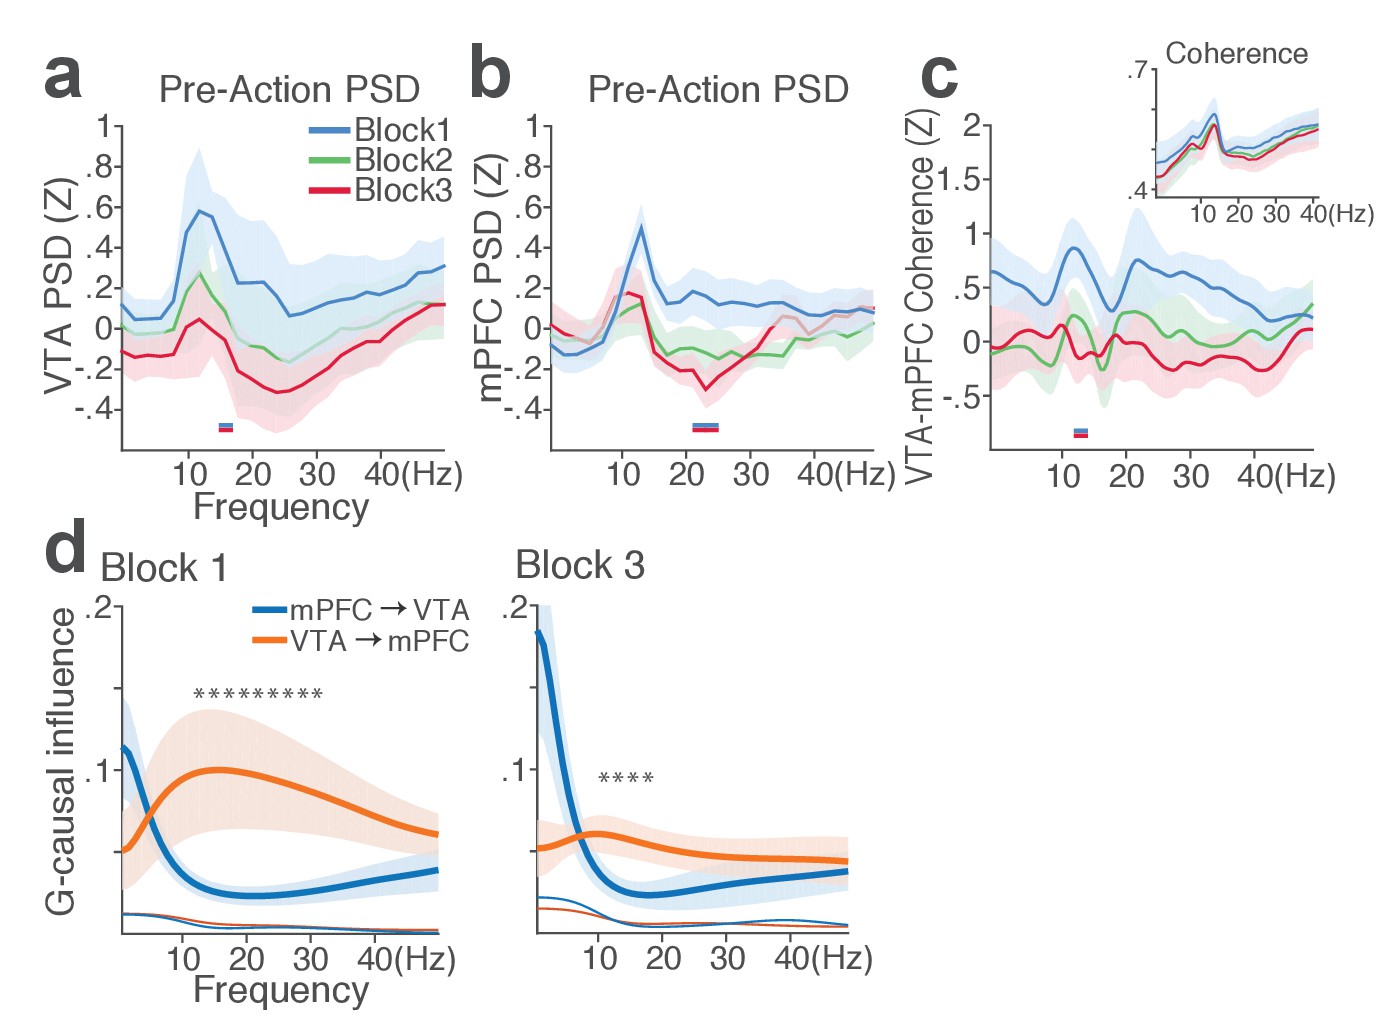
(a) Representative VTA peri-event LFP traces in a block 1 trial. Bandpass filtered LFP signal (heavy line) is superimposed on the raw trace (thin line). (b) Simultaneously recorded mPFC LFP traces. (c) Baseline-normalized VTA power spectrograms averaged across block 1 trials (left: peri-cue, right: pre-action). mPFC block 1 power spectrograms are in (d). (e) Diminished VTA theta power in block 3. (f) Similar diminishment observed in mPFC theta power. (g) Mean ±s.e.m. (shaded area) normalized VTA PSDs per block corresponding to 1 s post-cue (left) and pre-action (right) epochs. Dual-colored bars indicate significant pairwise differences at corresponding frequency bins according to post hoc analyses (p<0.05). (h) Normalized mPFC PSDs in post-cue (left) and pre-action (right) epochs. (i) Normalized VTA-mPFC LFP coherence in post-cue (left) and pre-action (right) epochs. Insets represent non-normalized LFP coherences of each block. (j) Granger-causality, representing mutual influences (directionality) between VTA and mPFC peri-action LFP time series in block 1 (left) and block 3 (right). Blue and orange curves represent mPFC-to-VTA and VTA-to-mPFC Granger-causal influences, respectively. Shaded areas indicate s.e.m. Thin colored-lines below indicate upper bounds of confidence intervals (α = 0.001) acquired by the random permutation resampling of time bins. Asterisk indicates significant difference between bidirectional Granger-causal influences at the corresponding frequency bin (p<0.05).
Figure 7—figure supplement 1
mPFC and VTA theta oscillations did not change across blocks in the absence of punishment.
(a) Mean ±s.e.m. (shaded area) normalized VTA PSDs of each block corresponding to 1 s pre-action epoch. Dual-colored bars below indicate significant pairwise differences at corresponding frequency bins according to post hoc analyses (p<0.05). (b) Normalized mPFC PSDs. (c) Normalized VTA-mPFC LFP coherence of each block in the pre-action epoch. Insets represent non-normalized LFP coherences. (d) Granger-causality, representing mutual influences (directionality) between VTA and mPFC peri-action LFP time series in block 1 (left) and 3 (right). Blue and orange curves represent mPFC-to-VTA and VTA-to-mPFC Granger-causal influences, respectively. Shaded areas indicate s.e.m. Thin colored-lines below indicate upper bounds of confidence intervals (α = 0.001) acquired by the random permutation resampling of time bins. An asterisk indicates significant difference between bidirectional Granger-causal influences at the corresponding frequency bin (p<0.05).
Figure 8
Punishment risk reduces VTA and mPFC neuronal synchrony to local theta oscillation.
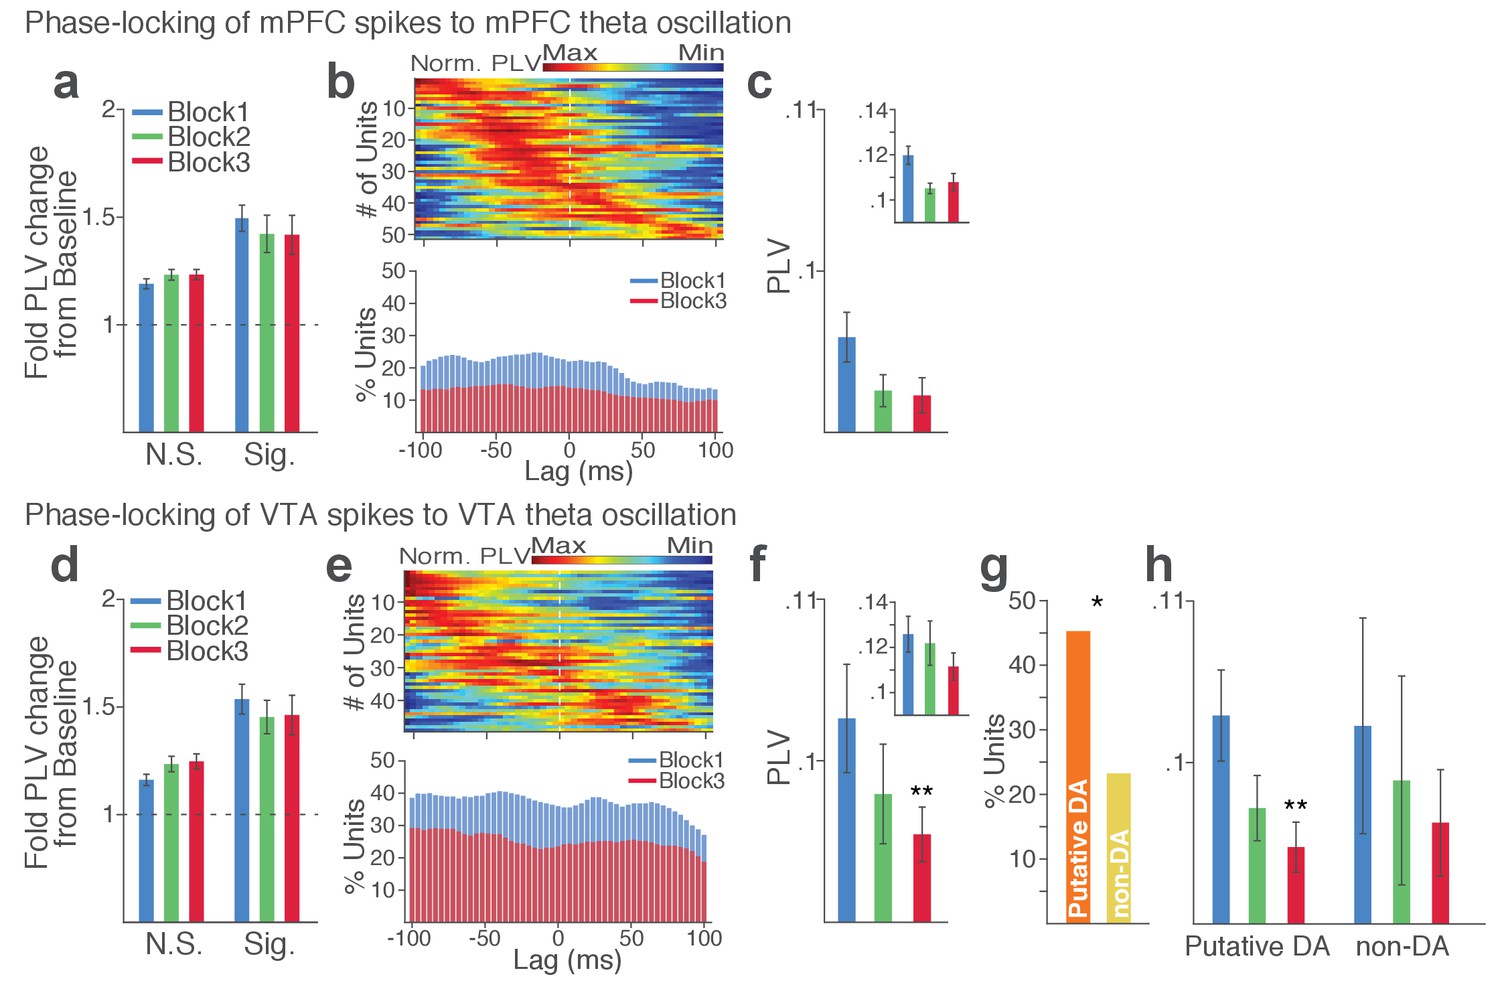
(a-c) Modulation of mPFC neuronal synchrony to mPFC theta oscillation. Phase-locking values (PLVs) were quantified by averaging 1000 mean resultant lengths (MRLs) of the circular phase angle distribution comprising 100 resampled spikes per iteration (Materials and methods). (a) Fold change from baseline in the strength of the neuronal phase-locking during peri-action epoch in units that passed Rayleigh z-test (Sig.) and rest of the units (N.S.). (b) Top, Normalized PLVs in block 1 across a range of time lags for all phase-locked mPFC units, aligned by peak lags. Bottom, Percentage of significantly phase-locked mPFC units in block 1 vs 3 across a range of lags. (c) Mean ±s.e.m. PLVs across different blocks. Inset, PLVs including significantly phase-locked units only. (d-h) Modulation of VTA neuronal synchrony to VTA theta oscillation. (d) Fold change from baseline in the strength of the neuronal phase-locking. (e) Top, Normalized PLVs in block 1 of all phase-locked VTA units. Bottom, Percentage of significantly phase-locked VTA units. (f) Mean ±s.e.m. PLVs across different blocks. (g) Percentage of phase-locked VTA putative DA and non-DA units. (h) PLVs of VTA putative DA and non-DA units plotted separately.
Figure 9 with 3 supplements
Punishment risk reduces mPFC neuronal synchrony to the VTA theta oscillation.
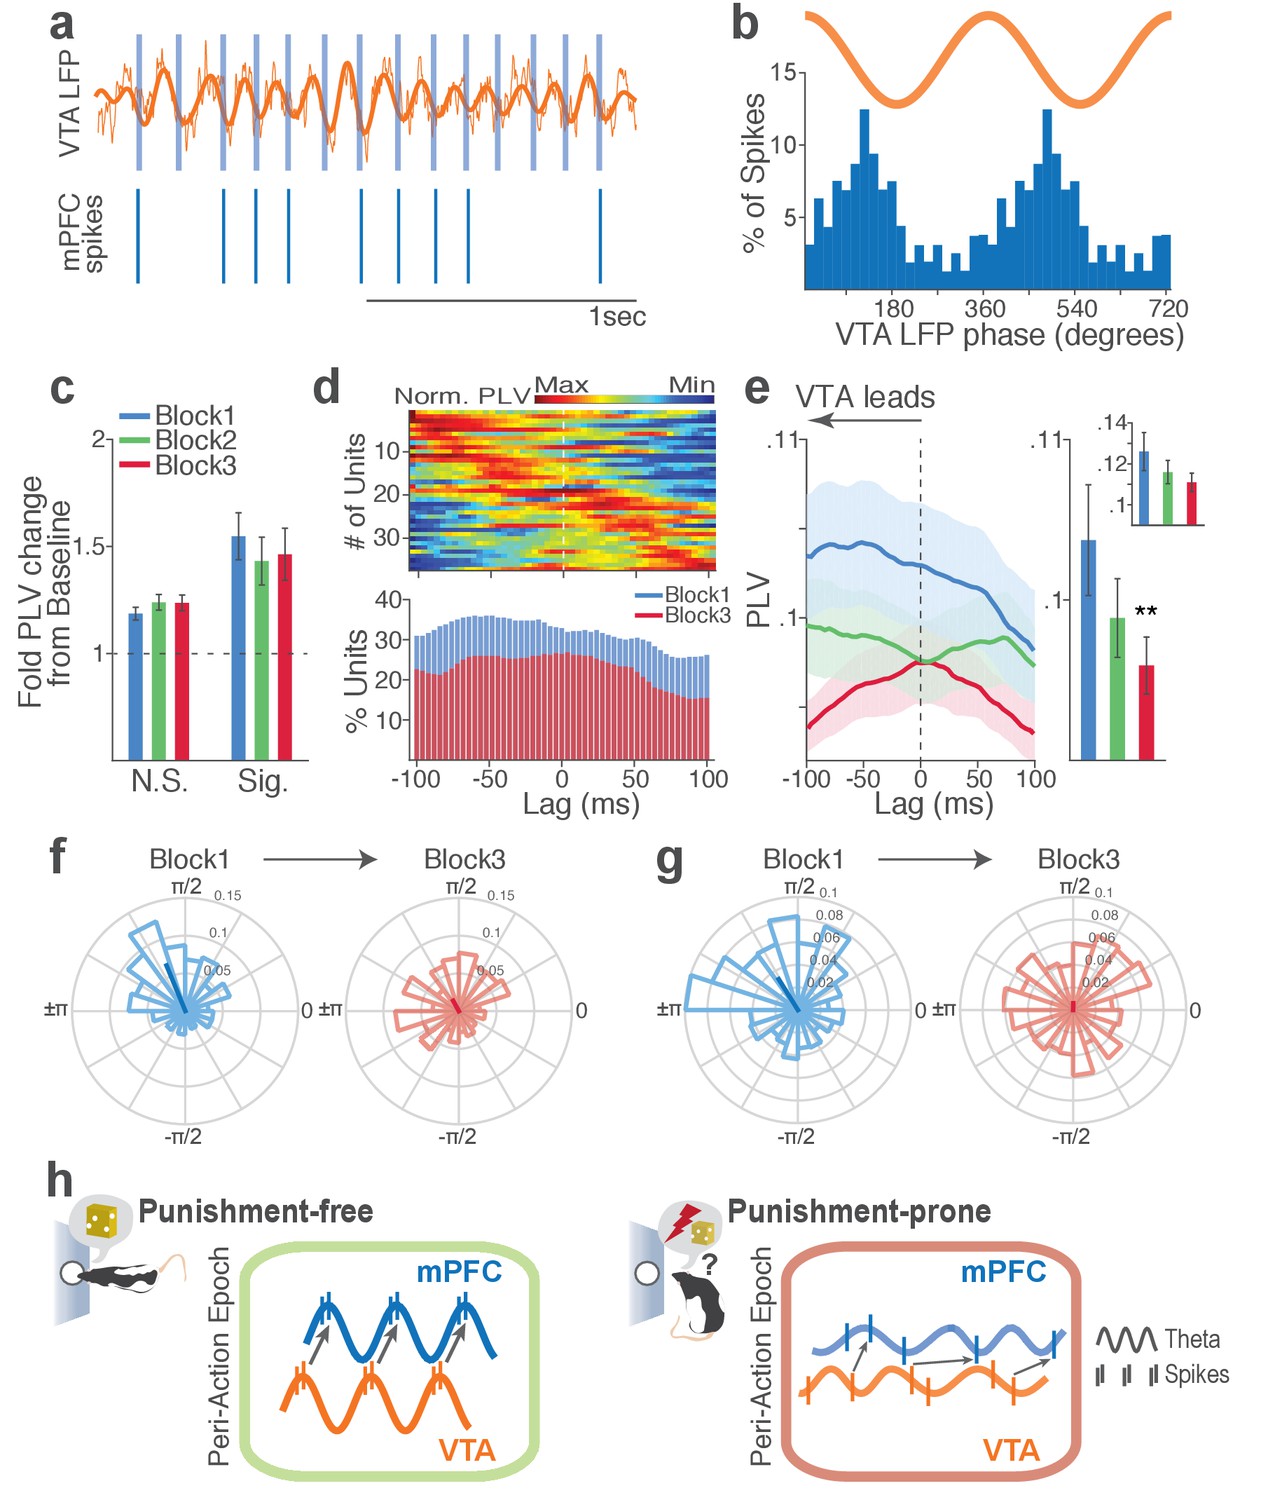
(a) Top, Example raw (thin line) and bandpass filtered (heavy line) VTA LFP traces. Bottom, Neuronal spikes of a simultaneously recorded mPFC single unit. This unit’s preferred phase is indicated with light blue columns superimposed on the LFP trace. (b) Distribution of spike phase angles of the example mPFC unit relative to the VTA theta oscillation (Rayleigh’s p<0.001). (c) Fold change from baseline in the strength of mPFC neuronal phase-locking (PLV) during the peri-action epoch in units that passed Rayleigh z-test (Sig.) and rest of the units (N.S.). (d) Top, Normalized PLVs in block 1 across a range of time lags for all phase-locked mPFC units, aligned by peak lags. Bottom, Percentage of significantly phase-locked units in block 1 vs 3 (e) Left, PLVs calculated with negative and positive time lags applied to spike trains relative to LFP time series. Right, Mean ±s.e.m. PLVs of all units across different blocks. Inset, PLVs including significantly phase-locked units only. (f-g) Each polar plot represents the distribution of spike-phase angles of an example mPFC unit relative to VTA theta oscillation in block 1 vs 3. To quantify the circular concentration of phase angles, we calculated the mean resultant vector indicated as a superimposed bar on each polar plot. (h) At the neural circuit level, the theta-oscillation-mediated neural synchrony in the VTA-mPFC circuit that emerged during punishment-free actions declined during punishment-prone actions. Neural synchrony mediated by the theta oscillation may subserve binding of the VTA-mPFC neurons responding to the appetitive action into the ‘appetitive’ neural network. Our observation of decline in theta-mediated neural synchrony may reflect reduced activation of the appetitive neural network in the presence of punishment risk.
Figure 9—figure supplement 1
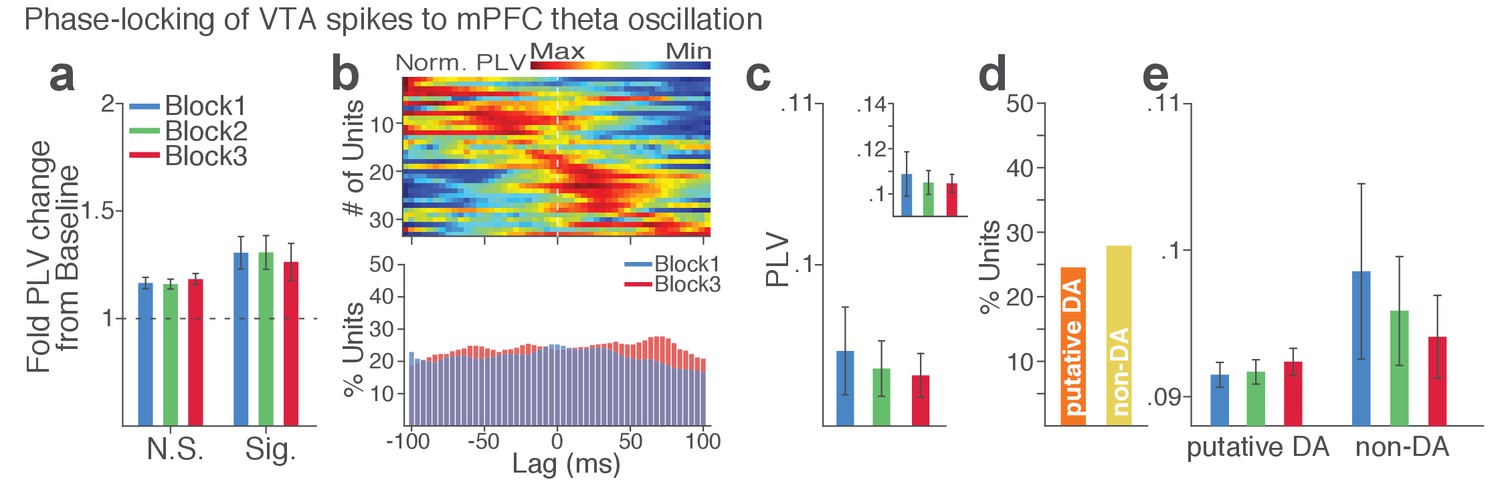
VTA single units show weak phase synchrony to the mPFC theta oscillation.
(a) Fold change from baseline in the strength of the neuronal phase-locking. (b) Top, Normalized PLVs in block 1 for all phase-locked VTA units. The phase-locked units displayed their peak PLVs with negative or positive time lags, indicating weak phase modulation of VTA spike activity by the mPFC theta oscillation (Signed-rank test, p=0.129). Bottom, Percentage of significantly phase-locked VTA units did not differ across blocks. (c) Mean ±s.e.m. PLVs across different blocks. No significant change was found across blocks (Signed-rank test, p values > 0.33). (d) Percentage of phase-locked VTA putative DA vs non-DA units. (e) PLVs of VTA putative DA and non-DA units plotted separately. PLVs did not differ across blocks in both VTA cell types (Signed-rank test, p values > 0.25).
Figure 9—figure supplement 2

mPFC neuronal synchrony to mPFC and VTA theta oscillations did not change across blocks in the absence of punishment (No-shock control).
(a-c) mPFC neuronal phase-locking to mPFC theta oscillation. (a) Fold change from baseline in the strength of the neuronal phase-locking during peri-action epoch in units that passed Rayleigh z-test (Sig.) and rest of the units (N.S.). (b) Top, Normalized PLVs in block 1 across a range of time lags for all phase-locked mPFC units, aligned by peak lags. Bottom, Percentage of significantly phase-locked mPFC units in block 1 vs 3 across a range of lags. (c) Mean ±s.e.m. PLVs across different blocks. Inset, PLVs including significantly phase-locked units only. The PLVs did not significantly differ across blocks (Signed-rank test, p values > 0.105). (d-f) mPFC neuronal phase-locking to the VTA theta oscillation. The PLVs did not significantly differ across blocks (Signed-rank test, p values > 0.392).
Figure 9—figure supplement 3
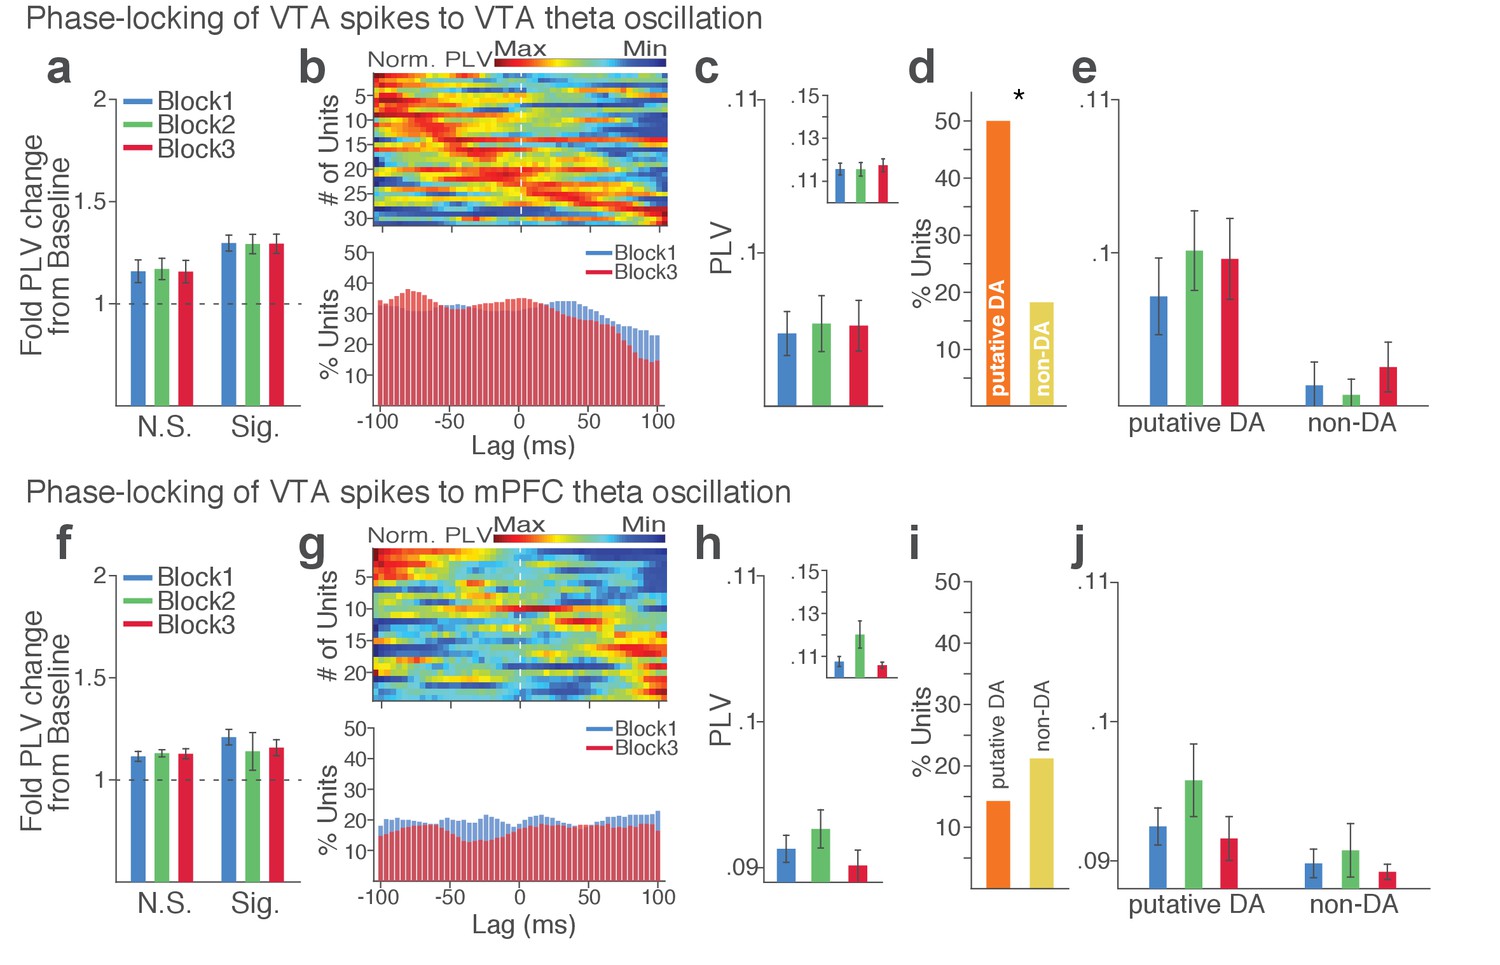
VTA neuronal synchrony to VTA and mPFC theta oscillations did not change across blocks in the absence of punishment (No-shock control).
(a-e) VTA neuronal phase-locking to the VTA theta oscillation. (a) Fold change from baseline in the strength of the neuronal phase-locking during peri-action epoch in units that passed Rayleigh z-test (Sig.) and rest of the units (N.S.). (b) Top, Normalized PLVs in block 1 across a range of time lags for all phase-locked VTA units, aligned by s. Bottom, Percentage of significantly phase-locked VTA units in block 1 vs 3 across a range of lags. (c) Mean ±s.e.m. PLVs across different blocks. The PLVs did not significantly differ across blocks (Signed-rank test, p values > 0.743). Inset, PLVs including significantly phase-locked units only. (d) Percentage of phase-locked VTA putative DA and non-DA units. Greater fraction of putative DA units (50%) appeared to be phase-locked to the VTA theta oscillation compared with non-DA units (18%) (Chi-square test, χ21 = 6.959, p=0.008). (e) PLVs of VTA putative DA and non-DA units plotted separately. (f-j) VTA neuronal phase-locking to the mPFC theta oscillation. The VTA neuronal phase-locking to the mPFC theta oscillation appeared to be weak, and did not differ across blocks (Signed-rank test, p values > 0.355).
Author response image 1
Videos
Video 1
Example task performance (three trials) in the absence of punishment risk (block 1).
Task events are captioned.
Video 2
Example task performance (one trial) in the presence of punishment risk (block 3).
Task events are captioned.
Additional files
-
Transparent reporting form
- https://doi.org/10.7554/eLife.30056.024
Download links
A two-part list of links to download the article, or parts of the article, in various formats.
Downloads (link to download the article as PDF)
Open citations (links to open the citations from this article in various online reference manager services)
Cite this article (links to download the citations from this article in formats compatible with various reference manager tools)
Risk of punishment influences discrete and coordinated encoding of reward-guided actions by prefrontal cortex and VTA neurons
eLife 6:e30056.
https://doi.org/10.7554/eLife.30056


