daf-16/FoxO promotes gluconeogenesis and trehalose synthesis during starvation to support survival
- Duke University, United States
Figures
Figure 1 with 2 supplements
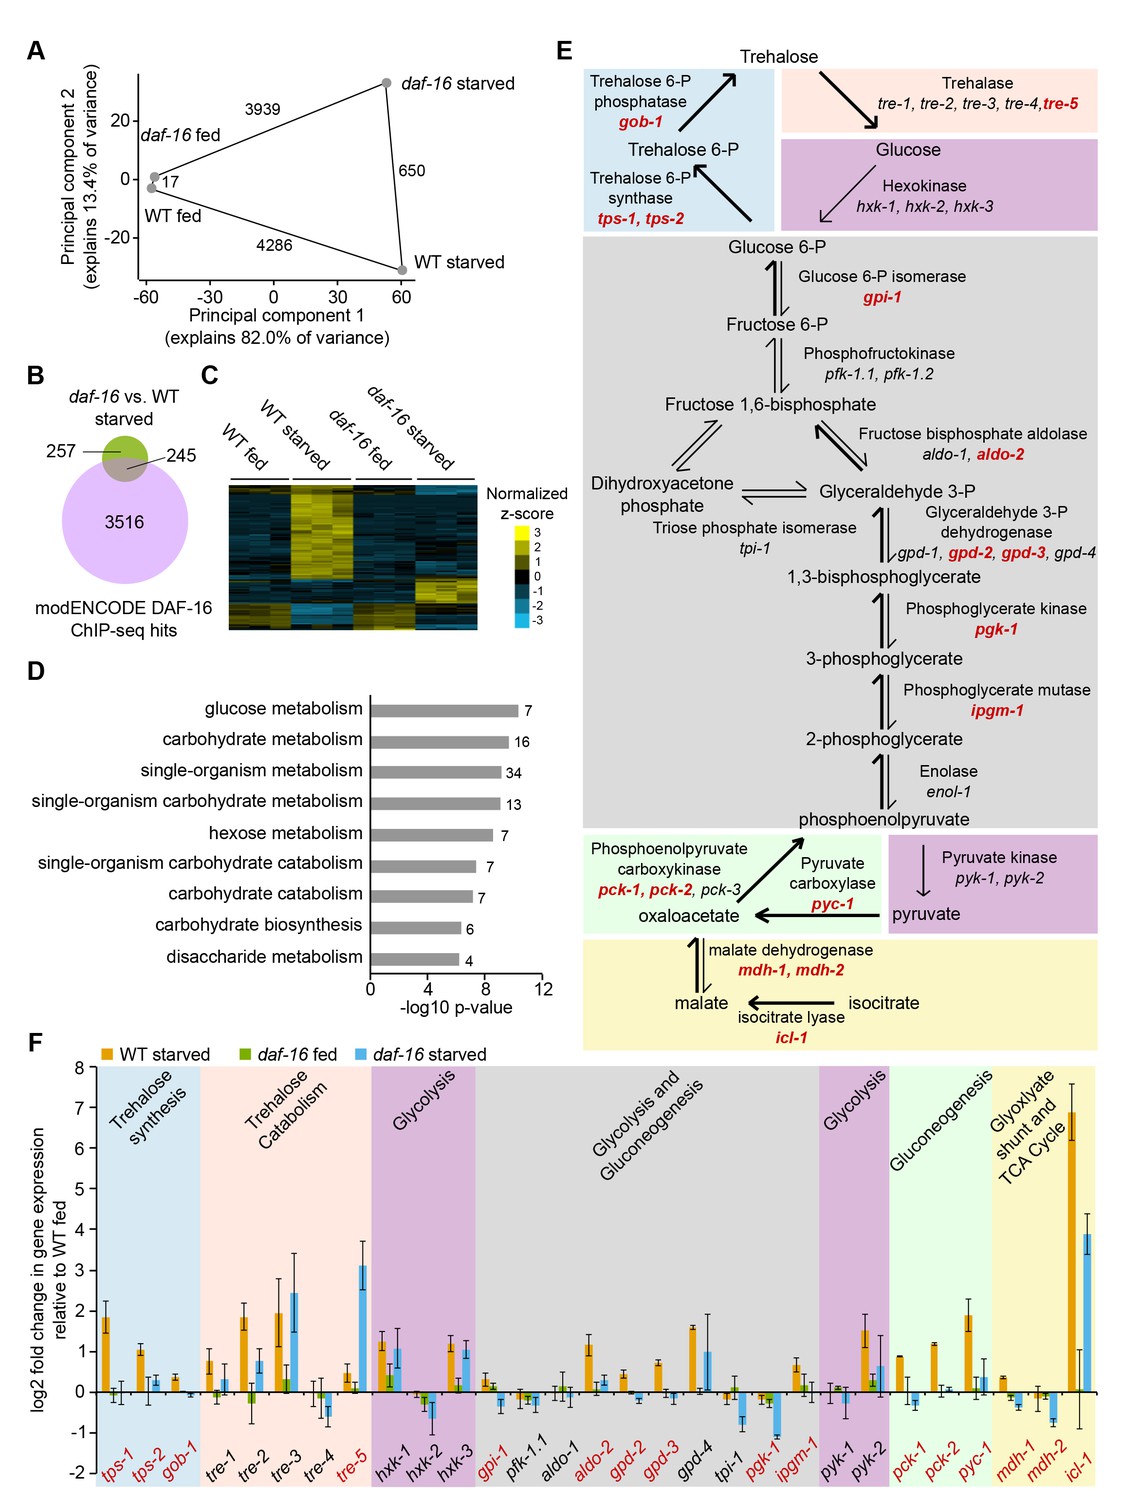
daf-16/FoxO regulates expression of carbohydrate metabolism genes in response to starvation.
(A) Principal component analysis (PCA) of 5177 genes differentially expressed in any of four pairwise comparisons or with a significant interaction between genotype and condition (FDR < 0.05). The number of differentially expressed genes in each pairwise comparison is shown along the line connecting conditions. Mean expression values from three independent biological replicates were used. (B) Overlap of genes differentially expressed during starvation in daf-16 mutants compared to wild-type (WT) and targets of DAF-16 binding from modEncode ChIP-seq data (annotated in Tepper et al., 2013). (C) Genes with a significant interaction between genotype and condition (FDR<0.05, n=103) were hierarchically clustered. Genes along the y-axis are colored in each condition based on their z-score and normalized to the average across all conditions. (D) Gene Ontology (GO) terms enriched among 103 genes that display a significant interaction between genotype and condition (FDR<0.05) are plotted by −log10 p-value. The number of genes for each GO term is listed to the right of each bar. (E) A schematic representation of carbohydrate metabolism based on McElwee et al. (2006). Differentially expressed genes in daf-16 compared to WT during starvation are in red (adjusted FDR < 0.05). (F) Log2 gene expression relative to fed WT is plotted for genes depicted in D, with the exception of pfk-1.2, gpd-1, enol-1, and pck-3, each of which did not have consistently detectable expression levels. Means and SDs of three biological replicates are shown.
-
Figure 1—source code 1
Code used for analysis of microarray experiment.
- https://doi.org/10.7554/eLife.30057.006
-
Figure 1—source data 1
Data compiled from microarray analysis of fed and starved WT and daf-16 mutant worms.
- https://doi.org/10.7554/eLife.30057.007
Figure 1—figure supplement 1
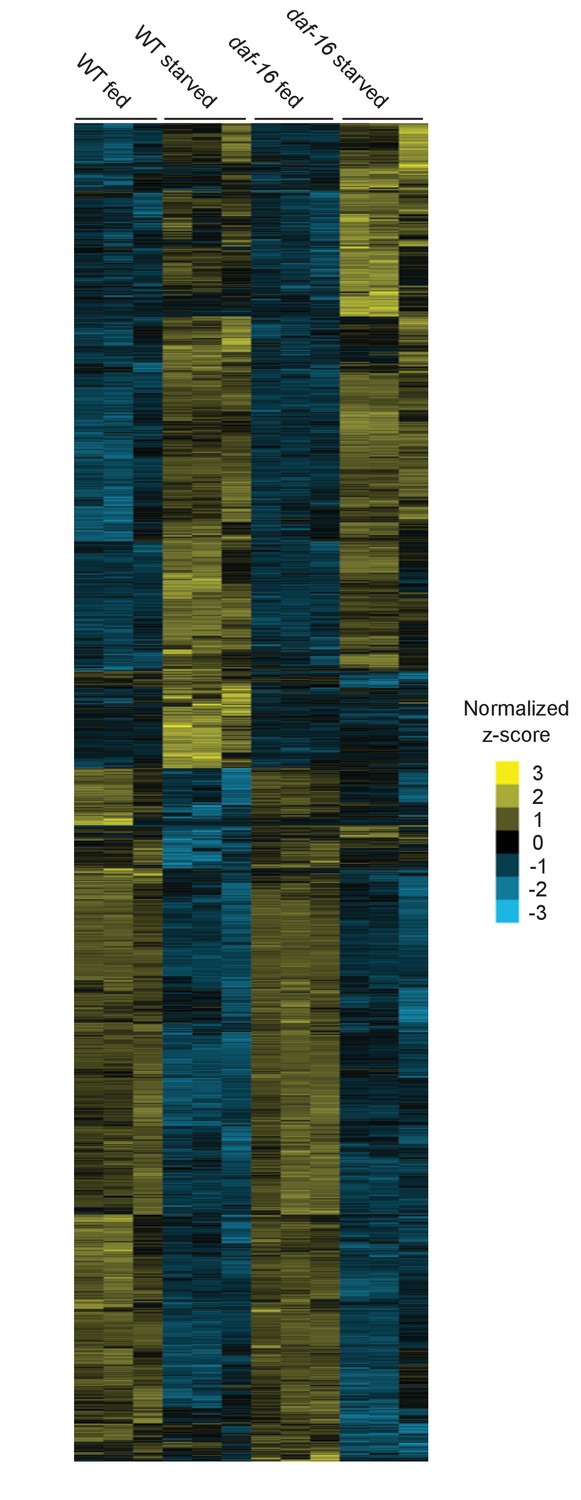
Gene expression of fed and starved WT and daf-16 larvae.
5177 genes with significant differences in expression between any condition are depicted on the y-axis. Yellow indicates an increase in expression and blue indicates a decrease in expression based on z-score, normalized to the average across all conditions.
Figure 1—figure supplement 2
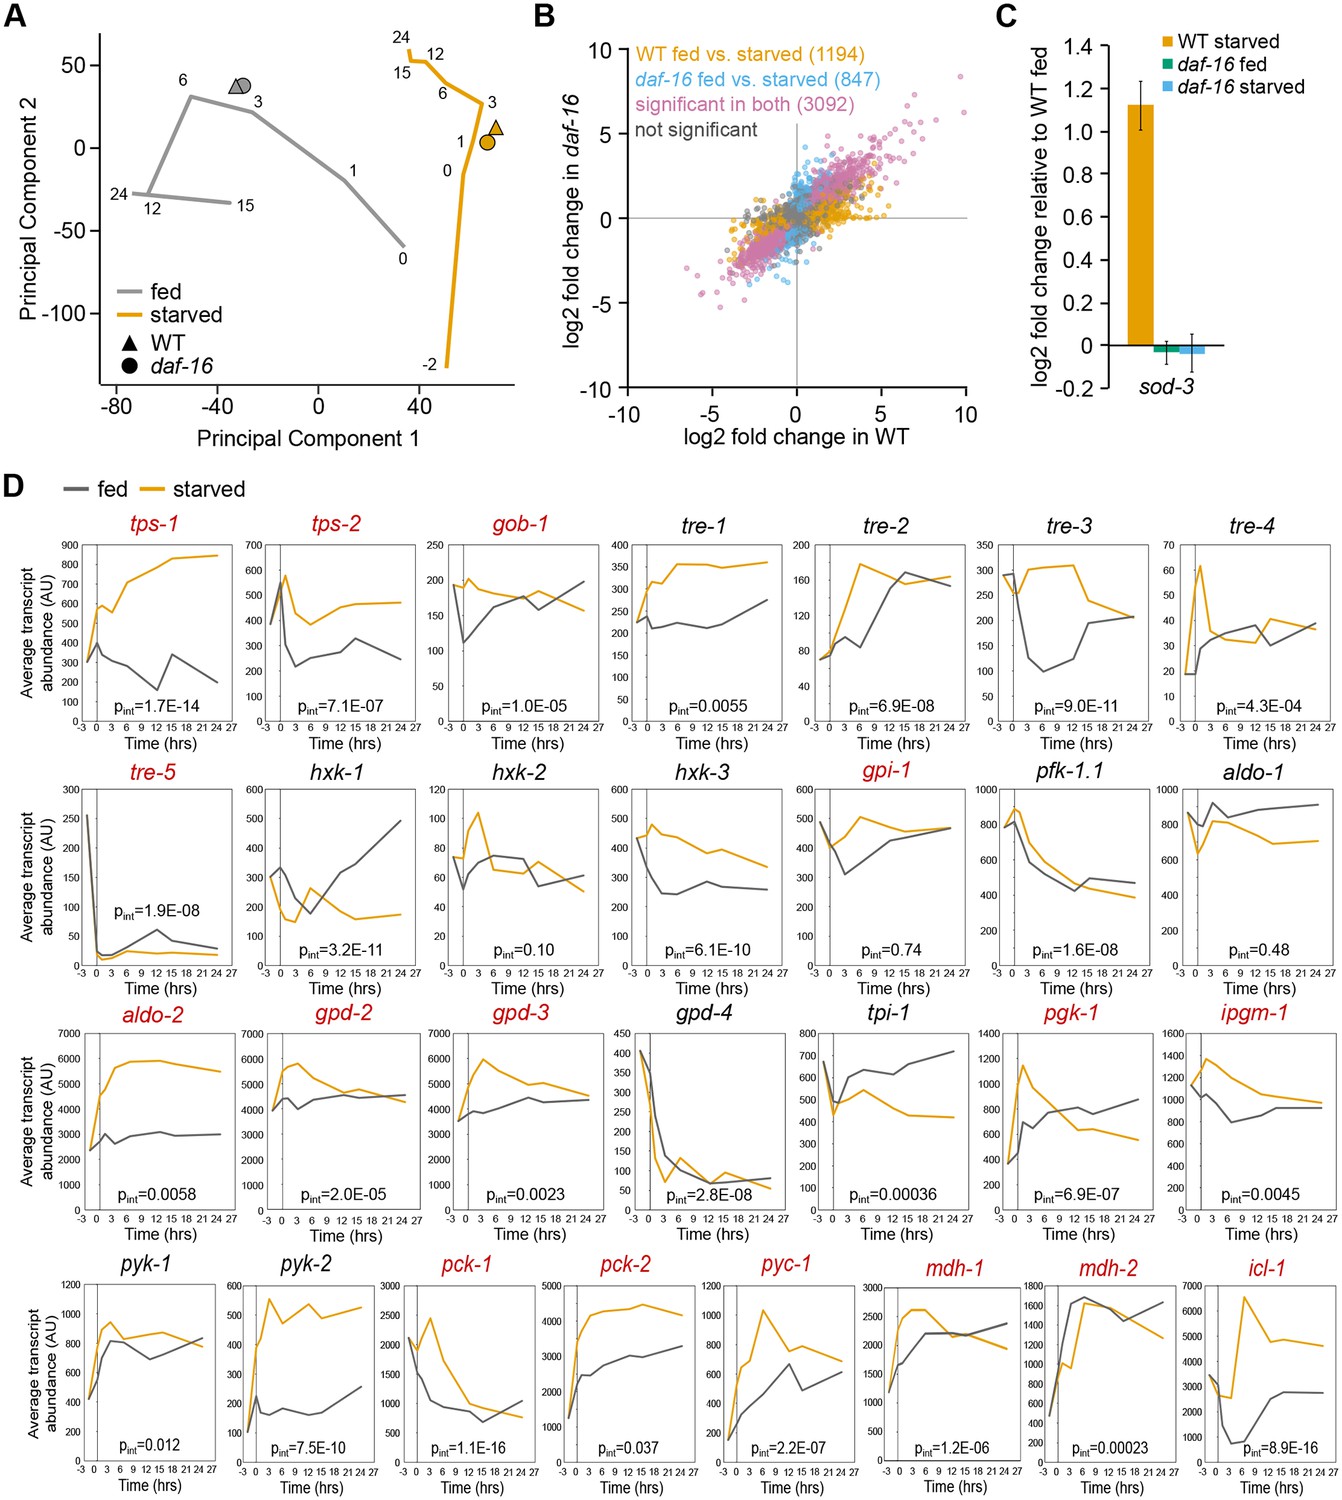
Gene expression analysis of fed and starved larvae.
(A) PCA clusters the expression data reported here near the 3-hr time points of fed and starved larvae from a previously published dataset with emphasis on temporal resolution (Baugh et al., 2009). (B) Log2 fold-change of sod-3 relative to fed WT worms is plotted. (C) Time course expression data of metabolism genes included in Figure 1F is shown. Data were mined from a pre-existing data set (Baugh et al., 2009). Average expression is depicted at each time point. For each gene, the two-way ANOVA interaction p-value for condition x time is shown. Genes with significantly different expression between WT and daf-16 (Figure 1) are noted in red.
Figure 2 with 1 supplement
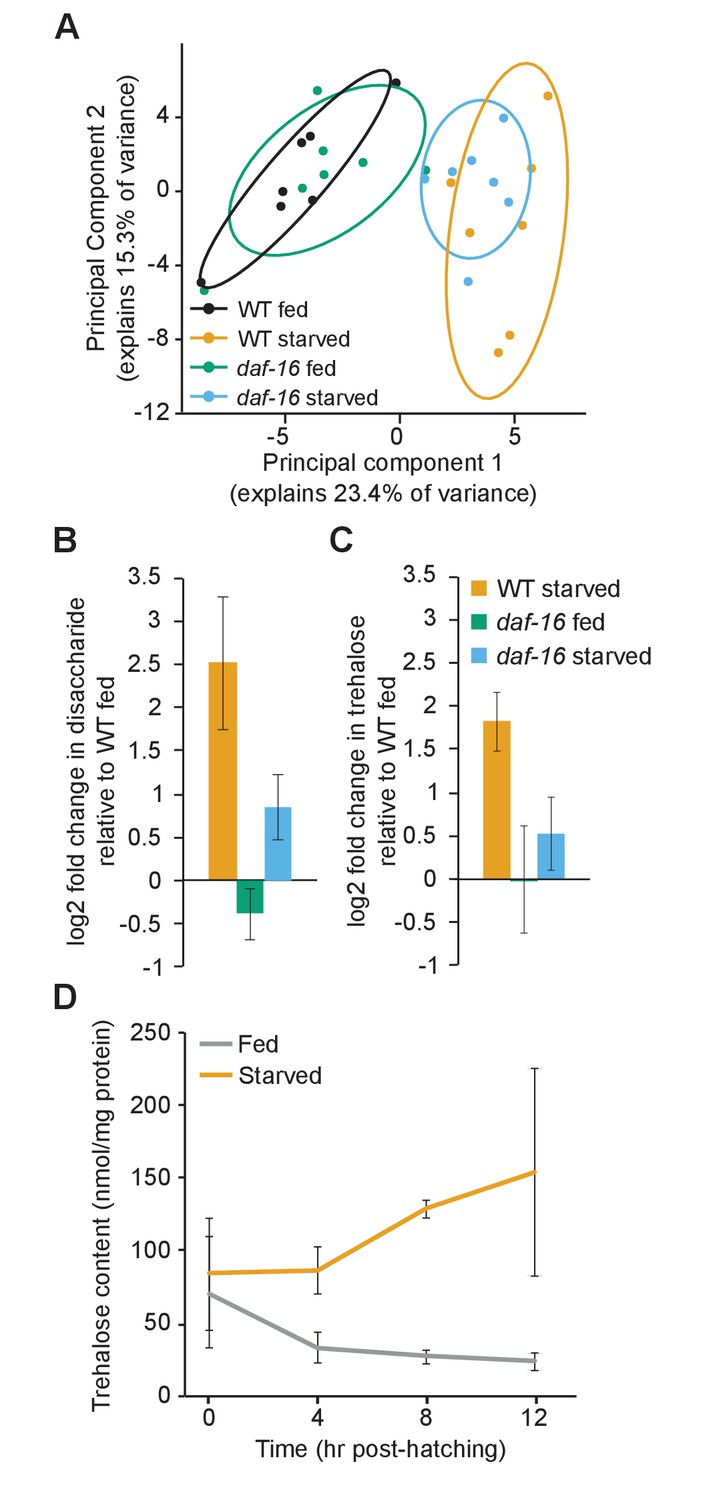
daf-16/FoxO shifts metabolic flux and increases trehalose synthesis during starvation.
(A) Principal component analysis (PCA) of targeted metabolomic analysis fed and starved wild-type (WT) and daf-16 L1 larvae shows separation by condition, but not by genotype. 80% confidence ellipses are included with seven biological replicates. (B) Disaccharide levels were measured in non-targeted metabolomic analysis. Mean and SD of log2 fold-change relative to fed WT is plotted for four biological replicates (pint=0.05, n = 4, two-way ANOVA). (C) Trehalose levels were measured in a biochemical assay, and log2 fold-change relative to fed WT is plotted for four biological replicates (pint=0.003, n = 4, two-way ANOVA). (D) Trehalose content in fed (gray) and starved (orange) worms is plotted over time. Fed and starved conditions are significantly different (p=0.01, n = 2, two-way ANOVA). Mean and standard error of the mean of two biological replicates are shown.
-
Figure 2—source data 1
Raw data for display items in Figure 2.
- https://doi.org/10.7554/eLife.30057.010
Figure 2—figure supplement 1
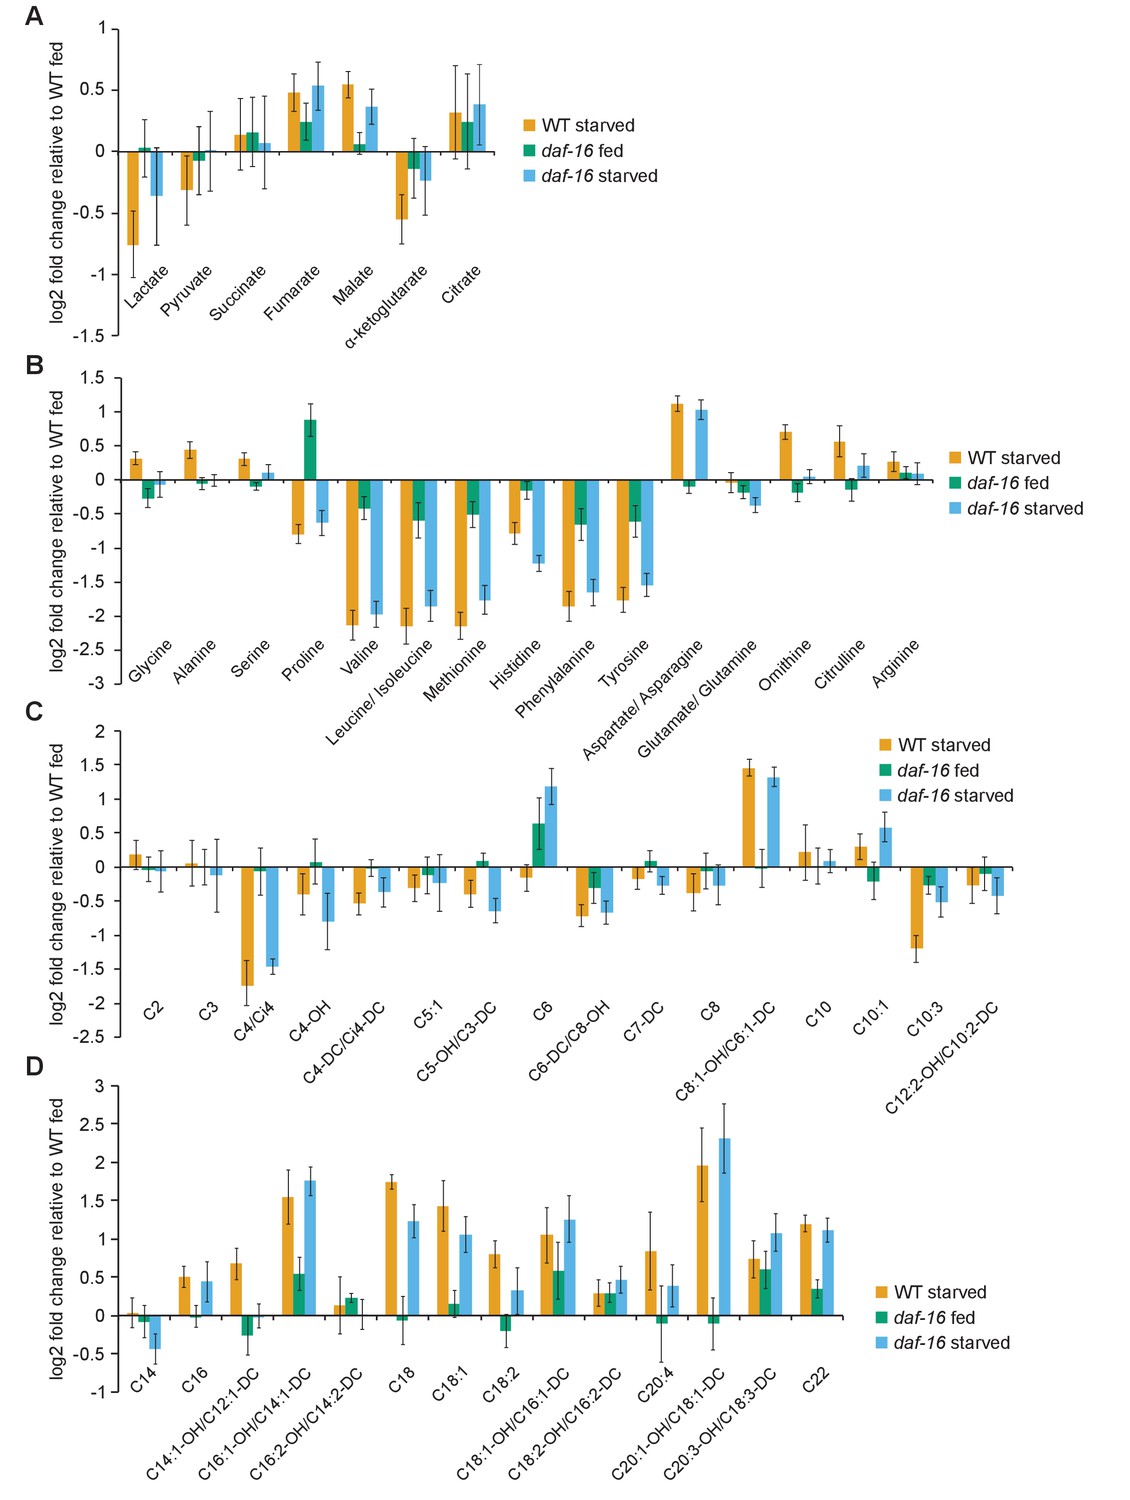
Metabolomic analysis of WT and daf-16/FoxO worms during feeding and starvation.
Targeted panels of metabolites are plotted as log2 fold-changes relative to the WT-fed condition. Metabolites profiled include (A) organic acids, (B) amino acids, (C) short and medium chain acyl carnitines (C2–C14), and (D) long-chain acyl carnitines (C16–C22).
Figure 3
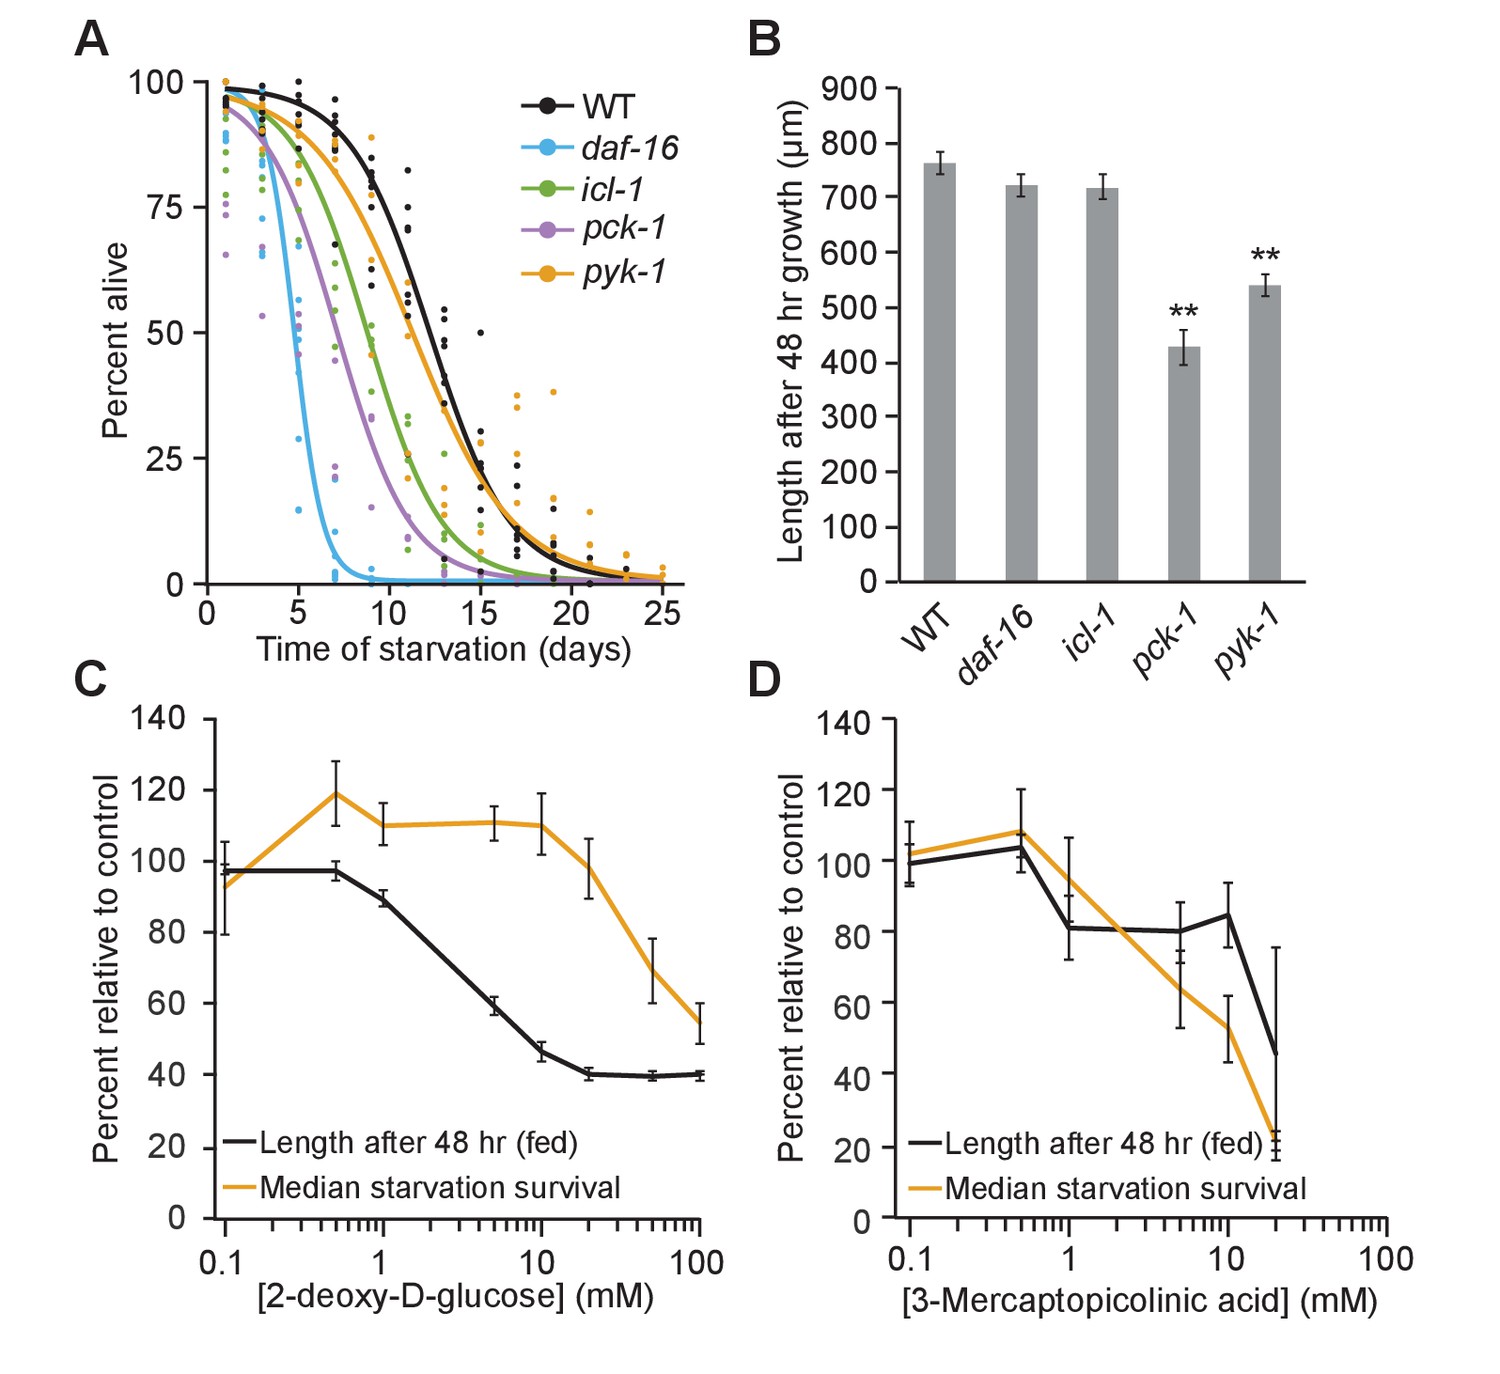
Fed and starved larvae differ in their reliance on the glyoxylate shunt and glycolysis.
(A) Starvation survival curves are plotted for wild-type (WT), daf-16, icl-1, and pck-1 mutants. Here and throughout, logistic regression is used to fit survival curves. See Supplementary file 1 for median survival and statistics. (B) Worm length after 48 hr of feeding on Escherichia coli OP50 on plates is plotted for WT, daf-16, icl-1, and pck-1 mutants. Mean and standard error of the mean of three biological replicates is shown. pck-1 and pyk-1 were significantly different than WT (p=0.001, p=0.002, unpaired t-test, n = 3). daf-16 or icl-1 were not different than WT (p=0.23, p=0.24, unpaired t-test, n = 3). **p<0.01 compared with WT. (C) Normalized dose–response curves for 2-deoxy-d-glucose in fed and starved larvae are plotted. (D) Normalized dose –response curves for 3-mercaptopicolinic acid (3 MPA) in fed and starved larvae are plotted. (C and D) Larvae were fed HB101 E. coli lysate in liquid culture and their length was measured after 48 hr (black) or they were starved and survival medians were determined from logistic regressions of survival curves (orange). These data are normalized within each replicate as a percentage of control (no drug) animals. The x-axis is log transformed.
-
Figure 3—source data 1
Raw data for display items in Figure 3.
- https://doi.org/10.7554/eLife.30057.012
Figure 4 with 1 supplement
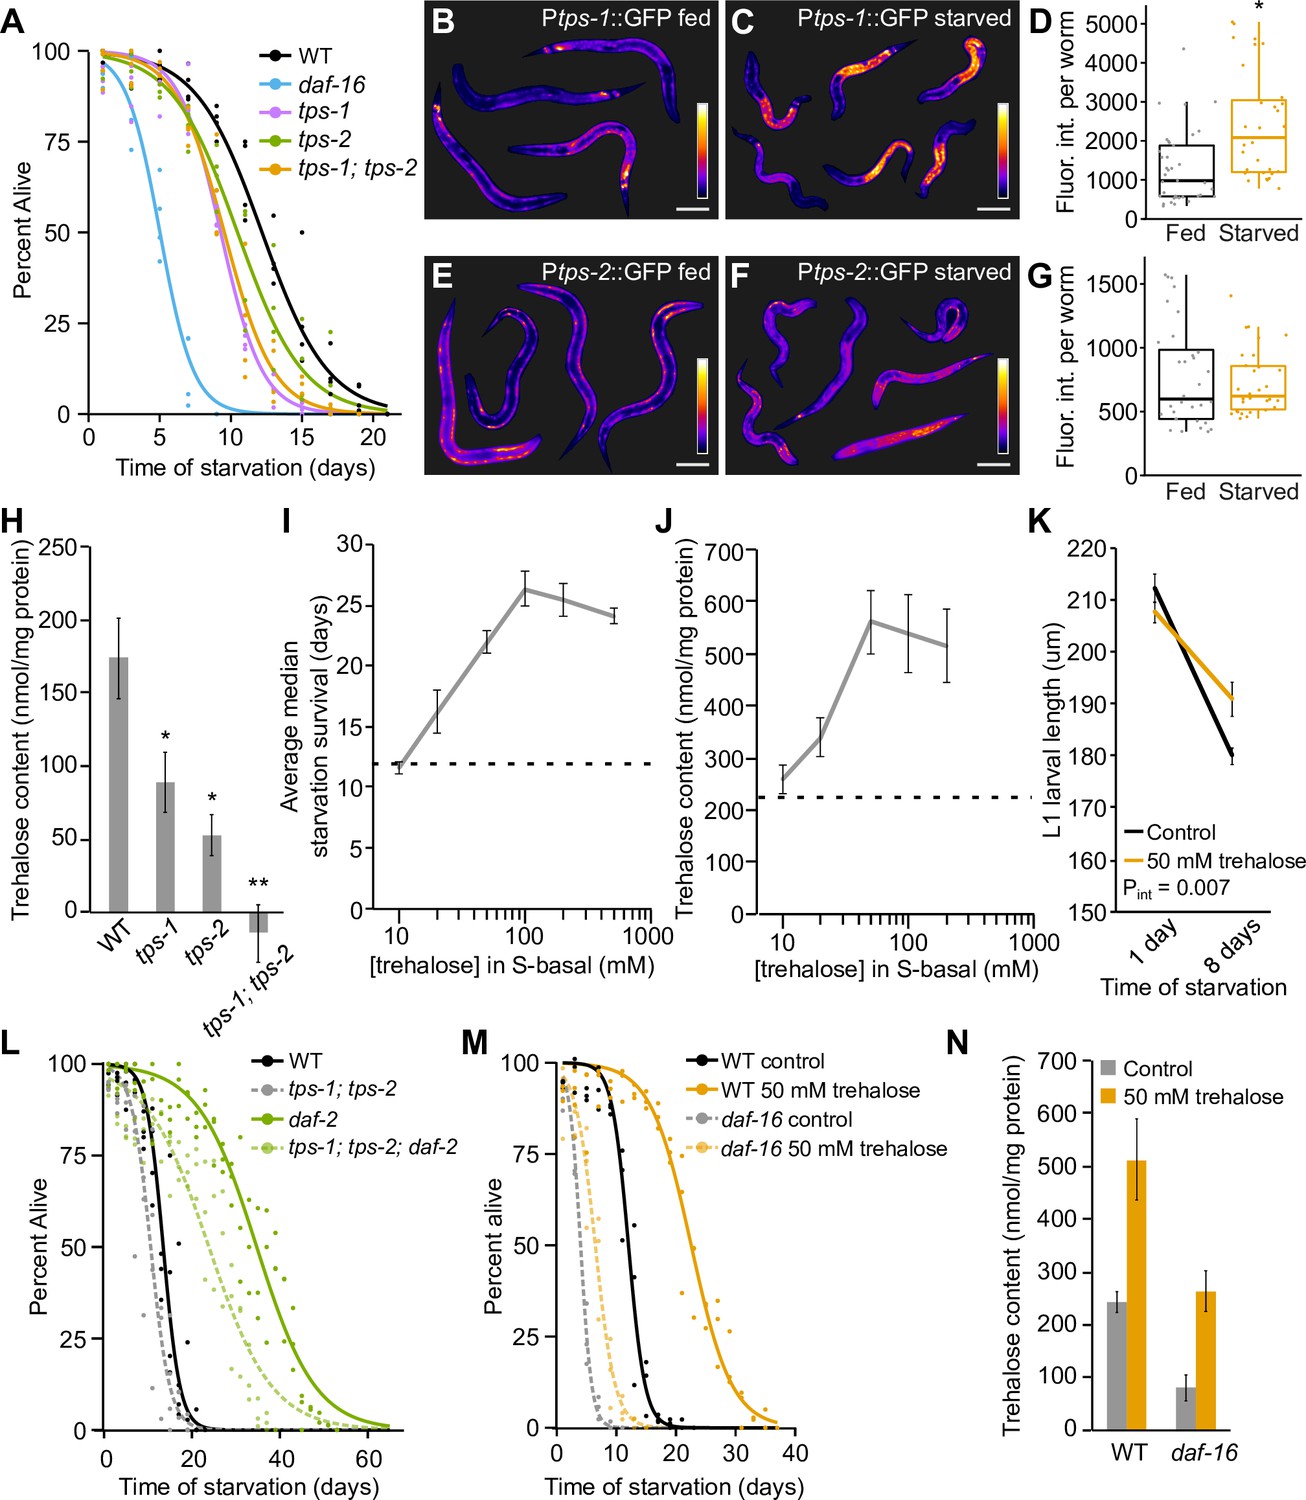
Trehalose supports starvation survival and regulation of its synthesis partially explains the effects of insulin-like signaling on starvation resistance.
(A) Starvation survival curves are plotted for wild-type (WT), tps-1, tps-2, tps-1; tps-2, and daf-16. (B and C,E and F) Representative Ptps-1::GFP (BC14885) and Ptps-2::GFP (BC14876) worms either fed or starved for ~12 hr are shown with false coloring to depict relative fluorescent intensity according to the calibration bar. Scale bars are 50 μm. (D and G) Boxplots indicate the distribution of average pixel intensity per worm in each reporter background in fed and starved worms. Each point represents an individual worm sampled from one of three biological replicates. Ptps-1::GFP was significantly brighter during starvation (p=0.04, unpaired t-test, n = 3). Ptps-2::GFP intensity was not different between fed and starved worms (p=0.50, unpaired t-test, n = 3). (H) Trehalose levels of WT, tps-1, tps-2, and tps-1; tps-2 are plotted. tps-1 and tps-2 each had reduced levels of trehalose compared to WT (p=0.05, p=0.01, unpaired t-test, n = 4). The double mutant was significantly different from WT and each single mutant (p=0.001, p=0.01, p=0.03, unpaired t-test, n = 4). (I) Median survival time is plotted for a worms exposed to a range of concentrations of trehalose in the buffer in which worms are starved. The dashed line indicates median survival of control animals. (J) Trehalose content 1 d after hatching is plotted for worms exposed to a range of concentrations of trehalose in S-basal (n = 12). The dashed line indicates trehalose content of control animals. (K) L1 larval size is plotted for WT worms with and without trehalose supplementation. Worms starved for 8 d are shorter than worms starved for 1 d (p=1.3E-05, unpaired t-test, n = 5). Worms supplemented with trehalose remain larger after 8 d of starvation (pint=0.007, two-way ANOVA, n = 5). (L) Starvation survival curves are plotted for WT, tps-1; tps-2 (four biological replicates), daf-2, and tps-1; tps-2; daf-2 (three biological replicates). There is a significant interaction by two-way ANOVA between median survivals (pint = 0.02). (M) Starvation survival curves for WT and daf-16 with and without 50 mM trehalose supplementation. (N) Trehalose content is plotted for N2 and daf-16 with and without 50 mM trehalose supplementation (n = 7). Mean and standard error of the mean of biological replicates are plotted in H–K and N.
-
Figure 4—source data 1
Raw data for display items in Figure 4.
- https://doi.org/10.7554/eLife.30057.015
Figure 4—figure supplement 1
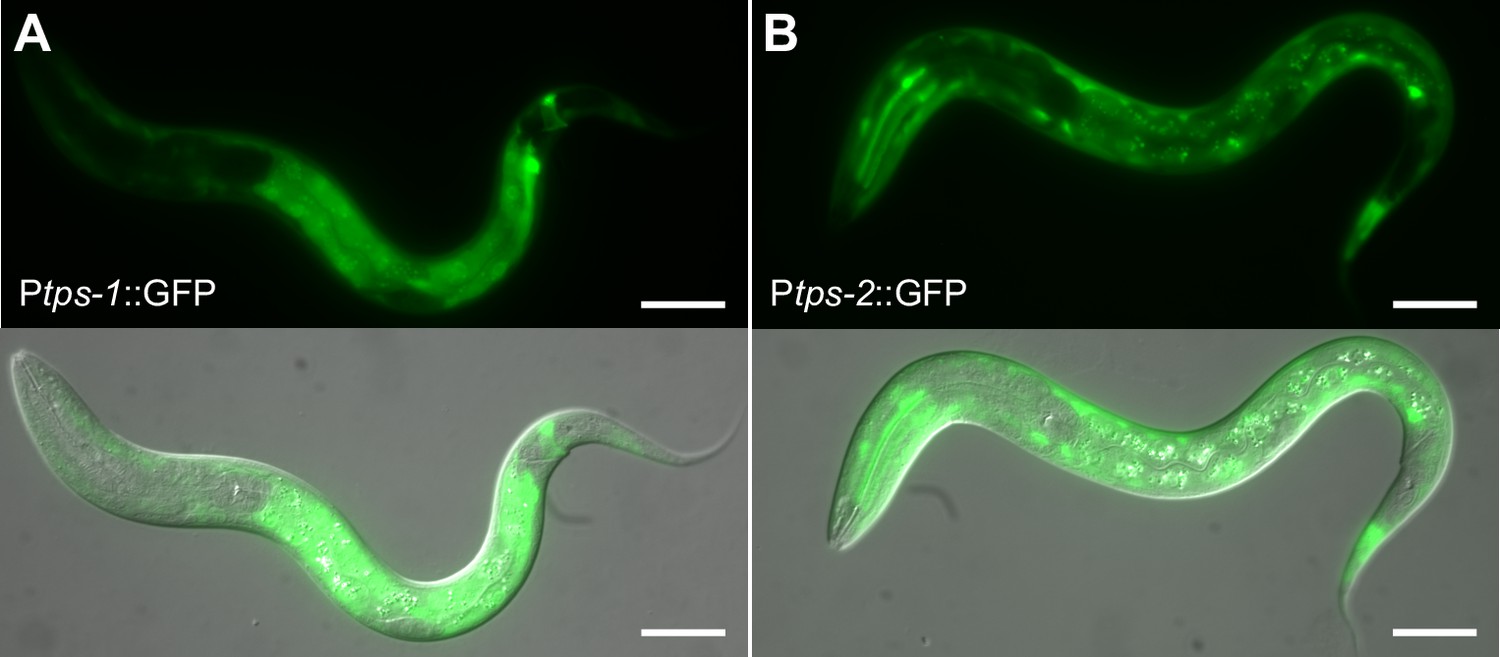
tps-1 and tps-2 are primarily expressed in hypodermis and intestine during starvation.
(A) A representative example of a worm carrying a Ptps-1::GFP reporter (BC14885) starved for 24 hr. (B) A representative example of a worm carrying a Ptps-2::GFP reporter (BC14876) starved for 24 hr. (A and B) Fluorescent and DIC images were merged. Scale bars are 20 μm.
Figure 5 with 1 supplement
Trehalose has dual function as energy source and stress protectant during starvation.
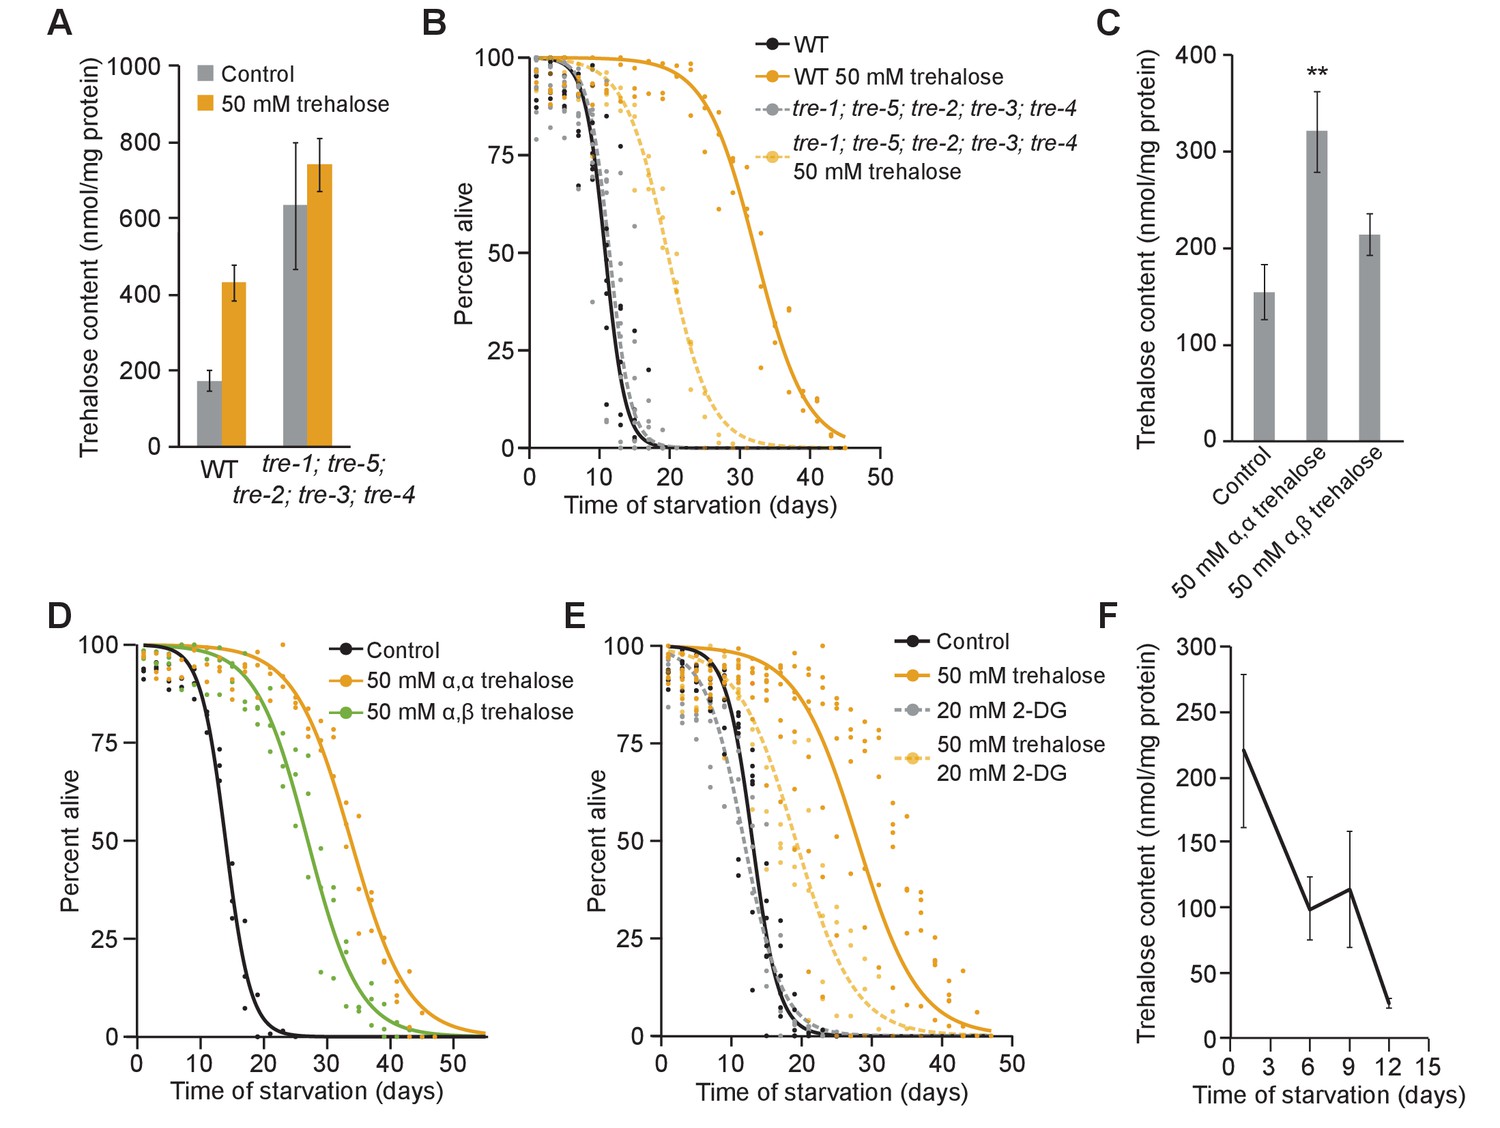
(A) Trehalose content is plotted for wild-type (WT) and trehalase quintuple mutant with and without 50 mM trehalose supplementation. tre-1; tre-5; tre-2; tre-3; tre-4 mutants have significantly higher levels of trehalose than WT (p=0.04, unpaired t-test, n = 4). While WT worms have higher corporeal trehalose upon supplementation (p=0.004, unpaired t-test, n = 4), trehalose content does not significantly change in tre-1; tre-5; tre-2; tre-3; tre-4 mutants (p=0.57, unpaired t-test, n = 4). (B) Starvation survival curves are plotted for WT and the trehalase quintuple mutant with and without 50 mM trehalose supplementation. (C) Trehalose content is plotted for WT worms with and without supplementation of 50 mM α–α trehalose or 50 mM α-β trehalose (n = 7). Supplementation with 50 mM α–α trehalose increased corporeal trehalose (p=0.007, unpaired t-test), but supplementation with 50 mM α–β trehalose did not significantly affect trehalose levels compared to control worms in S-basal (p=0.13, unpaired t-test). (D) Starvation survival curves are plotted for WT with and without supplementation with 50 mM α–α trehalose or 50 mM α–β trehalose. (E) Starvation survival curves are plotted for WT with or without 20 mM 2-DG and with or without 50 mM trehalose supplementation. (F) Trehalose content in WT worms during starvation is plotted. Endogenous trehalose content decreases over time (p=0.03, ANOVA, n = 4). Mean and standard error of the mean are plotted.
-
Figure 5—source data 1
Raw data for display items in Figure 5.
- https://doi.org/10.7554/eLife.30057.018
Figure 5—figure supplement 1
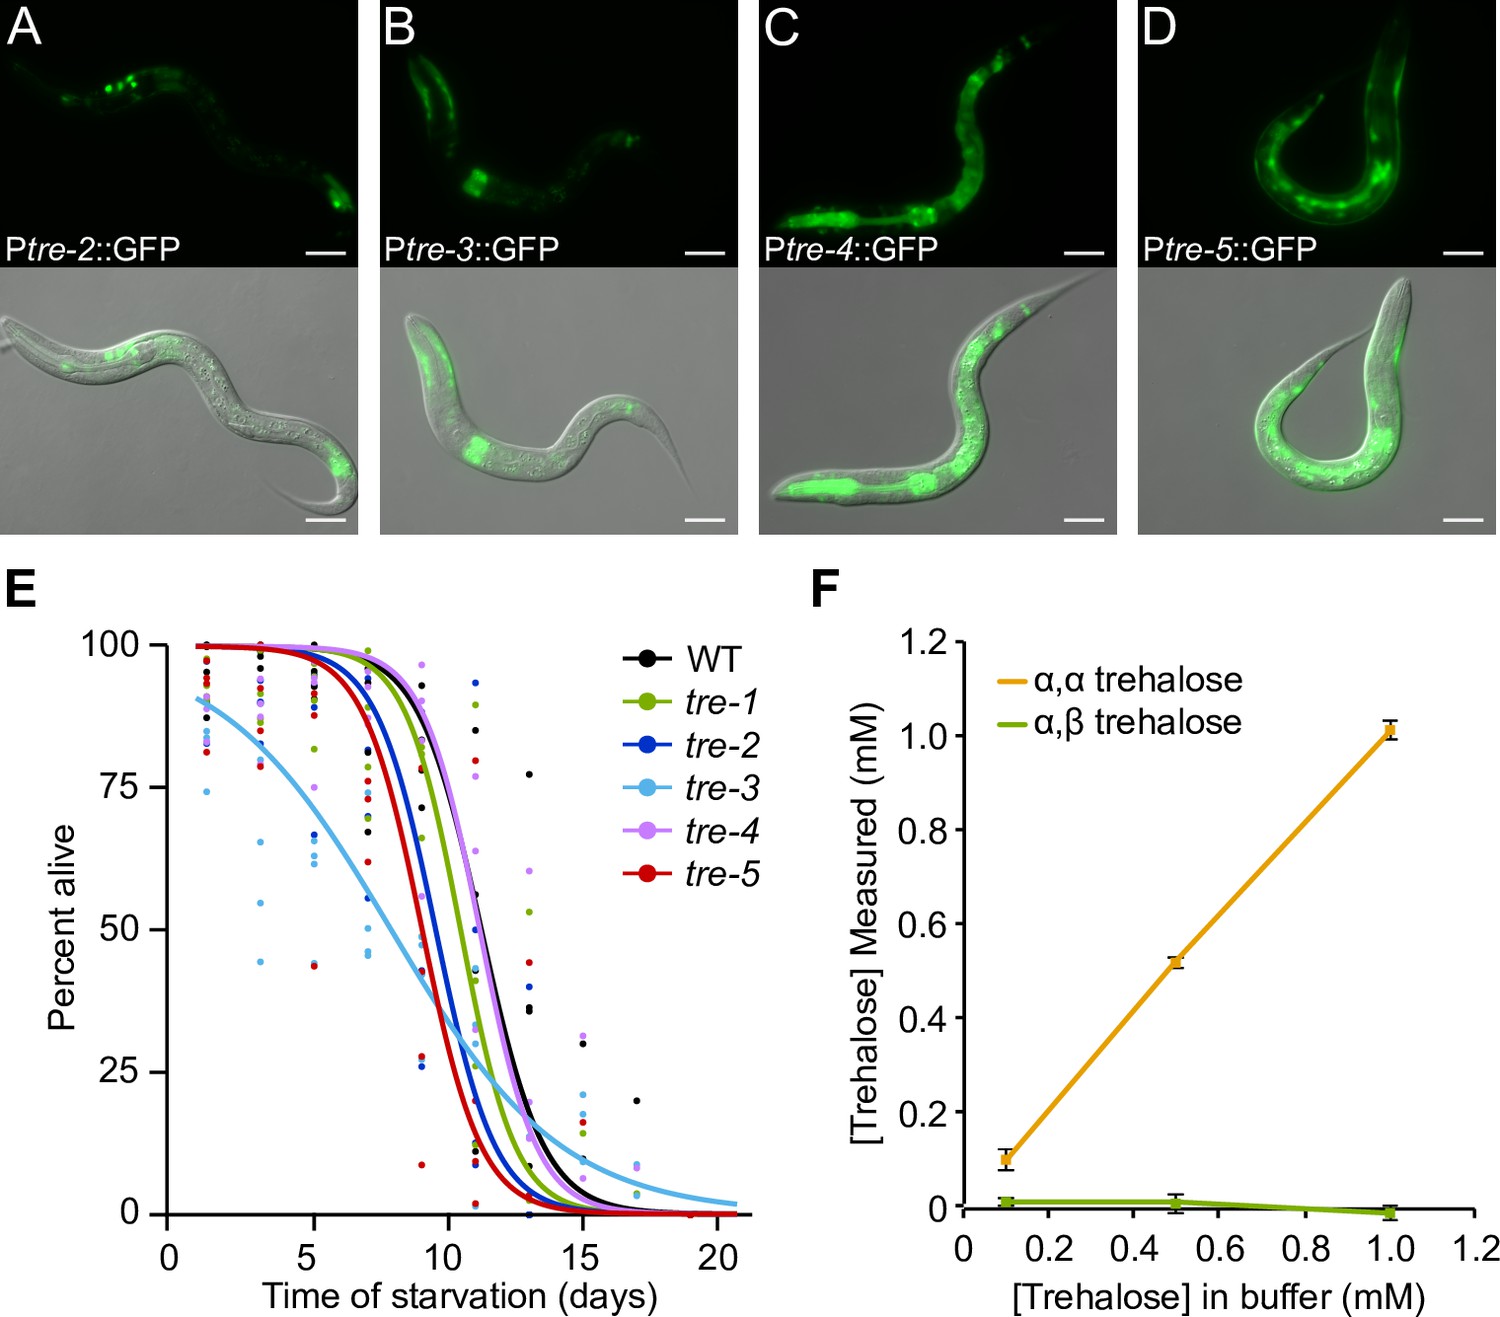
Controls for experiments where trehalose catabolism is prevented.
(A–D) Representative images of transcriptional reporters of tre-2 (BC14863), tre-3 (BC12475), tre-4 (BC15383), and tre-5 (BC14865) are shown for worms starved for ~12 hr. Scale bars are 20 μm. (E) Starvation survival curves of trehalase single mutants are plotted. (F) Endogenous trehalose content is plotted for S-basal buffer containing known concentrations of α–α trehalose and α–β trehalose. α–α trehalose, but not α–β trehalose, is detected.
-
Figure 5—figure supplement—source data 1
Raw data for display items in Figure 5-figure supplement 1
- https://doi.org/10.7554/eLife.30057.019
Figure 6

Interconversion of trehalose and glucose promotes resistance to starvation and heat.
(A) Logistic regression survival curves are plotted for wild-type (WT) and tps-1; tps-2 supplemented with a variety of sugars. (B) Heat shock survival on the first day of L1 starvation is plotted for WT, tps-1; tps-2 and daf-16 with and without supplementation with 50 mM trehalose, 100 mM glucose, and 50 mM maltose. (C) Trehalose content is shown for WT and tps-1; tps-2 supplemented with different sugars on the first day of L1 starvation. With the exception of maltose supplementation, all conditions measured were significantly different from the WT control (p<0.001, unpaired t-tests, n = 7).
-
Figure 6—source data 1
Raw data for display items in Figure 6.
- https://doi.org/10.7554/eLife.30057.021
Figure 7 with 2 supplements
Trehalose fuels cell division in permissive conditions.
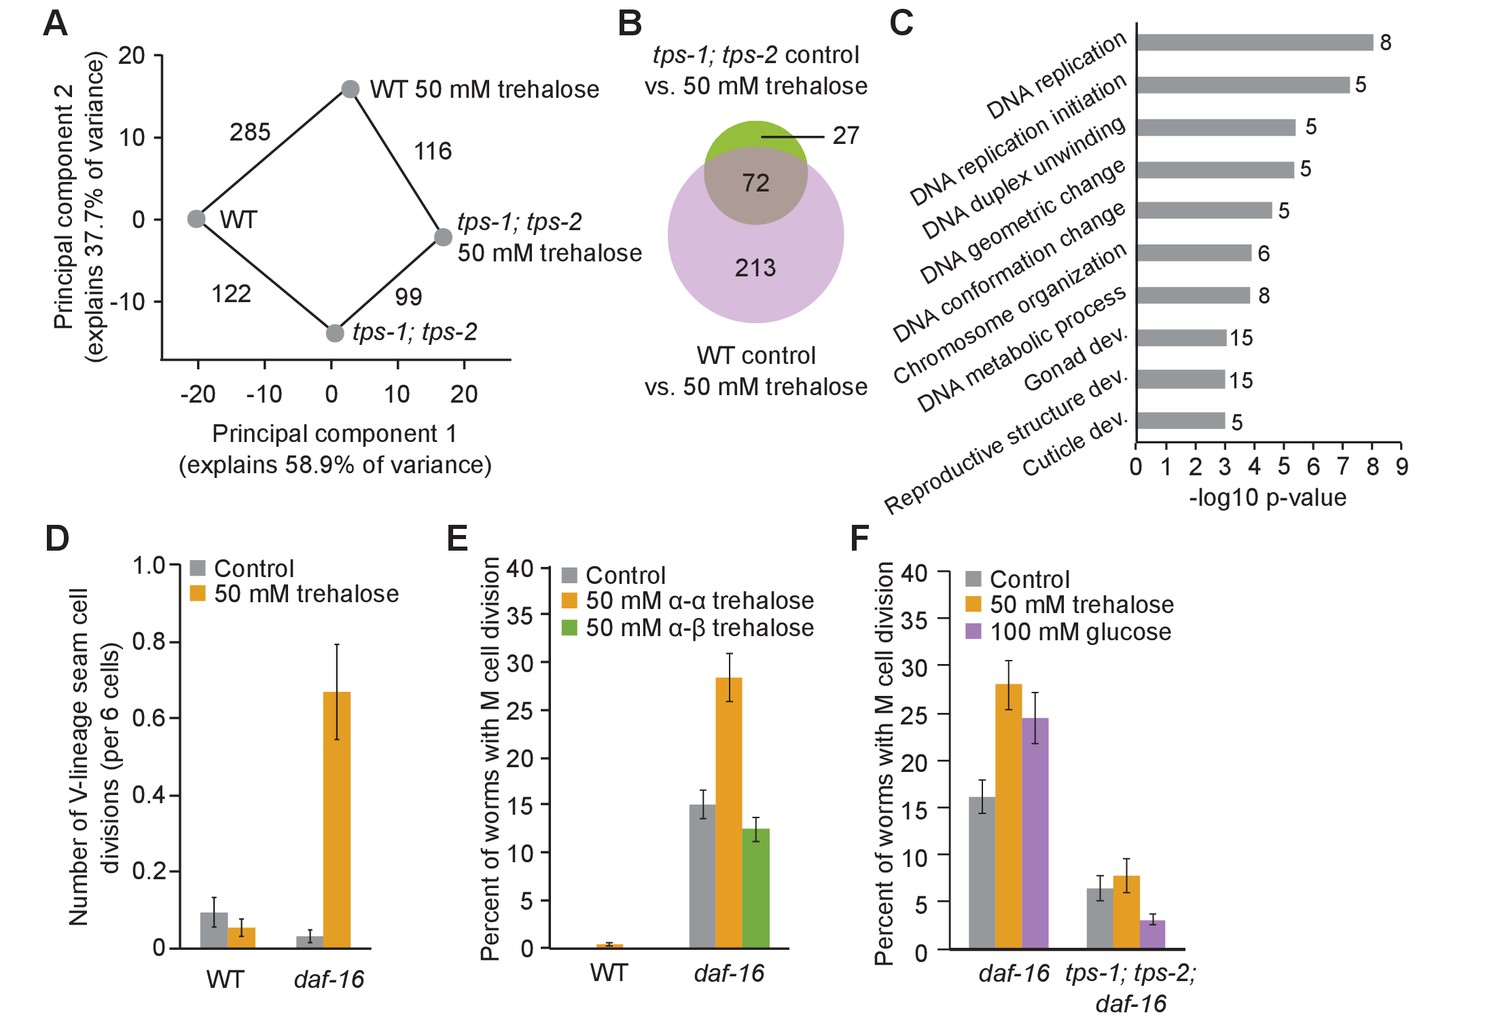
(A) Principal component analysis (PCA) of wild-type (WT) and tps-1; tps-2 mutant gene expression with and without 50 mM trehalose. The number of differentially expressed genes between each condition is indicated on the connecting lines. (B) A Venn diagram shows significant overlap between genes changing in response to trehalose in both WT and tps-1; tps-2 (FDR < 0.05). The genes changing in tps-1; tps-2 mutants are largely a subset of those that also change in WT. (C) –log10 p-values are plotted for GO terms enriched among genes with differential expression between tps-1; tps-2 and tps-1; tps-2 with 50 mM trehalose supplementation. The number of genes contributing to each GO term is listed beside each bar. (D) The number of hypodermal seam cell divisions per worm after 4 d of L1 starvation is shown for WT and daf-16. Mean and standard error of the mean (SEM) of t replicates is plotted. (E) The percentage of worms with M-cell divisions after 8 d of L1 starvation is shown for WT and daf-16 in control buffer (n = 6) and supplemented with 50 mM α–α trehalose (n = 6) or 50 mM α–β trehalose (n = 3). Worms were in S-basal (with ethanol and cholesterol). Mean and SEM are plotted. (F) The percentage of worms with M-cell divisions after 8 d of L1 starvation is shown for daf-16 and tps-1; tps-2; daf-16 worms supplemented with 100 mM glucose or 50 mM trehalose. tps-1; tps-2; daf-16 worms have fewer divisions than daf-16 mutants (p=0.005, unpaired t-test, n = 4). Supplemental trehalose and glucose promote cell division in daf-16 worms (p=0.01 and 0.04, respectively), but do not significantly affect divisions in tps-1; tps-2; daf-16 mutants.
-
Figure 7—source code 1
Code used for analysis of RNA-seq experiment.
- https://doi.org/10.7554/eLife.30057.025
-
Figure 7—source data 1
Raw data for display items in Figure 7.
- https://doi.org/10.7554/eLife.30057.026
-
Figure 7—source data 2
Results of RNA-seq comparing WT and tps-1; tps-2 mutant worms with and without trehalose supplementation.
- https://doi.org/10.7554/eLife.30057.027
Figure 7—figure supplement 1
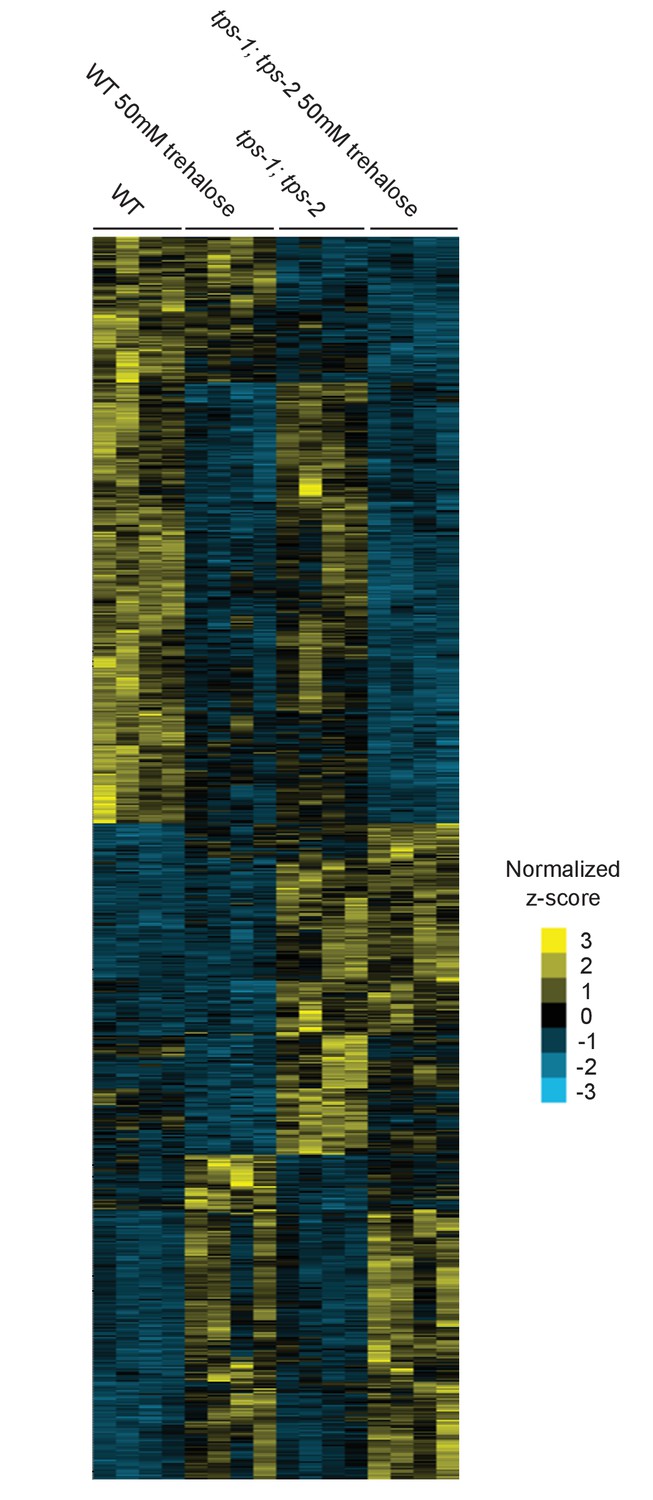
Expression analysis of WT and tps-1; tps-2 with and without trehalose supplementation.
750 genes are depicted on the y-axis. Yellow indicates an increase in expression and blue indicates a decrease in expression based on z-score, normalized to the average across all conditions.
Figure 7—figure supplement 2

Representative images of M-cell divisions.
Representative images depict M mesoblast cells of daf-16 worms supplemented with 50 mM trehalose. Worms with one cell (A), two cells (B), four cells (C), and eight cells (D) are shown. GFP and DIC images were taken at 100x and scale bars are 20 μm.
Figure 8
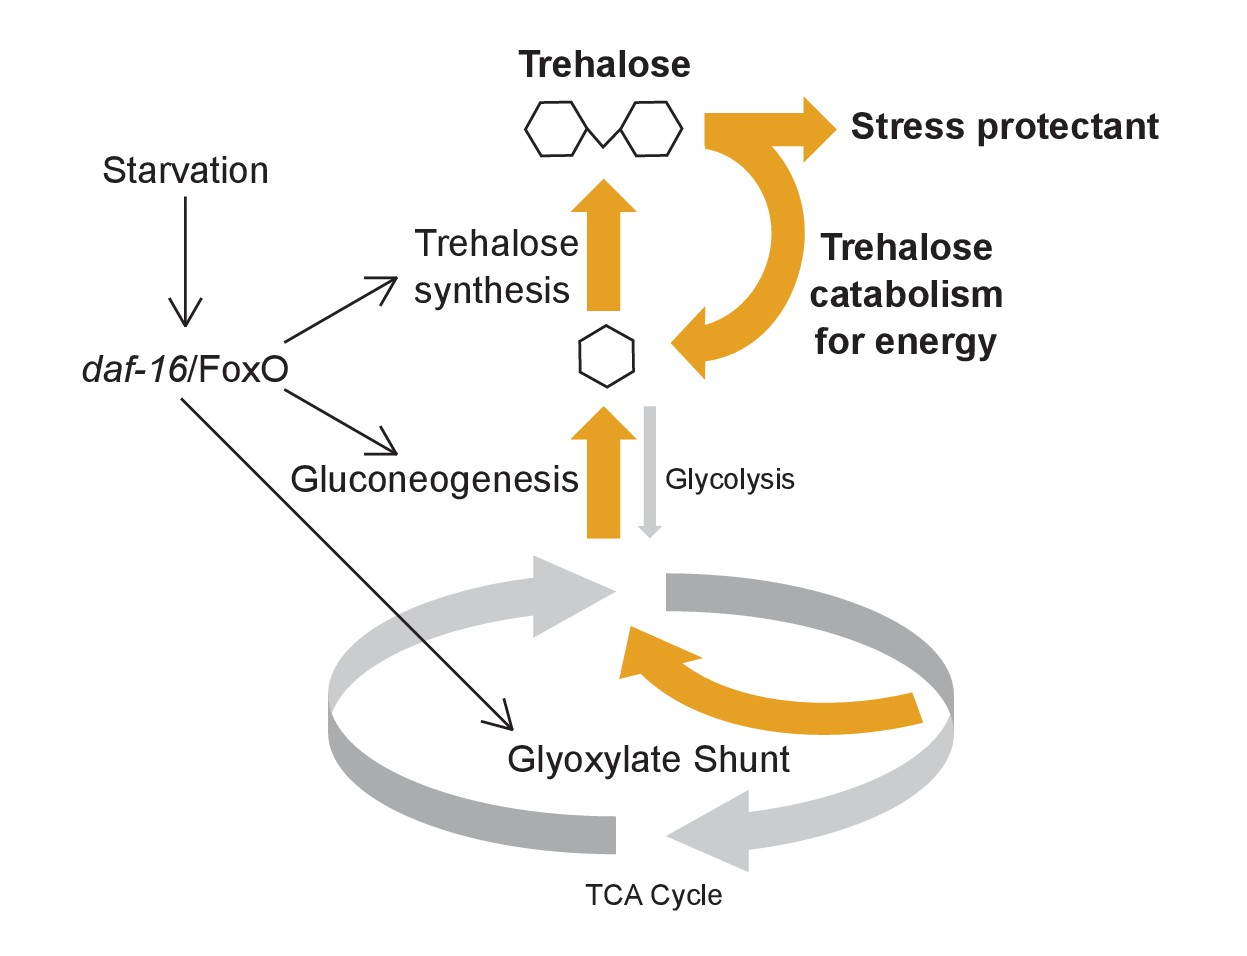
Model for metabolic adaptation to acute starvation.
daf-16/FoxO transcriptionally upregulates enzymes involved in the glyoxylate shunt, gluconeogenesis, and trehalose synthesis to drive an increase in production of trehalose. Trehalose functions as a stress protectant and an energy source to promote survival.
Additional files
-
Supplementary file 1
Comprehensive table of starvation survival statistics.
- https://doi.org/10.7554/eLife.30057.030
-
Transparent reporting form
- https://doi.org/10.7554/eLife.30057.031
Download links
A two-part list of links to download the article, or parts of the article, in various formats.
Downloads (link to download the article as PDF)
Open citations (links to open the citations from this article in various online reference manager services)
Cite this article (links to download the citations from this article in formats compatible with various reference manager tools)
daf-16/FoxO promotes gluconeogenesis and trehalose synthesis during starvation to support survival
eLife 6:e30057.
https://doi.org/10.7554/eLife.30057


