Regulatory coiled-coil domains promote head-to-head assemblies of AAA+ chaperones essential for tunable activity control
- Science for Life Laboratory Stockholm University, Sweden
- DKFZ-ZMBH Alliance, Center for Molecular Biology of the University of Heidelberg (ZMBH) and German Cancer Research Center (DKFZ), Germany
- Leibniz Universität Hannover, Germany
- Wyatt Technology Europe, Germany
Figures
Figure 1 with 3 supplements
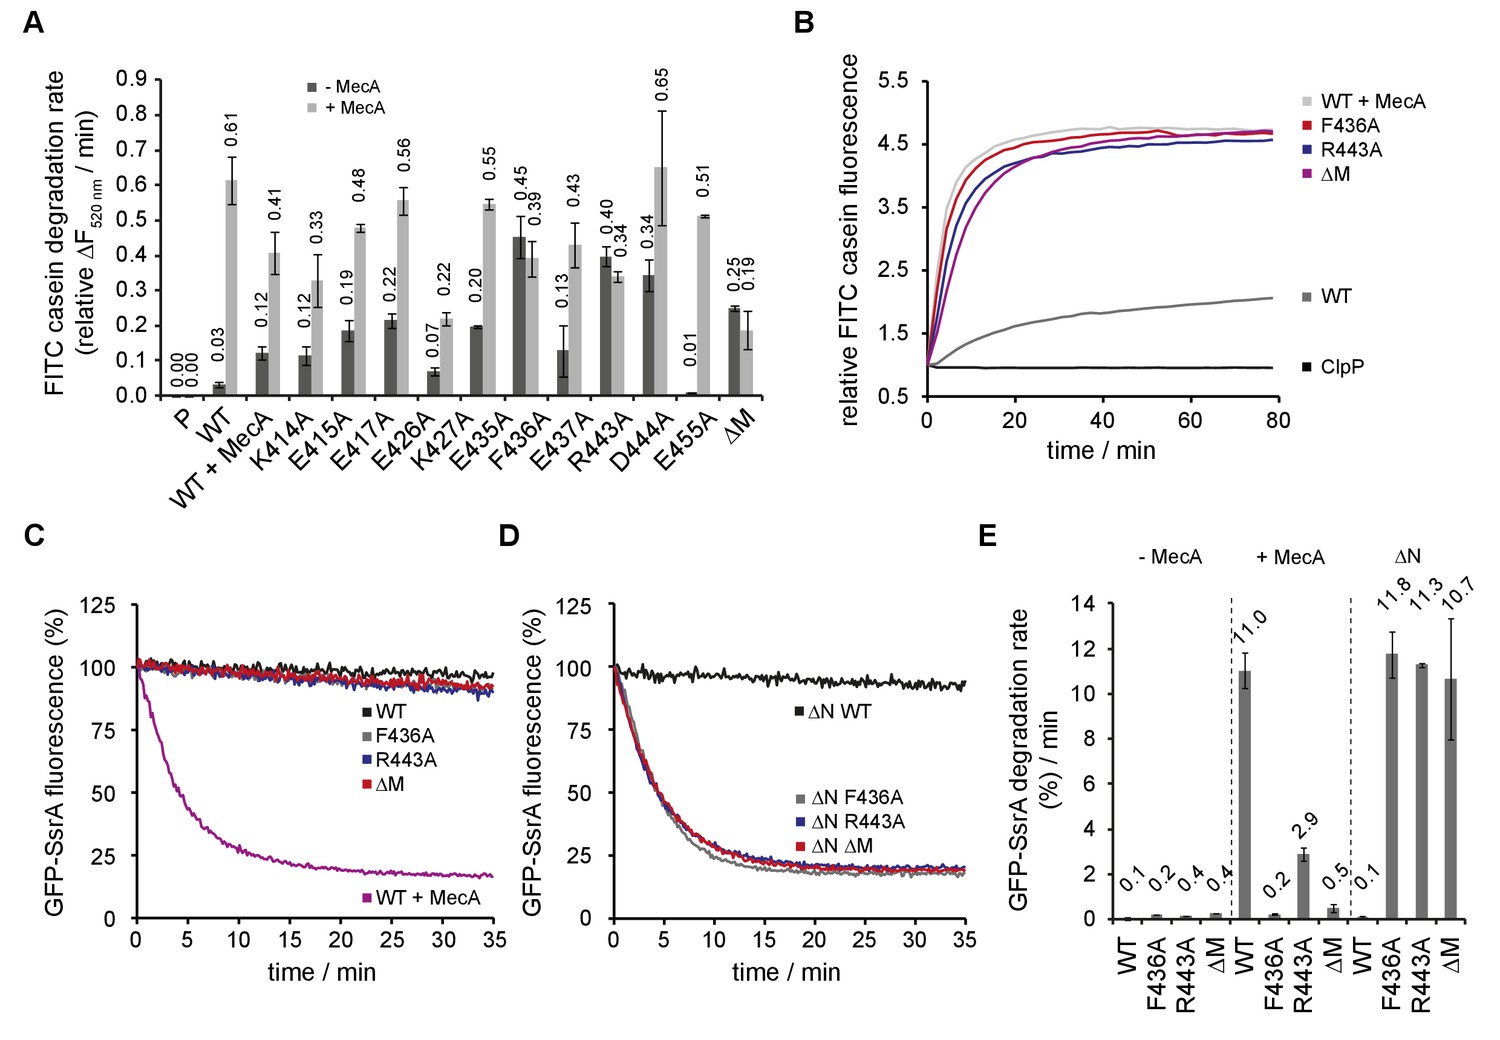
ClpC MD mutants exhibit adaptor-independent proteolytic activity.
(A/B) FITC-casein degradation was monitored in the presence of ClpP (P) only, or in presence of ClpC wild type and indicated MD mutants with or without MecA. Degradation rates were determined from the initial linear increase of FITC fluorescence. Initial FITC-casein fluorescence was set as one and relative changes in fluorescence were recorded. (C–E) GFP-SsrA degradation was monitored in the presence of ClpP and indicated ClpC variants. Deletion of the N-terminal domain (ΔN) unleashes high proteolyic activity of MD mutants. GFP-SsrA degradation rates were determined from the initial linear decrease of GFP-SsrA fluorescence.
Figure 1—figure supplement 1

Analysis of ClpC MD mutants.
(A) Sequence alignment of MDs from ClpC proteins. Largely conserved residues not involved in coiled-coil formation are highlighted in bold. (B) Degradation rates were determined for increasing FITC-casein concentrations in presence of 1 μM ClpC/ClpC-F436A, 2 μM MecA and 4 μM ClpP as indicated. Degradation rates were determined from the linear increase of FITC fluorescence. (C) Degradation of 2 μM FITC-casein was monitored in presence of 1 μM ClpC wild type (WT, ±2 μM MecA) and indicated MD mutants (without MecA) together with 4 μM ClpP. Degradation rates were determined from the linear increase of FITC fluorescence. The degradation activity of ClpC/MecA/ClpP was set as 100%. (D) Degradation of 0.3 μM FITC-casein was monitored presence of 1 μM ClpC wild type (WT, ±1.5 μM MecA) and indicated MD mutants (without MecA) together with 2 μM ClpP in presence of either ATP or ATPγS. Degradation rates were determined from the initial linear increase of FITC fluorescence.
Figure 1—figure supplement 2

Degradation of FITC-casein by the ClpC-F436A MD mutant.
Degradation of FITC-casein was monitored in presence of ClpC wild type (WT, ±MecA) and ClpC-F436A. Degradation was started by addition of an ATP regenerating system and samples were analyzed at the indicated time points by SDS-PAGE. A protein standard is given.
Figure 1—figure supplement 3
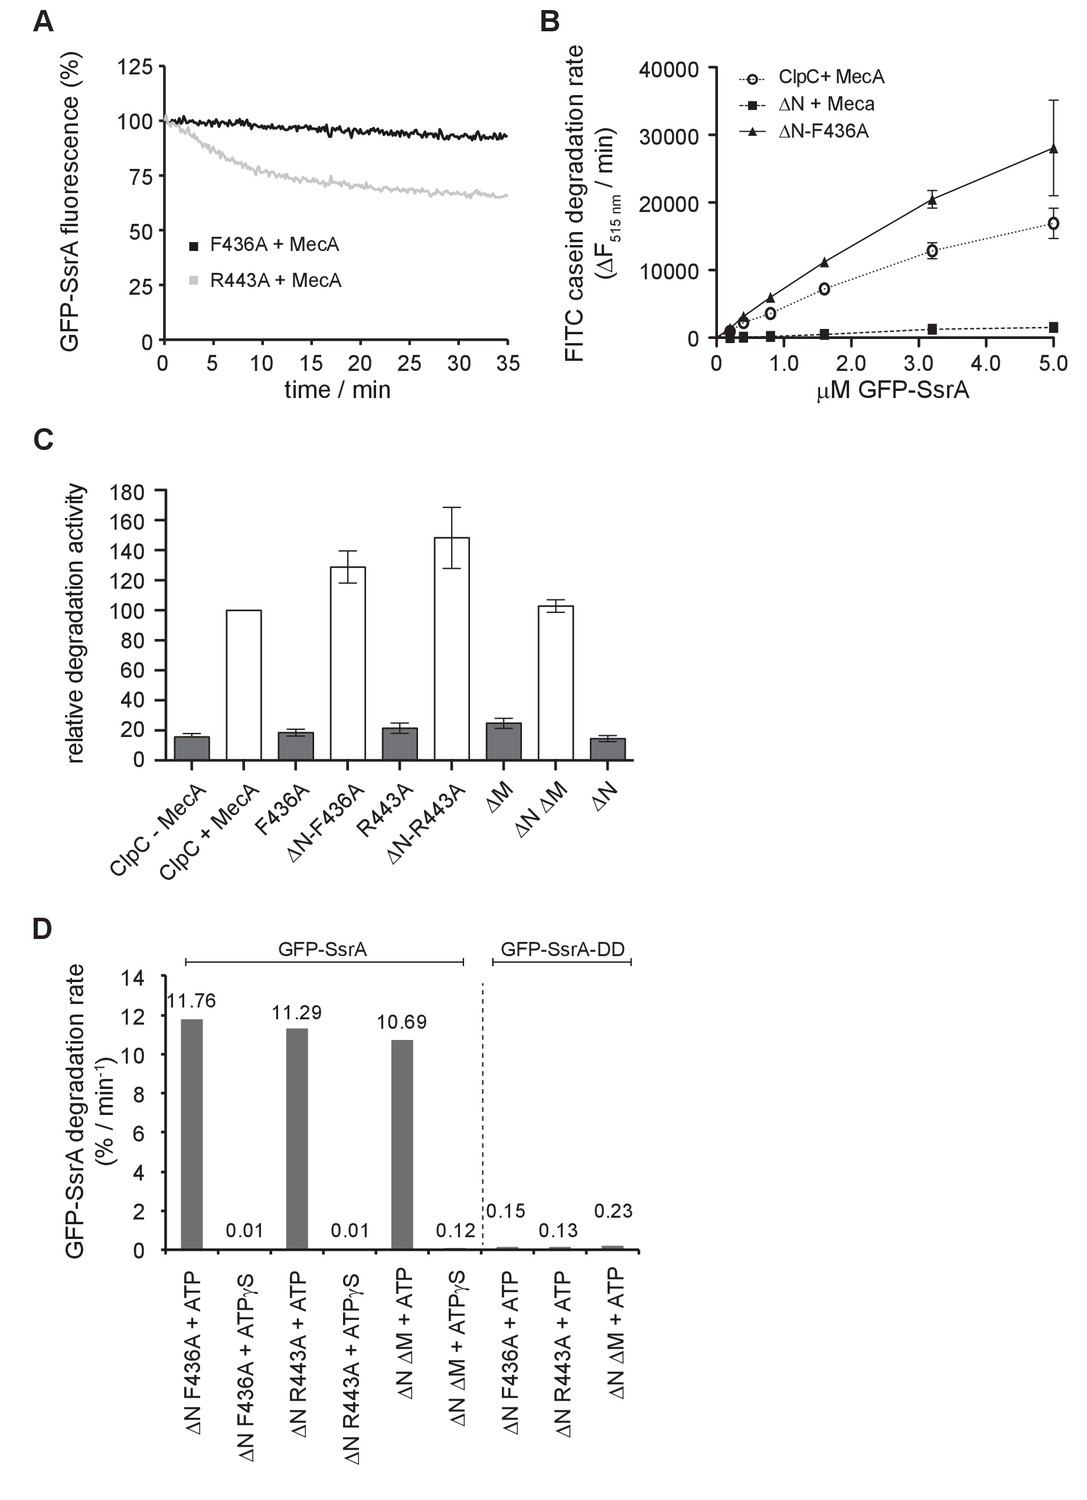
Degradation of GFP-SsrA by ClpC MD mutants.
(A) Degradation of 0.2 μM was monitored in the presence of 2 μM ClpP, 1.5 μM MecA and indicated 1 μM ClpC MD mutants. (B) Degradation rates were determined for increasing GFP-SsrA concentrations in presence of 1 μM ClpC/ClpC-F436A, 2 μM MecA and 4 μM ClpP as indicated. Degradation rates were determined from the linear decrease of GFP-SsrA fluorescence. (C) Degradation of 5 μM GFP-SsrA was monitored in presence of 1 μM ClpC wild type (WT, ±2 μM MecA) and indicated MD mutants (without MecA) together with 4 μM ClpP. Degradation rates were determined from the linear decrease of GFP-SsrA fluorescence. The degradation activity of ClpC/MecA/ClpP was set as 100%. (D) Degradation of 0.2 μM GFP-SsrA or GFP-SsrA-DD was monitored in presence of 2 μM ClpP, indicated 1 μM ClpC MD mutants and ATP or ATPγS. GFP-SsrA degradation rates were determined from the linear decrease of GFP-SsrA fluorescence.
Figure 2
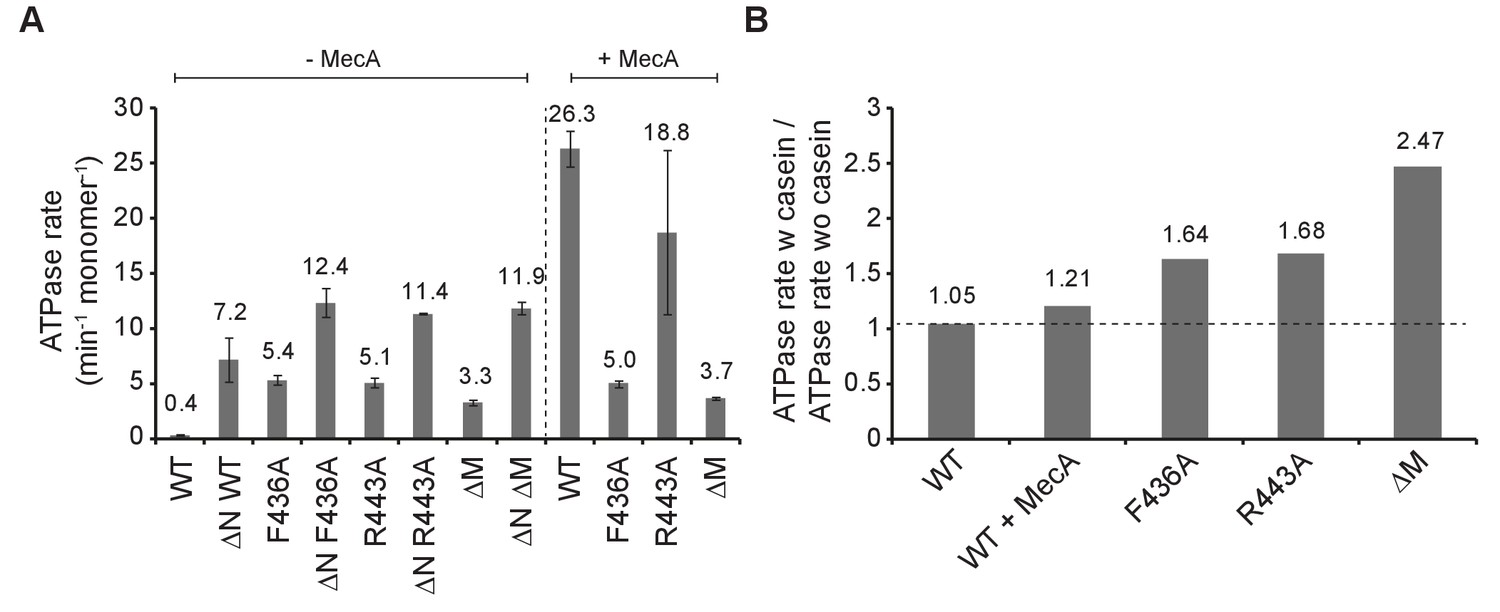
ClpC MD mutants exhibit increased basal ATPase activity that can be stimulated by substrate.
(A) ATPase activities of ClpC wild type (WT) and indicated deletion variants (ΔN, ΔM) and MD mutants were determined in absence and presence of MecA. (B) ATPase activities of ClpC wild type (WT, ±MecA) and indicated MD mutants were determined in absence and presence of substrate casein. ATPase activities determined without casein were set as one and the relative increase of ATP hydrolysis in presence of casein was determined (stimulation factor).
Figure 3 with 4 supplements

Cryo-EM structures of S. aureus ClpC-ATPγS with and without MecA.
(A) Overview of the oligomeric ClpC resting state 3D map coloured by subunits. (B) ClpC density map coloured by domains. Head-to-head interactions between MDs (green) of each helical assembly are key contacts stabilizing the ClpC resting state. ClpC domain organization is given, including an N-terminal domain (NT, yellow), AAA-1 large subdomain (L-AAA1, red), coiled-coil M-domain (MD, green), AAA-1 small subdomain (S, orange), AAA-2 large subdomain (L-AAA2, blue) and AAA-2 small subdomain (S, cyan). (C) Details of fitting for each ClpC subdomain. The small inset shows the positions relative to the whole molecule. (D) Zoomed view into MD-MD contacts highlighting conserved MD residues involved in interactions. The small inset shows the positions relative to the whole molecule. (E) Structure of the ClpC-MecA complex. Fitted atomic model coloured by ClpC domains as in b and MecA C-terminal domains (purple). Density for MecA N-terminal domains is indicated.
Figure 3—figure supplement 1
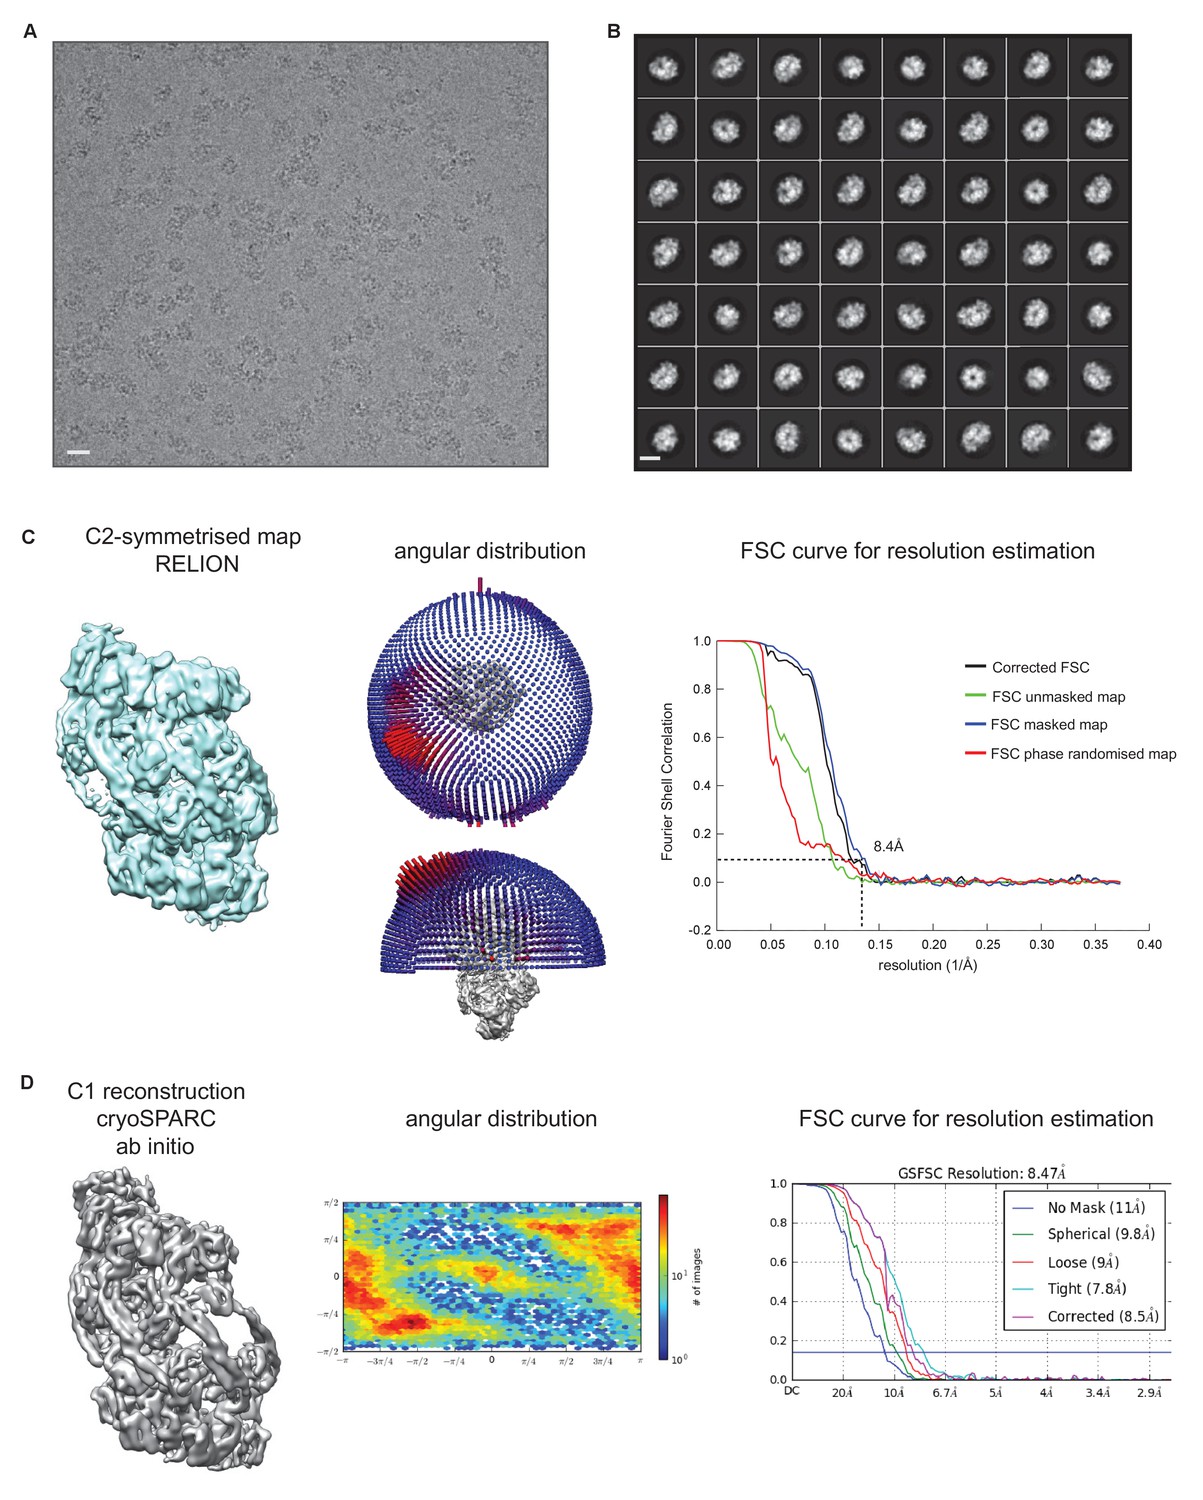
Cryo-EM structure of S.
aureus ClpC-ATPγS. (A) Micrograph of ClpC-ATPγS sample. Scale bar is 15 nm. (B) 2D class averages of ClpC- ATPγS complexes. Scale bar is 15 nm. (C) Overview of the C2-symmetrised ClpC-ATPγS complex with angular distribution and Fourier shell correlation shown. (D) Overview of the asymmetric ClpC-ATPγS complex with angular distribution and Fourier shell correlation shown.
Figure 3—figure supplement 2
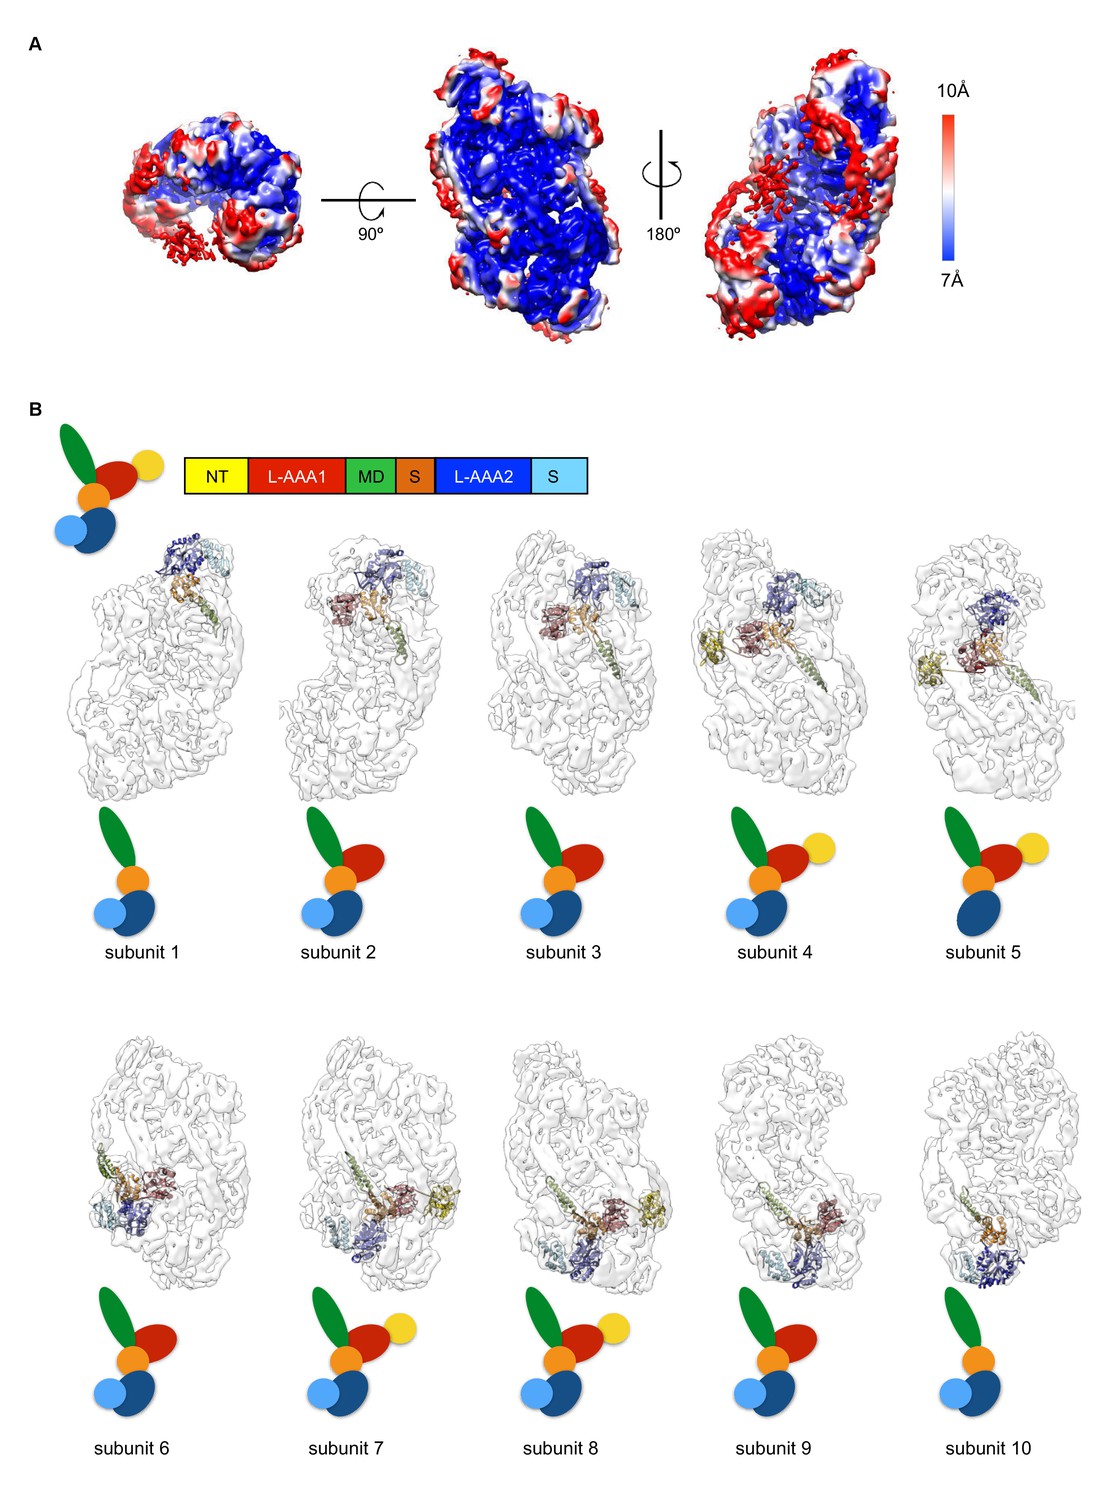
(A) Local-resolution map of ClpC-ATPγS complex.
Rotations of the complex are indicated. Side and top views are given. (B) Display of atomic model of each ClpC subunit coloured by subdomains fitted into the asymmetric resting state. Up to ten ClpC subunits can be fitted in the structure, though for peripheral subunits there is not sufficient density to account for all subdomains. Schematic drawings colored by subdomains are shown for clarity.
Figure 3—figure supplement 3

Cryo-EM structure of S. aureus ClpC-MecA-ATPγS complex.
(A) Micrograph of ClpC-MecA-ATPγS sample. Scale bar is 10 nm. (B) 2D class averages of ClpC-MecA-ATPγS complex. Scale bar is 10 nm. (C) Maps and orientation distribution of the ClpC-MecA-ATPγS complex before (light yellow) and after (grey) angle-distribution correction. (D) Fourier shell correlation and indicated resolution according to the 0.14 criterion. (E) Comparison of a ClpC protomer in the MecA bound (salmon) and resting (light grey) states. The ClpC N-terminal domain is shown in yellow and undergoes a large displacement upon MecA binding. MecA binding loops are shown in red. (F) Repositioning of ClpC N-terminal domains for MecA binding. The left panel shows the surface of the ClpC-ATPγS resting state simulated from the atomic model as semitransparent surface with the N-terminal domain in yellow. Only one spiral of the resting state is shown. In the right panel the second spiral of the ClpC-ATPγS resting state map is overlapped and displayed as a mesh. N-terminal domains of ClpC in the MecA-bound state are shown as ribbons. MecA binding loops are shown in red.
Figure 3—video 1
Structural organization of the ClpC resting state.
The C2 symmetrised ClpC map is shown grey. Next, fitting of individual protomers is shown and the map is coloured afterwards by subunits.
Figure 4 with 1 supplement
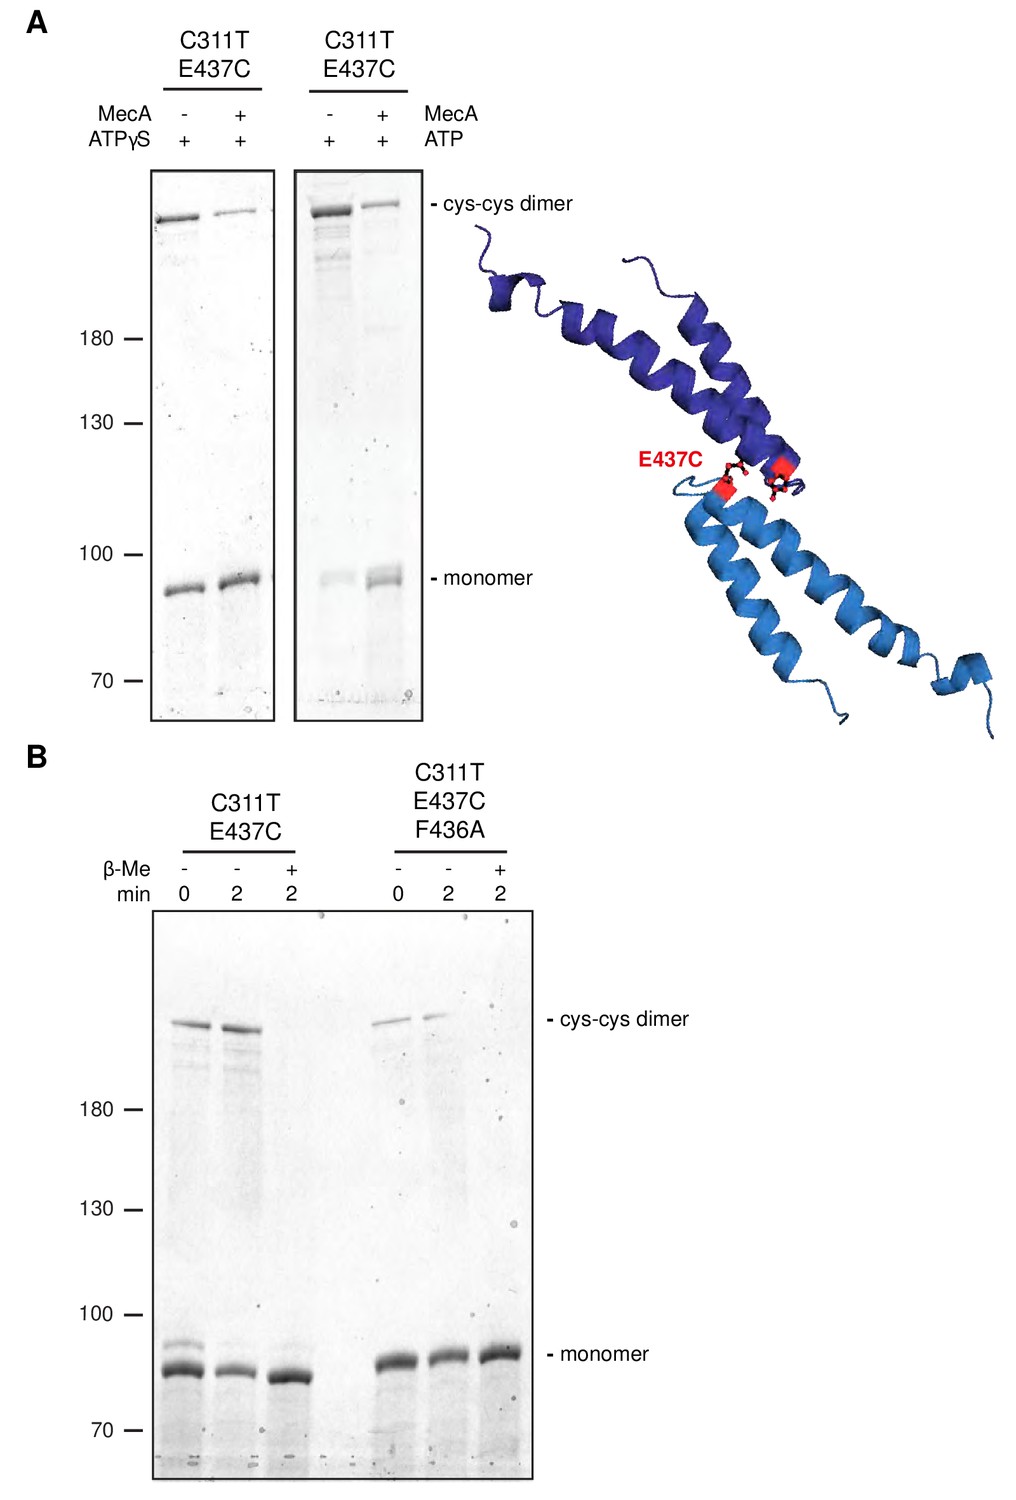
Disulfide crosslinking demonstrates MecA-sensitive head-to-head MD contacts.
(A) Disulfide crosslinking of ClpC-C311T/E437C under oxidizing conditions was performed in presence of ATPγS or ATP without or with MecA and analyzed by subsequent non-reducing SDS-PAGE. A model of head-to-head interacting MDs is given and the position of E437 is indicated. (b) Disulfide crosslinking of ClpC-C311T/E437C and ClpC-C311T/F436A/E437C was performed in presence of ATPγS under oxidizing (+Cu(Phe3)) and reducing (+ β-mercaptoethanol) conditions and analyzed by subsequent non-reducing SDS-PAGE.
Figure 4—figure supplement 1
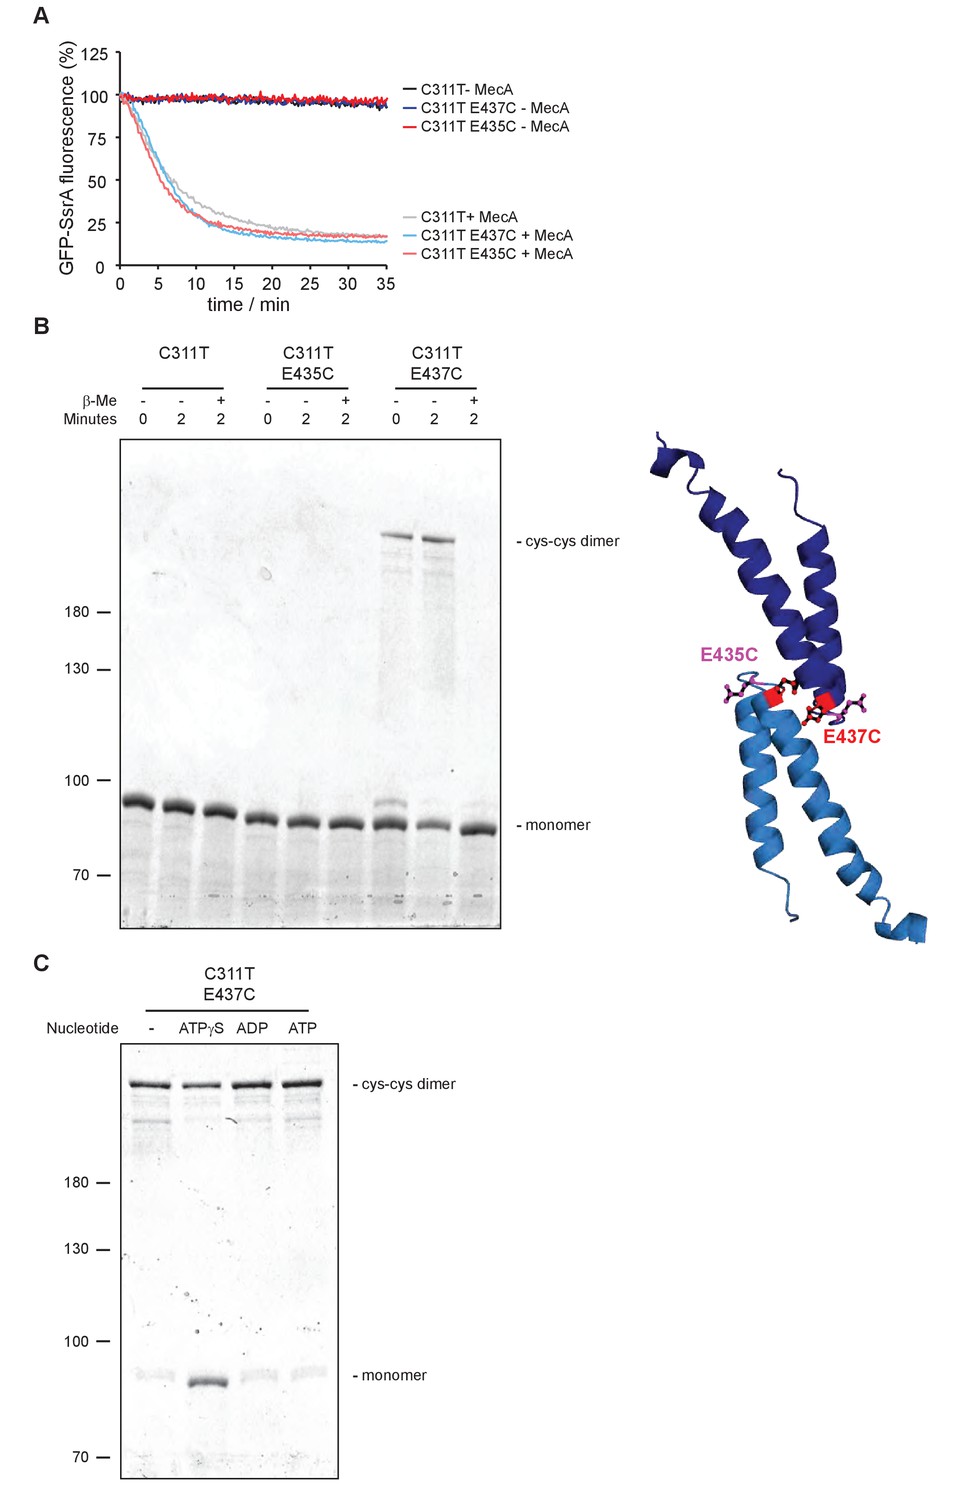
Disulfide crosslinking of head-to-head interacting MDs.
(A) GFP-SsrA degradation was monitored in presence of ClpP and indicated ClpC variants without and with MecA. (B) Disulfide crosslinking of ClpC-C311T, ClpC-C311T/E435C and ClpC-C311T/E437C was performed in presence of ATPγS under oxidizing (+Cu(Phe3)) and reducing (+ β-mercaptoethanol) conditions and analyzed by subsequent non-reducing SDS-PAGE. A model of head-to-head interacting MDs is given and the positions of E435 and E437 are indicated. (C) Disulfide crosslinking of ClpC-C311T/E437C was performed in absence or presence of indicated nucleotides for 2 min and analyzed by subsequent non-reducing SDS-PAGE.
Figure 5 with 3 supplements
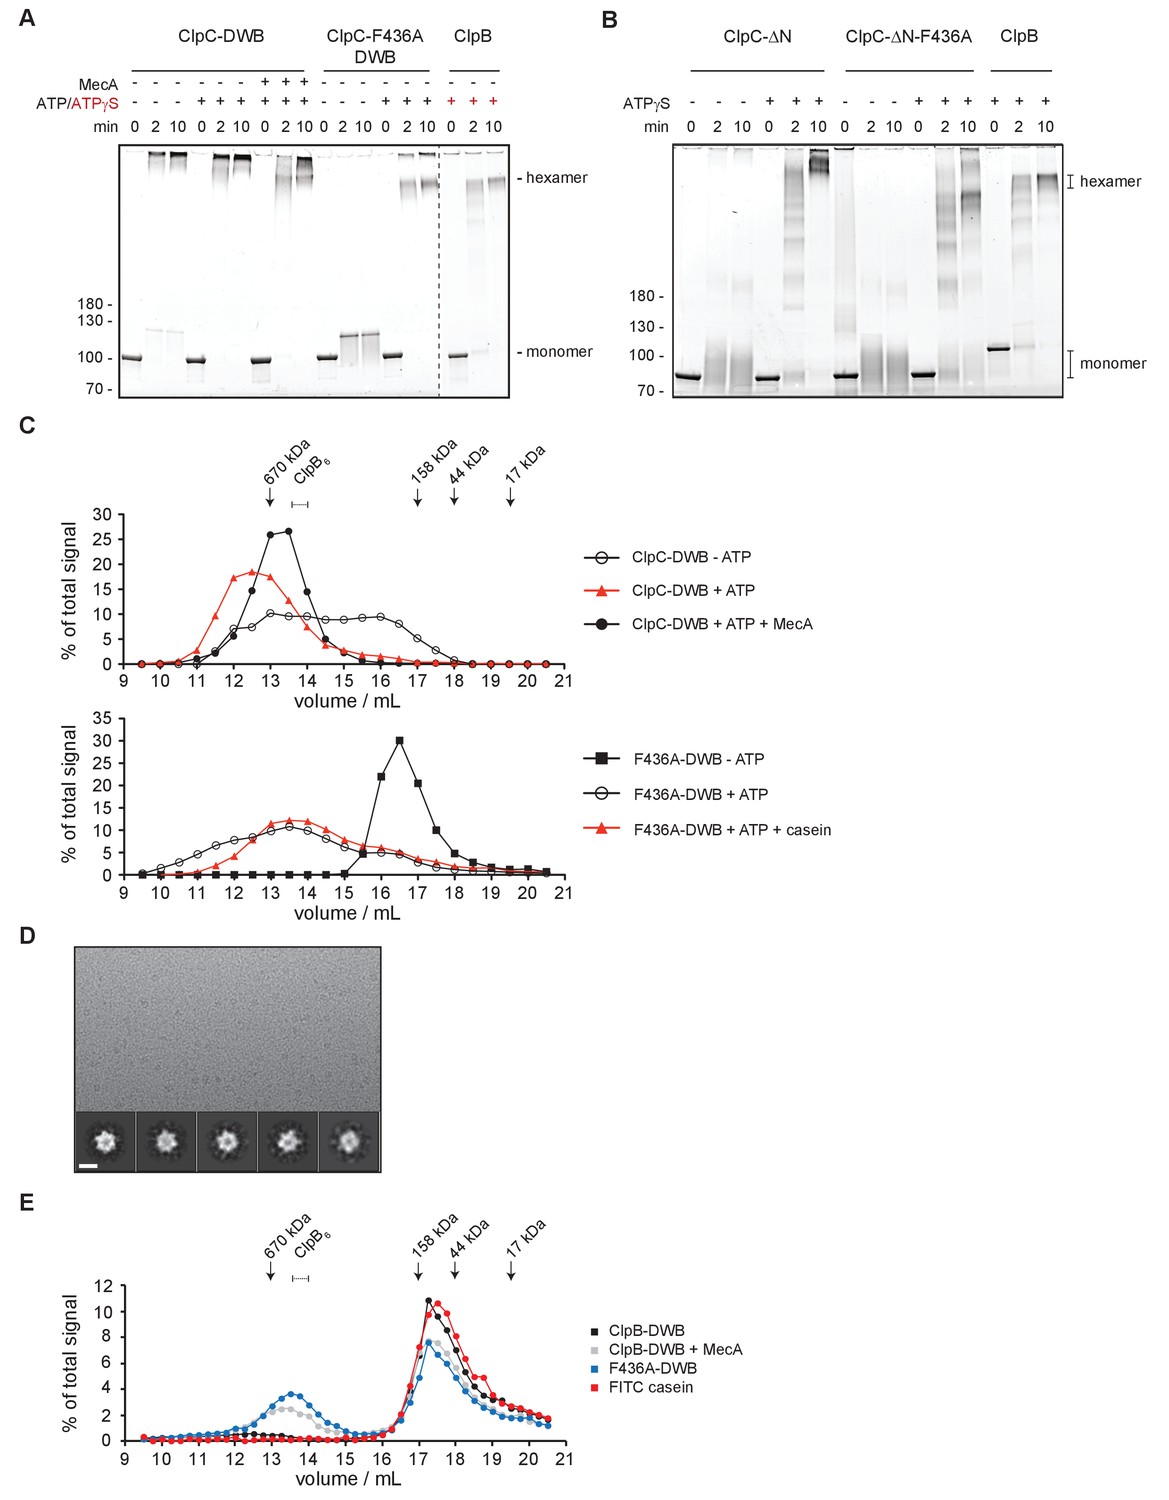
ClpC forms a large, inactive resting state that is sensitive to MecA and MD mutation.
(A) Glutaraldehyde crosslinking of ClpC-E280A/E618A (ClpC-DWB) and a respective MD mutant variant (F436A) was performed in absence and presence of ATP without and with MecA as indicated. Crosslinking of E. coli ClpB in presence of ATPγS served as reference defining crosslinked hexameric assemblies. Crosslink products were analyzed by SDS-PAGE. (B) Glutaraldehyde crosslinking of ΔN-ClpC and ΔN-ClpC-F436A was performed in absence and presence of ATPγS as indicated. Crosslinking of E. coli ClpB in presence of ATPγS served as reference defining crosslinked hexameric assemblies. Crosslink products were analyzed by SDS-PAGE. (C) Oligomeric states of ClpC-DWB and ClpC-F436A-DWB were determined in absence and presence of ATP. Addition of MecA and casein is indicated. Elution fractions were analyzed by SDS-PAGE and quantified. Positions of peak fractions of a protein standard and ClpB-E279A/E678A hexamers (+ATP) are indicated. (D) Micrograph of ClpC-F436A sample in presence of casein (top). Examples of single particles are circled. 2D class averages of ClpC-F436A (bottom). Scale bar is 10 nm. (E) Binding of FITC-casein to ClpC-DWB and ClpC-F436A-DWB was analyzed in presence of ATP by size exclusion chromatography. FITC-casein fluorescence of elution fractions was quantified. Positions of peak fractions of a protein standard and ClpB-E279A/E678A hexamers (+ATP) are indicated.
Figure 5—figure supplement 1

MecA is crosslinked to a high molecular weight complex upon ClpC binding.
Glutaraldehyde crosslinking of MecA, ClpC-E280A/E618A (ClpC-DWB) and both proteins together was performed in presence of ATP. MecA crosslink products were analyzed by SDS-PAGE and immunoblot analysis using MecA-specific antibodies.
Figure 5—figure supplement 2
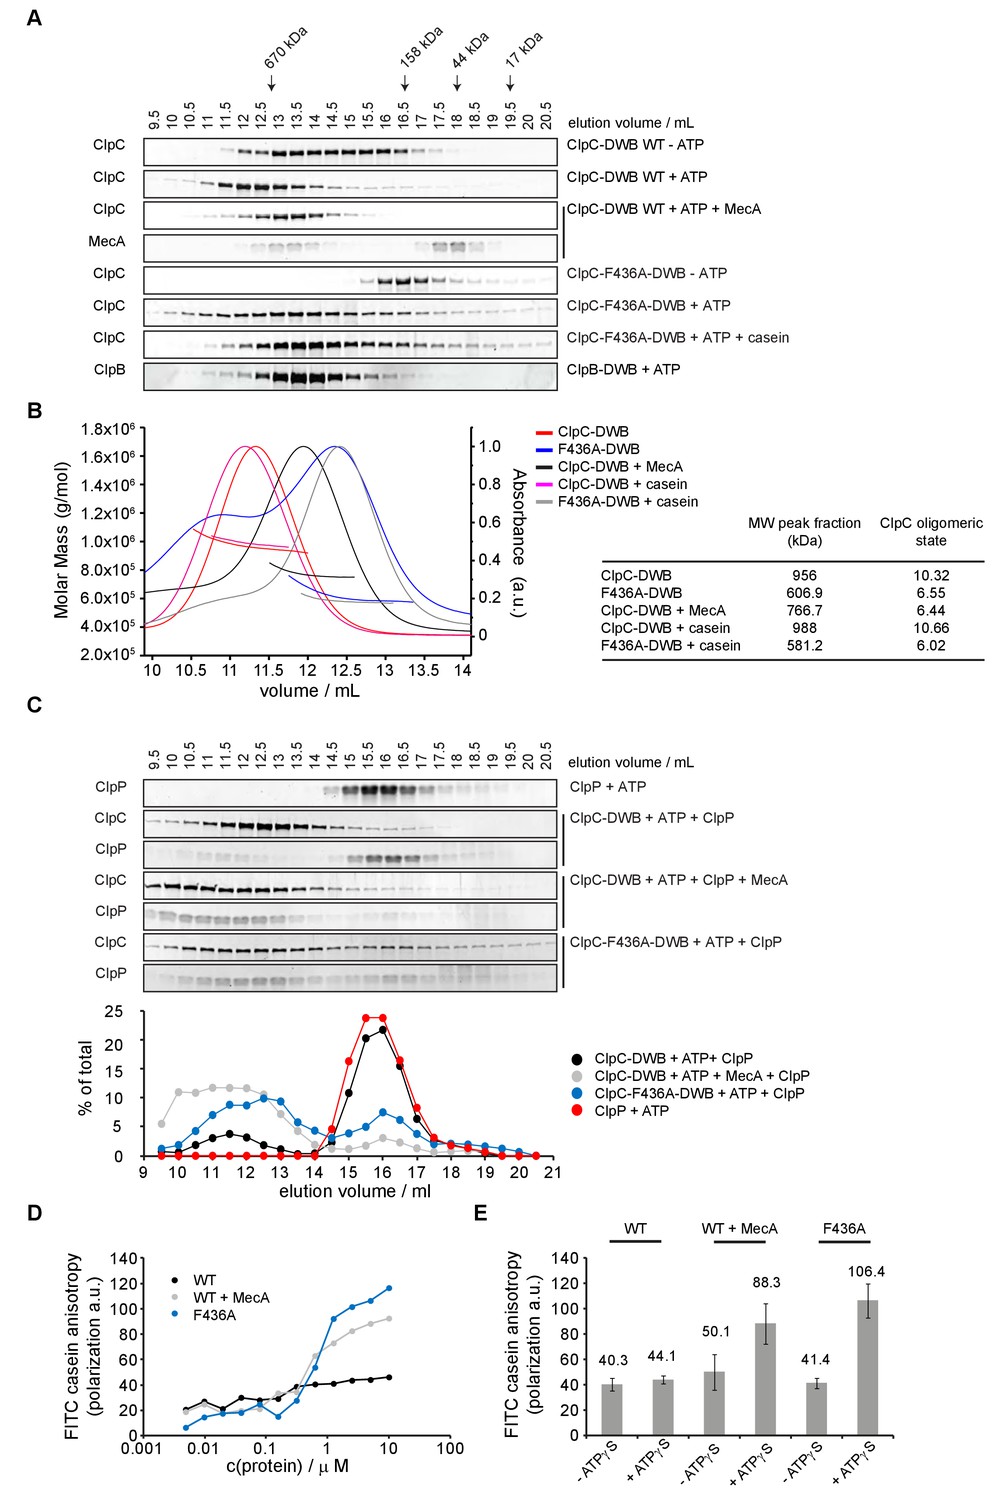
ClpC-ATP forms an inactive large resting state.
(A) Oligomeric states of ClpC-DWB and ClpC-F436A-DWB were determined in absence and presence of ATP by size exclusion chromatography (Superose6 HR10-30). Addition of MecA and casein is indicated. The elution profile of ATPase-deficient ClpB-E279A/E678A mutant (ClpB-DWB) served as reference for hexamer formation. Elution fractions were analyzed by SDS-PAGE. Positions of peak fractions of a protein standard are indicated. (B) ClpC-DWB and ClpC-F436A-DWB were subjected to size exclusion chromatography (Superose6 HR10-30). in presence of ATP. Addition of MecA and casein is indicated. Molar masses of complexes were determined by static light scattering measurements. Molecular weights (bold lines, left axis) and the scatter signal (thin lines, right axis) of complexes were plotted versus the elution volume. The determined molecular weight (Mw) of the peak fraction of the respective ClpC elution profiles and the derived ClpC oligomeric state (masses of MecA and casein were substracted) are given. (C) Complex formation between ClpP and ClpC-DWB or ClpC-F436A-DWB was analyzed by size-exclusion chromatography (Superose6 HR10-30). Addition of MecA is indicated. Elution fractions were analyzed by SDS-PAGE and quantified. (D) ClpC-F436A but not ClpC wild type efficiently binds substrate FITC-casein. Binding of ClpC wild type (WT) and ClpC-F436A to FITC-casein. Increasing concentrations of proteins were incubated with 0.1 μM FITC-casein in presence of 2 mM ATPγS and fluorescence polarization was recorded. Addition of MecA is indicated. (E) Binding of 5 μM ClpC wild type (WT) and ClpC-F436A to 0.1 μM FITC-casein in absence and presence of 2 mM ATPγS. Changes in fluorescence polarization were recorded.
Figure 5—figure supplement 3
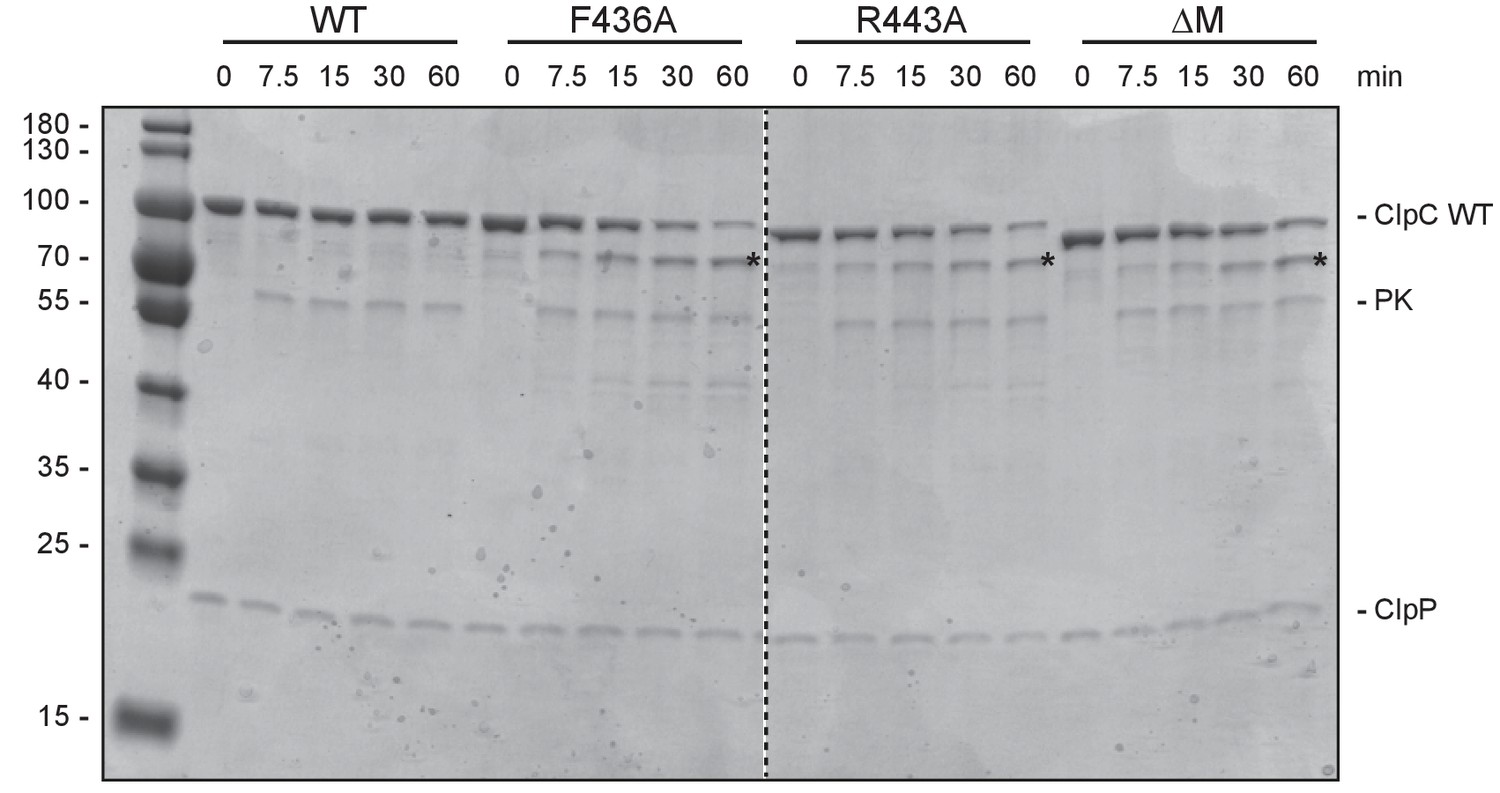
Autodegradation of ClpC MD mutants.
ClpC wild type (WT) and indicated MD mutants were incubated with ClpP and an ATP regenerating system. Samples were analyzed after ATP addition at the indicated time points by SDS-PAGE. A protein standard is given.
Figure 6 with 1 supplement

Loss of ClpC activity control is toxic in vivo.
(A) E. coli cells constitutively expressing S. aureus clpP and harboring the indicated plasmid-encoded clpC alleles under control of an IPTG-regulatable promoter were grown overnight at 30°C and adjusted to OD600 of 1. Serial dilutions (10−2 – 10−6) were spotted on LB plates containing the indicated IPTG concentrations and incubated at 30°C, 37°C or 40°C for 24 hr. (B) B. subtilis ΔclpC control cells and ΔclpC mutant cells harboring a clpC wild type (WT) or MD mutant (F436A) copy integrated at the amyE-locus under control of an IPTG-regulatable promoter were grown at 30°C to OD600 = 1. Serial dilutions (10−2 – 10−6) were spotted on LB plates without or with 100 μM IPTG and incubated at 30°C, 37°C or 50°C for 24 hr. (C) Sequence alignment of MDs from ClpC, ClpE and ClpL proteins. A highly conserved aromatic residue located at the tip of the coiled-coil structure is highlighted. (D) B. subtilis cells harboring an extra clpE wild type (WT) or MD mutant (Y344A) copy integrated at the amyE-locus under control of an IPTG-regulatable promoter were grown at 30°C to OD600 = 1. Serial dilutions (10−2 – 10−6) were spotted on LB plates without or with 100 μM IPTG and incubated at 30°C, 37°C or 50°C for 24 hr.
Figure 6—figure supplement 1
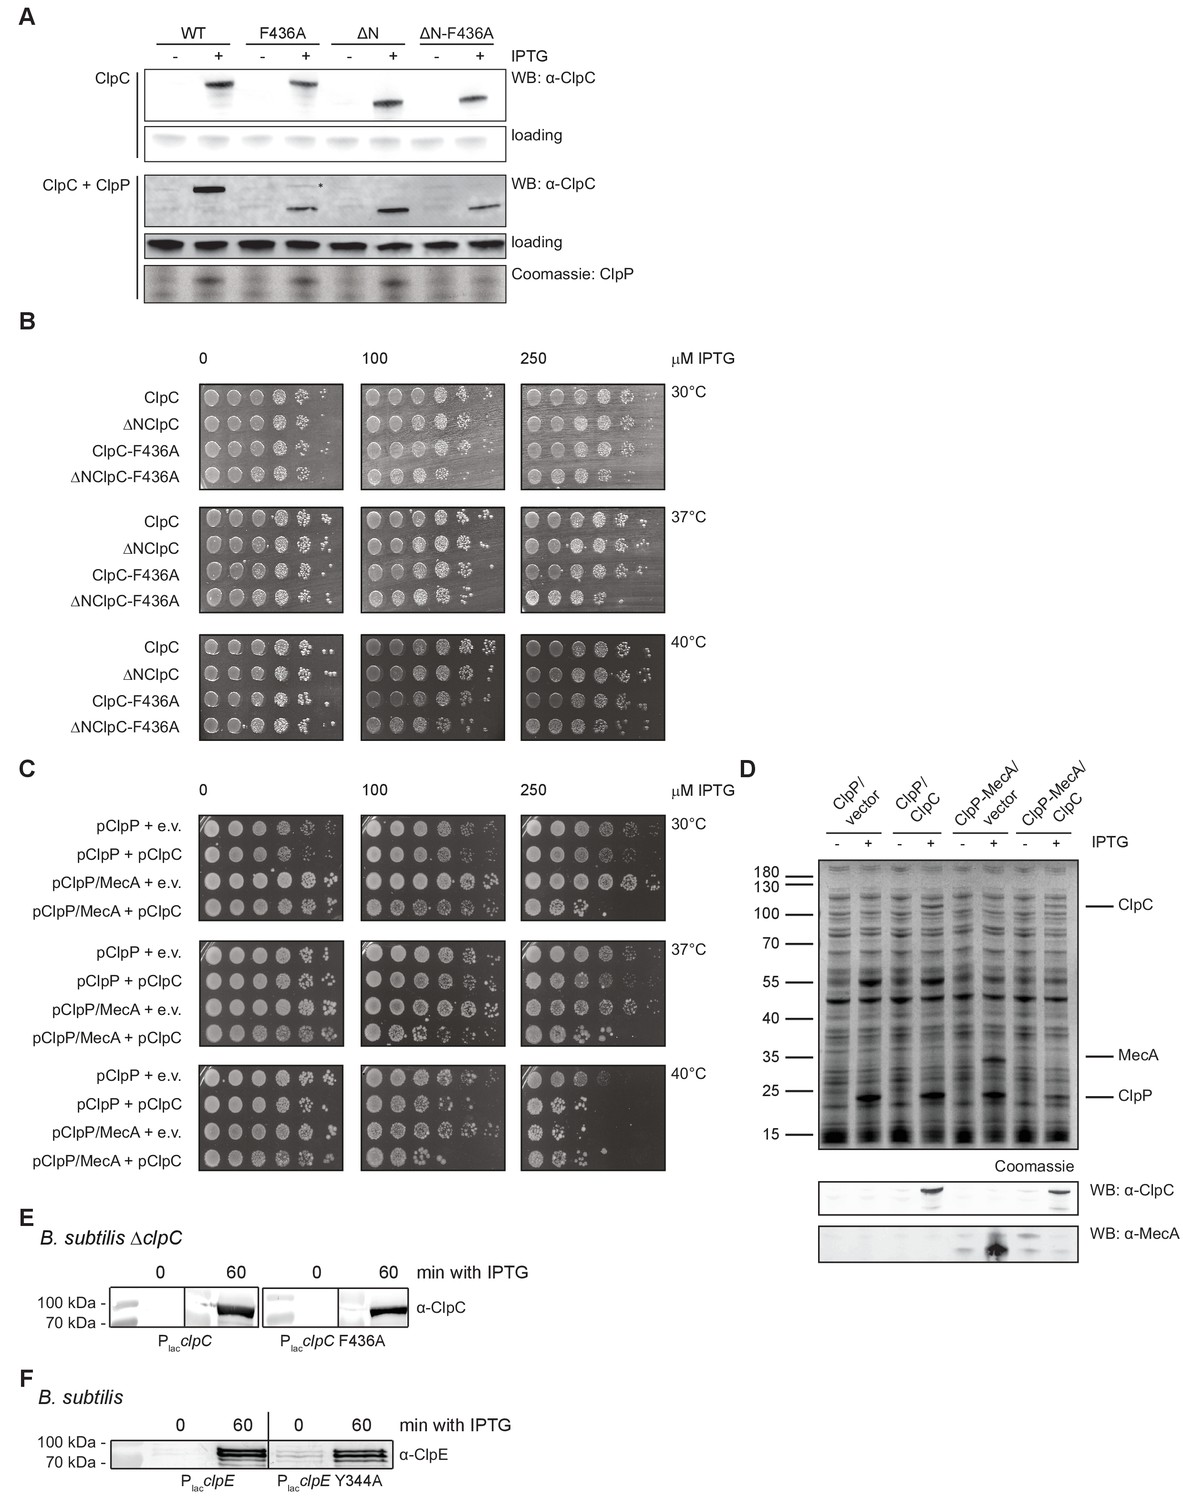
Expression of toxic ClpC MD mutants.
(A) E. coli cells expressing S. aureus clpP and harboring the indicated plasmid-encoded clpC alleles under control of an IPTG-regulatable promoter were grown at 30°C to mid-logarithmic growth phase. clpC expression was induced by addition of 250 μM IPTG. Total extracts were generated before and 1 hr after IPTG addition and ClpC levels were determined by immunoblot analysis using ClpC-specific antibodies. Antibodies were raised in rabbits against ΔN-ClpC. Band corresponding to fullength ClpC-F436A (+ClpP) is indicated by ‘*'. ClpP production was visualized by SDS-PAGE and Coomassie staining. (B) E. coli cells harboring the indicated plasmid-encoded clpC alleles under control of an IPTG-regulatable promoter were grown overnight at 30°C and adjusted to OD600 of 1. Serial dilutions (10−2 – 10−6) were spotted on LB plates containing the indicated IPTG concentrations and incubated at 30°C, 37°C or 40°C for 24 hr. (C) E. coli cells harboring plasmid-encoded clpP, mecA and clpC alleles under control of an IPTG-regulatable promoter were grown overnight at 30°C. Serial dilutions (10−1 – 10−6) were spotted on LB plates containing the indicated IPTG concentrations and incubated at 30°C, 37°C or 40°C for 24 hr. e.v.: empty vector control. (D) E. coli cells expressing S. aureus clpP or clpP and mecA and harboring either an empty vector or plasmid-encoded clpC under control of an IPTG-regulatable promoter were grown at 30°C to mid-logarithmic growth phase. Protein expression was induced by addition of 250 μM IPTG. Total extracts were generated before and 1 hr after IPTG addition and analyzed by SDS-PAGE and Coomassie staining. ClpC and MecA levels were additionally determined by immunoblot analysis. (E) B. subtilis ΔclpC cells harboring a clpC wild type (WT) or MD mutant (F436A) copy integrated at the amyE-locus under control of an IPTG-regulatable promoter were grown at 30°C to mid-logarithmic growth phase. clpC expression was induced by addition of 100 μM IPTG. Total extracts were generated before and 1 hr after IPTG addition and ClpC levels were determined by immunoblot analysis using ClpC-specific antibodies. (F) B. subtilis cells harboring an extra clpE wild type (WT) or MD mutant (Y344A) copy integrated at the amyE-locus under control of an IPTG-regulatable promoter were grown at 30°C to mid-logarithmic growth phase. clpE expression was induced by addition of 100 μM IPTG. Total extracts were generated before and 1 hr after IPTG addition and ClpE levels were determined by immunoblot analysis using ClpE-specific antibodies.
Figure 7
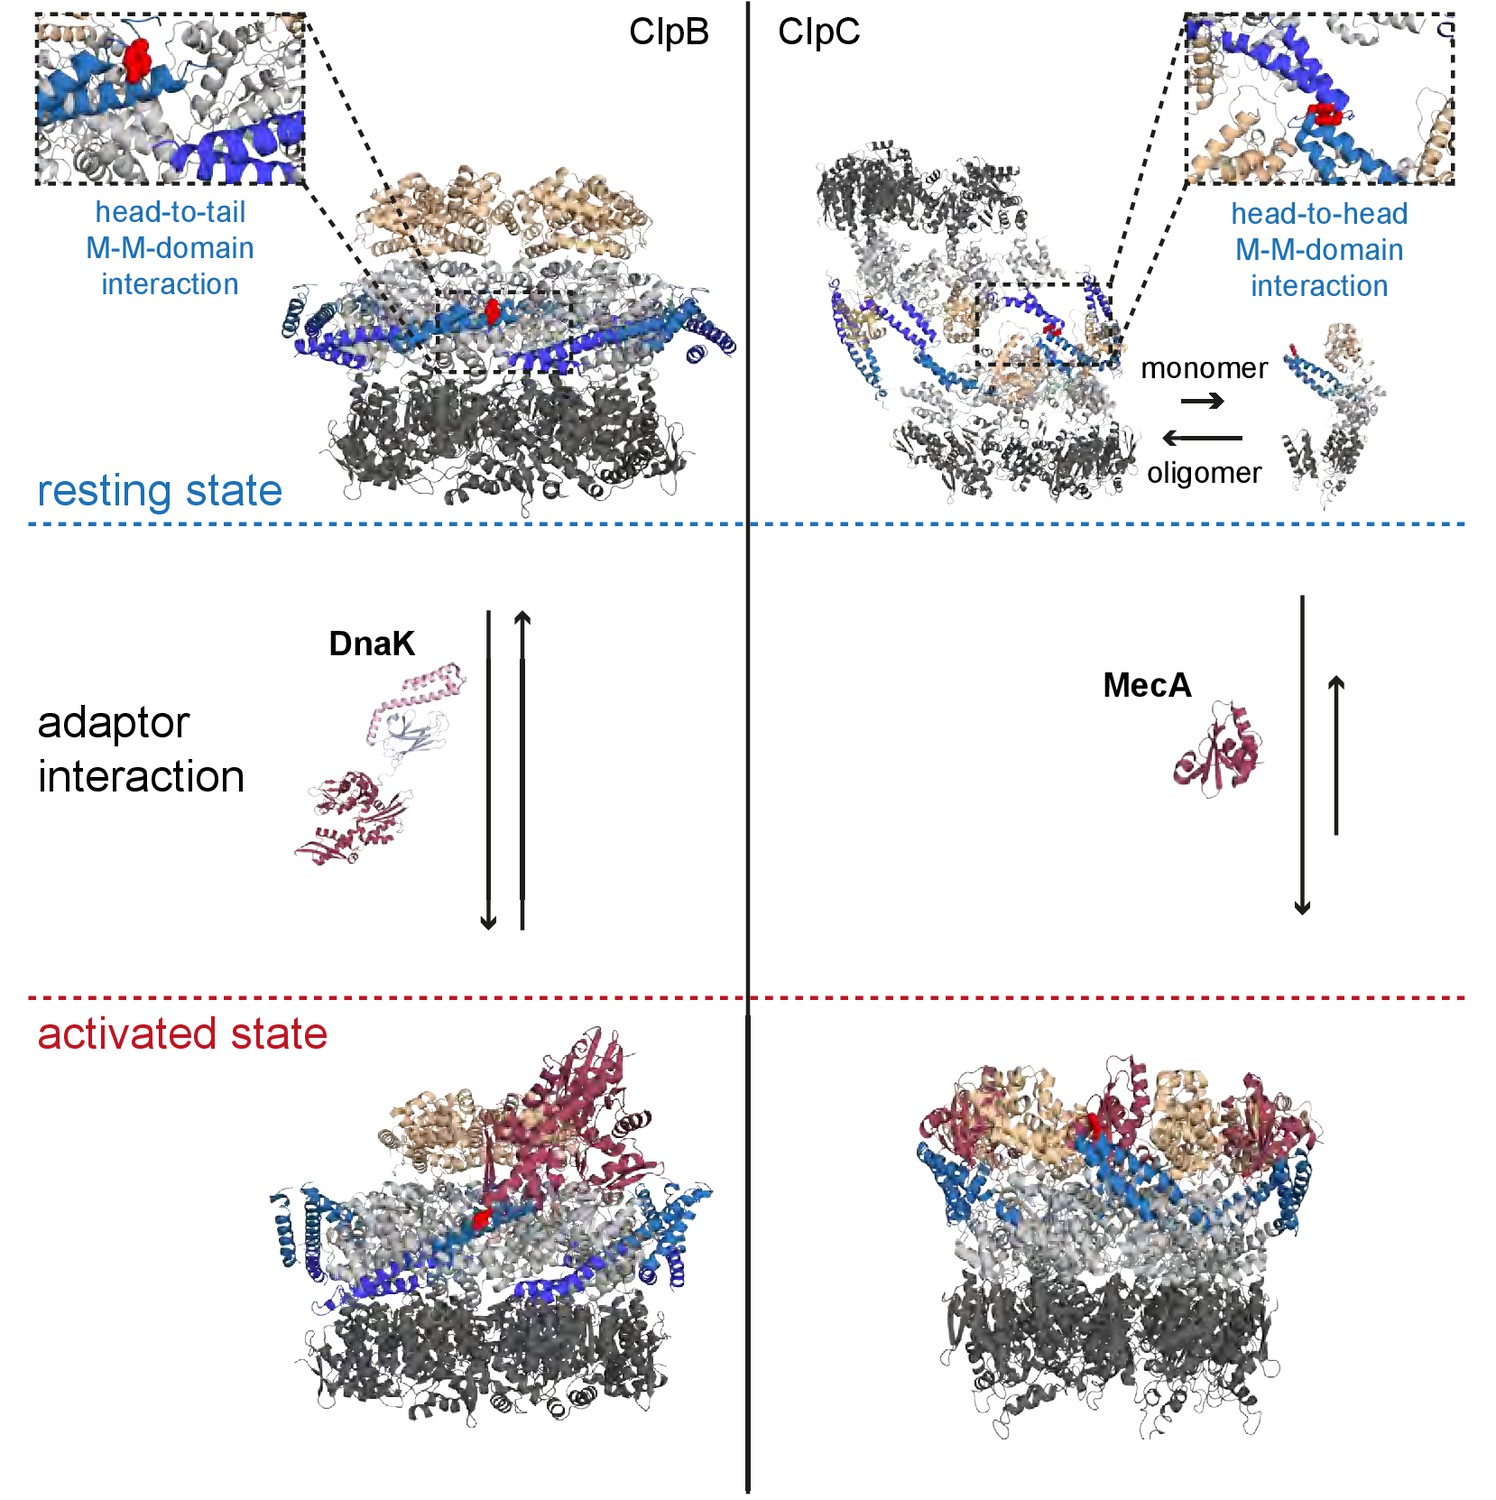
Regulatory coiled-coil MDs repress AAA+ protein activities by different mechanisms.
ClpB is kept in a low activity resting state by long MDs forming a repressive belt around the hexameric AAA ring. MDs are kept in place by head-to-tail interactions between adjacent coiled-coils. In contrast, the ClpC resting state is formed by head-to-head MD contacts, allowing for assembly of two open ClpC spirals. Adaptor proteins of ClpB (DnaK) and ClpC (MecA) break MD contacts by binding to MD sites crucial for MD interactions. This results in AAA+ protein activation by releasing MD repression on ATPase activity (ClpB) or allowing for formation of active hexamers (ClpC).
Author response image 1
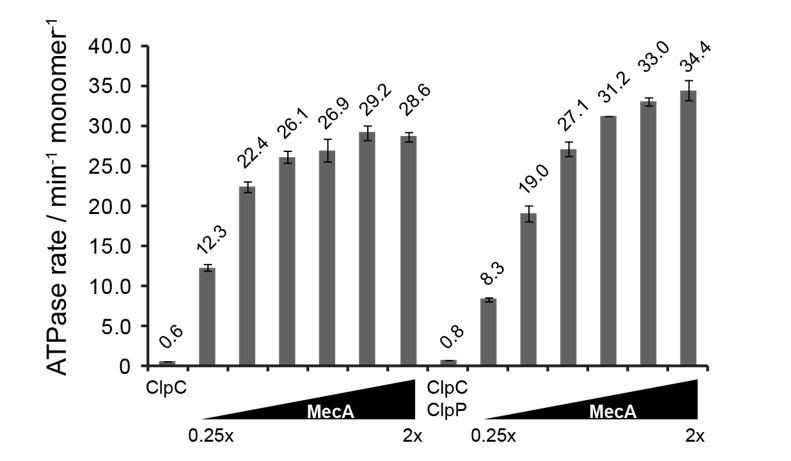
ATPase activity of ClpC (0.5 μM) was determined in presence of increasing MecA concentrations in absence and presence of ClpP (1.5 μM).
The ratio of MecA to ClpC is indicated. In this study ClpC ATPase stimulation by MecA was typically performed at 1.5x excess of MecA.
Author response image 2
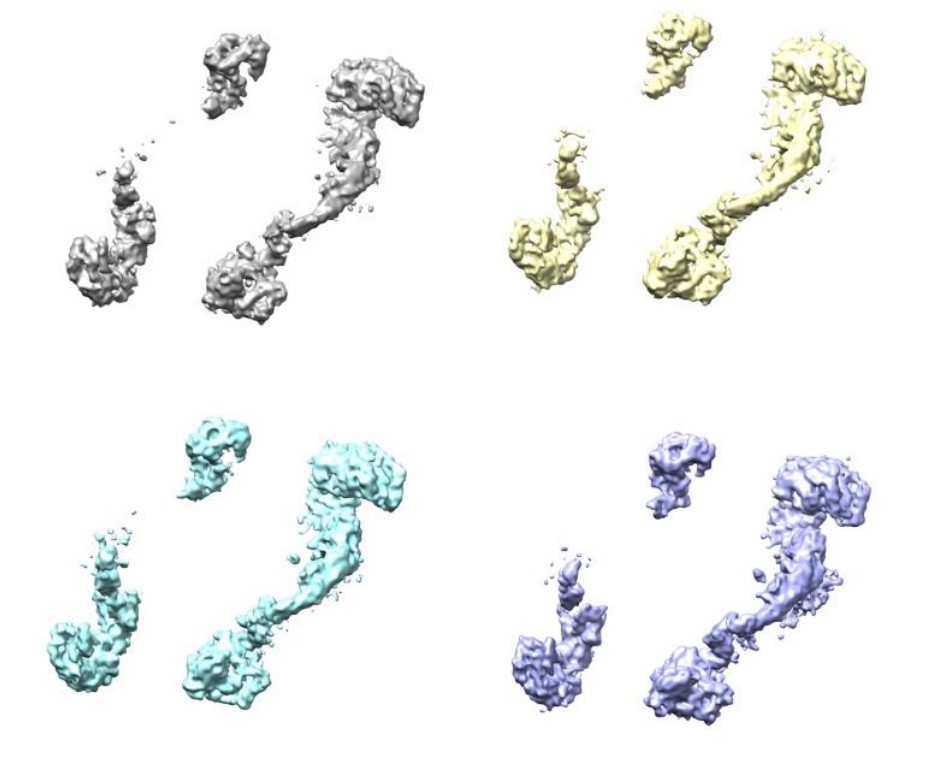
Four classes were generated after 3D focused classification with signal subtraction of the ClpC resting state periphery.
Author response image 3
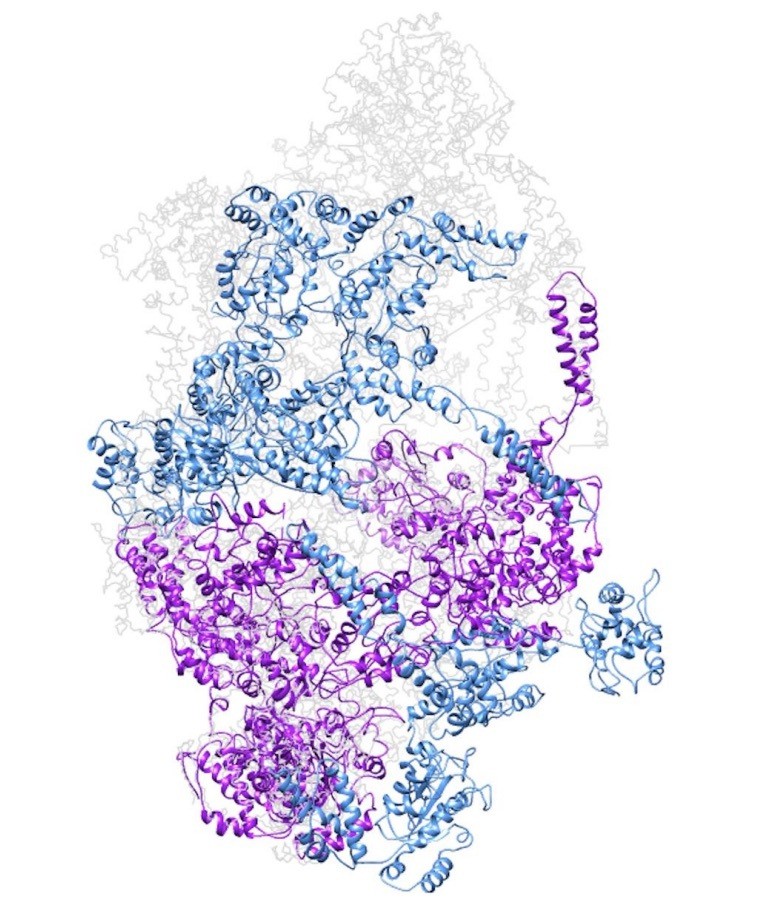
Model of a closed ClpC double-helix generated by applying helical parameters.
In magenta are protomers for which there is some missing density in the cryo-EM map (either missing the N-terminus or small AAA subdomains). In dark cyan are protomers completely generated by applying the helical parameters.
Author response image 4
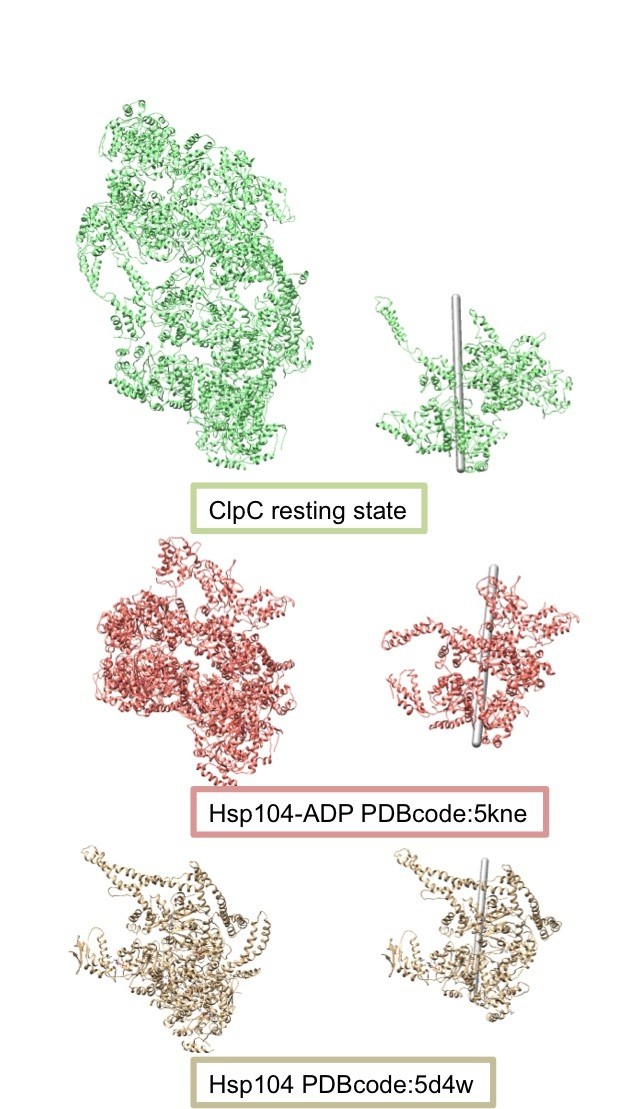
Comparison of the helical assemblies of the ClpC resting state and the AAA+ disaggregase Hsp104.
Images on the left show the full helical assembly and images on the right show two adjacent protomers with the helical axes.
Author response image 5
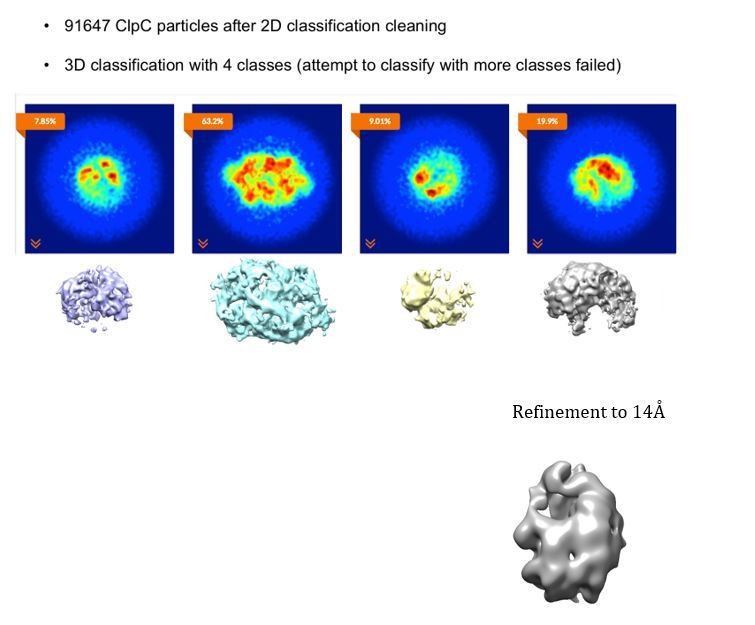
3D classification of the ClpC dataset after cleaning via 2D classification.
Additional files
-
Transparent reporting form
- https://doi.org/10.7554/eLife.30120.022
Download links
A two-part list of links to download the article, or parts of the article, in various formats.
Downloads (link to download the article as PDF)
Open citations (links to open the citations from this article in various online reference manager services)
Cite this article (links to download the citations from this article in formats compatible with various reference manager tools)
Regulatory coiled-coil domains promote head-to-head assemblies of AAA+ chaperones essential for tunable activity control
eLife 6:e30120.
https://doi.org/10.7554/eLife.30120


