Associability-modulated loss learning is increased in posttraumatic stress disorder
- Virginia Tech Carilion Research Institute, United States
- Virginia Tech, United States
- IDG/McGovern Institute for Brain Research, Beijing Key Laboratory of Behavior and Mental Health, Peking–Tsinghua Center for Life Sciences, Peking University, China
- University of Hawaii, United States
- Salem Veterans Affairs Medical Center, United States
- Virginia Tech-Wake Forest University, United States
Figures
Figure 1
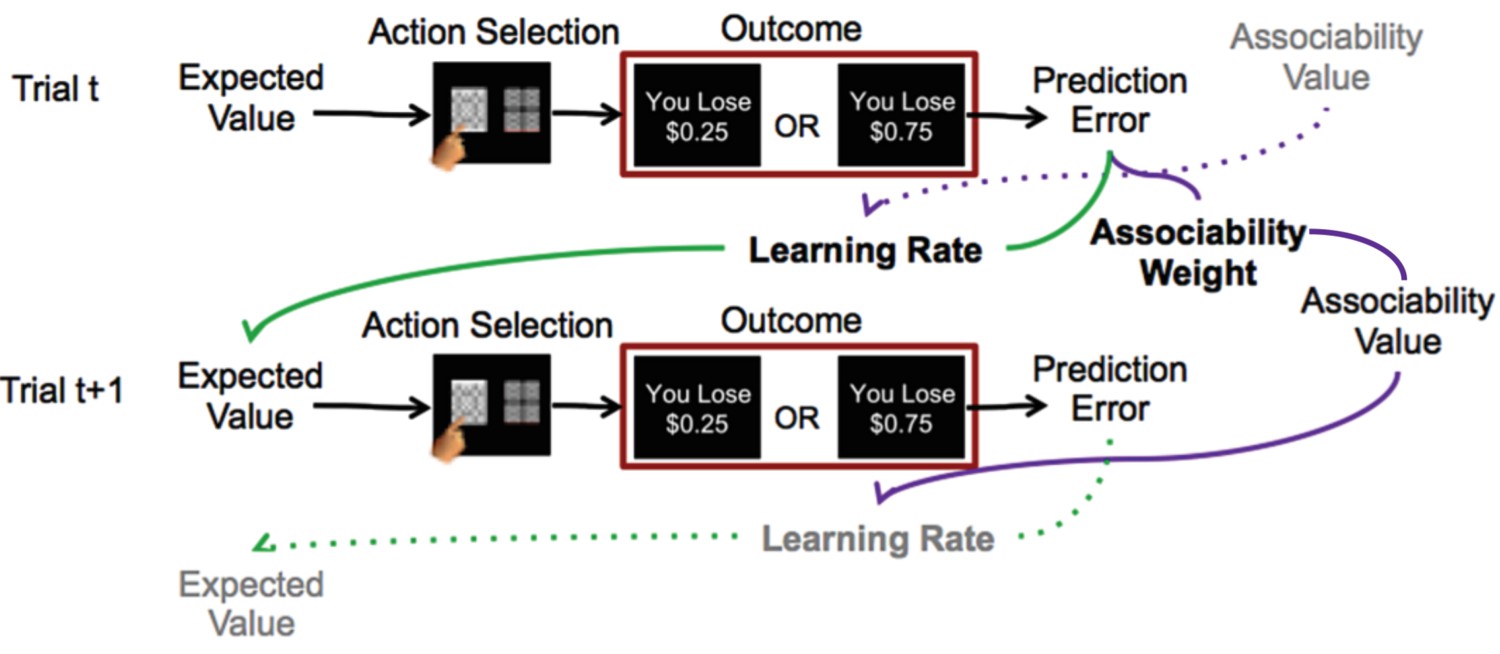
Reinforcement learning model.
Schematic description of reinforcement learning model. Participants choose between two stimuli, view the monetary outcome of the choice, and learn over time which is the ‘better’ option. A reinforcement learning model incorporating associability-modulated learning rate is illustrated here. Expected value is updated based on the static learning rate, the current trial’s prediction error, and the associability value from the previous outcome associated with the stimulus. Meanwhile, associability value is updated based on the static associability weight and the absolute value of the current trial’s prediction error. Green lines indicate the effect of prediction error through learning rate on expected value, while purple lines indicate the effect of prediction error through associability weight on associability value on the current trial, and then on learning rate on the subsequent trial. Thus, through trial-by-trial modulation of learning rates, associability values act as an attentional gate on learning. The task involved blocks consisting of all loss or all gain trials; loss trials are shown here as the model with associability fit well in this condition only.
Figure 2 with 1 supplement

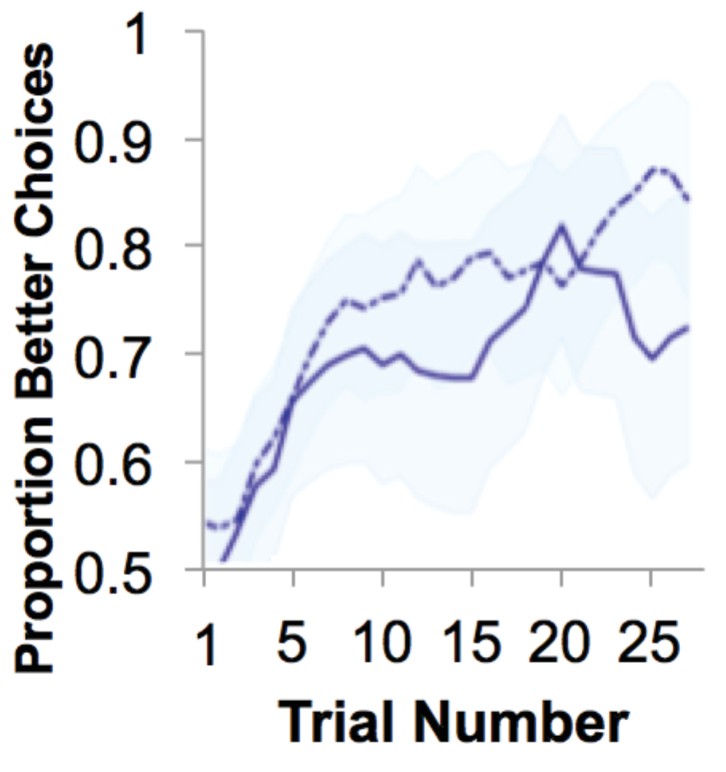
Behavioral performance and relationship to parameter estimates.
(a) Loss performance. Performance was quantified as proportion of choices that were the ‘better’ option. Over time, participants show learning (running average over five trials, averaged over all blocks; mean ± SE). Behavior is separated by diagnostic group, with veteran control (No PTSD) participants’ behavior marked by a solid line and the behavior of veterans with PTSD marked by a dotted line. (b) Plot of trial-by-trial associability value and prediction error for loss learning blocks, averaged across sets of five trials and across participants. Values are derived from the associability reinforcement learning model described in Figure 1 using each participant’s individually estimated parameter values and behavioral choices. As expected, a gradual reduction in average associability value and reduction of prediction error towards zero across trials is observed. As the initial expected value of each stimulus was set at 0, prediction errors are initially negative. During learning, prediction errors become distributed around, and converge toward, 0, indicating learning. Similarly, the initial associability value is set at one and decreases as outcomes become better predicted. Note that the probabilistic outcomes of this task ensure that outcomes are not completely predicted; this feature maintains variation in prediction error and retains the influence of associability value. As the task progresses, new blocks requiring new learning are more likely to occur, leading to an overall increase in associability value and prediction errors further from 0. Gain learning blocks did not fit the associability model well; figures related to gain learning are shown in Figure 2—figure supplement 1.
Figure 2—figure supplement 1
Gain learning performance.
Performance was quantified as proportion of choices that were the ‘better’ option. Over time, participants show learning (running average over five trials; averaged over all blocks; mean ± SE). Behavior is separated by diagnostic group, with veteran control participants’ behavior marked by a solid line and the behavior of participants with PTSD marked by a dotted line.
Figure 3 with 1 supplement
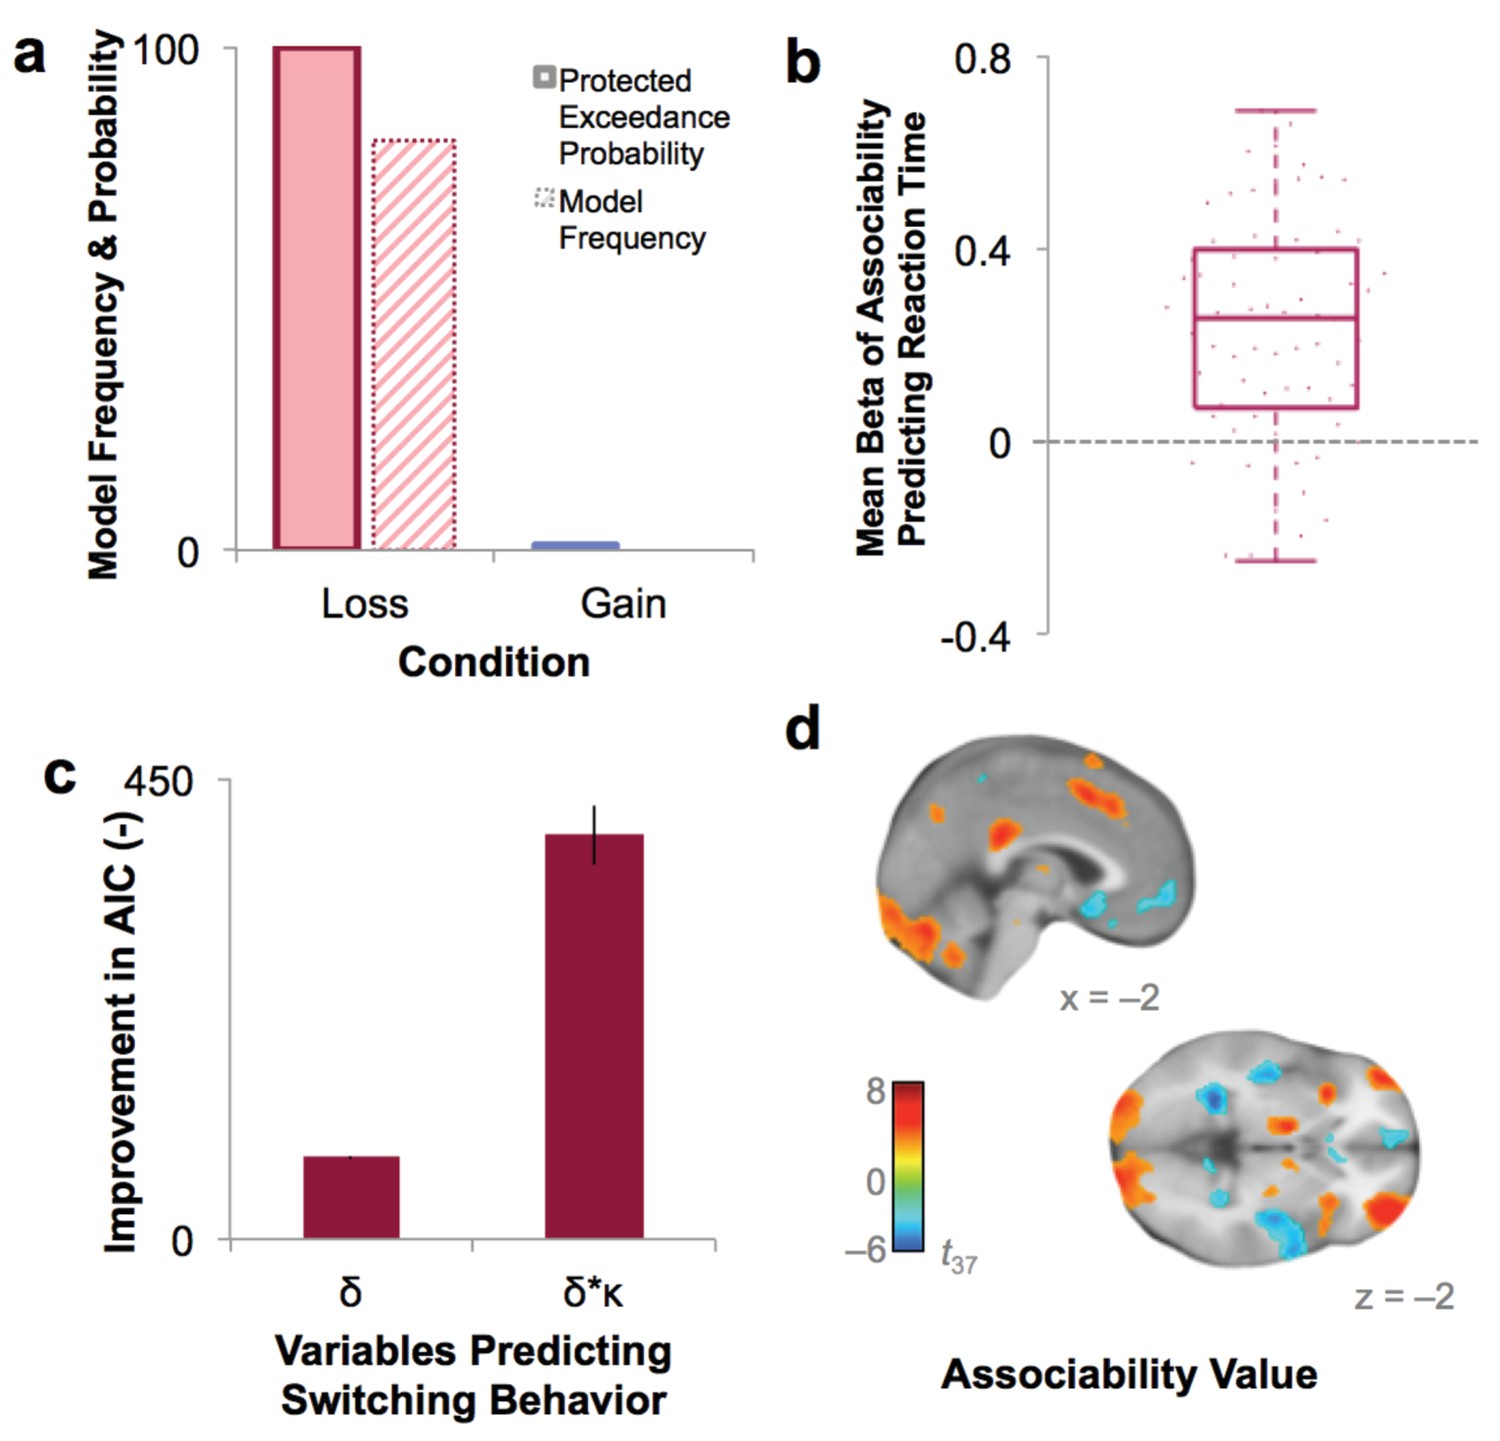
Model fit and relationship to behavior.
(a) Protected exceedance probability and model frequency calculated by Bayesian Model Selection for the model with versus without associability for loss and gain trials, showing an improvement in model fit when adding associability during loss learning only. (b) Average regression beta values per subject between trial-by-trial associability value (κ) and reaction time (controlling for expected value and trial number) show a positive relationship between model-estimated associability value and choice latencies. Dots are individual subjects’ beta values. (c) Prediction of switching behavior is improved when previous trial’s prediction error (δ) is modulated by associability value (κ; negative change in AIC for logistic regression predicting switching; δ and δ * κ model, each compared against basic outcome-only model; see Supplementary Materials and methods). Error bars represent subject-level standard errors based on a leave-one-out standard error estimation. (d) Associability signaling independent of PTSD and covariates, displayed at p<0.05 FDR corrected. First level regression of trial-by-trial associability values on neural activity at time of outcome. Second level (shown) of constant term of regression. Additional model confirmation analyses (relationship between associability weight parameter and performance, relationship between actual and predicted choices, and model parameter recovery) are in Figure 3—figure supplement 1.
Figure 3—figure supplement 1

Model confirmation analyses.
(a) Scatter plot of simulated data, showing performance (proportion of correct choices) at each associability weight value. Dots are means over simulated subjects, line is line of best fit and error bars are SEM. (b) Choices predicted by associability RL model versus actual choices (line is best fit line; binned in increments of 20% predicted probability; points are mean ± SE per subject). (c) Simulated and recovered model parameters, showing ability of model estimation approach to distinguish behavior based on different parameter values. Associability weight (top left), learning rate (top right), reward sensitivity (bottom left), and decay (bottom right) were simulated at three different values based on participants’ values.
Figure 4 with 1 supplement
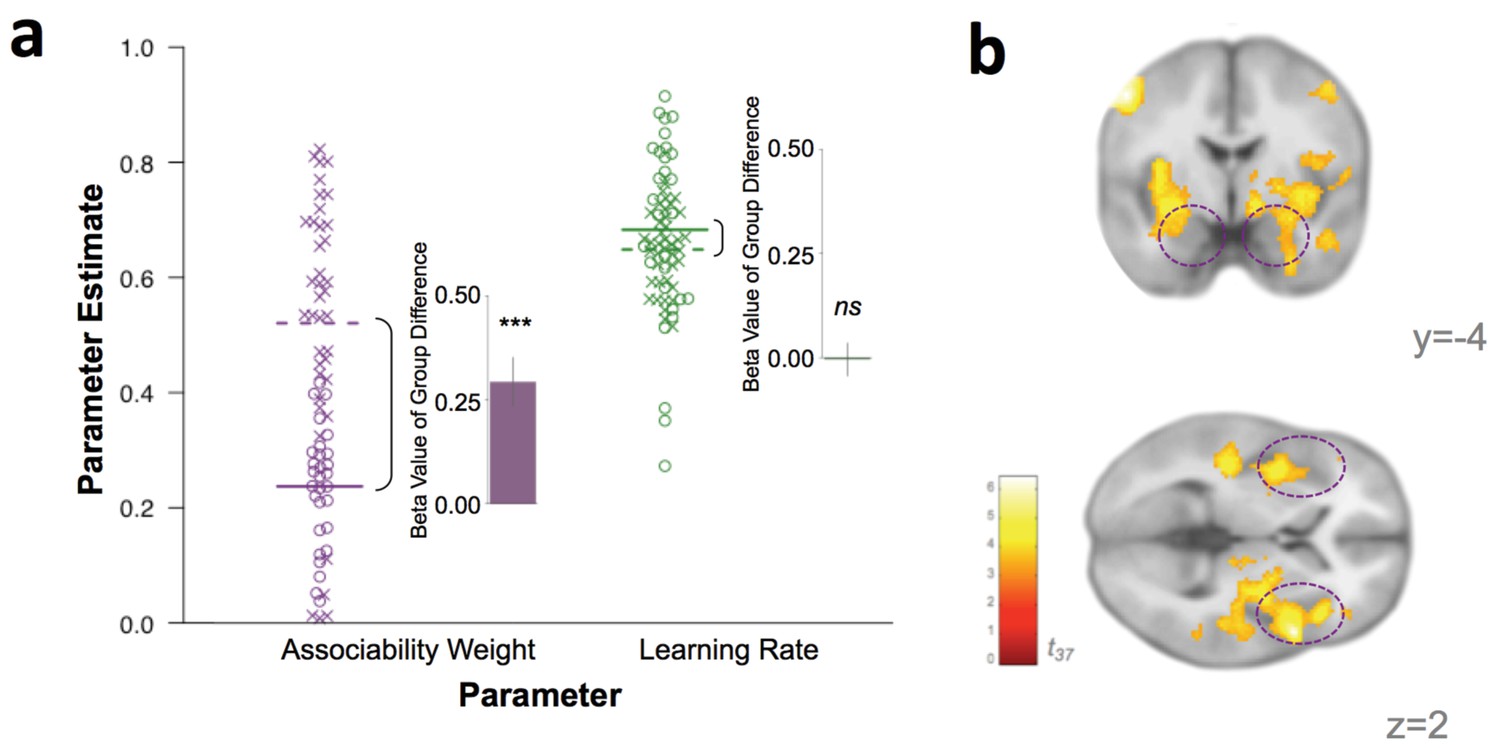
Behavioral and neural substrates of associability are increased with PTSD.
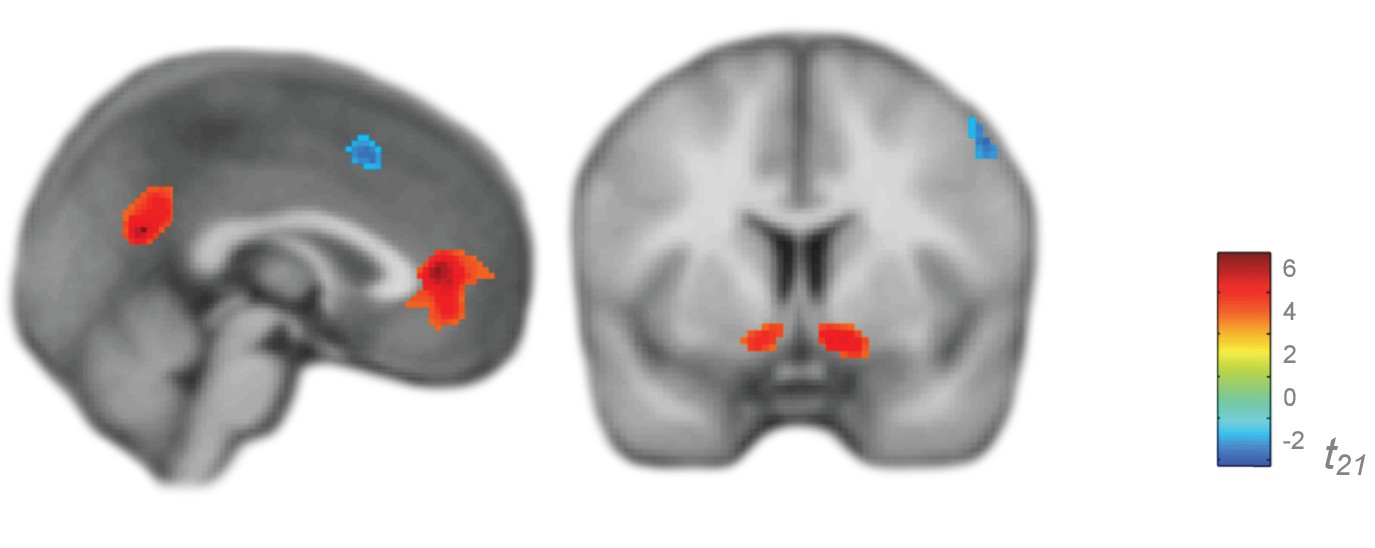
(a) Loss associability weight increases with PTSD while unmodulated learning rate does not (individual estimates for learning parameters: circles indicate control participants [mean: solid line] and X’s indicate participants with PTSD [mean: dotted line]; insets display regression beta values for PTSD diagnosis variable from linear regression predicting learning parameters; error bars represent SEM). (b) Neural effect of PTSD diagnosis on trial-by-trial associability value activation (cluster-level FDR p<0.05 whole brain corrected with a cluster forming threshold of p<0.001; t value of PTSD diagnosis on parametric modulator of associability value at outcome event). Dashed circles indicate amygdala and insula regions. Prediction error ROIs from an independent cohort used to test for prediction error differences in PTSD are shown in Figure 4—figure supplement 1.
Figure 4—figure supplement 1
Prediction error signaling in an independent non-trauma exposed reference cohort.
Activations used to create ROIs to test presence of relationship between PTSD diagnosis and prediction error-related ROI activation, thresholded at p<0.005 and k > 20. First level regression of trial-by-trial prediction error values on neural activity. Second level (shown) of constant term of regression. Neither whole brain prediction error analyses nor analyses within the ROIs displayed here showed an effect of PTSD; compare with the significant effect of PTSD on associability shown in main text Figure 4b.
Figure 5 with 2 supplements
PTSD symptom clusters of hyperarousal and avoidance/numbing have greatest neural and behavioral interaction with associability value.
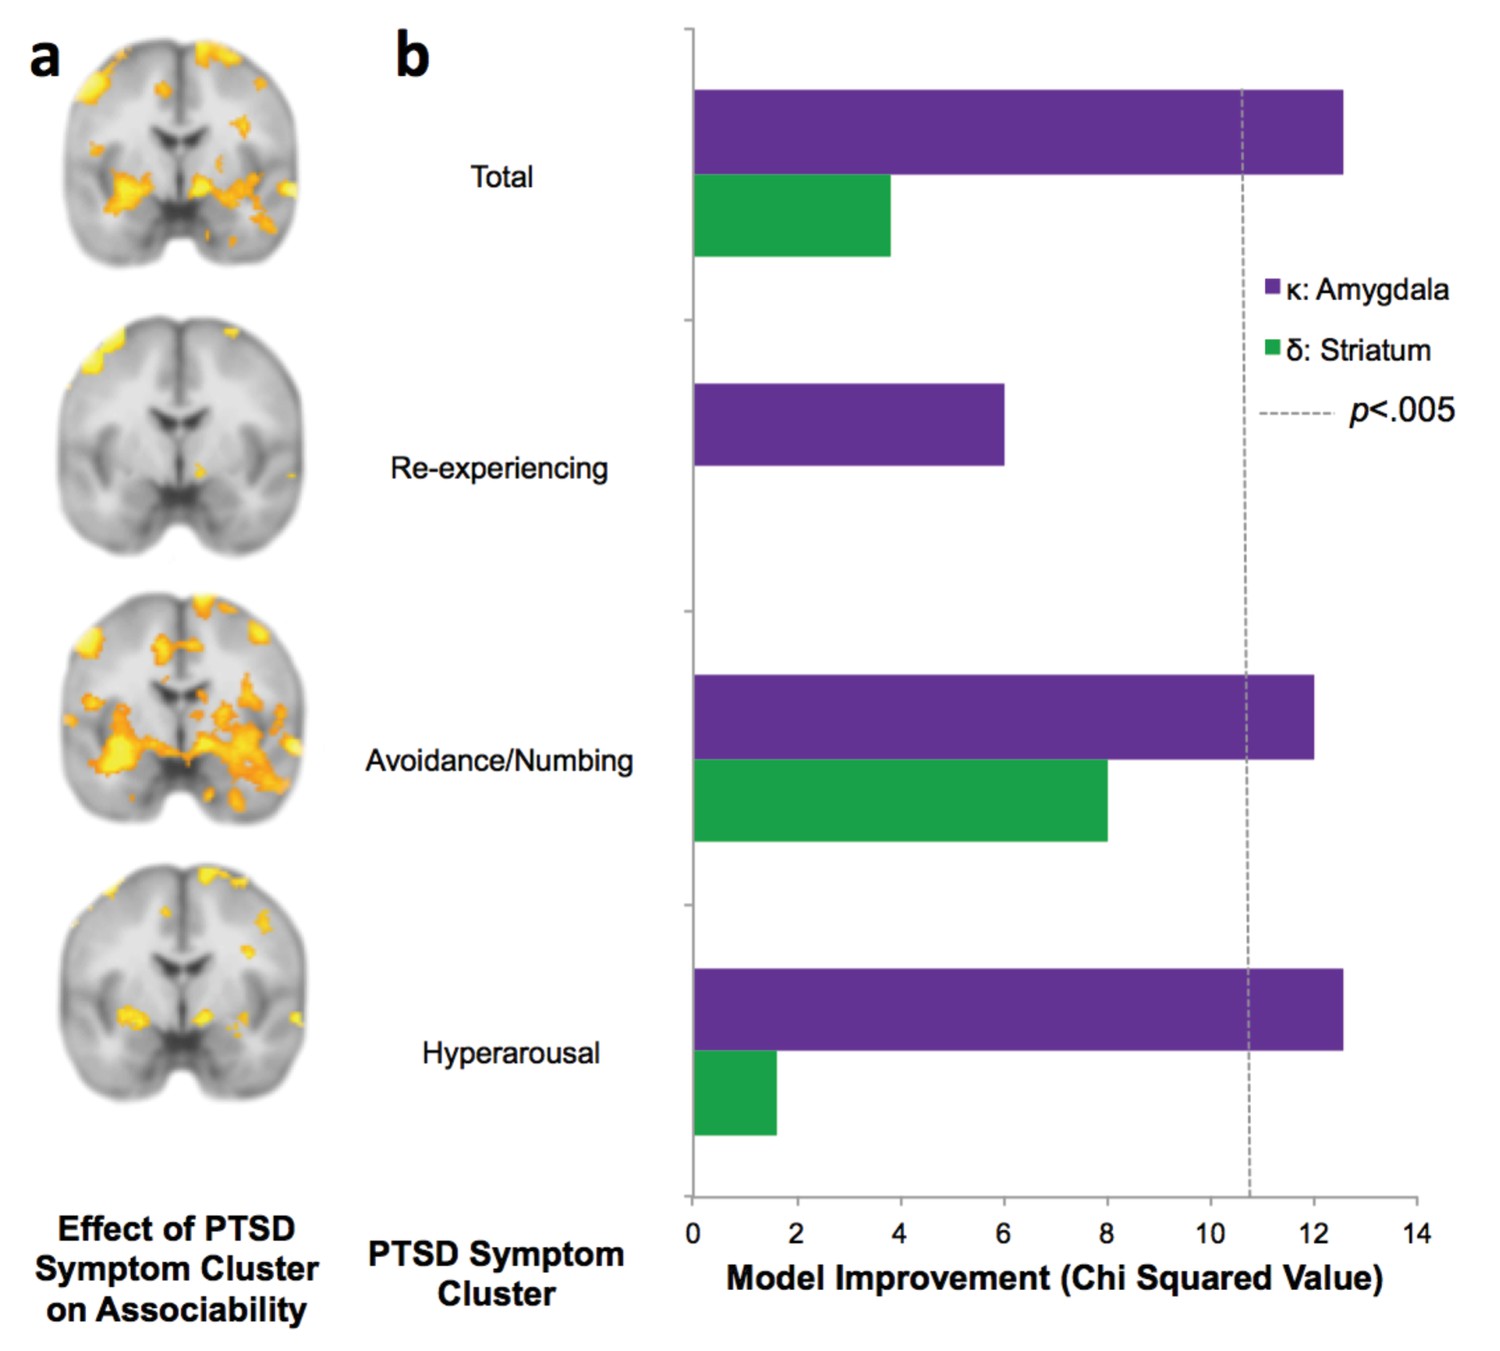
(a) Relationship of total PTSD symptoms (CAPS score) and PTSD symptom clusters to neural encoding of loss associability value (FDR p<0.05; displayed at p<0.005 uncorrected to allow equivalent thresholding across images). (b) Switching behavior is explained by interaction of PTSD symptom clusters and neural associability value activation for total CAPS, avoidance/numbing and hyperarousal. Bars indicate improvement in model fit when adding an interaction term of symptom cluster severity to a mixed effects logistic regression model predicting switching behavior by an interaction of previous outcome with neural activity; likelihood ratio test of model fit improvement; χ2 >10.60 indicates significant improvement at p<0.005 uncorrected for multiple comparisons [αBonferroni =.006]). Relationship of total PTSD symptoms and symptom clusters with prediction error; associability value and prediction error analyses with vmPFC and insula ROIs; and jackknife error distributions are shown in Figure 5—figure supplement 1. Interaction of amygdala and insula ROIs with previous outcomes and PTSD is illustrated in Figure 5—figure supplement 2.
Figure 5—figure supplement 1
Lack of relationship between prediction error signaling and PTSD.
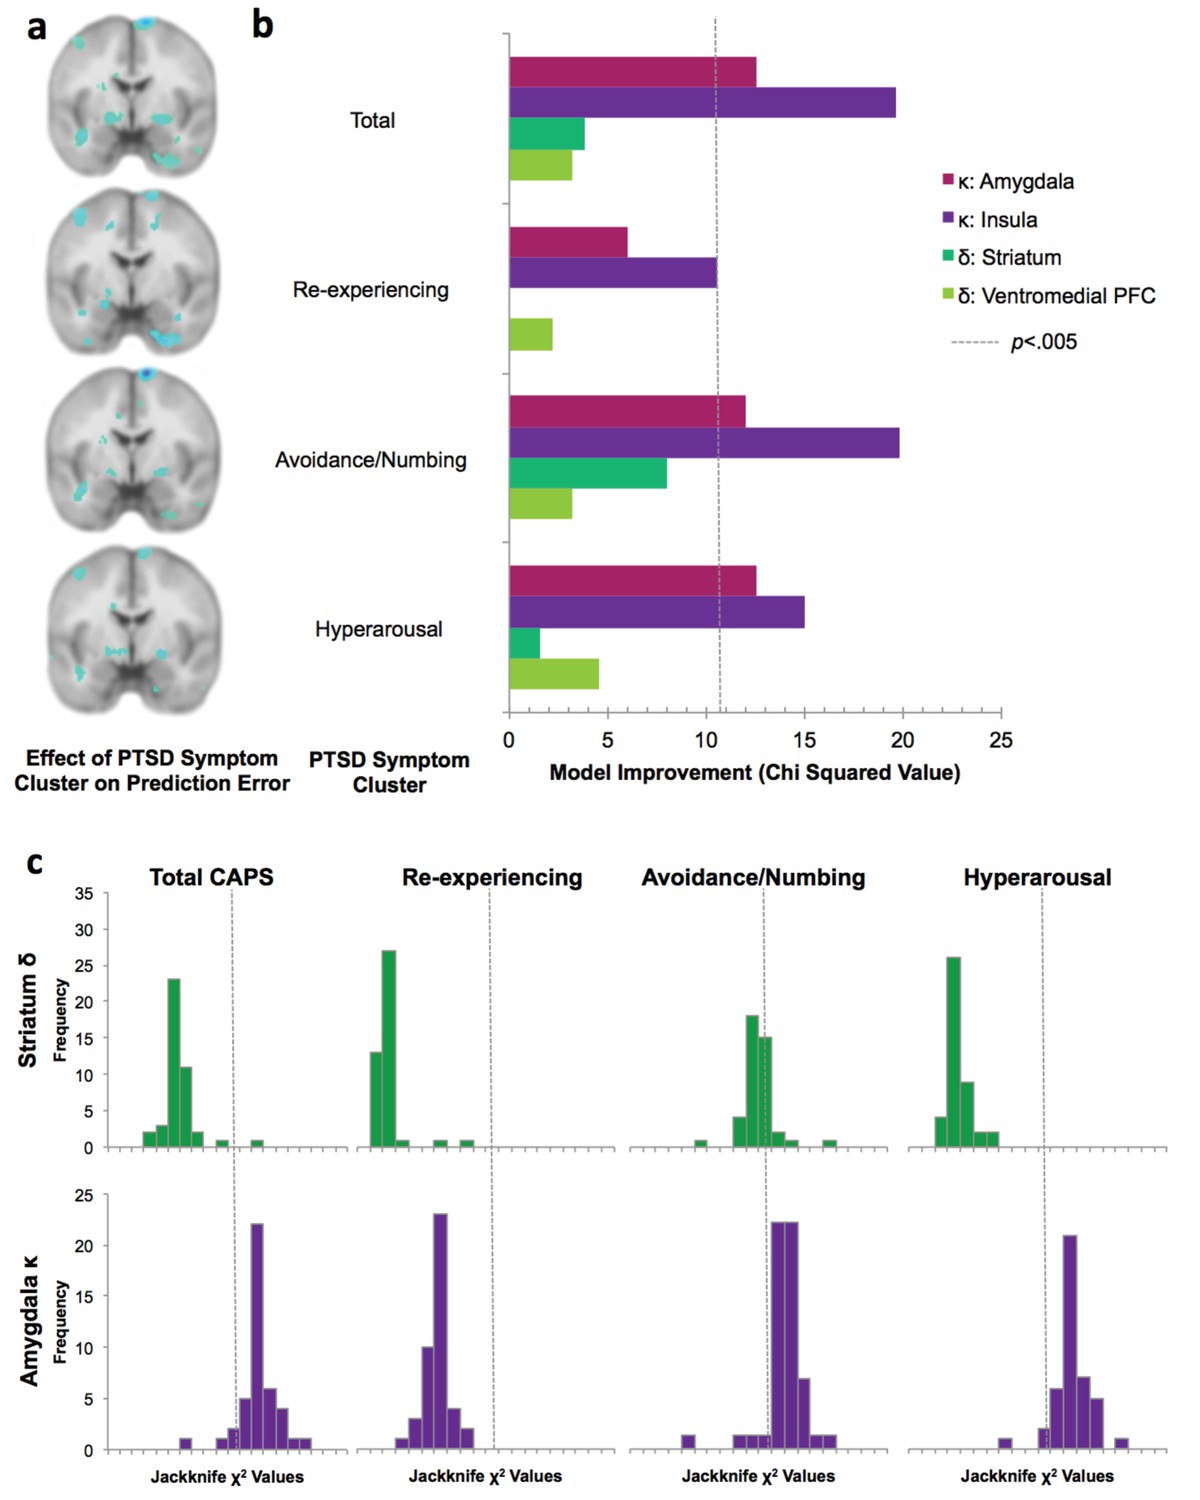
1a: Effect of PTSD diagnosis and each PTSD symptom cluster on loss prediction error and associability, displayed at p<0.005 uncorrected; compare with the effect of PTSD diagnosis and symptom clusters with associability displayed in Figure 5a. 1b: Switching behavior is explained by interaction of PTSD symptoms with neural associability values and not neural prediction error responses. Neural prediction error activation was extracted from striatum and ventromedial prefrontal cortex, and neural associability activation was extracted from amygdala and insula (see Supplementary Methods for details). This panel replicates Figure 5b with the addition of insula and vmPFC ROIs. Hierarchical logistic regression model predicting switching behavior by an interaction of previous outcome with neural prediction error in striatum or vmPFC, or with neural associability in amygdala or insula, with and without an additional interaction term of PTSD diagnosis or symptom cluster severity (likelihood ratio test of model fit improvement; χ2 2 >10.60 indicates significant improvement at p<0.005 uncorrected for multiple comparisons). 1 c: Jackknife estimates of chi squared values for likelihood ratio tests predicting switching based on adding PTSD diagnosis or symptom clusters to the interaction of prediction error-related striatum activity (first row) or associability value-related amygdala activity (secound row) with previous outcomes to predict switching. Jackknife estimates, which reflect between-subject variability, mirror the overall results presented in Figure 5b.
Figure 5—figure supplement 2
Plots of effects of neural responsivity to associability value.
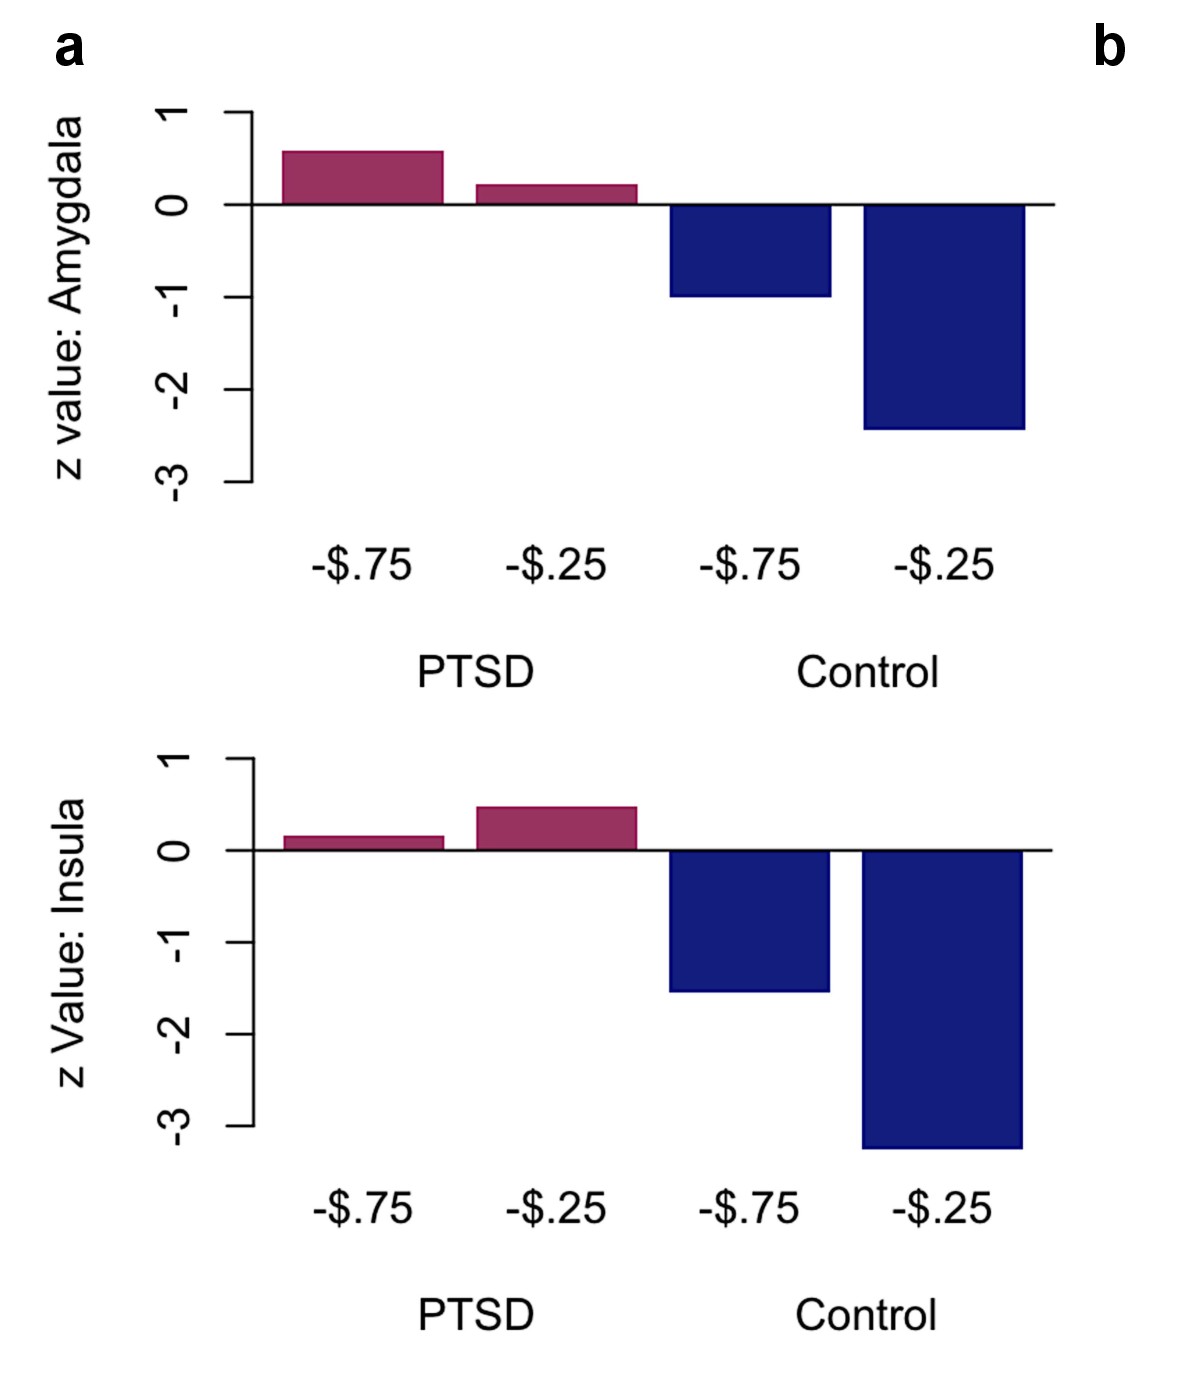
Effects of neural responsivity to associability value in (a) amygdala and (b) anterior insula predicting switching, divided by previous outcome level (large loss of 75 cents vs. small loss of 25 cents) and group (PTSD vs. control). Values shown are z values of the effect of neural responsivity in the multilevel logistic regression. This figure shows the effects in amygdala and insula for the interaction shown in Figure 5b.
Author response image 1
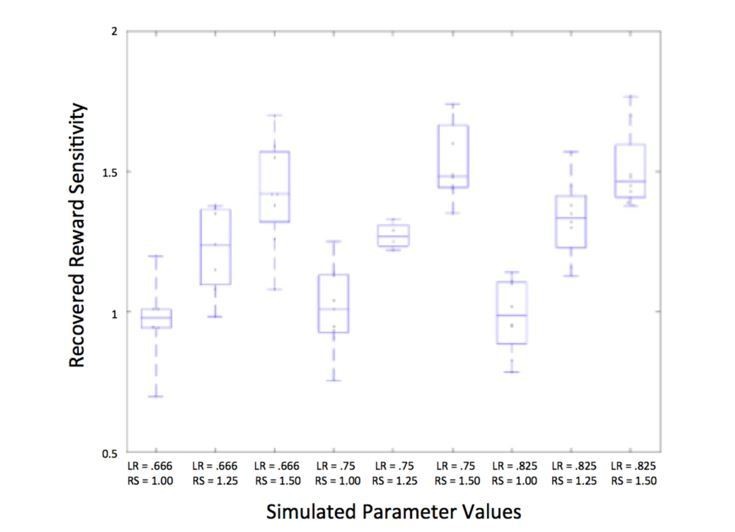
Identifiability of reward sensitivity and learning rate.
Learning rate (LR) and reward sensitivity (RS) were simulated at three levels (LR:.666,.75, and.825; RS: 1, 1.25, and 1.5), chosen based on the range of actual participants’ values; additional parameters of associability weight and unchosen learning rate were also simulated at three levels, resulting in 81 different combinations of parameters. The average recovered parameter value for each combination of learning rate and reward sensitivity is plotted above, showing that reward sensitivity is recovered well at each level of learning rate.
Author response image 2

Unsigned prediction error signal independent of PTSD.
Neural signaling of unsigned
Additional files
-
Supplementary file 1
Supplementary Tables 1A through 1I.
(A) Table 1A. Demographic and clinical characteristics of veteran sample (N = 68). Table 1A legend: amean ± SE; t-test; bnumber (%); χ2 test. CAPS: Clinician Administered PTSD Scale; BDI: Beck Depression Inventory; CES: Combat Exposure Scale; WTAR: Wechsler Test of Adult Reading. (B) Table 1B. fMRI activation clusters for loss associability independent of covariates of PTSD, BDI, CES, age, and gender (intercept term; associated with Figure 3d). (C) Table 1C. fMRI activation clusters for loss associability correlation with PTSD diagnosis; covariates of BDI, CES, age, and gender (associated with Figure 4b). Table 1C legend: Italicized peaks are local maxima in separate anatomical regions > 4 mm apart. (D) Table 1D. fMRI activation clusters for loss associability correlation with PTSD symptom severity (total CAPS score); covariates of BDI, CES, age, and gender (associated with Figure 5a). Table 1D legend: Italicized peaks are local maxima in separate anatomical regions > 4 mm apart. (E) Table 1E. fMRI activation clusters for loss associability correlation with hyperarousal; covariates of BDI, CES, age, and gender (associated with Figure 5a). (F) Table 1F. fMRI activation clusters for loss associability correlation with avoidance/numbing; covariates of BDI, CES, age, and gender (associated with Figure 5a). Table 1F legend: Italicized peaks are local maxima in separate anatomical regions > 4 mm apart. (G) Table 1G. fMRI activation clusters for loss associability correlation with re-experiencing; covariates of BDI, CES, age, and gender (associated with Figure 5a). (H) Table 1H. fMRI activation clusters for loss associability correlation with PTSD diagnosis with associability value entered as a second parametric modulator after prediction error; covariates of BDI, CES, age, and gender (associated with Figure 4b). (I) Table 1I. fMRI activation clusters for loss associability correlation with PTSD diagnosis; covariates of BDI, CES, age, and gender, thresholded FWE p<0.05 using permutation testing (associated with Figure 4b)
- https://doi.org/10.7554/eLife.30150.013
-
Transparent reporting form
- https://doi.org/10.7554/eLife.30150.014
Download links
A two-part list of links to download the article, or parts of the article, in various formats.
Downloads (link to download the article as PDF)
Open citations (links to open the citations from this article in various online reference manager services)
Cite this article (links to download the citations from this article in formats compatible with various reference manager tools)
Associability-modulated loss learning is increased in posttraumatic stress disorder
eLife 7:e30150.
https://doi.org/10.7554/eLife.30150


