Injury-induced perivascular niche supports alternative differentiation of adult rodent CNS progenitor cells
- Justyna Ulanska-Poutanen

- Jakub Mieczkowski
- Chao Zhao
- Katarzyna Konarzewska
- Beata Kaza
- Lukasz Bugajski
- Bozena Kaminska
- Robin JM Franklin
- Malgorzata Zawadzka
- Nencki Institute of Experimental Biology, Polish Academy of Sciences, Poland
- University of Cambridge, United Kingdom
- Institute of Molecular Health Sciences, Switzerland
Figures
Figure 1 with 2 supplements
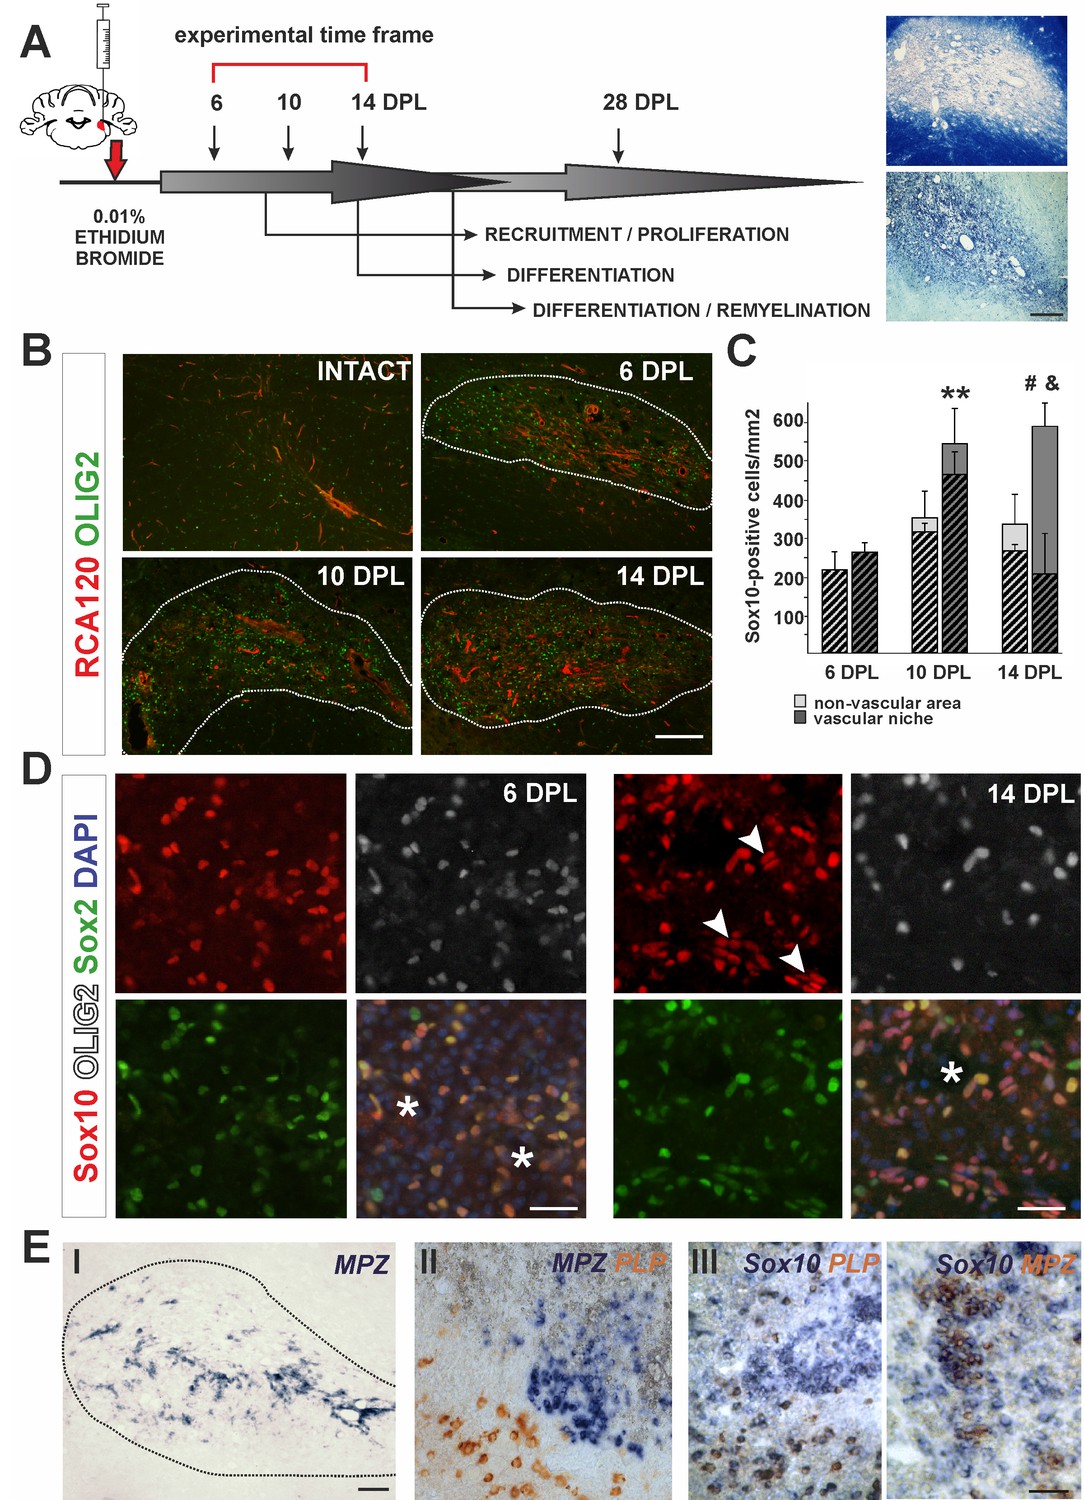
The cellular composition of VN differs from non-VN during remyelination.
(A) Schematic description of OPCs response to focal demyelination in rat CCP. Note the well-defined phases: recruitment of OPCs, their proliferation and differentiation (6, 10 and 14 dpl). Images show lesion area identified by detection of myelin (upper image) and cellularity (lower image, scale bar 200 μm). (B) Representative images of blood vessels (RCA120, red) and Olig2+ cells (green) distribution after CCP demyelination, scale bar 200 μm, lesion depicted by dotted line. (C) Sox10+ cells quantification, Student’s t-test; **p<0.01 significant difference between VN at 6 dpl and 10 dpl as well as between VN and non-VN at 10 dpl; #p<0.05, significant difference between VN at 10 dpl and VN at 14 dpl; n = 3; shaded bars show the number of Olig2+ among Sox10+ cells. The proportion of Olig2- cells among Sox10+ cells within VN increases sharply between 10 dpl and 14 dpl (Student’s t-test; and p<0.001; n = 3). (D) Sox10+ cells remain Sox2+ regardless the Olig2 status (Sox10+/Sox2+/Olig2- cells arrowheads, blood vessels asterisk, scale bar 20 μm). (E) SCs-mediated remyelination is restricted to the VN niche as shown by in situ hybridization for MPZ (I, scale bar 100 μm). Double ISH shows mutually exclusive and spatially separated pattern of MPZ and PLP transcripts (II, scale bar 20 μm). MPZ and PLP is clearly detectable as separable cell populations among Sox10+ cells in defined areas within remyelinated CNS lesions (III, scale bar 20 μm).
Figure 1—figure supplement 1
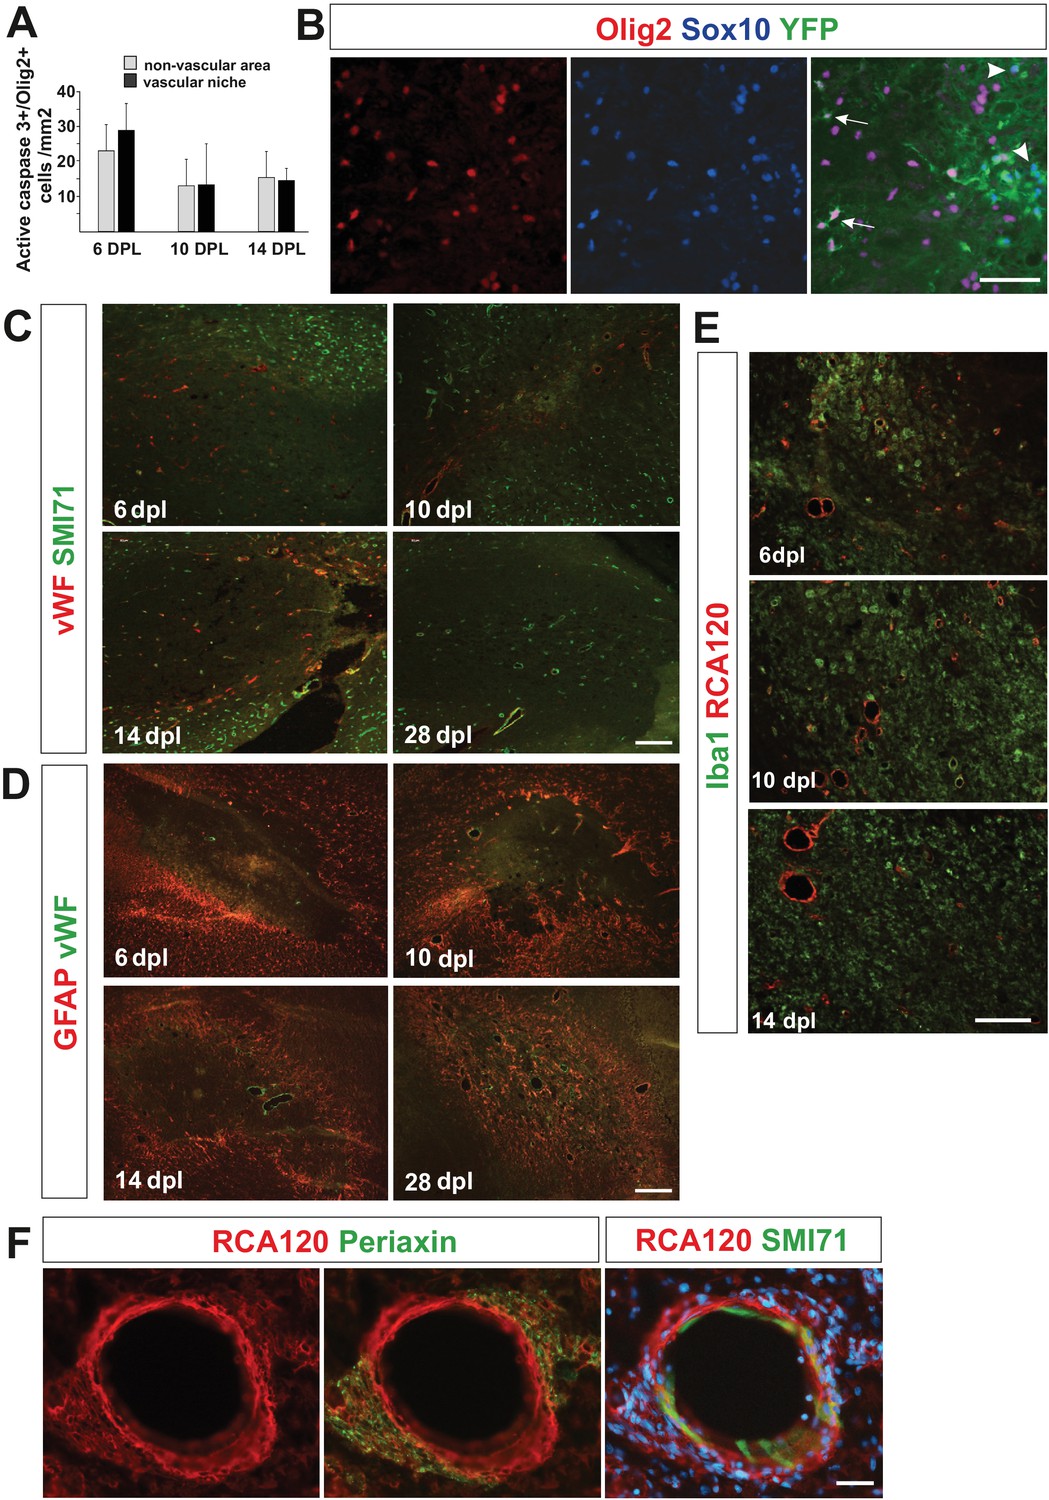
Characteristics of cells occupied vascular niche area in remyelination time course.
(A) Density of OPCs positive for active caspase three in VN is similar to their density in non-VN during early remyelination (n = 3, mean ± SEM). (B) Identification of genetically labelled PDGFRA+ OPCs with distinct phenotype of YFP+/Sox10+/Olig2- in vascular (astrocyte-free) areas of the EB-induced lesions in spinal cords of Pdgfra-CreERT2 mice (arrowheads, scale bar 50 μm). Cre recombination was induced by administering tamoxifen on each of four consecutive days. Four days after tamoxifen induction, focal demyelination was induced in spinal cord white matter by injection of a demyelinating toxin. Immunohistochemistry was performed on sections at 14 days post-lesion. (C) Remyelination is temporally accompanied by blood vessel reconstruction and regeneration of the BBB. Blood vessels were marked with von Willebrand factor (vWF) or CD31-positive endothelial cells and their basement membrane by RCA120 binding (representative images, scale bar 100 μm). Detection of SMI71, a protein produced by endothelial cells only under intact blood-brain or blood-nerve barrier conditions allowed us for identification of reconstructed brain blood barrier (BBB). (D) Astrocytes gradually repopulate lesion areas. We found that at six dpl astrocytes did not exist in the core of lesion since they were likely killed by ethidium bromide. However, at 10 dpl we detected astrocytes migrating from the rim to core of the lesion, at 14 dpl they were present in the vicinity of large blood vessels whereas by 28 dpl repopulate entire remyelinated area. Nevertheless, at every time points reactive gliosis was significantly higher at the edges of lesion. (E) The response and infiltration of Iba1+ inflammatory cells appears equal in regards of cell morphology, number and distribution in both, vascular and non-vascular niche at early remyelination (RCA120 marks blood vessels, representative images, scale bar 50 μm). (F). Perivascular SCs form a network with no discontinuity of basement membrane of the outer wall of blood vessel re-expressing SMI71, 28 dpl (representative image, scale bar 20 μm).
Figure 1—figure supplement 2
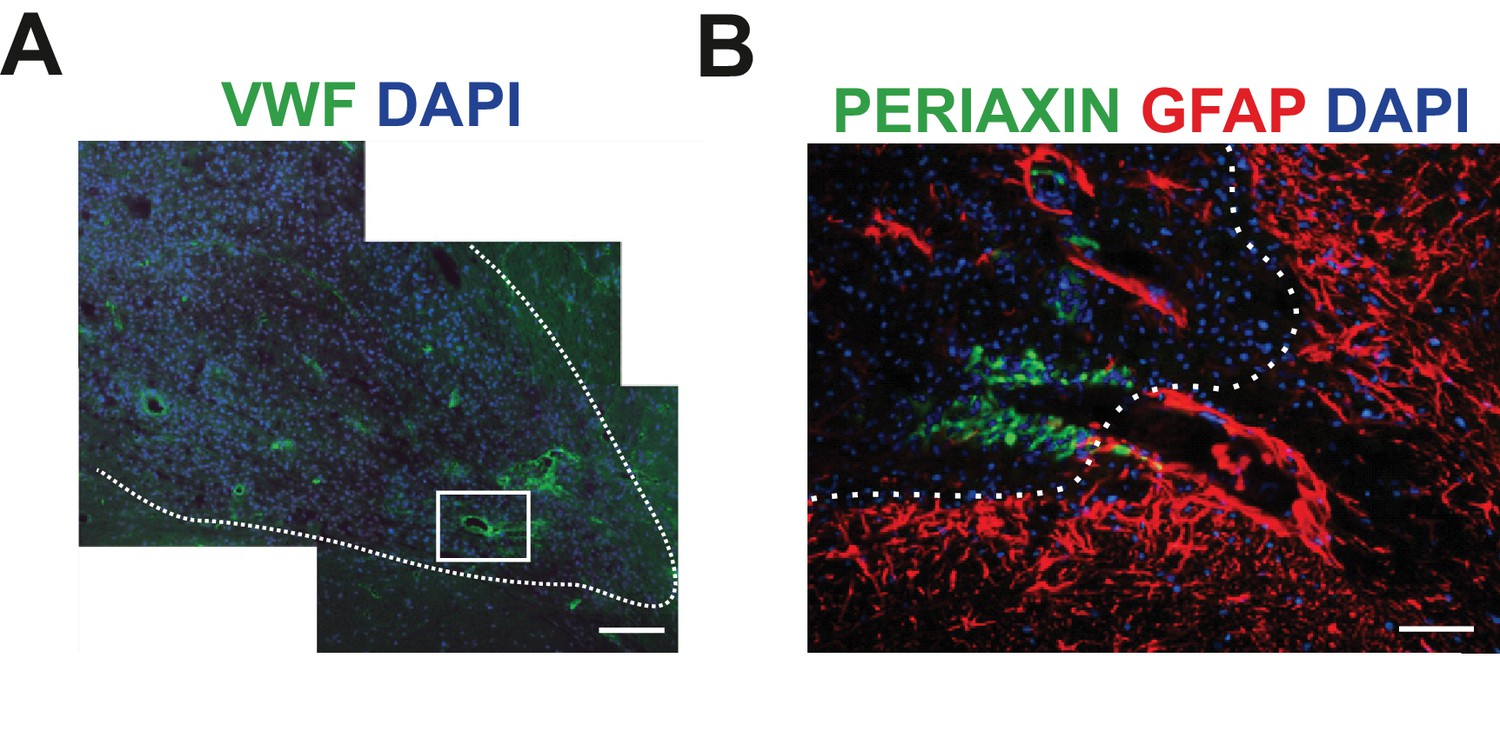
SCs-mediated remyelination is restricted to the vascular niche.
(A) Immunodetection for vWF+ blood vessels within the lesioned area (scale bar 100 μm). (B) SCs preferentially occupy discrete areas where astrocytes were absent even around the same vessel (high magnification of boxed area in A, astrocyte enriched area of the edge of the lesion depicted by dotted line, scale bar 50 μm).
Figure 2 with 1 supplement
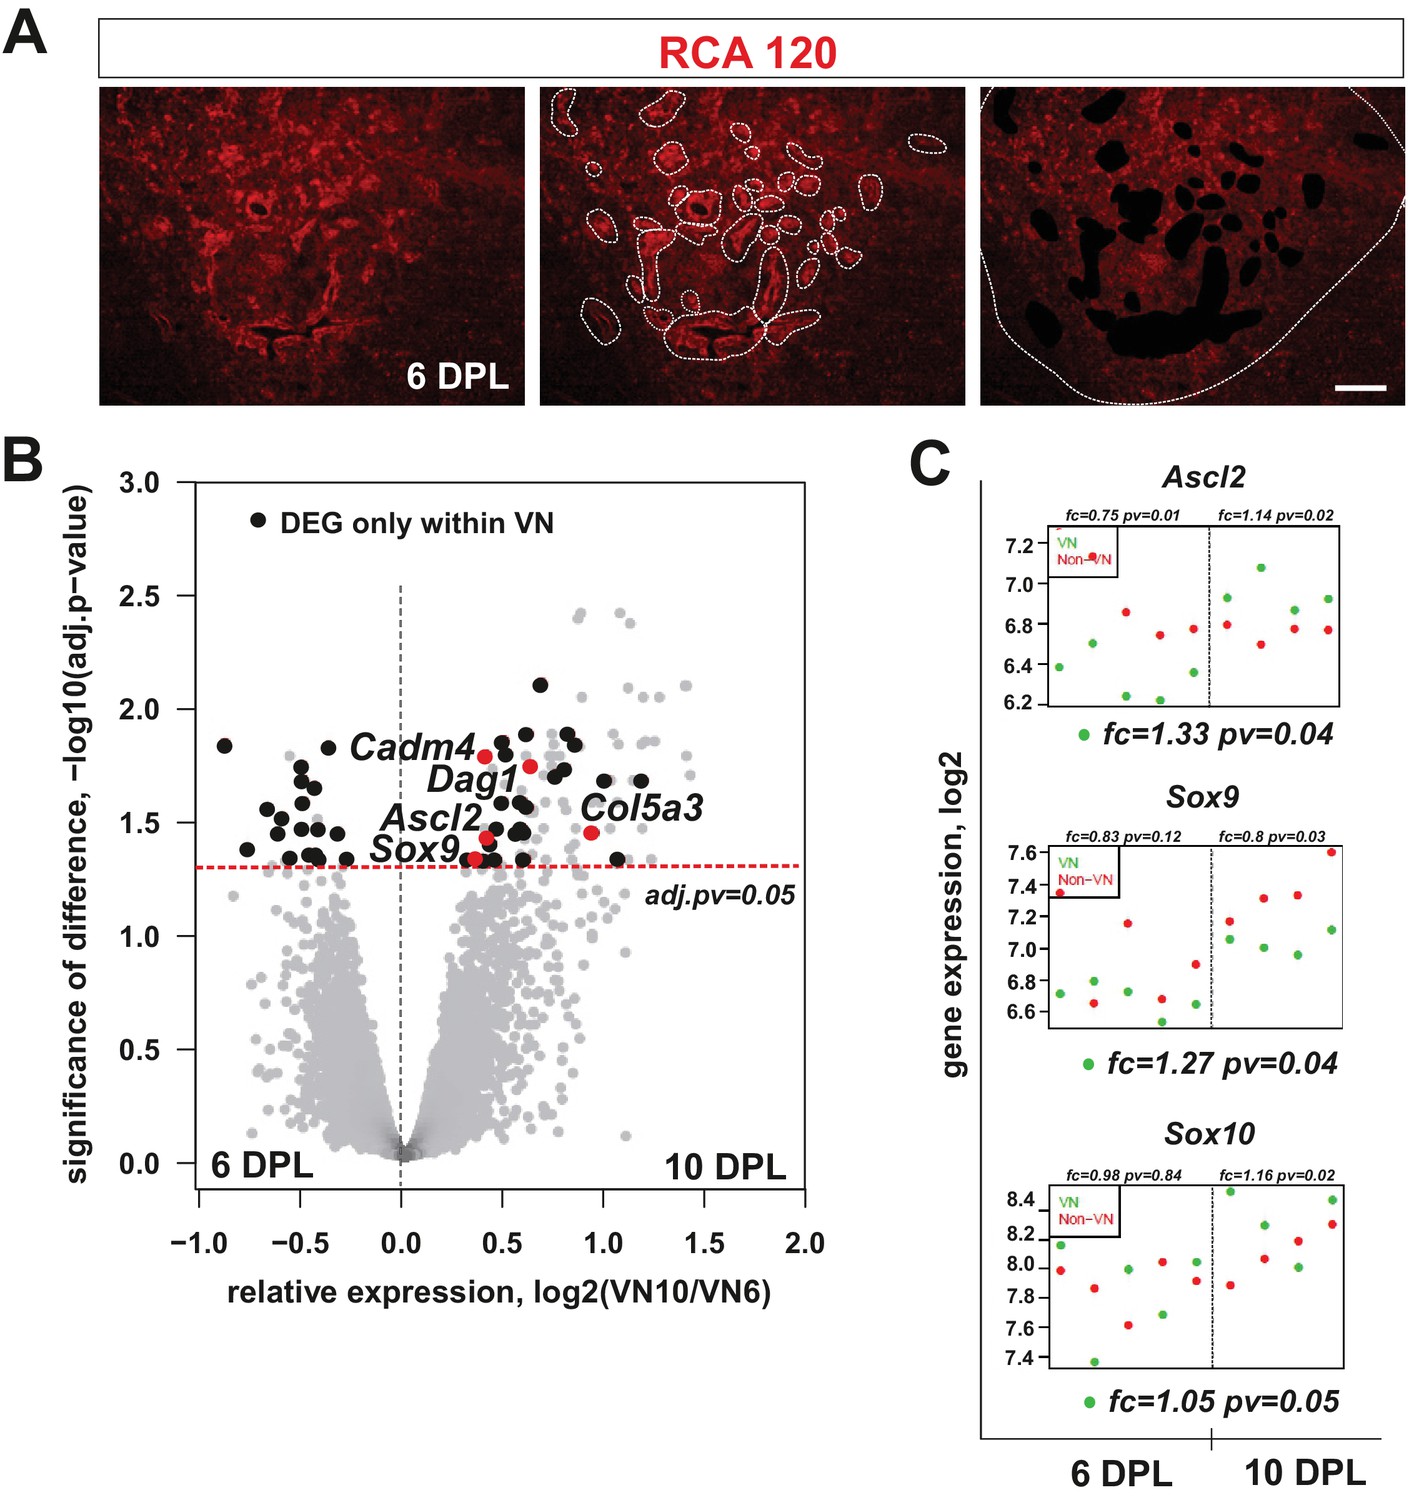
mRNA profiles differ in isolated microenvironmental niches.
(A) Images illustrate the microdissection procedure: areas around blood vessels marked to be cut out by UV-laser (VN) and areas of lesion without blood vessels marked to be cut afterwards (non-VN) are depicted (scale bar 200 μm). (B) Volcano plot contrasting the significance [−log10(pv) on Y-axis] and the magnitude of the expression difference (log2 on X-axis) for comparison of gene expression between 6 and 10 dpl in VN. Each dot represents individual gene. Dashed line corresponds to the FDR acceptance level (adj.pv = 0.05, limma test, n = 4) (C) Transcript abundance level (absolute expression) of transcription factors in separated areas based on a hybridization intensity measurement for an individual probe, dots represent expression level for each animal sample, green – expression level in VN, red – expression level in non-VN. The significance of differences between niches at the given time is presented at the top of each diagram, separately for each niche. Fold changes between the time points 10 dpl vs 6 dpl in VN are shown at the bottom of each diagram.
-
Figure 2—source data 1
Genes significantly regulated in the non-vascular areas.
Dots represent level of expression for individual animal sample.
- https://doi.org/10.7554/eLife.30325.007
-
Figure 2—source data 2
Genes significantly regulated in the vascular niche.
Dots represent level of expression for individual animal sample.
- https://doi.org/10.7554/eLife.30325.008
-
Figure 2—source data 3
Genes significantly regulated only in the vascular niche.
Dots represent level of expression for individual animal sample.
- https://doi.org/10.7554/eLife.30325.009
Figure 2—figure supplement 1
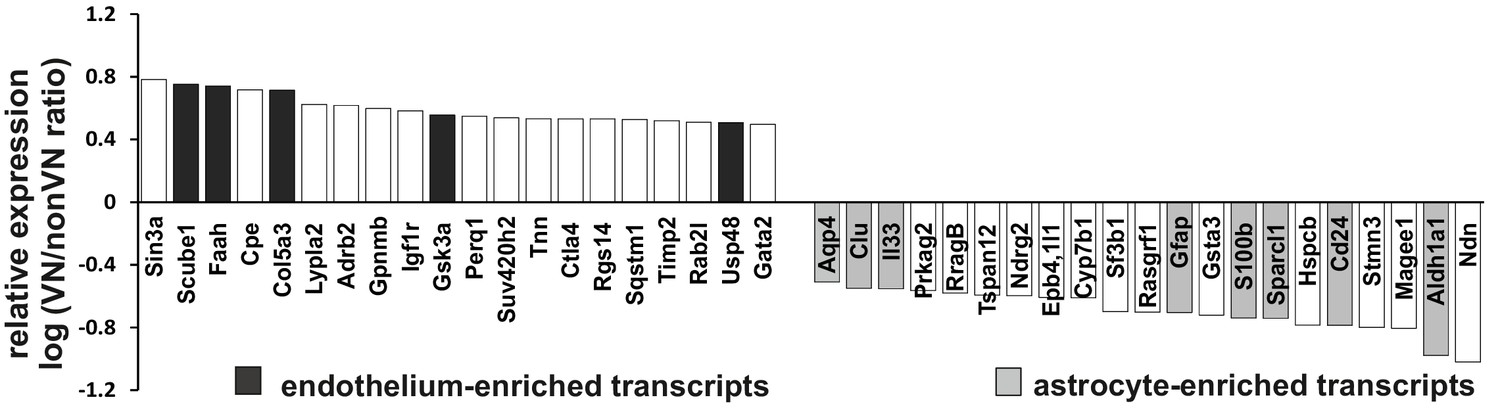
Microarray analysis restricted to defined and putative endothelial and astrocyte enriched transcripts shows the different profiles of both niches in 10 dpl group.
For each individual gene average a ratio between average expression in vascular and non-vascular niche were computed. Expression ratios were plotted on a log2 scale. Gene signatures for astroglial-lineage cells (Zhang et al., 2014; Cahoy et al., 2008), oligodendroglial-lineage cells (Zhang et al., 2014; Cahoy et al., 2008), SCs-lineage cells (Schmid et al., 2014), and endothelial cells (Daneman et al., 2010; Zhang et al., 2014) were extracted from the literature and crossed with our microarray data. On the left are genes overexpressed in vascular niche, and on the right genes overexpressed in non-vascular niche with marked genes of known cellular sources based on Gene Atlas and previously published databases. Note a higher representation of endothelial enriched genes in perivascular niche and astrocyte enriched genes in non-vascular one.
Figure 3 with 1 supplement
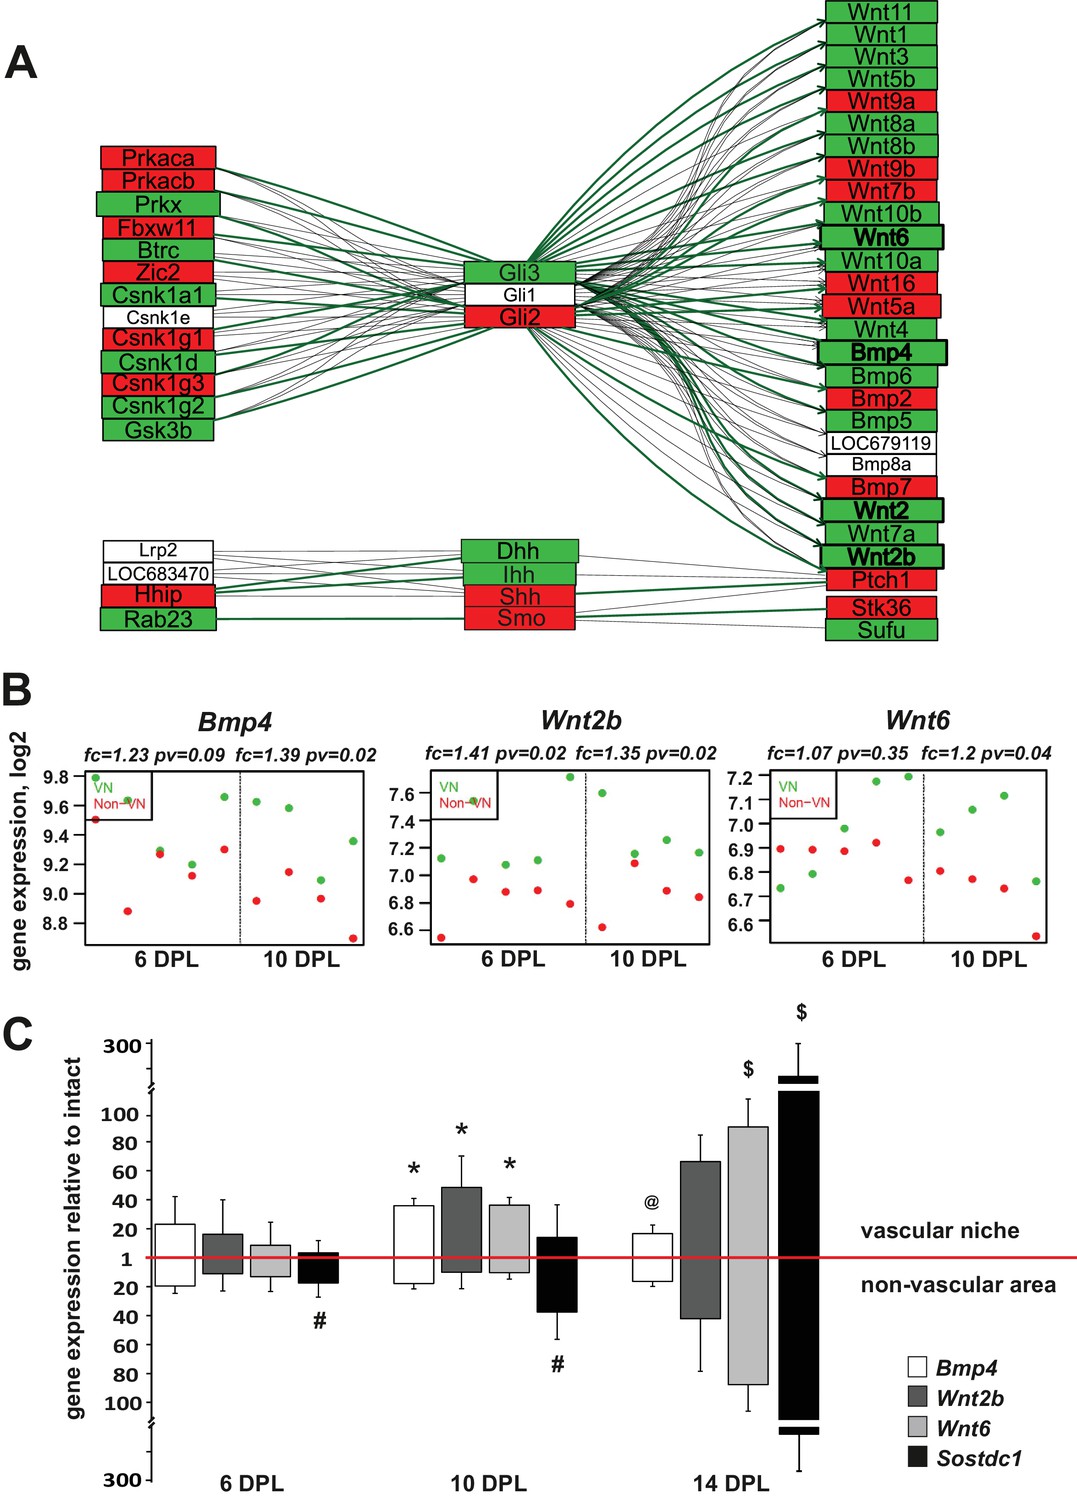
Injury-induced vascular niche is enriched with BMP and Wnt morphogen transcripts.
(A) Graphical representation of BMP/WNT/Hedgehog signalling pathway interactions based on 10 dpl microarray results, higher expression of particular gene in non-VN in red, a higher expression in a VN group in green. Computed expression changes were marked over the existing topology using green-red colour scheme. Box size represents the relative difference of expression, genes with significant changes of expression bolded (Fisher’s exact test, adj.p < 0.05). In order to highlight observed differential co-regulation of gene expression, consistent relations were marked with green. Two genes were assumed to be in consistent relation if changes of their expression levels between the compared groups were consistent with type of regulations between them (activation or inhibition). Such consistent relations indicate functionally related expression changes (Mieczkowski et al., 2012). (B) Absolute expression of BMP4, Wnt2b, and Wnt6 in VN (green) and non-VN (red) at 6 and 10 dpl, dots represent expression level for each sample. (C) Relative gene expression (mean ± sd; n = 3, Mann-Whithney U-test, *p<0.001 compared with control levels of intact tissue as well as with non-VN at the same time point, # p<0.05 compared with control levels of intact, @p<0.01 compared with BMP4 level at 10 dpl, $p<0.001 compared with control levels of intact tissue as well as with 6 dpl and 10 dpl).
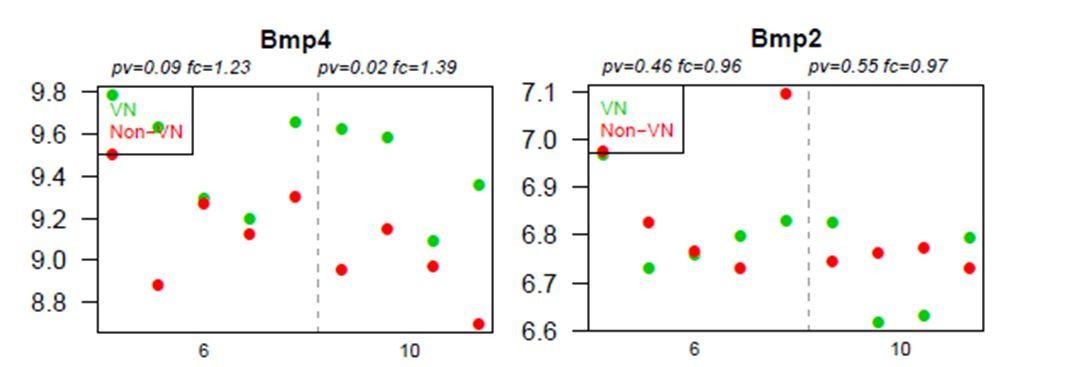
Figure 3—figure supplement 1
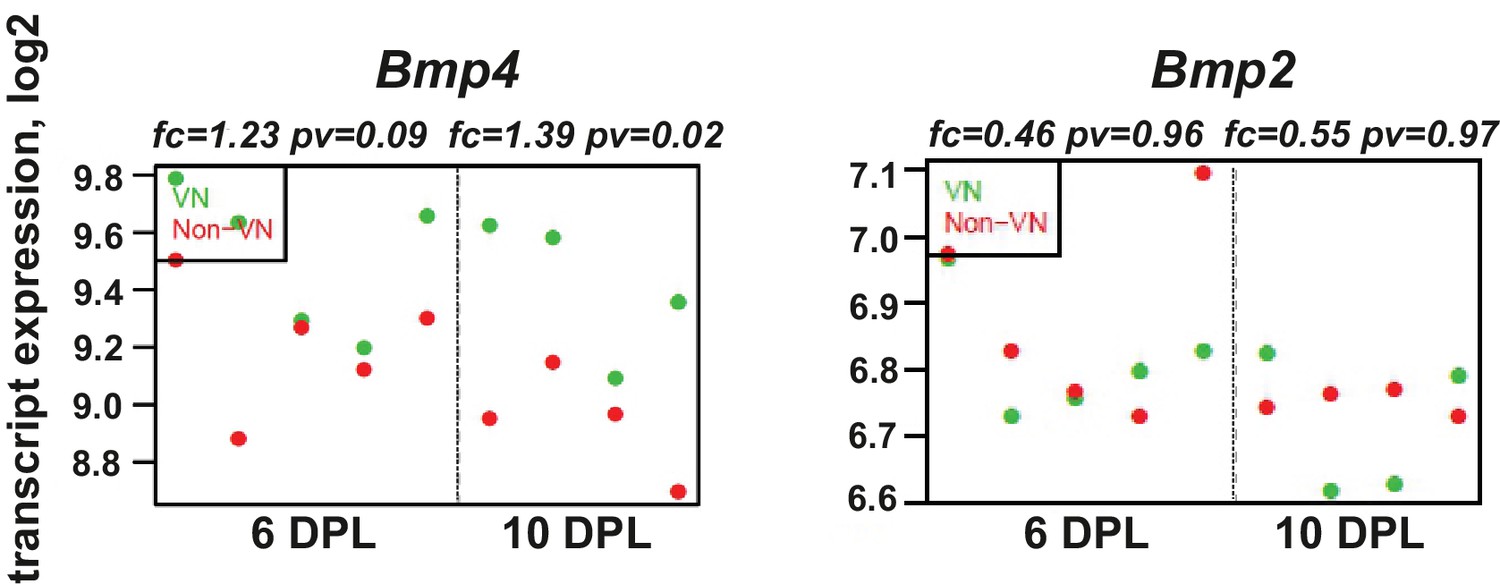
BMP4, but not BMP2, is upregulated within the demyelinated lesion, regardless of the specific area examined.
Absolute expression of BMP4 and BMP2 in VN (green) and non-VN (red) at 6 and 10 dpl, dots represent expression level for each sample.
Figure 4 with 2 supplements
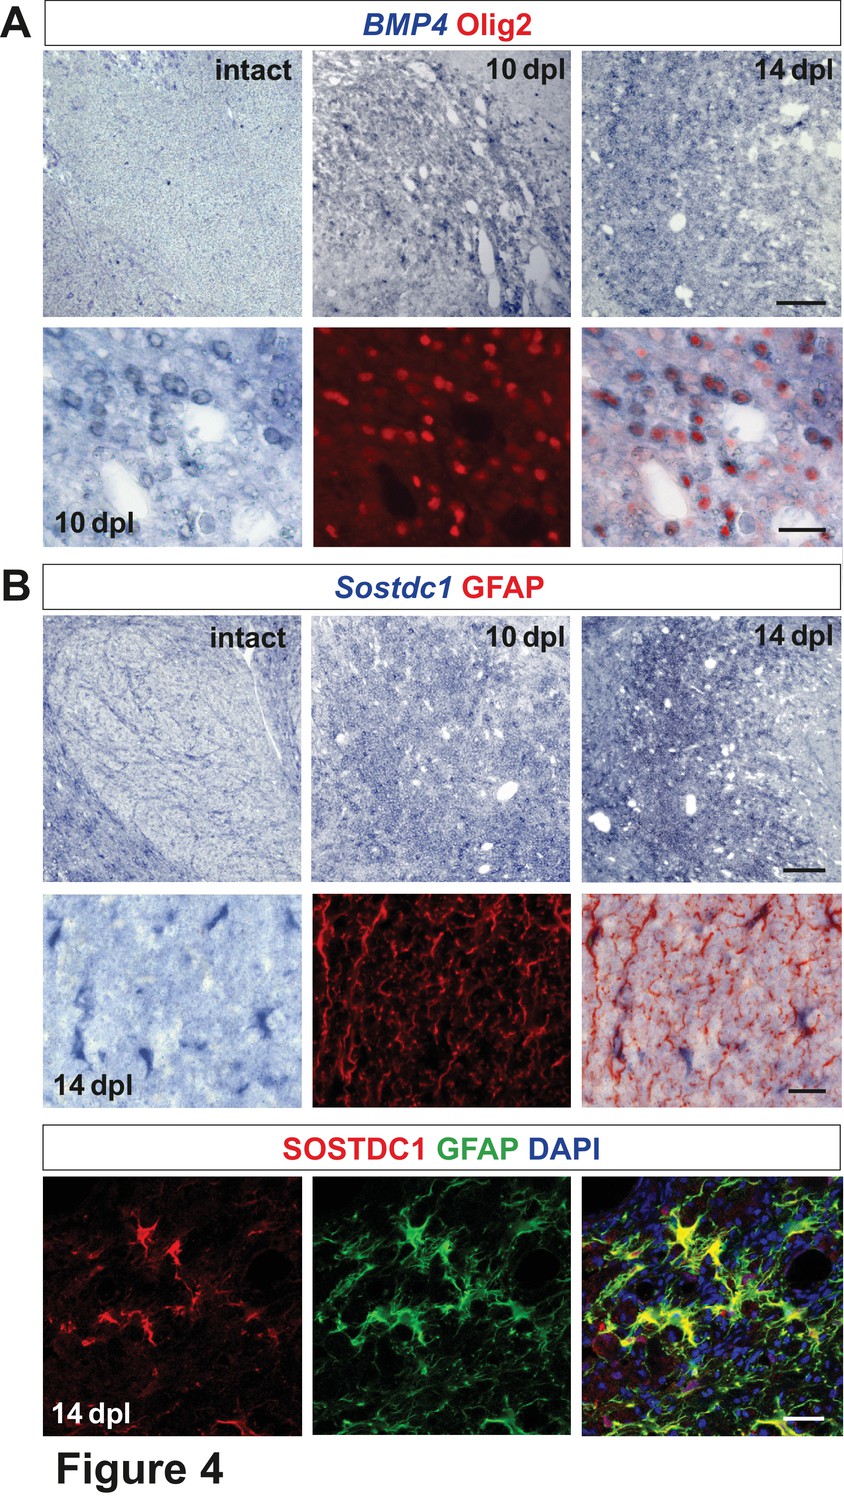
Spatiotemporal distribution and cellular sources of selected proteins.
(A) BMP4 transcript is produced in VN at 10 dpl (upper panel, in situ hybridization, scale bar 200 μm) mainly by OPCs (lower panel, Olig2 in red, scale bar 10 μm). (B) Sostdc1 transcript detection by in situ hybridization and protein co-immunofluorescence show astrocyte association at 14 dpl (scale bar 200 μm upper panel, 20 μm middle and lower panels).
Figure 4—figure supplement 1
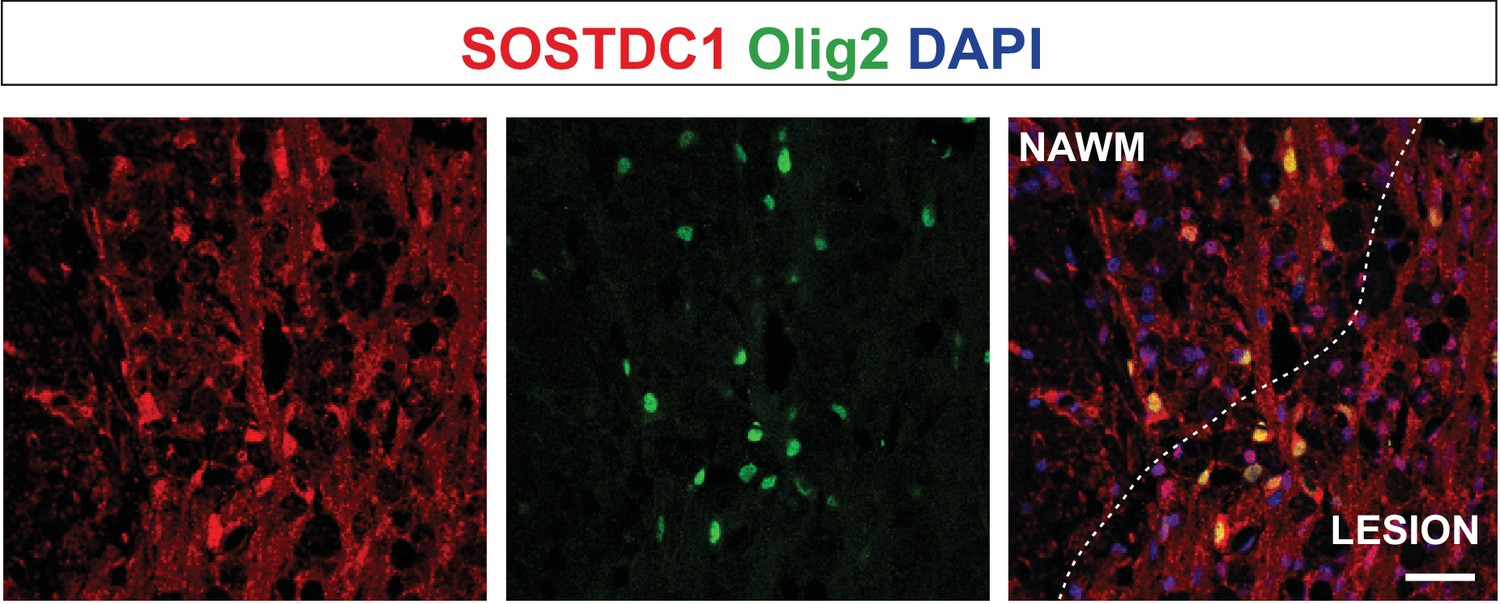
Olig2-positive cells producing Sostdc1, likely pre-myelinating OLs, are located close to the lesion edge.
Representative confocal images of 14 dpl lesion, the core of the lesion depicted by dotted line; NAWM, normal appeared white matter, scale bar 50 μm.
Figure 4—figure supplement 2
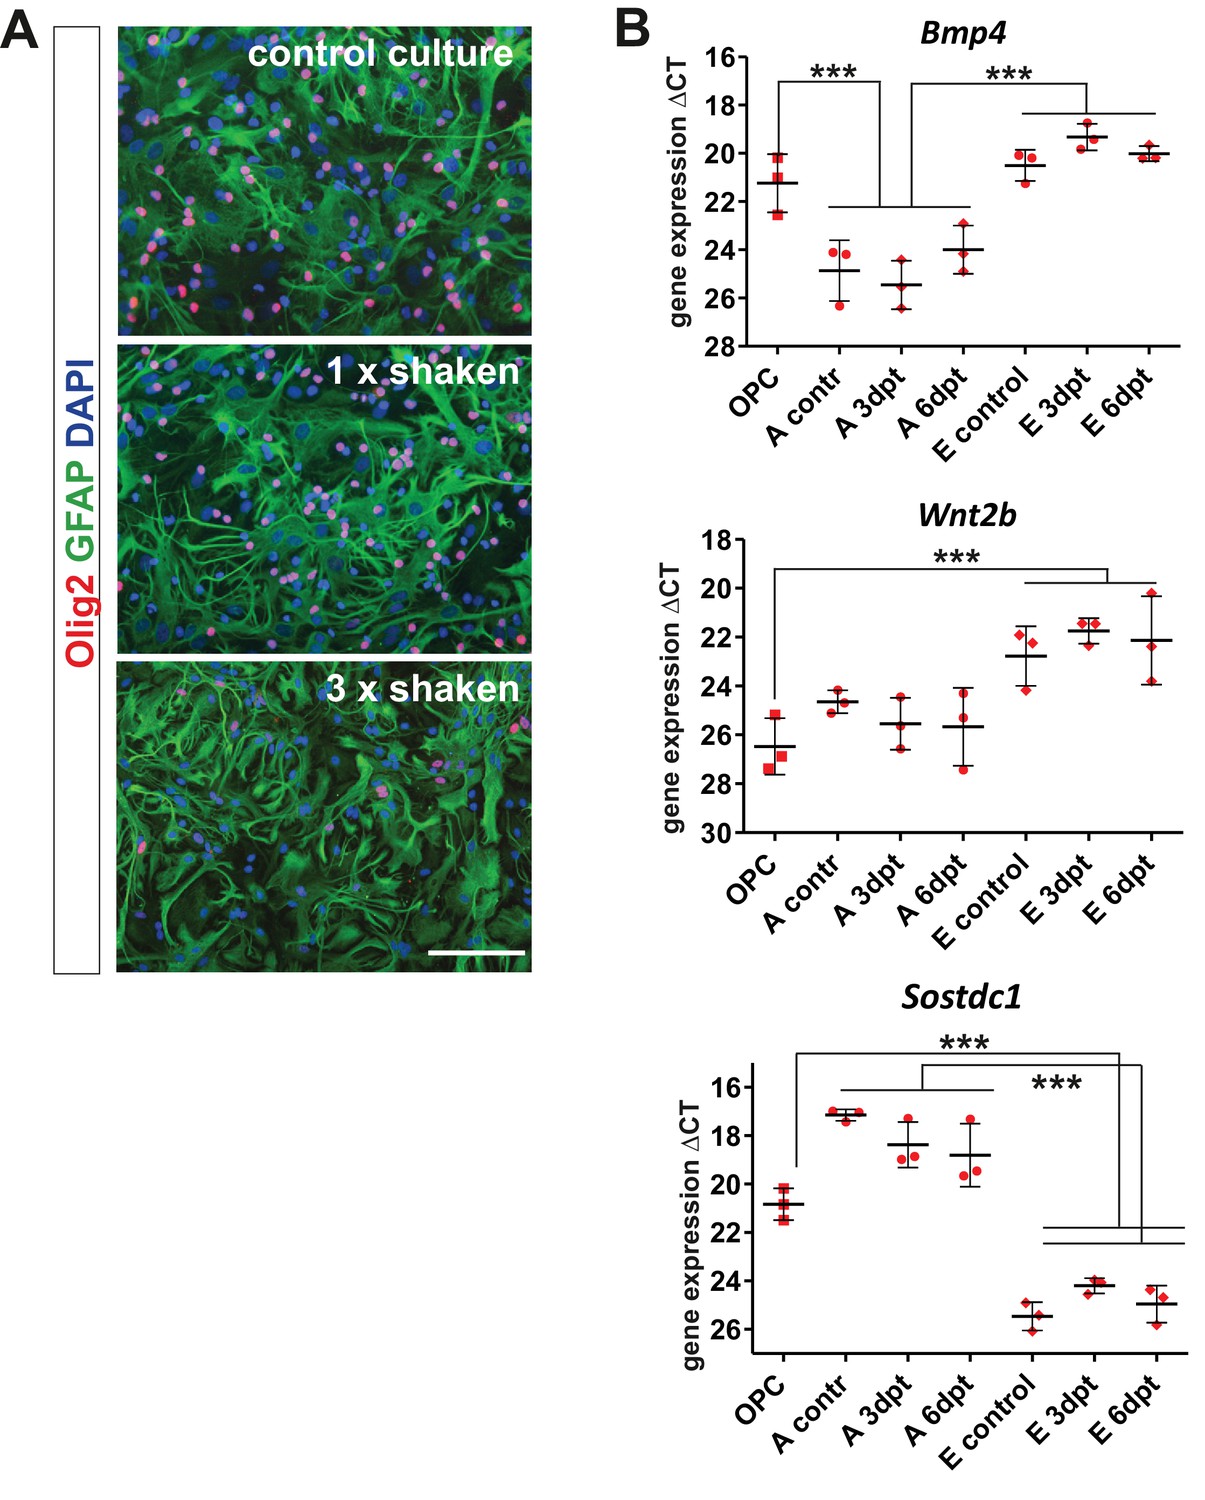
Gene expression analysis in the purified brain-derived cell populations at basal and activated conditions in vitro confirms the cellular origin of BMP4, Wnt2b, and Sostdc1.
(A) For in vitro expression analysis we used extra-pure populations of OPCs and astrocytes obtained by three times repeated shaking step since standard procedure of isolation results with astrocyte cultures highly enriched with OPCs. Images show cultures re-seeded after indicated shaking repetition (scale bar 100 μm). (B) qPCR results confirm that oligodendrocyte progenitors and endothelial cells produce BMP4 and Wnt2b while Sostdc1 is produced mainly by astrocytes in control cultures or at indicated time after scratch in wound healing assay (days post treatment, dpt). Data presented as means of ΔCT ± sd, one-way ANOVA, Newman-Keuls test, ***p<0.001.
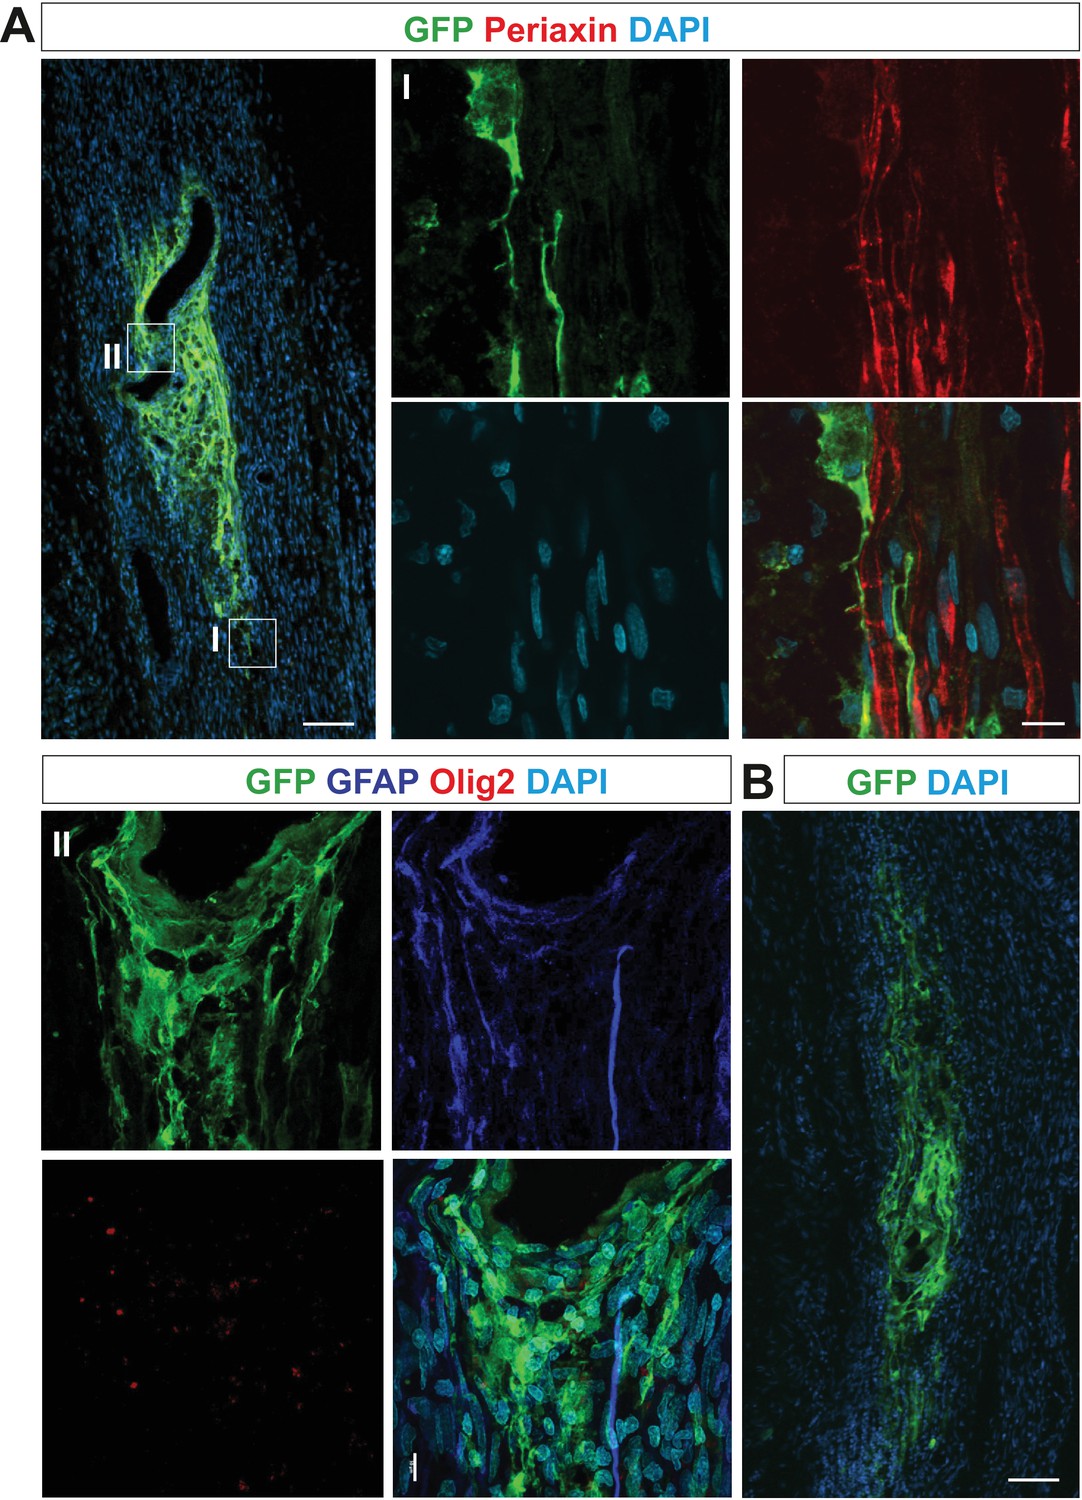
Figure 5 with 1 supplement

OPC differentiation fate at 4 weeks after transplantation into injured sciatic nerve.
(A) Gene expression pattern after sciatic nerve crush (mean ± sd; n = 3, Mann-Whithney U-test, *p<0.01 compared with 30 min after crush, #p<0.05 compared with 3 dpc). (B) Quantification of GFP+ cell number in longitudinal sciatic nerve section in different transplantation paradigms (mean ± sd, three fields per section, three sections per nerve, n = 3 rats per experimental condition, t-Students test, **p<0.01, quantification of GFP+/periaxin+ cells shows their significant contribution in nerves were cells were implanted at 1dpc, shaded bars, # p<0.01). (C) Immunostaining shows grafted cells existing within sciatic nerves at each experimental condition. The first two images of each panel show general view of longitudinal sections in low power, the next three show boxed area reimaged using confocal microscope. Co-localization of GFP (in green), with periaxin (in red) indicates SC differentiation of OPCs grafted into sciatic nerves at 24 hr postinjury, (arrowheads). Non-myelinating GFP+ cells could be also detected (asterisk). SCs differentiation is defective under both dorsomorphin and USAG1 treatment (scale bar 100 μm and 20 μm in low and high power images, respectively).
Figure 5—figure supplement 1
OPCs differentiate abnormally when grafted into sciatic nerve at 3 or 6 dpc.
(A) GFP+ cells neither express periaxin (boxed area I reimaged using confocal microscope, right panel) nor GFAP and Olig2 (boxed area II, lower panel) when grafted 3 dpc, indicating their aberrant differentiation and defective function concerning remyelination (scale bar 100 μm and 10 μm in low and high power, respectively). (B) GFP+ cells occupied similar area and form similar irregular mesh when grafted into sciatic nerve at 6 dpc (scale bar 100 μm).
Figure 6
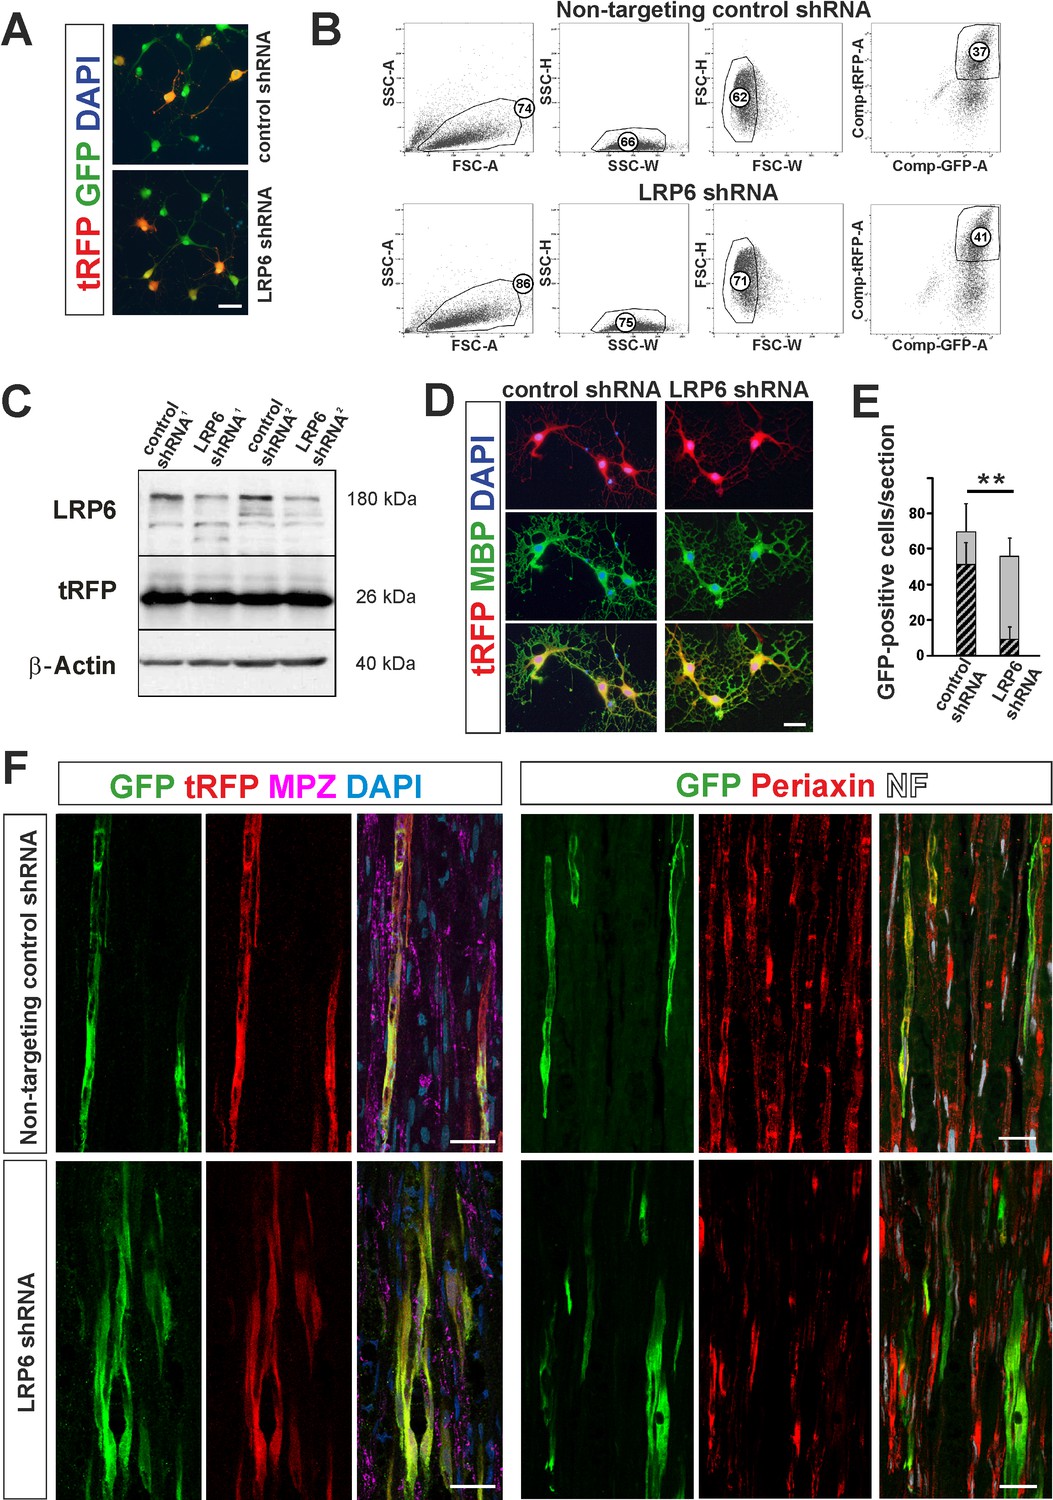
shRNA-mediated knockdown of LRP6 expression inhibits Schwann cell differentiation within injured sciatic nerve.
(A) Images show morphology of GFP+ OPCs transduced in vitro with lentiviral-mediated control and LRP6-specific shRNA, scale bar 20 μm (B) FACS sorting strategy, numbers show percent of cells of a specified phenotype (C) Western blot analysis of LRP6 and tRFP protein level revealed efficient gene expression knockdown. (D) FACS-sorted GFP+ OPCs transduced with LRP6shRNA differentiate normally into MBP+ OLs, scale bar 20 μm (E) Differentiation of OPCs transduced with LRP6-specific shRNA into SCs is defective. t-Students test **p<0.01 (F) Confocal images show grafted GFP+/tRFP+ cells differentiated within host sciatic nerves at 4 weeks after implantation. Co-localization of GFP (in green), with MPZ or periaxin (in red) indicates SC differentiation of OPCs transduced with non-targeting control shRNA but not with LRP6 shRNA (scale bar 20 μm).
Figure 7
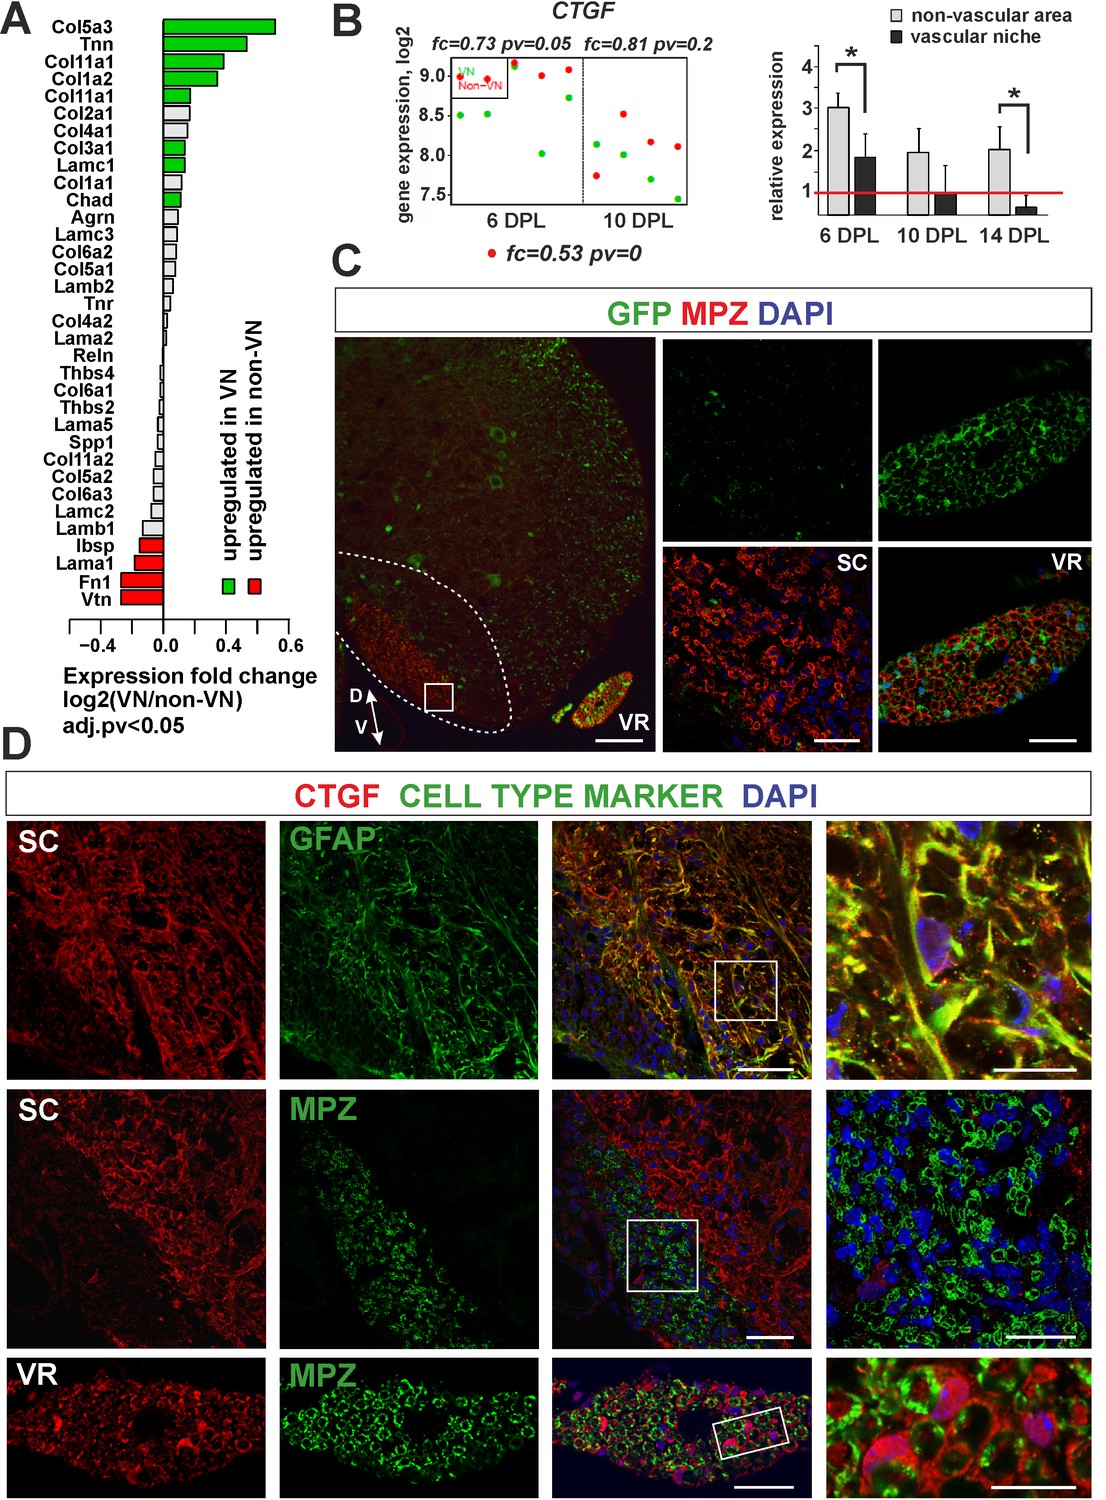
Expression and accumulation of CTGF is restricted to the astrocytic response to demyelination.
(A) Expression of ECM proteins is niche-specific as revealed by microarray analysis (Fisher’s exact test, adj.pv <0.05). (B) CTGF expression decreases during remyelination; however it is significantly higher in non-VN than VN (microarray data on the left, relative expression over intact on the right, t-Students test **p<0.01). (C) Representative images of typical lesion epicentre in the ventral spinal cord white matter of Wnt1-Cre mice at 28 dpl. MPZ associated with YFP-negative cells within CNS lesion indicate their other than neural crest origin in contrast to bona fide PNS SCs myelinating axons in the ventral root (vr). High confocal power images (to the right) show merged immunostaining of boxed area in spinal cord lesion (sc) and ventral root (vr). Scale bar 200 μm and 50 μm in low and high power images, respectively. D, V dorso-ventral position of the lesion. Lesion depicted by dotted line. (D) Co-localization of CTGF with GFAP in remyelinated spinal cord white matter or with MPZ in ventral root (scale bar 50 μm, overlaid image of boxed areas, upper 15 μm, middle and lower 20 μm).
Author response image 1
Graphs show absolute expression of BMP4 and BMP2 in VN (green) and non-VN (red) at 6 and 10 dpl, dots represent expression level for each sample.
The Y axis represents gene expression, log2; X axis – dpl.
Additional files
-
Transparent reporting form
- https://doi.org/10.7554/eLife.30325.019
Download links
A two-part list of links to download the article, or parts of the article, in various formats.
Downloads (link to download the article as PDF)
Open citations (links to open the citations from this article in various online reference manager services)
Cite this article (links to download the citations from this article in formats compatible with various reference manager tools)
Injury-induced perivascular niche supports alternative differentiation of adult rodent CNS progenitor cells
eLife 7:e30325.
https://doi.org/10.7554/eLife.30325


