Dendritic small conductance calcium-activated potassium channels activated by action potentials suppress EPSPs and gate spike-timing dependent synaptic plasticity
- Australian National University, Australia
- Flinders University, Australia
Figures
Figure 1
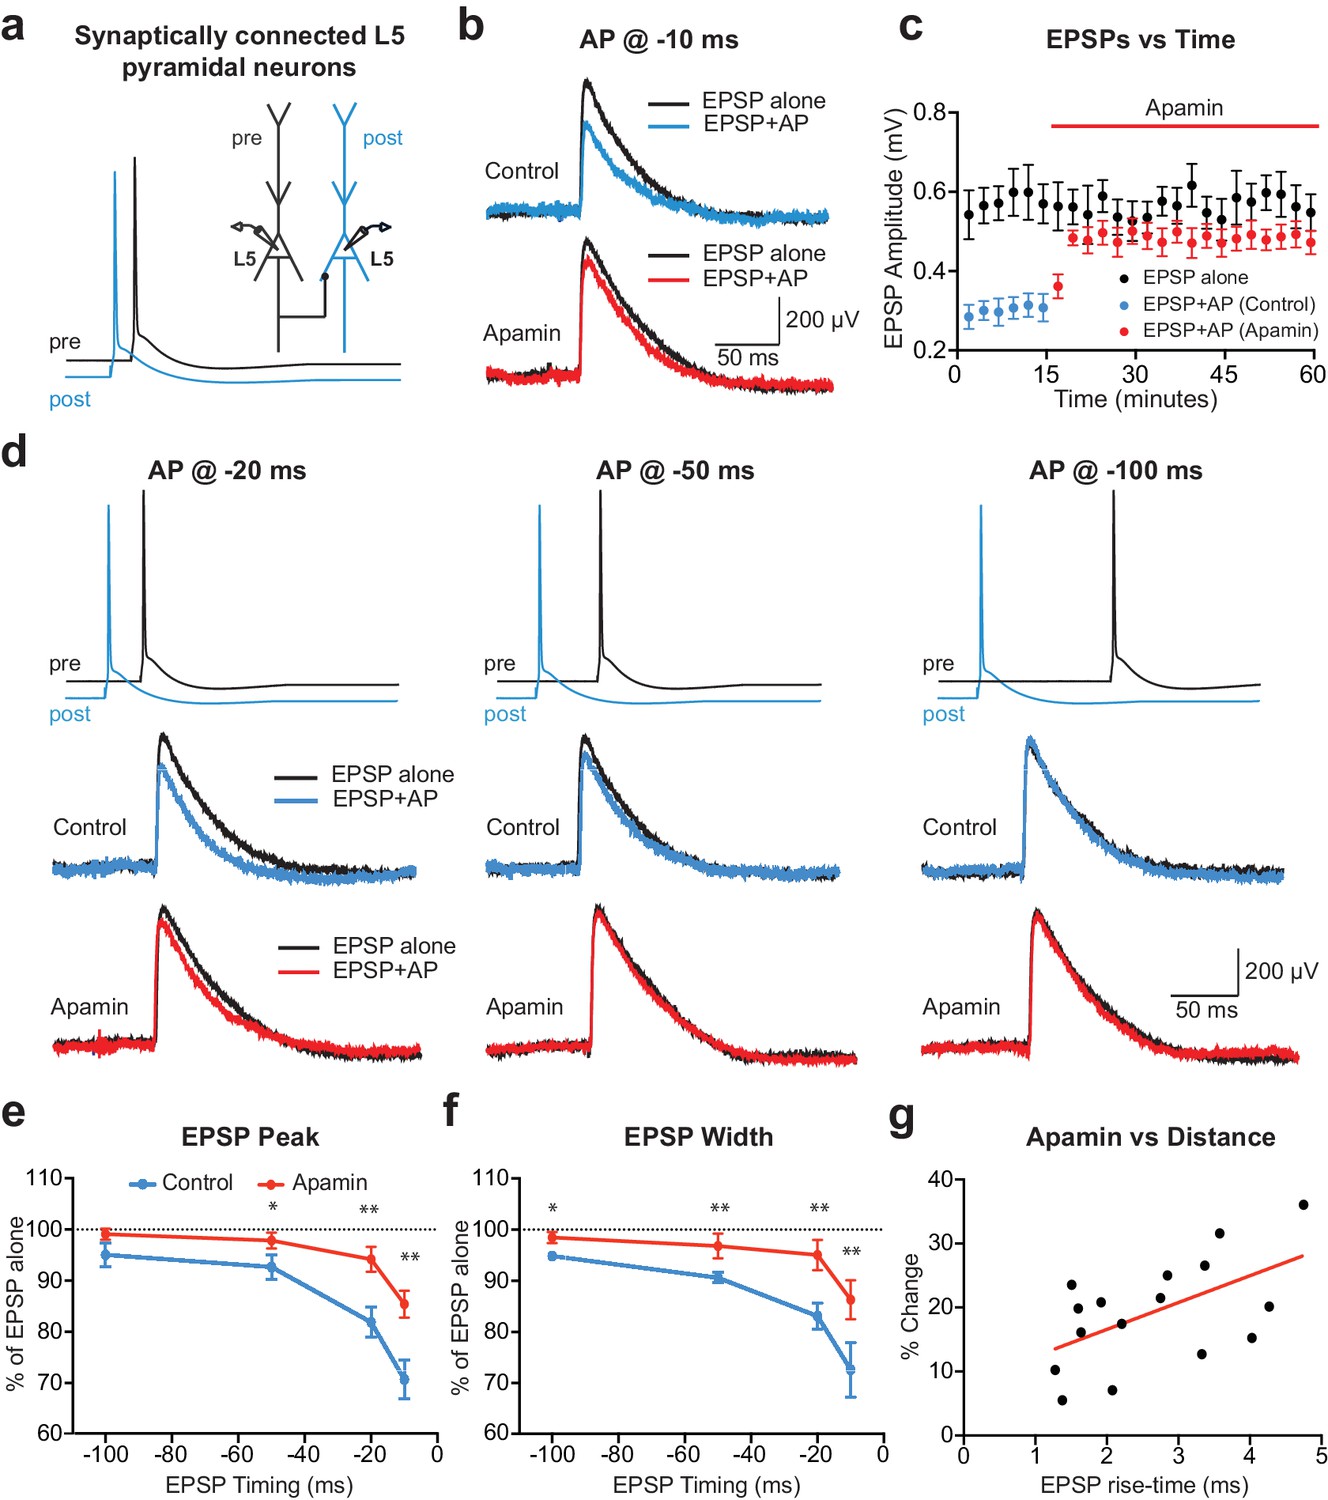
APs in cortical layer 5 (L5) pyramidal neurons suppress EPSPs in an SK-dependent manner.
(a) Experimental arrangement: Simultaneous whole-cell recording from synaptically connected L5 pyramidal neurons. APs in the presynaptic neuron (black) were evoked 10 ms after the AP in the postsynaptic neuron (blue; −10 ms timing). (b) Unitary EPSPs evoked alone (black) and 10 ms after APs (blue and red) in control (top) and apamin (bottom). (c) Plot of EPSP amplitude versus time for EPSPs evoked alone (black) and 10 ms after APs in control (blue) and apamin (red; same neuron as in b). Each point represents the average response over 2.5 min ± SEM. (d) Top: Pre- and postsynaptic APs at −20 ms, −50 ms and −100 ms. Bottom: Unitary EPSPs evoked alone (black) and at different times after APs (blue and red) in the absence (top) and presence of apamin (bottom). (e,f) Average EPSP amplitude (e) and width (f) for unitary EPSPs evoked at different times after APs relative to the amplitude of EPSPs alone in control (blue) and apamin (red; n = 6). (g) Percentage increase in unitary EPSP amplitude after apamin for unitary EPSPs evoked 10 ms after APs versus the 10–90% rise time of EPSPs alone (n = 16). Line represents linear fit (R squared = 0.32, p=0.023).
Figure 2
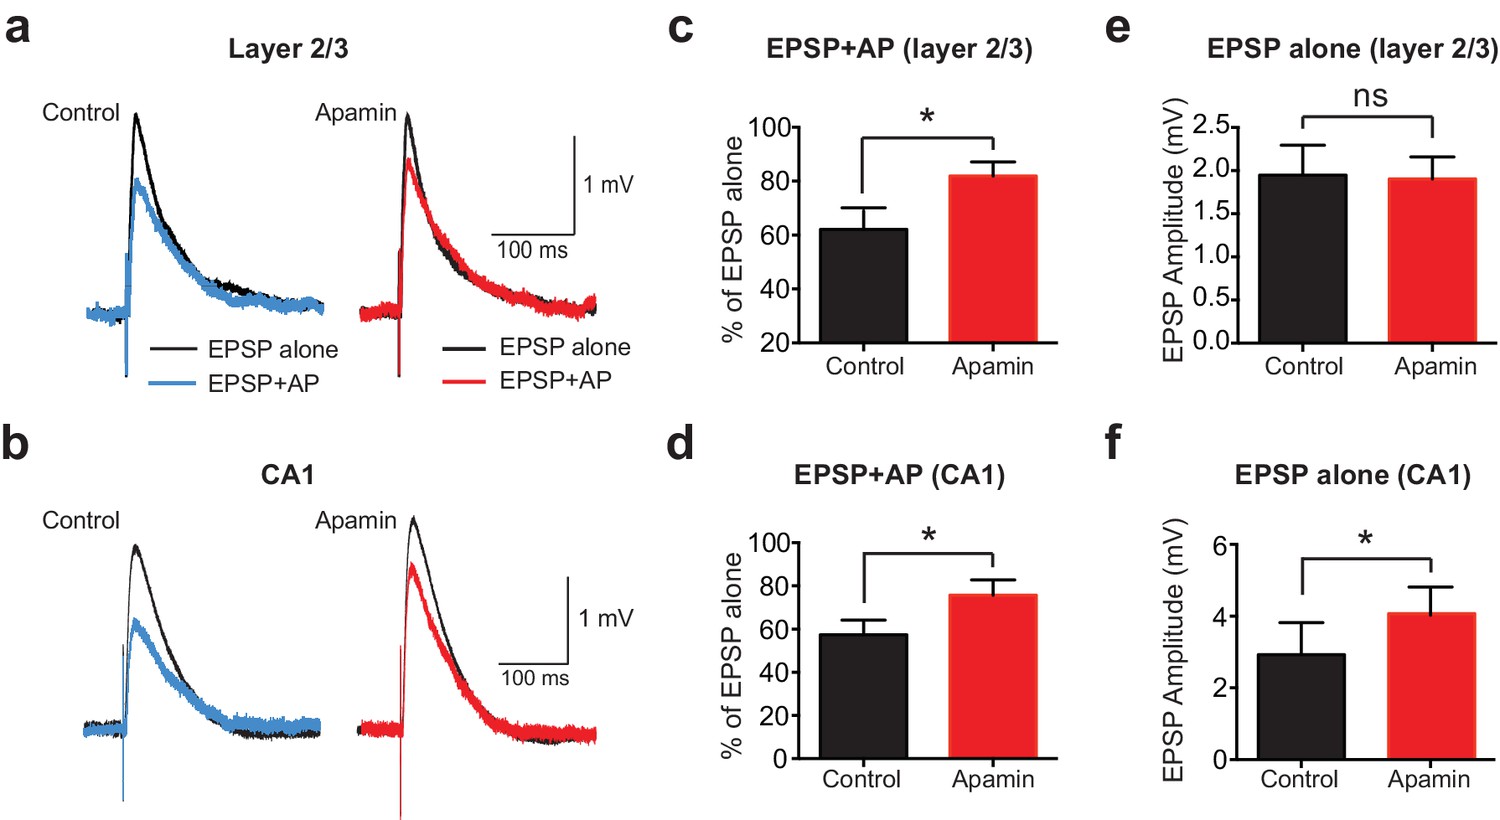
APs suppress EPSPs in an SK-dependent manner in cortical layer 2/3 and hippocampal CA1 pyramidal neurons.
(a,b) EPSPs evoked alone (black) and 10 ms after APs (blue and red) in control (left) and apamin (right) in layer 2/3 (a) and CA1 pyramidal neurons (b). (c,d) Percentage change in EPSP amplitude for EPSPs evoked 10 ms after APs relative to EPSPs alone in control (black) and apamin (red) in layer 2/3 (c) and CA1 pyramidal neurons (d; n = 7).(e,f) Average EPSP alone amplitude in control (black) and apamin (red) in layer 2/3 (e) and CA1 pyramidal neurons (f; n = 7).
Figure 3

Contribution of somatic versus dendritic SK channels to EPSP suppression.
(a) Artificial EPSPs (aEPSPs) generated by somatic current injection alone (black) and 10 ms after APs (blue and red) in control (top) and apamin (bottom). (b–c) Percentage reduction in EPSP amplitude (b) and width at 25% of peak (c) for somatic aEPSPs evoked at different times after APs relative to the amplitude of aEPSPs alone in control (blue) and apamin (red; n = 7). (d) Postsynaptic AP in control (black, solid) and with 300 μM BAPTA in the pipette solution (dashed) before and after addition of apamin (red). Inset: Change in mAHP after apamin with intracellular BAPTA. (e) Unitary EPSPs evoked alone (black) and 10 ms after APs (blue and red) in control (top) and apamin (bottom) in recordings with intracellular BAPTA. (f) Plot of EPSP amplitude versus time in recordings with intracellular BAPTA for EPSPs alone (black) and 10 ms after APs in control (blue) and apamin (red; same neuron as in e). Each point represents the average response over 2.5 min ± SEM. (g,h) Average EPSP amplitude (g) and width (h) for unitary EPSPs evoked at different times after APs relative to the amplitude of EPSPs alone in control (blue) and apamin (red; n = 6).
Figure 4
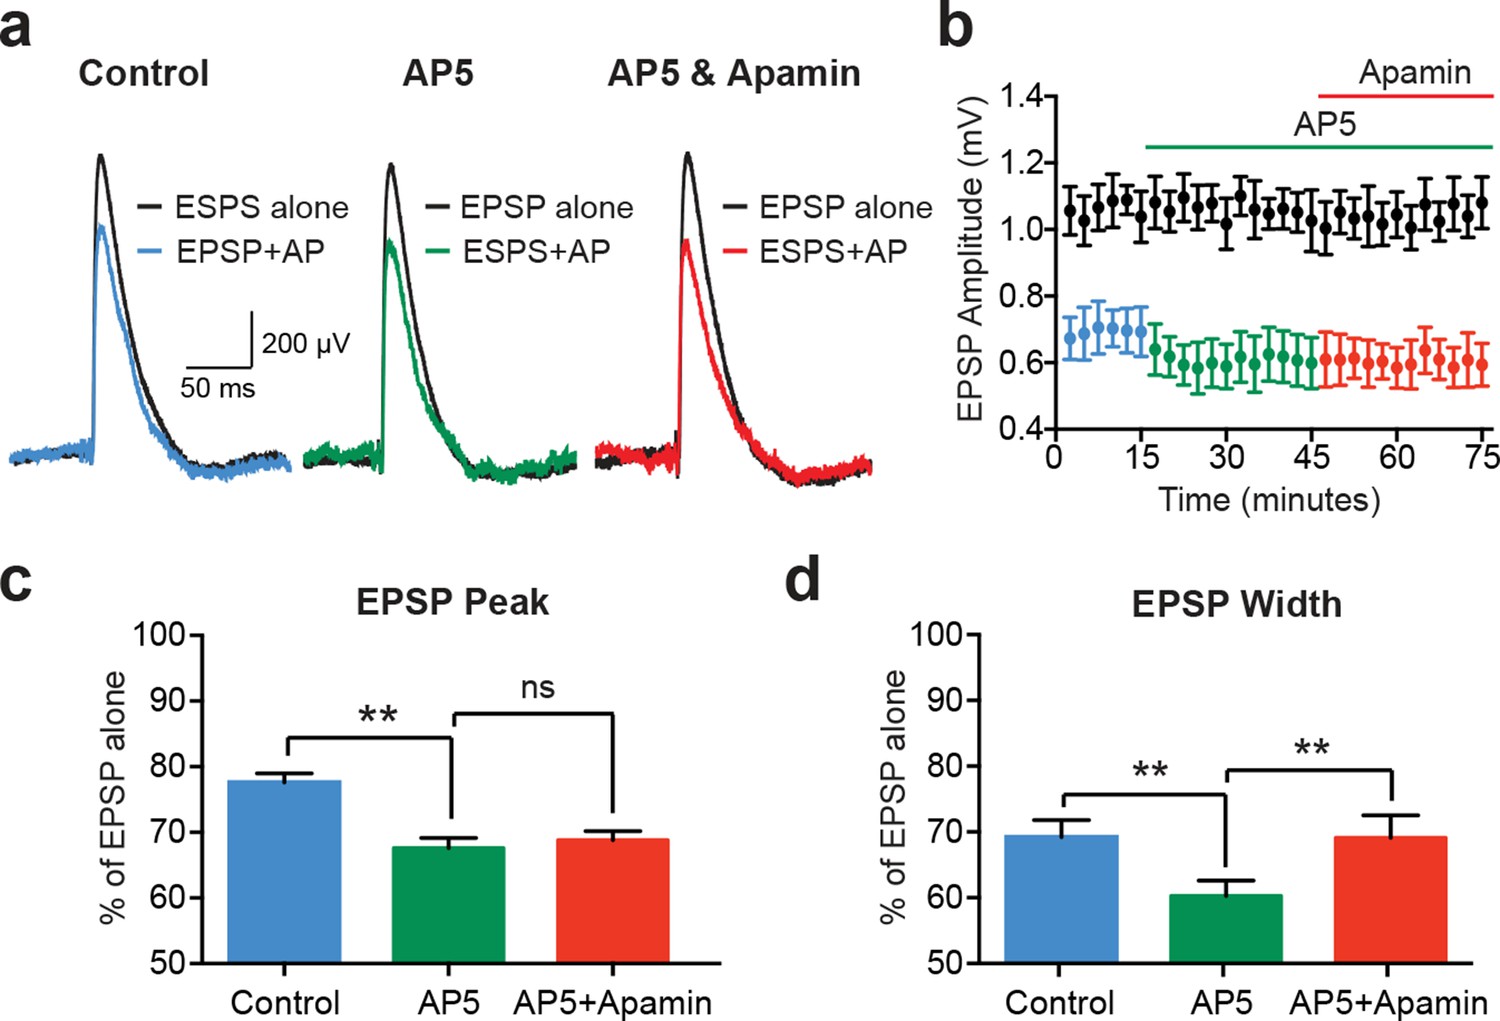
EPSP suppression by APs requires NMDARs.
(a) Unitary EPSPs evoked alone (black) and 10 ms after APs in control (left; blue), AP5 (middle; green) and AP5 plus apamin (right; red). (b) Plot of EPSP amplitude versus time for EPSPs alone (black) and 10 ms after APs in control (blue), AP5 (green) and AP5 plus apamin (red; same neuron as in a). Each point represents the average response over 2.5 min ± SEM. (c,d) Average EPSP amplitude (c) and width (d) for unitary EPSPs evoked 10 ms after APs relative to the amplitude of EPSPs alone in control (blue), AP5 (green) and AP5 plus apamin (red; n = 5).
Figure 5

Modelling EPSP suppression by APs.
(a) Left, Morphology of a reduced layer 5 pyramidal neuron model drawn to scale. Middle and right, Magnified images of the boxed regions showing basal dendrite with spines (red). (b) Somatic EPSPs evoked alone (black) and 10 ms after APs (blue and red) in control (top) and with SK channels off (bottom). (c) Somatic EPSPs evoked alone (black) and 10 ms after APs (green and yellow) with NMDARs off (top) and both NMDAR and SK channels off (bottom). (d,e) Somatic EPSP amplitude (d) and width (e) for EPSPs evoked at different times after APs relative to the amplitude of EPSPs alone in control (blue) and with SK channels off (red). (f) Percentage increase in somatic EPSP amplitude after switch off of SK channels for EPSPs evoked 10 ms after APs versus synapse location. (g) APs at the soma and in spines at the indicated basal dendritic locations in control (blue) and with SK channels off (red). (h,i) Backpropagating AP (bAP) amplitude (h) and width (i) in spines versus distance from the soma. The dotted line indicates dendritic locations without spines. (j) Membrane potential 10 ms after AP onset in spines versus distances from the soma in control (blue) and with SK channels off (red). (k,l) Peak (k) and percentage change (l) in spine calcium concentration during backpropagating APs versus distance from the soma in control (blue) and with SK channels off (red). Line (l) represents fit to experimental data (Jones and Stuart, 2013).
Figure 6
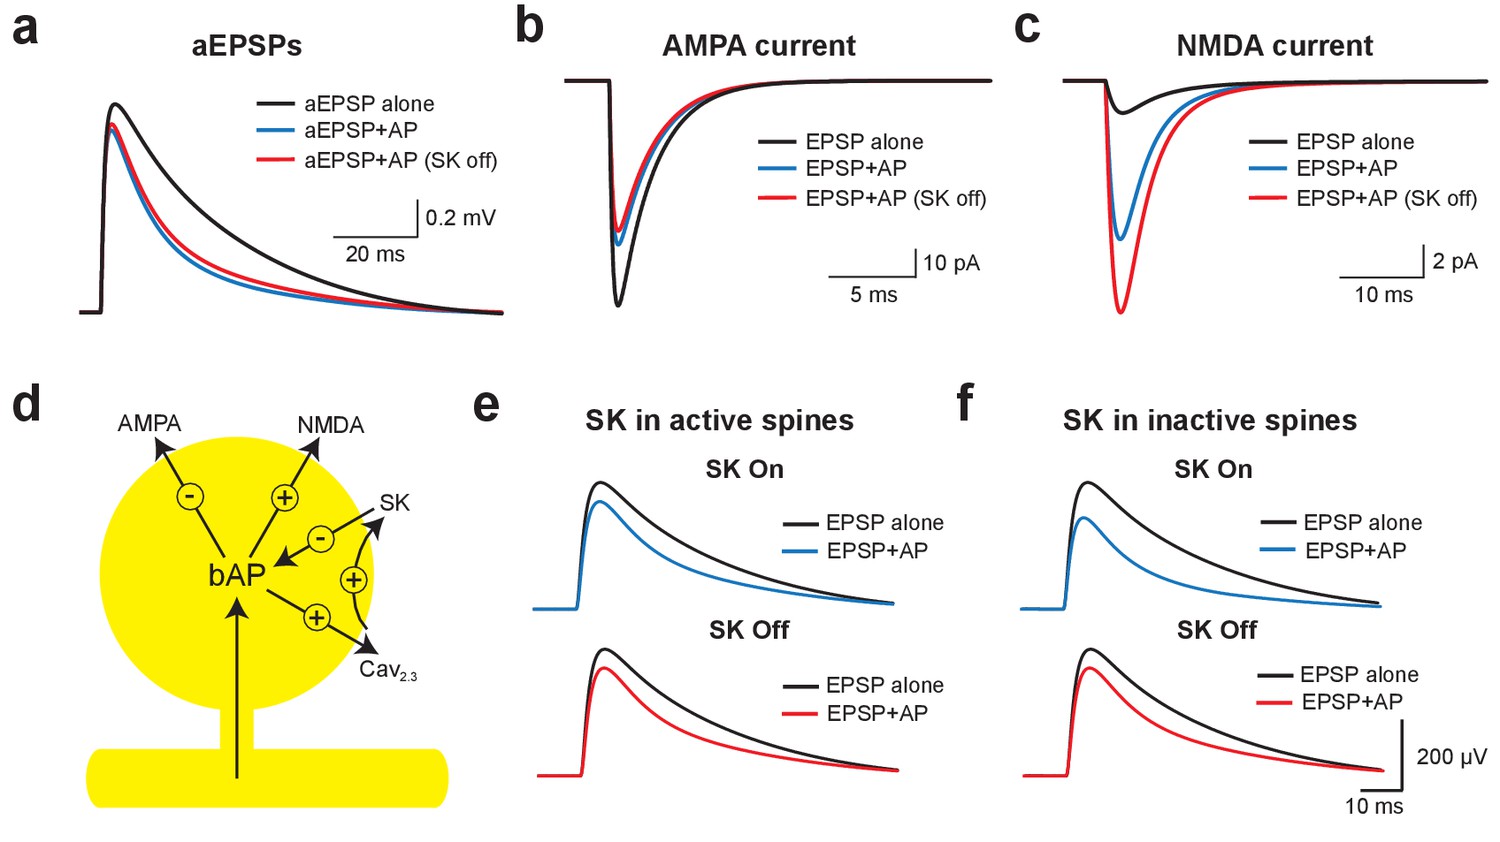
Mechanisms of EPSP suppression by APs.
(a) Somatic artificial EPSPs generated by somatic current injection alone (black) and 10 ms after APs in control (blue) and with SK channels off (red). (b,c) AMPA (b) and NMDA current (c) in spines receiving synaptic input during EPSPs alone (black) and 10 ms after APs in control (blue) and with SK channels off (red). (d) Schematic of the positive and negative impact of backpropagating APs (bAPs) on current flow through AMPA, NMDA, SK and voltage-activated calcium channels in spines. (e,f) Somatic EPSPs alone (black) and 10 ms after APs (blue and red) in control (top) and with SK channels off (bottom) in simulations were SK channels were located only in active spines receiving synaptic input (e) or only in inactive spines which did not receive synaptic input (f).
Figure 7

Impact of SK channels on spike-timing dependent synaptic plasticity.
(a,b) Left, EPSPs before and after AP-EPSP pairing at −10 ms (a) and + 10 ms (b) in control (top, black) and apamin (bottom, red). Right, Plot of EPSP amplitude versus time. Each point represents the average response over 5 min. (c,d) Average % change in EPSP amplitude 20–30 min after AP-EPSP pairing relative to baseline during AP-EPSP pairing at −10 ms (c; n = 7) and + 10 ms (d; n = 5) in control (black) and apamin (red). (e) Plot of the absolute % change in EPSP amplitude in apamin 20–30 min after AP-EPSP pairing at −10 ms (filled circles) and + 10 ms (open circles) versus EPSP rise time. Data fitted with a linear regression (r = 0.8; p<0.01).
Additional files
-
Transparent reporting form
- https://doi.org/10.7554/eLife.30333.009
Download links
A two-part list of links to download the article, or parts of the article, in various formats.
Downloads (link to download the article as PDF)
Open citations (links to open the citations from this article in various online reference manager services)
Cite this article (links to download the citations from this article in formats compatible with various reference manager tools)
Dendritic small conductance calcium-activated potassium channels activated by action potentials suppress EPSPs and gate spike-timing dependent synaptic plasticity
eLife 6:e30333.
https://doi.org/10.7554/eLife.30333


