Frontal cortex selects representations of the talker’s mouth to aid in speech perception
- Baylor College of Medicine, United States
- Michael E. DeBakey Veterans Affairs Medical Center, United States
Figures
Figure 1
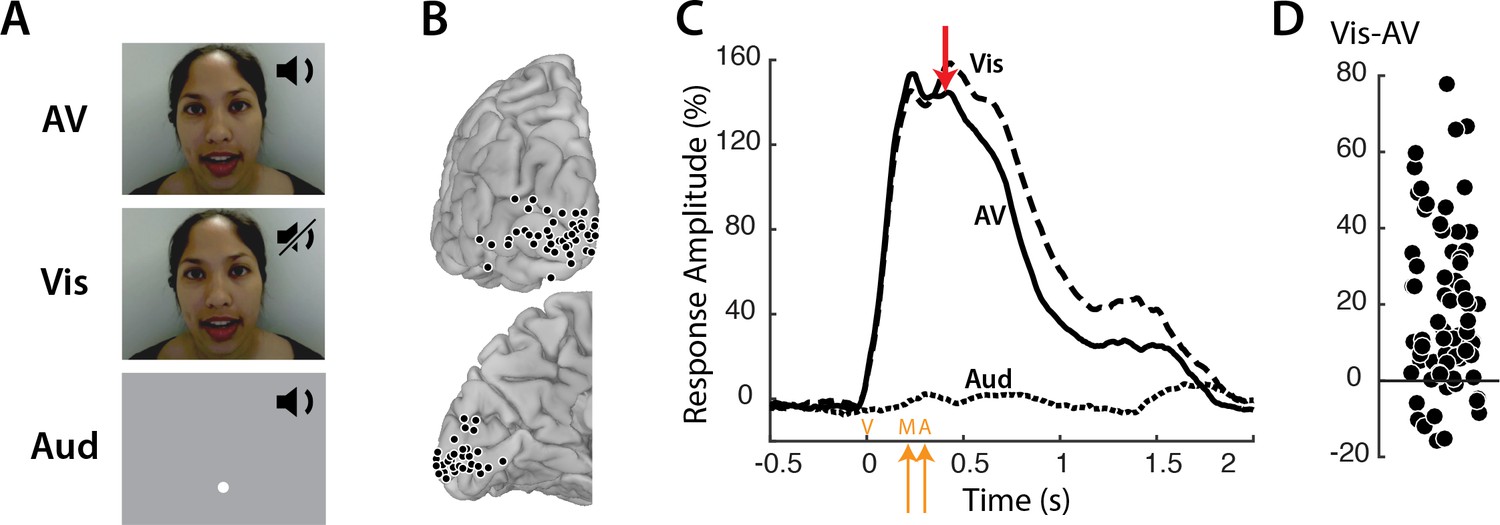
Visual cortex responses to speech.
(A) The speech stimuli consisted of audiovisual recordings of a female talker speaking words (AV) edited so that only the visual portion of the recording was presented (Vis) or only the auditory portion of the recording was presented (Aud). Subjects were instructed to fixate the talker’s mouth (AV and Vis conditions) or a fixation point presented at the same screen location as the talker’s mouth (Aud condition). (B) In eight subjects, a total of 73 responsive occipital electrodes were identified. Electrode locations (black circles) are shown on a posterior view (top) and a medial view (bottom) of the left hemisphere of a template brain. (C) Broadband responses (70–150 Hz) to AV (solid line), Vis (dashed line) and Aud (dotted line) speech averaged across electrodes. The red arrow indicates the first time point (400 ms) at which the response to Vis speech was significantly greater than the response to AV speech. On the x-axis, time zero corresponds to the onset of the video (V) followed by the onset of the talker’s mouth movements (M) at 200 ms and onset of auditory speech (A) at 283 ms (orange arrows). (D) The broadband response enhancement (Vis – AV) measured from 200 to 1500 ms. One symbol per electrode (symbols jittered along x-axis for improved visibility).
Figure 2

Retinotopic organization of speech responses in the visual cortex.
(A) Medial view of a cortical surface model of the left hemisphere brain of a single subject (anonymized subject ID YAI). Posterior electrode e81 (red circle) was located superior to the calcarine sulcus on the occipital pole (red circle) while anterior electrode e65 (blue circle) was located inferior to the calcarine on the medial wall of the hemisphere. The receptive field mapping stimulus consisted of a small checkerboard presented at random screen locations while subjects performed a letter detection task at fixation (not shown). (B) The responses evoked by the mapping stimulus in electrodes e81 (left panel) and e65 (right panel). Color scales corresponds to the amplitude of the visual evoked response at each location in the visual field, with the crosshairs showing the center of the visual field and the red and blue circles showing the center of a two-dimensional Gaussian fitted to the response. Electrode e81 had a central receptive field (eccentricity at RF center of 2.5°) while electrode e65 had a peripheral receptive field (eccentricity 10.9°). (C) The receptive field location for the two sample electrodes, e81 (red circle) and e65 (blue circle) are shown on the speech stimulus. Subjects were instructed to fixate the talker’s mouth and electrodes were classified as representing the mouth region of the talker’s face (red circles; less than 5° from the center of the mouth, white dashed line) or as non-mouth (blue circles;>5°). Electrode locations of mouth (red) and non-mouth (blue) electrodes shown on posterior and medial brain views. Response enhancement (Vis-AV) for each individual electrode; inset bar graph shows mean values (±standard error). (D) In a control speech experiment, a white fixation crosshair was presented on the talker’s shoulder, moving the mouth of the talker’s face to the visual periphery. Electrodes were classified as representing the mouth of the talker (red circles; less than 5° from the the center of the mouth, white dashed line) or non-mouth (blue circles;>5°). Mouth electrodes were in the periphery of the visual field (mean eccentricity of 9.5°). Response enhancement (Vis-AV) for each individual electrode; inset bar graph shows mean values (±standard error).
Figure 3
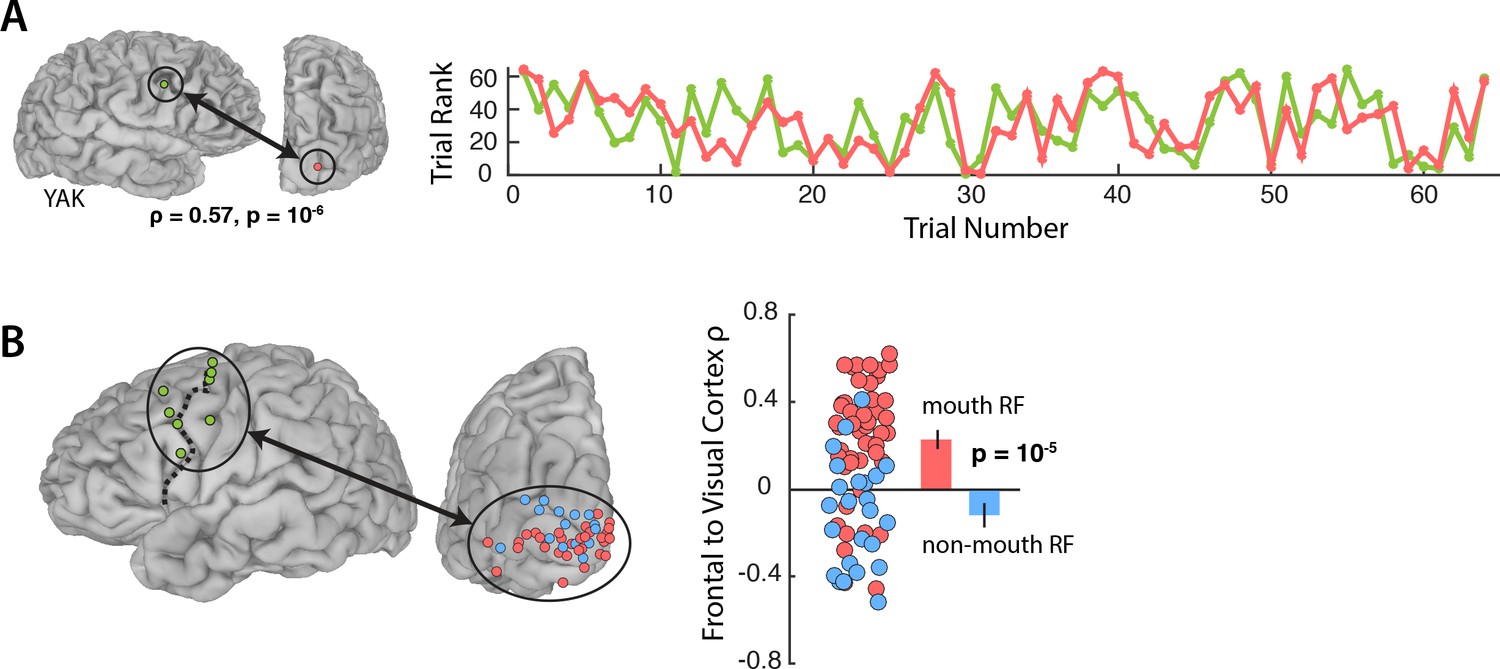
Functional connectivity with the frontal cortex.
(A) Average broadband responses for each Vis speech trial (200–1500 ms, 70–150 Hz) measured simultaneously in a single frontal (green) and a single visual cortex (red) electrode. Trials were ranked based on their response amplitudes (y axis) and shown with respect to their presentation orders (x axis). The Spearman rank correlation between the amplitude time series of the two electrodes was high (ρ = 0.57). (B) Left hemisphere of a template brain showing all frontal (green circles), visual cortex mouth (red) and non-mouth (blue) electrodes. Frontal electrodes were located near the precentral sulcus (dashed line). Plot shows Spearman rank correlation between each frontal-visual electrode pair; inset bar graph shows mean values (±standard error).
Figure 4

Frontal cortex responses.
(A) Broadband responses to AV (solid line), Vis (dashed line) and Aud (dotted line) speech averaged across frontal electrodes (locations shown on inset brain). (B) Scatter plot showing average responses (from 200 to 1500 ms) to Vis and AV speech for all frontal electrodes (green circles). Black diagonal line indicates the line of equality. (C) Broadband responses to AV (solid line) and Vis (dashed line) speech in a single frontal (green trace) and visual cortex (red trace) electrode. Dashed black lines depicts the onset of mouth movements and the onset of auditory speech (note expanded scale on x-axis compared with A). Vertical green line indicates the first time point at which the frontal response to Vis speech was enhanced relative to AV speech. Red line indicates the same for visual cortex. Black arrow highlights latency difference. (D) Enhancement latency for all frontal (green circles) and visual (red circles) electrodes. Letter codes along y-axis show different subjects. Vertical green and red lines indicate the average enhancement latency across all frontal and visual electrodes respectively.
Figure 5

Auditory cortex responses and connectivity.
(A) Broadband responses to AV (solid line), Vis (dashed line) and Aud (dotted line) speech across auditory electrodes located on the STG (purple circles on inset brain). (B) The broadband response enhancement (Aud – AV) with one symbol per electrode (symbols jittered along x-axis for improved visibility). Electrodes were divided into two groups, those showing a large (>=10%) enhancement (orange circles) and those showing little or no enhancement (yellow circles). (C) Anatomical distribution of STG electrodes by Aud – AV amplitude. (D) Frontal connectivity of STG electrodes by Aud – AV amplitude.
Tables
Table 1
LME for Amplitude in Visual Cortex
https://doi.org/10.7554/eLife.30387.004| Fixed effects: | Estimate | Std. error | DF | t-value | p-value |
|---|---|---|---|---|---|
| Baseline | 98 | 8.7 | 90.5 | 11.2 | 10−16 |
| A Speech | −83 | 5.9 | 134.5 | −14.2 | 10−16 |
| A Speech x Peripheral RF | 47 | 9.7 | 133.5 | 4.9 | 10−6 |
| V Speech | 26 | 5.4 | 132.9 | 4.8 | 10−6 |
| Peripheral RF | −65 | 15.2 | 90.5 | −4.3 | 10−5 |
| V Speech x Peripheral RF | −24 | 9.4 | 132.9 | −2.6 | 0.01 |
Table 2
LME for Amplitude in Visual Cortex (Control Experiment)
https://doi.org/10.7554/eLife.30387.005| Fixed effects: | Estimate | Std. error | DF | t-value | p-value |
|---|---|---|---|---|---|
| Baseline | 357 | 35 | 32.7 | 10.1 | 10−11 |
| V Speech | 50 | 7 | 32 | 6.7 | 10−7 |
| Non-mouth RF | −287 | 55 | 32.7 | -5 | 10−5 |
| V Speech x Non-mouth RF | −41 | 12 | 32 | −3.5 | 10−3 |
Table 3
LME for Frontal-Visual Cortex Connectivity
https://doi.org/10.7554/eLife.30387.007| Fixed effects: | Estimate | Std. error | DF | t-value | p-value |
|---|---|---|---|---|---|
| Baseline | 0.23 | 0.03 | 179.1 | 7.4 | 10−12 |
| Peripheral RF | −0.24 | 0.05 | 179.1 | −4.5 | 10−5 |
| A Speech | −0.1 | 0.04 | 141.1 | −2.5 | 0.01 |
| A Speech x Peripheral RF | 0.16 | 0.07 | 136.5 | 2.4 | 0.02 |
| V Speech x Peripheral RF | −0.1 | 0.06 | 134 | −1.6 | 0.1 |
| V Speech | 0.0003 | 0.04 | 134 | −0.007 | 1 |
Table 4
LME for Amplitude in Auditory Cortex
https://doi.org/10.7554/eLife.30387.010| Fixed effects: | Estimate | Std. error | DF | t-value | p-value |
|---|---|---|---|---|---|
| Baseline | 41 | 4.9 | 88.3 | 8.4 | 10−12 |
| V Speech | −32 | 5 | 83.2 | −6.4 | 10−8 |
| A Speech | 1 | 5.1 | 84.1 | 0.2 | 0.8 |
Table 5
LME for Frontal-Auditory Cortex Connectivity
https://doi.org/10.7554/eLife.30387.011| Fixed effects: | Estimate | Std. error | DF | t-value | p-value |
|---|---|---|---|---|---|
| Baseline | 0.04 | 0.04 | 83.6 | 1.1 | 0.3 |
| V Speech | −0.1 | 0.04 | 83.6 | −2.3 | 0.02 |
| A Speech | 0.02 | 0.04 | 84.4 | 0.4 | 0.7 |
Table 6
LME for Amplitude in Frontal Cortex
https://doi.org/10.7554/eLife.30387.012| Fixed effects: | Estimate | Std. error | DF | t-value | p-value |
|---|---|---|---|---|---|
| Baseline | 33 | 6.7 | 12.1 | 5 | 10−4 |
| V Speech | 20 | 5.2 | 14.1 | 3.9 | 10−3 |
| A Speech | -7 | 5.8 | 14.4 | −1.1 | 0.3 |
Additional files
-
Transparent reporting form
- https://doi.org/10.7554/eLife.30387.013
Download links
A two-part list of links to download the article, or parts of the article, in various formats.
Downloads (link to download the article as PDF)
Open citations (links to open the citations from this article in various online reference manager services)
Cite this article (links to download the citations from this article in formats compatible with various reference manager tools)
Frontal cortex selects representations of the talker’s mouth to aid in speech perception
eLife 7:e30387.
https://doi.org/10.7554/eLife.30387


