Systemic and local cues drive neural stem cell niche remodelling during neurogenesis in Drosophila
- University of Cambridge, United Kingdom
Figures
Figure 1 with 1 supplement
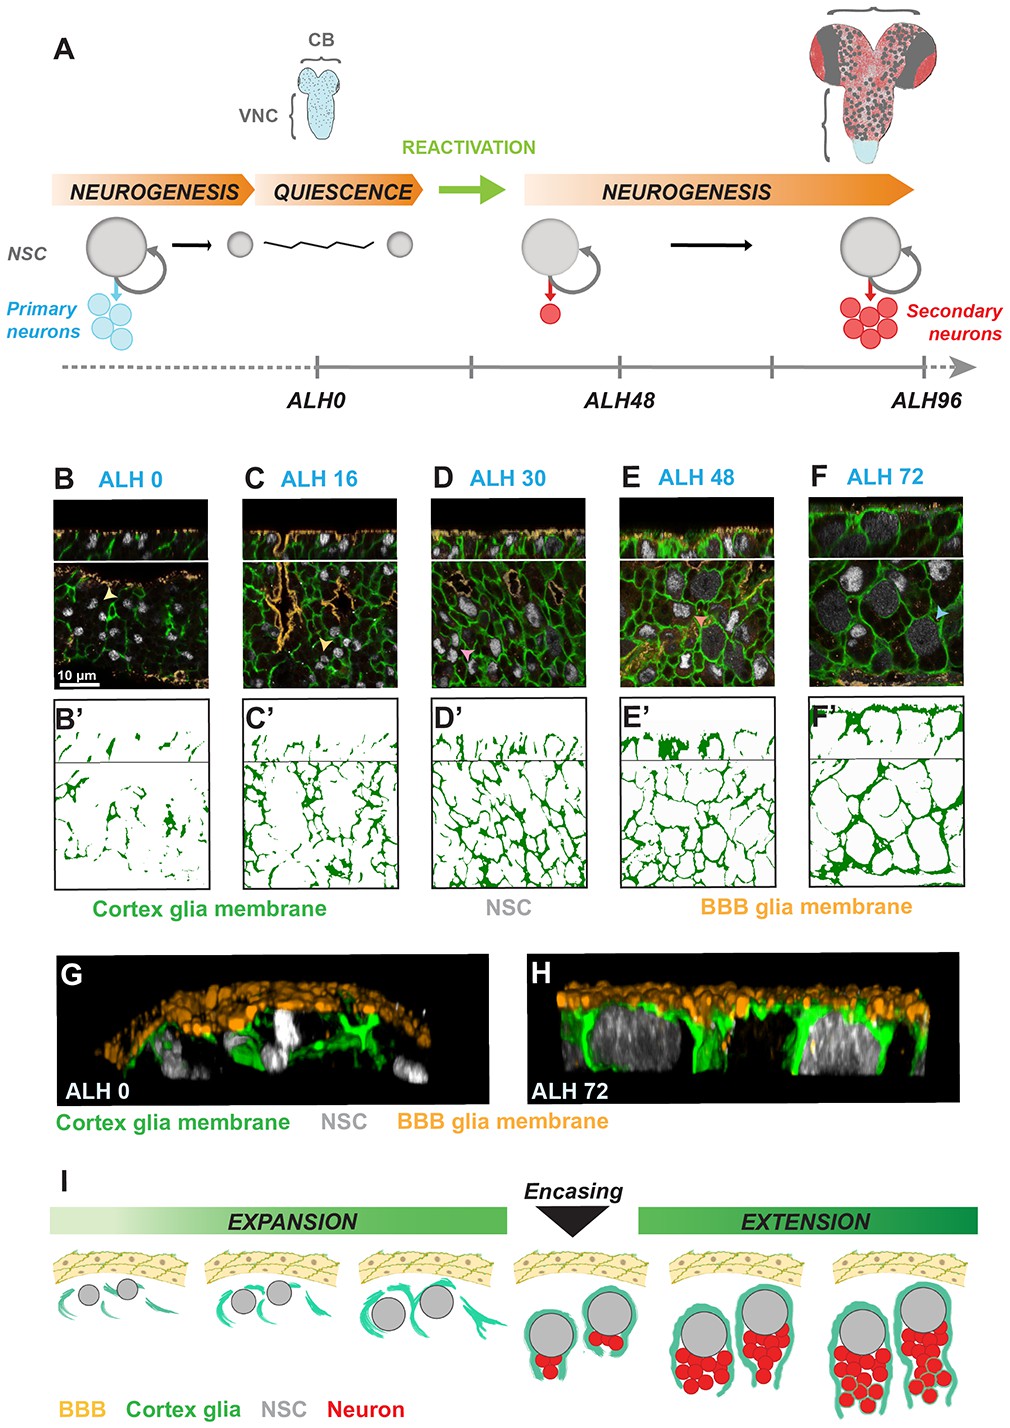
Individual Drosophila neural stem cells and their lineages are progressively enclosed in cortex glial chambers.
(A) Two waves of neurogenesis take place in the Drosophila CNS. NSCs divide asymmetrically during embryogenesis to form the larval nervous system. They then enter quiescence, from which they reactivate at early larval stages to generate neurons that build most of the adult nervous system. CB, central brain. VNC, ventral nerve cord. (B–F’) Progressive formation of cortex glial chambers. Five time points were assessed : ALH0, ALH16, ALH30, ALH48 and ALH72 (at 25°C). (B–F) Top and bottom panels, orthogonal and ventral views of a fragment of the VNC. (B’–F’) Cortex glial membrane signal outlines. (G–H) 3D reconstruction of an orthogonal view of a fragment of one VNC. (G) After larval hatching and H) at a late larval stage. Genotype : Nrv2::GFP, moody-GAL4 ; UAS-mCD8-RFP. (I) Sketch representing the timeline of cortex glial chamber formation. BBB, RFP, orange ; cortex glial membrane, Nrv2::GFP, green ; NSC, Deadpan, grey.
Figure 1—figure supplement 1
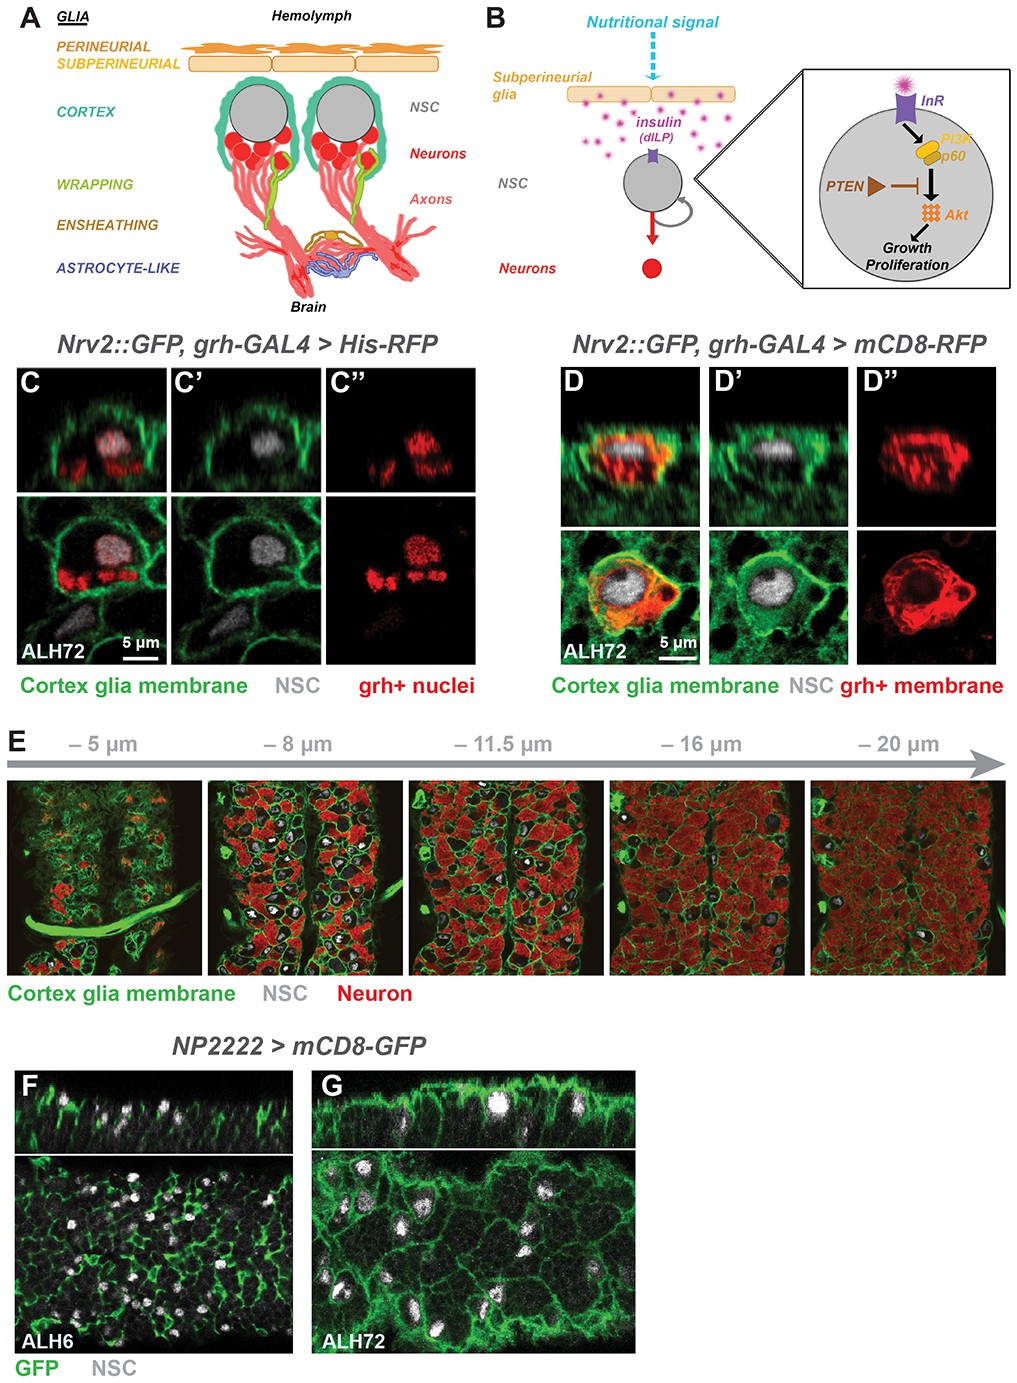
Organisation and formation of the cortex glial chamber.
(A) NSCs in late larval stages are in close proximity to the BBB and diverse of glial subtypes. (B) Activation of the PI3K/Akt pathway in NSCs triggers NSC reactivation. (C–D”) grh-GAL4 drives in only a subset of NSCs. We drove either a nuclear (C-C’’ ; UAS-Histone-RFP) or membrane reporter (D-D’’ ; UAS-mCD8-RFP) to illustrate the encasing of one NSC lineage in a cortex glial chamber. Top and bottom panels, orthogonal and ventral views of one grh+ NSC lineage. Cortex glial membrane, Nrv2::GFP, green ; NSC, Deadpan, grey and RFP, red. (E) Selected slices of one VNC Z-stack, ventral to dorsal. The Z scale starts from the ventral top of the confocal stack. The top of the cortex glial chamber peaks first, followed by the NSC population and finally the newly-born neurons. Cortex glial membrane, Nrv2::GFP, green ; NSC, Deadpan, grey ; neurons, ElaV, red. (F–G) Another labelling of cortex glial membrane (NP2222 >UAS-mCD8-GFP) confirms that NSC chamber morphology changes between larval hatching and third instar larval stage. Cortex glial membrane, GFP, green ; NSC, Deadpan, grey.
Figure 2 with 1 supplement
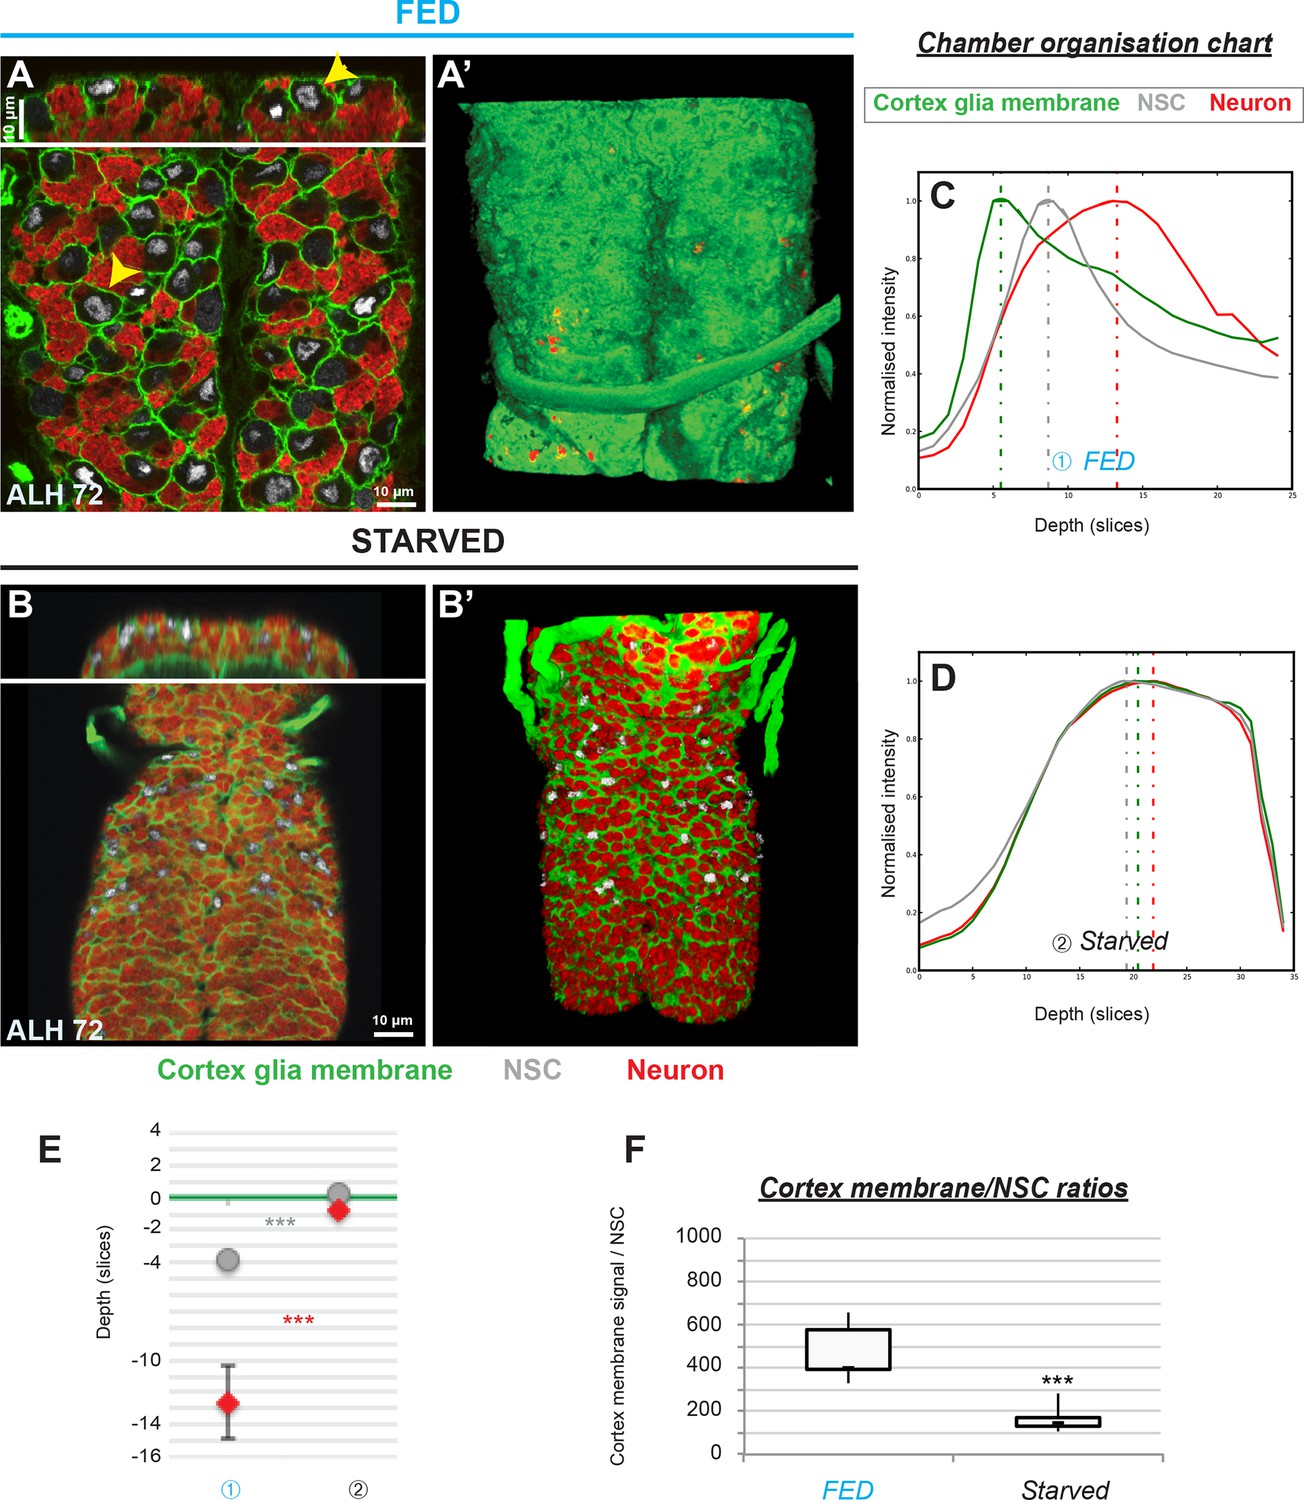
Cortex glial remodelling depends on nutritional cues.
(A–A’) Cortex glia enclose each NSC and its lineage into an individual membrane chamber in control fed larvae. (A) Bottom and top panels, ventral and orthogonal views of a third instar VNC. Yellow arrowheads show examples of individual chambers. (A’) 3D reconstruction, ventral view. (B–B’) Cortex glial chambers are not formed under starvation. (B) Top and bottom panels, orthogonal and ventral views of a fragment of one VNC. (B’) 3D reconstruction, ventral view. (C–D) Chamber organisation charts for (C) one control fed and (D) one starved larva. The graph represents signal intensities from cortex glial membranes (green), NSCs (grey) and neurons (red) plotted against depth for one VNC. Depth unit is the slice. (E) Statistical representation of NSC (grey) and neuron (red) Z positions relative to the top layer of the cortex glia (green line). p(NSC)=1.4*10−3, p(neuron)=5.2*10−4. n (FED) = 6 VNCs and n (Starved) = 6 VNCs. (F) Ratios between cortex glial membrane signal and NSCs. p=5.0*10−4. n (Fed) = 6 VNCs. n (Starved) = 6 VNCs. Cortex glial membrane, Nrv2::GFP, green ; NSC, Deadpan, grey ; neurons, ElaV, red.
Figure 2—figure supplement 1
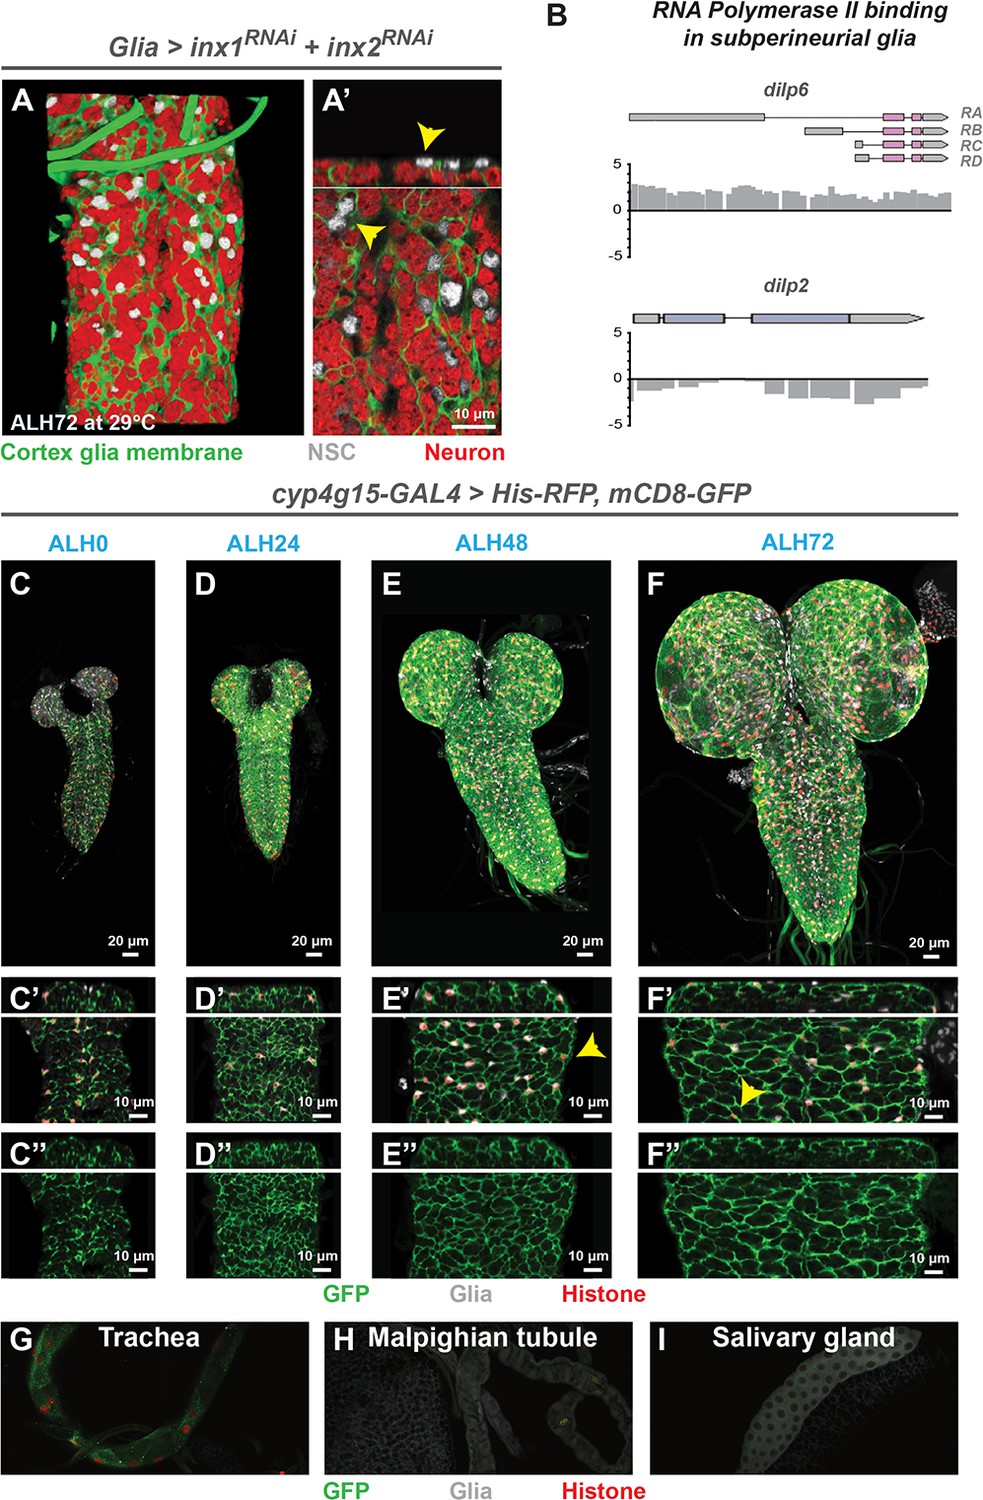
NSC chamber formation is nutrition-dependent.
(A–A’) Blocking nutritional sensing and relay in the brain through gap junction RNAi knockdown in glia impairs NSC chamber formation. (A) 3D reconstruction of the thoracic section of one VNC, ventral view. (A’) Top and bottom panels, orthogonal and ventral views. Cortex glial membrane, Nrv2 ::GFP, green ; NSC, Deadpan, grey ; neurons, ElaV, red. (B) Binding of Dam-PolII at the dilp6 locus indicates active dilp6 transcription in subperineurial glia. Dam-PolII was not significantly bound at the other dilp loci (dilp2 shown). Scale bars represent log2 ratio change between Dam-PolII and Dam alone (reference) samples. (C–I) Expression of cyp4g15-GAL4, a newly identified cortex glial driver. cyp4g15-GAL4 was used to simultaneously drive membrane (UAS-mCD8-GFP) and nuclear markers (UAS-Histone-RFP). VNCs were imaged at ALH0, ALH24, ALH48 and ALH72. mCD8-GFP, GFP, green ; His-RFP, RFP, red; glial nuclei, Repo, grey. (C–F) Whole VNC projection. (C’–F”) Top and bottom panels, orthogonal and ventral views of a portion of one VNC. The mCD8-GFP signal displays a characteristic pattern of cortex glial chamber throughout time. RFP+ nuclei colocalise strongly with Repo+ nuclei. A few neurons are also stained (yellow arrowheads). (G–I) cyp4g15-GAL4 drives almost exclusively in the CNS, with the exception of a few cells in the tracheal system.
Figure 3 with 2 supplements
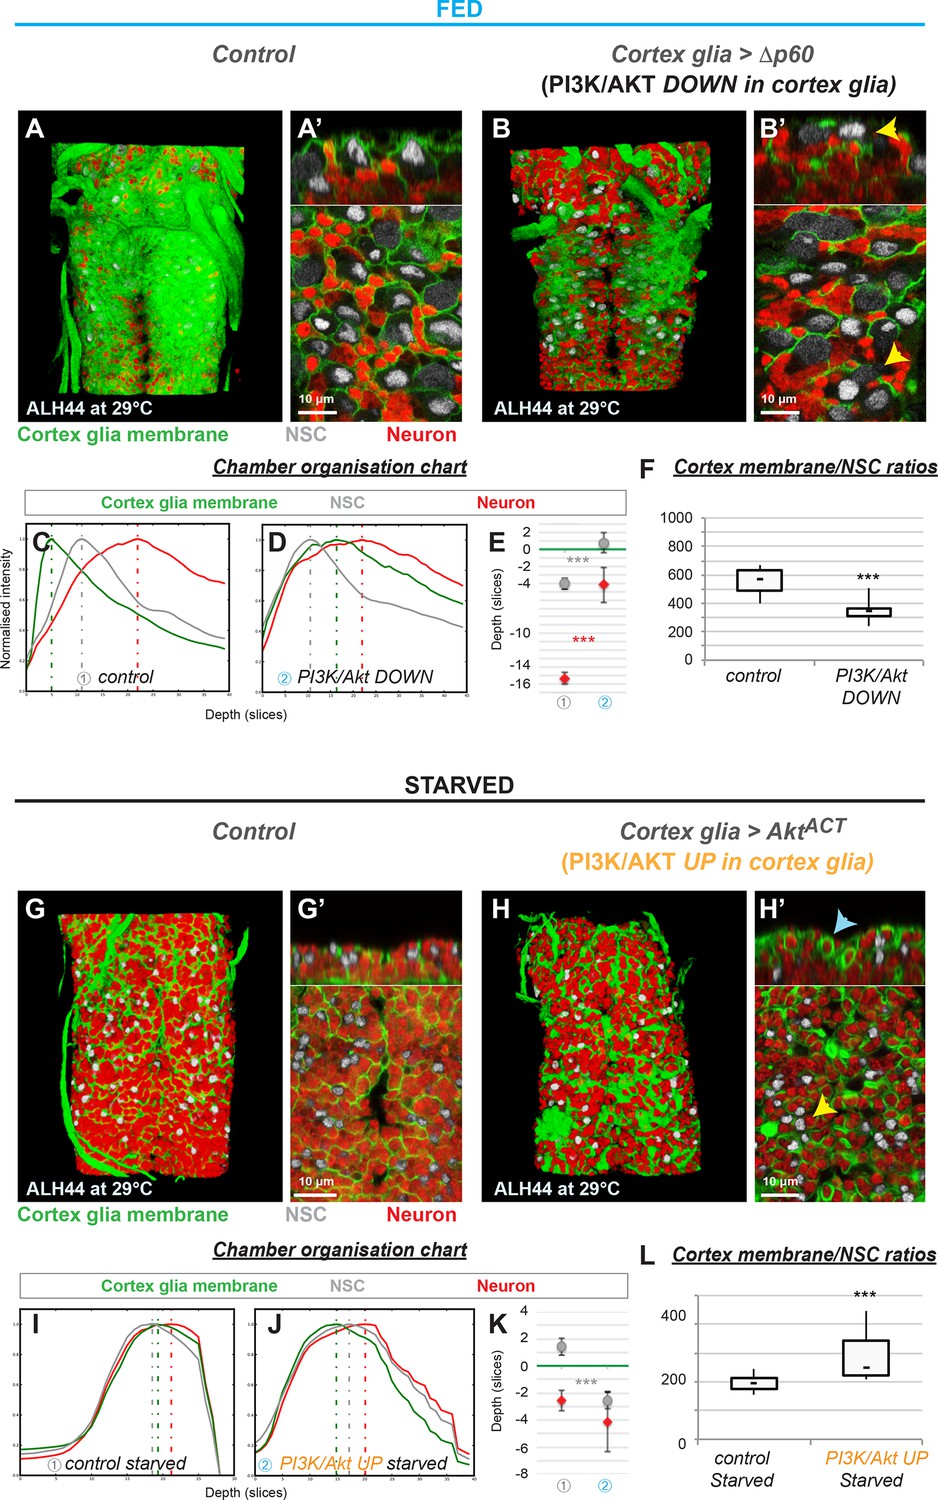
The insulin pathway is required in the cortex glia for autonomous chamber growth.
(A–F) Knockdown of insulin signalling specifically in the cortex glia impairs chamber formation. (A) 3D reconstruction of the thoracic section of one fed control VNC, ventral view. (A’) Top and bottom panels, orthogonal and ventral views. (B) 3D reconstruction of the thoracic section of one VNC of Δp60 overexpression at ALH60, ventral view. (B’) Top and bottom panels, orthogonal and ventral views. Yellow arrowheads show examples of uncased NSCs. (C–E) Chamber organisation chart. The graph represents signal intensities from cortex glial membranes (green), NSCs (grey) and neurons (red) plotted against depth for one VNC in (C) control and (D) Δp60 overexpression. Depth unit is the slice. (E) Statistical representation of NSC (grey) and neuron (red) Z positions relative to the top layer of the cortex glia (green line). p(NSC)=6.5*10−3, p(neuron)=6.9*10−4. (F) Ratios between cortex glial membrane signal and NSCs. p=1.1*10−3. n (control) = 6 VNCs. n (Δp60)=7 VNCs. (G–L) Activation of insulin signalling in the cortex glia only is not sufficient for NSC encasing in starved conditions. (G) 3D reconstruction of the thoracic section of one starved control VNC, ventral view. (G’) Top and bottom panels, orthogonal and ventral views. (H) 3D reconstruction of the thoracic section of one VNC of starved AktACT overexpression, ventral view. (H’) Top and bottom panels, orthogonal and ventral views. Yellow arrowheads show examples of unenclosed NSCs. Blue arrowheads show examples of encased primary neurons. (I–K) Chamber organisation chart. The graph represents signal intensities from cortex glial membranes (green), NSCs (grey) and neurons (red) plotted against depth for one VNC in I) starved control and (J) starved AktACT overexpression. Depth unit is the slice. (K) Statistical representation of NSC (grey) and neuron (red) Z positions relative to the top layer of the cortex glia (green line). p(NSC)=4.5*10−4, p(neuron)=0.52. (L) Ratios between cortex glial membrane signal and NSCs. p=7.3*10−3. n (control) = 9 VNCs. n (AktACT) = 10 VNCs. For all the stainings : Cortex glial membrane, Nrv2::GFP, green ; NSC, Dpn, grey ; neurons, ElaV, red.
Figure 3—figure supplement 1

The insulin receptor is required in the cortex glia for chamber formation.
Blocking InR function specifically in the cortex glia impairs chamber formation. (A) 3D reconstruction of the thoracic section of one fed control VNC, ventral view. (A’) Top and bottom panels, orthogonal and ventral views. (B) 3D reconstruction of the thoracic section of one VNC of 2X InRDN expression, ventral view. (B’) Top and bottom panels, orthogonal and ventral views. Yellow arrowheads show examples of uncased NSCs. (C–E) Chamber organisation chart. The graph represents signal intensities from cortex glial membranes (green), NSCs (grey) and neurons (red) plotted against depth for one VNC in C) control and D) 2X InRDN overexpression. Depth unit is the slice. (E) Statistical representation of NSC (grey) and neuron (red) Z positions relative to the top layer of the cortex glia (green line). p(NSC)=6.7*10−5, p(neuron)=9.6*10−5. (F) Ratios between cortex glial membrane signal and NSCs. p=4.3*10−3. n (control) = 8 VNCs. n (2X InRDN)=8 VNCs. For all the stainings : Cortex glial membrane, Nrv2::GFP, green ; NSC, Dpn, grey ; neurons, ElaV, red.
Figure 3—figure supplement 2

Cortex glial division is not required for NSC chamber formation.
(A–C) Knockdown of stg/cdc25 and overexpression of dacapo (dap) in cortex glia prevents cell division. Maximal projection of a VNC for control (A), stg knockdown (B) and dap overexpression (C) conditions. NSC, Deadpan, grey ; glia nuclei, Repo, magenta. (D) Total counts of glial cells normalised to NSC number show that cortex glial division is highly impaired in stg knockdown and dap overexpression in the cortex glia. p(stg RNAi)=7.8*10−6. p(dacapo)=3.0*10−3. n (control) = 10 VNCs. n (stg RNAi)=10 VNCs. n (dap) = 5 VNCs. (E–G’) Preventing cortex glial division does not impair chamber formation. (E) 3D reconstruction of the thoracic section of one VNC of a control condition, ventral view. (E’) Top and bottom panels, orthogonal and ventral views. (F) 3D reconstruction of one VNC thoracic section when stg is knocked-down in cortex glia, ventral view. (F’) Top and bottom panels, orthogonal and ventral views of a portion. (G) 3D reconstruction of one VNC thoracic section when dap is overexpressed in cortex glia, ventral view. (G’) Top and bottom panels, orthogonal and ventral views of a portion. Cortex glial membrane, Nrv2::GFP, green ; NSC, Dpn, grey ; neurons, ElaV, red. (H–K) Chamber organisation chart. The graph represents the signal intensities from cortex glial membranes (green), NSCs (grey) and neurons (red) plotted against depth for one VNC from H) control, (I) stg RNAi and J) dap overexpression. Depth unit is the slice. (K) Statistical representation of NSC (grey) and neuron (red) Z positions relative to the top layer of the cortex glia (green line). p(NSC stg RNAi)=0.78, p(neuron stg RNAi)=0.10. p(NSC dap)=0.32, p(neuron dap)=0 .39. n (control) = 10 VNCs. n (stg RNAi)=7 VNCs. n (dap) = 5 VNCs L) Ratios between cortex glial membrane signal and NSCs. p (stg RNAi)=0.39. p (dap) = 0.73. n (control) = 10 VNCs. n (stg RNAi)=10 VNCs. n (dap) = 5 VNCs).
Figure 4 with 1 supplement
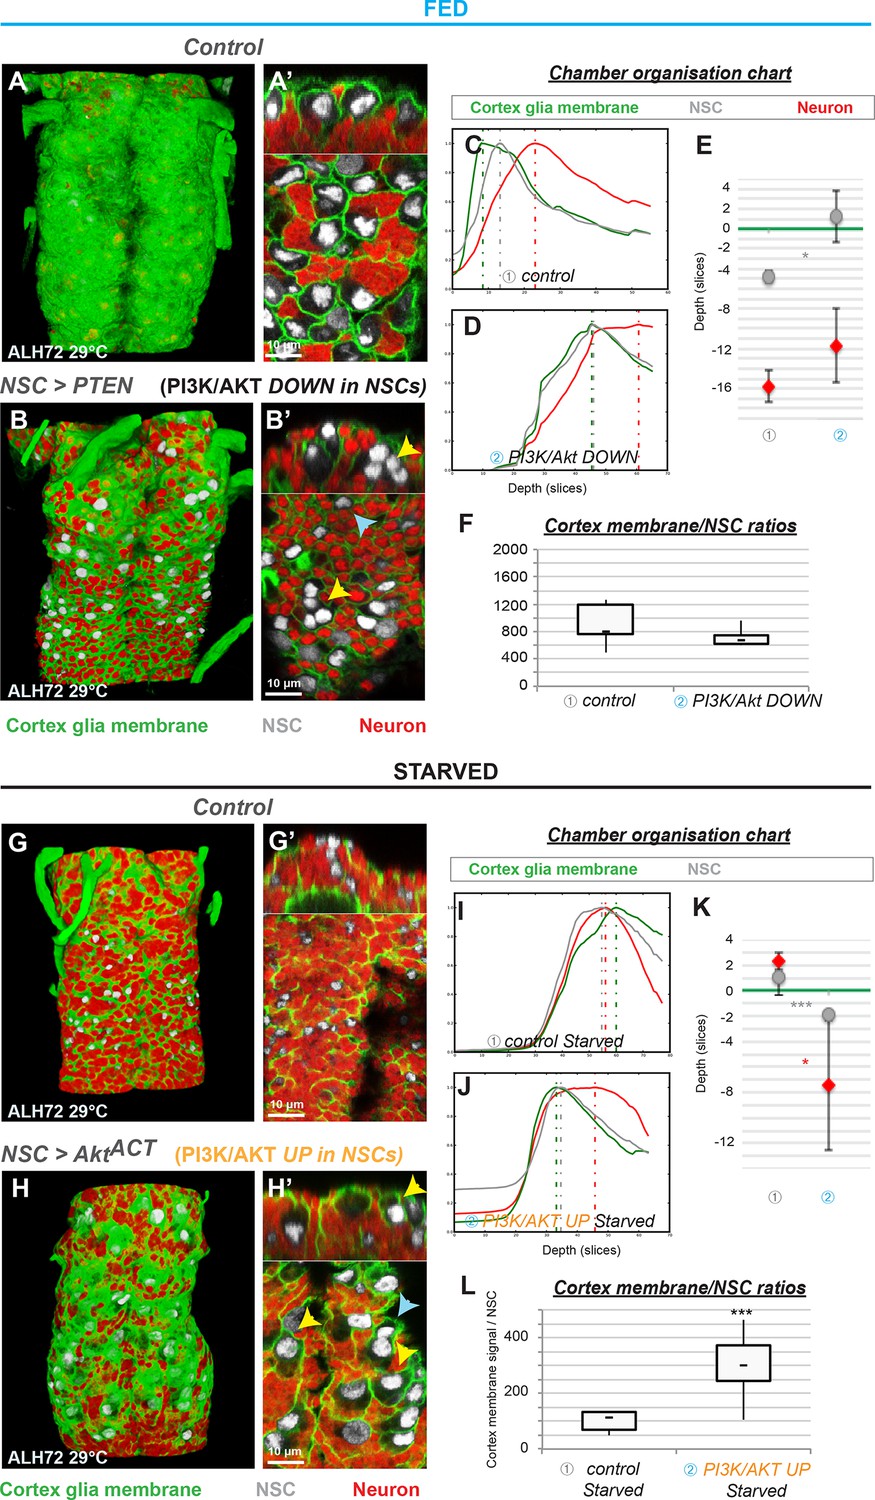
The insulin pathway is required in NSCs for non-autonomous cortex glial chamber remodelling.
(A–F) Knockdown of insulin signalling specifically in NSCs impairs chamber formation. (A) 3D reconstruction of the thoracic section of one fed control VNC, ventral view. (A’) Top and bottom panels, orthogonal and ventral views. (B) 3D reconstruction of the thoracic section of one VNC of PTEN overexpression, ventral view. (B’) Top and bottom panels, orthogonal and ventral views. Yellow arrowheads show examples of unenclosed NSCs. (C–E) Chamber organisation chart. The graph represents the signal intensities from cortex glial membranes (green), NSCs (grey) and neurons (red) plotted against depth for one VNC in C) control and D) PTEN overexpression. Depth unit is the slice. (E) Statistical representation of NSC (grey) and neuron (red) Z positions relative to the top layer of the cortex glia (green line). p(NSC)=6.6*10−2, p(neuron)=0.33. (F) Ratios between cortex glial membrane signal and NSCs. p=0.21. n (control) = 5 VNCs. n (PTEN) = 6 VNCs. (G–L) Activation of insulin signalling in NSCs only is sufficient for chamber remodelling in starved conditions. (G) 3D reconstruction of the thoracic section of one VNC from a starved control condition, ventral view. (G’) Top and bottom panels, orthogonal and ventral views. (H) 3D reconstruction of the thoracic section of one VNC from a starved AktACT overexpression, ventral view. (H’) Top and bottom panels, orthogonal and ventral views. Yellow arrowheads show examples of encased NSCs. Blue arrowheads show examples of unenclosed NSCs. (I–K) Chamber organisation chart. The graph represents the signal intensities from cortex glial membranes (green), NSCs (grey) and neurons (red) plotted against depth for one VNC for I) starved control and J) starved AktACT overexpression. Depth unit is the slice. (K) Statistical representation of NSC (grey) and neuron (red) Z positions relative to the top layer of the cortex glia (green line). p(NSC)=4.8*10−2, p(neuron)=2.0*10−2. (L) Ratios between cortex glial membrane signal and NSCs. p=7.8*10−3. n (control) = 5 VNCs. n (AktACT) = 6 VNCs. For all the stainings : Cortex glial membrane, Nrv2::GFP, green ; NSC, Dpn, grey ; neurons, ElaV, red.
Figure 4—figure supplement 1
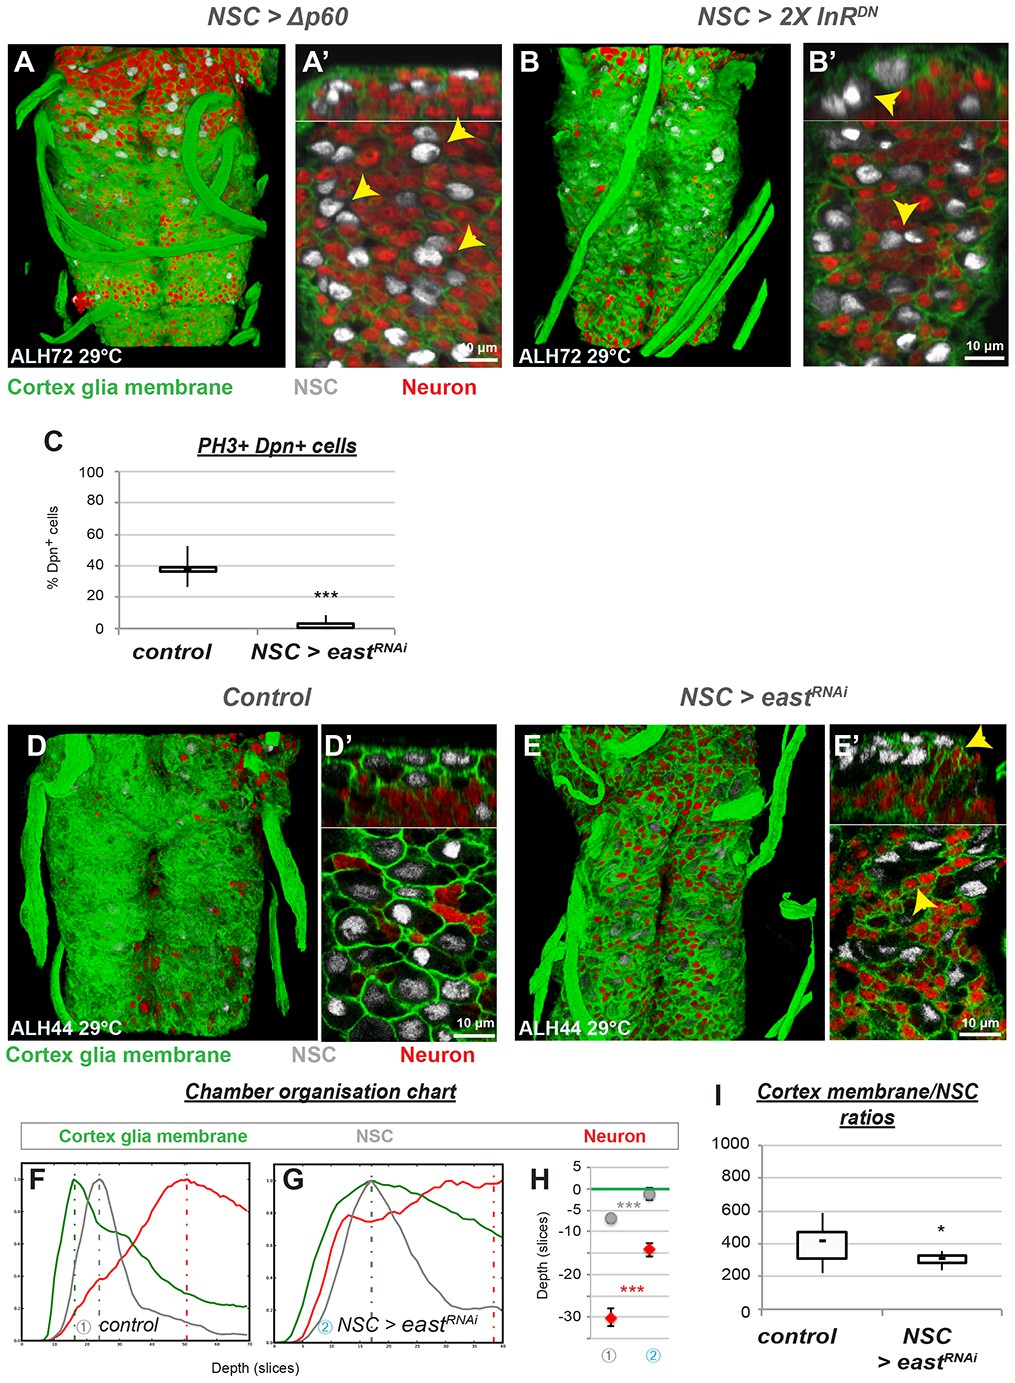
NSC reactivation is crucial for cortex glial chamber organisation.
(A–B’) Delaying NSC reactivation alters chamber formation. (A) 3D reconstruction of the thoracic section of one VNC of Δp60 overexpression, ventral view. (A’) Top and bottom panels, orthogonal and ventral views. (B) 3D reconstruction of the thoracic section of one VNC of 2X InRDN expression, ventral view. (B’) Top and bottom panels, orthogonal and ventral views. Yellow arrowheads show examples of uncased NSCs. (C–I) Preventing NSC mitotic re-entry alters chamber organisation but has restricted impact on membrane growth. (C) RNAi knockdown of east in NSCs blocks mitotic re-entry. Mitotic index. p (east RNAi)=2.1*10−11. (D) 3D reconstruction of the thoracic section of one fed control VNC, ventral view. (D’) Top and bottom panels, orthogonal and ventral views. (E) 3D reconstruction of the thoracic section of one VNC of east RNAi, ventral view. (E’) Top and bottom panels, orthogonal and ventral views. Yellow arrowheads show examples of uncased NSCs. (F–H) Chamber organisation chart. The graph represents signal intensities from cortex glial membranes (green), NSCs (grey) and neurons (red) plotted against depth for one VNC in (F) control and (G) 2X InRDN expression. Depth unit is the slice. (H) Statistical representation of NSC (grey) and neuron (red) Z positions relative to the top layer of the cortex glia (green line). p(NSC)=2.9*10−4, p(neuron)=2.8*10−4. (I) Ratios between cortex glial membrane signal and NSCs. p=5.1*10−2. n (control) = 10 VNCs. n (east RNAi)=10 VNCs. For all the stainings : Cortex glial membrane, Nrv2::GFP, green ; NSC, Dpn, grey ; neurons, ElaV, red.
Figure 5 with 2 supplements
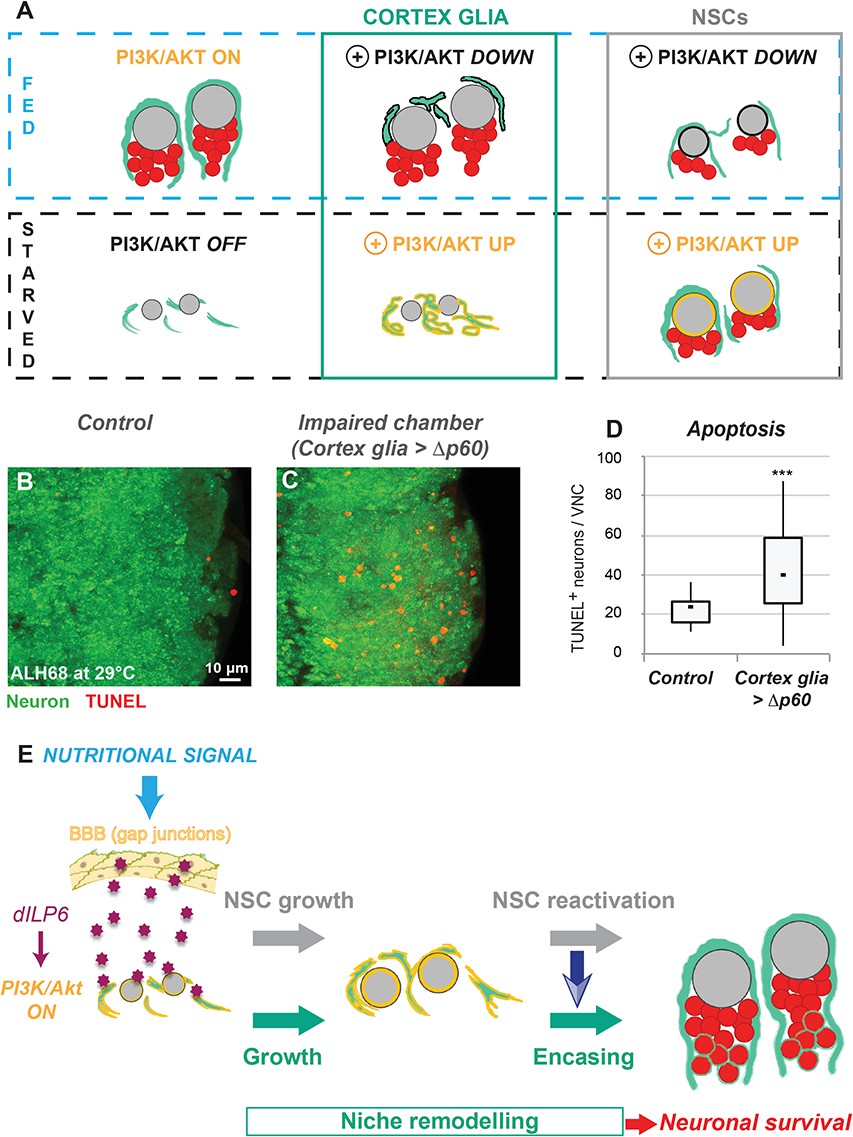
Nutrition-dependent formation of the cortex glial chamber promotes survival of newly-born neurons.
(A) Selective manipulations of the PI3K/Akt pathway identify both autonomous and non-autonomous signals required for chamber formation. (B–D) Neuronal apoptosis is increased when chamber formation is impaired. TUNEL stainings in one VNC from B) control and C) Δp60 overexpression. Ventral view. Neuron, ElaV, green ; TUNEL, red. (D) Statistical analysis. p=2.9*10−2. n (control) = 10 VNCs. n (Δp60)=9 VNCs. (E) Model of cortex glial chamber remodelling (see text for details).
Figure 5—figure supplement 1

Role and formation of the cortex glial chamber.
(A–B) Impairing cortex glial chamber formation has little impact on NSCs. (A) VNC NSC counts are statistically comparable in control and Δp60 expression in cortex glia. p=0.17. n (control) = 10 VNCs. n (Δp60)=11 VNCs. (B) VNC NSCs were assessed for phospho-histone H3, a mitotic marker, and for EdU incorporation (see Materials and methods). PH3-EdU-p=2.7*10−3 EdU+ p= 5.2*10−5; PH3+ p= 2.4*10−2. n (control) = 10 VNCs. N (Δp60)=11 VNCs. (C) Neuronal volume decreases when cortex glial chamber formation is impaired. Total VNC volume of ElaV +cells is measured and normalised to control average. p=2.5*10−6. n (control) = 7 VNCs. n (Δp60)=8 VNCs. (D–G) Impairing cortex glial division does not impair survival of newly-born neurons. (D) VNC NSC counts are statistically comparable between control and stg RNAi in cortex glia. p=0.49. n (control) = 12 VNCs. n (stg RNAi)=11 VNCs. (E) VNC NSCs were assessed for phospho-histone H3, a mitotic marker, and for EdU incorporation (see Materials and methods). p (PH3-EdU-)=1.1*10−2 p(EdU+)=0.71; p(PH3+)=7.8*10−2. n (control) = 13 VNCs. n (stg RNAi)=11 VNCs. (F–G) Impairing cortex glial division does not alter neuronal apoptosis. TUNEL stainings in one VNC of F) control and G) stg RNAi in cortex glia. Ventral view. Neuron, ElaV, green ; TUNEL, red.
Figure 5—figure supplement 2
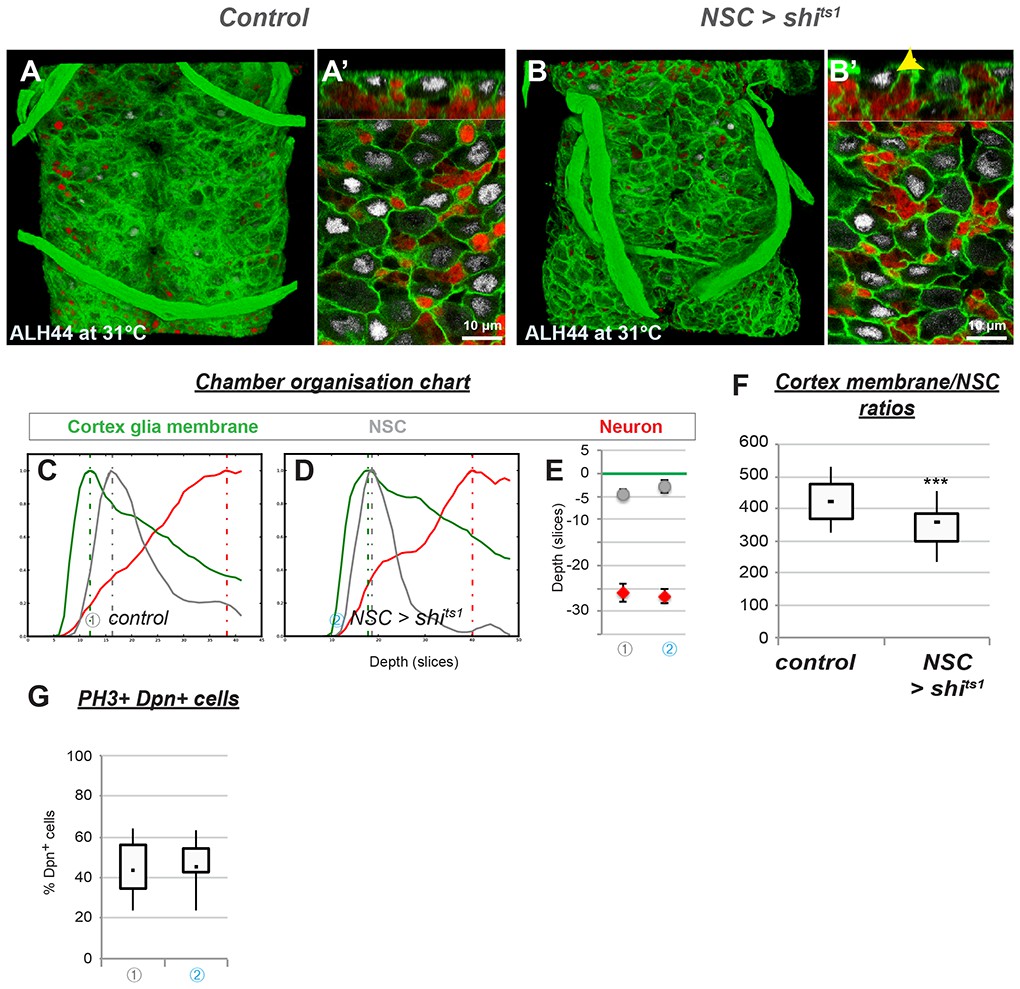
Impairing dynamin-dependent signalling in NSCs has limited impact on chamber formation.
Expressing the thermosensitive allele shibirets1 in NSCs does not prevent chamber formation. (A) 3D reconstruction of the thoracic section of one fed control VNC, ventral view. (A’) Top and bottom panels, orthogonal and ventral views. (B) 3D reconstruction of the thoracic section of one VNC of shits1 overexpression, ventral view. (B’) Top and bottom panels, orthogonal and ventral views. Yellow arrowheads show examples of uncased NSCs. (C–E) Chamber organisation chart. The graph represents signal intensities from cortex glial membranes (green), NSCs (grey) and neurons (red) plotted against depth for one VNC in C) control and D) shits1 overexpression. Depth unit is the slice. (E) Statistical representation of NSC (grey) and neuron (red) Z positions relative to the top layer of the cortex glia (green line). p(NSC)=6.3*10−2, p(neuron)=0.7. (F) Ratios between cortex glial membrane signal and NSCs. p=2.8*10−2. (G) Mitotic index. p=0.76. n (control) = 10 VNCs. n (2X InRDN)=10 VNCs. For all the stainings : Cortex glial membrane, Nrv2::GFP, green ; NSC, Dpn, grey ; neurons, ElaV, red.
Additional files
-
Transparent reporting form
- https://doi.org/10.7554/eLife.30413.014
Download links
A two-part list of links to download the article, or parts of the article, in various formats.
Downloads (link to download the article as PDF)
Open citations (links to open the citations from this article in various online reference manager services)
Cite this article (links to download the citations from this article in formats compatible with various reference manager tools)
Systemic and local cues drive neural stem cell niche remodelling during neurogenesis in Drosophila
eLife 7:e30413.
https://doi.org/10.7554/eLife.30413


