An adaptation of astronomical image processing enables characterization and functional 3D mapping of individual sites of excitation-contraction coupling in rat cardiac muscle
- Saarland University, Germany
Figures
Figure 1 with 7 supplements
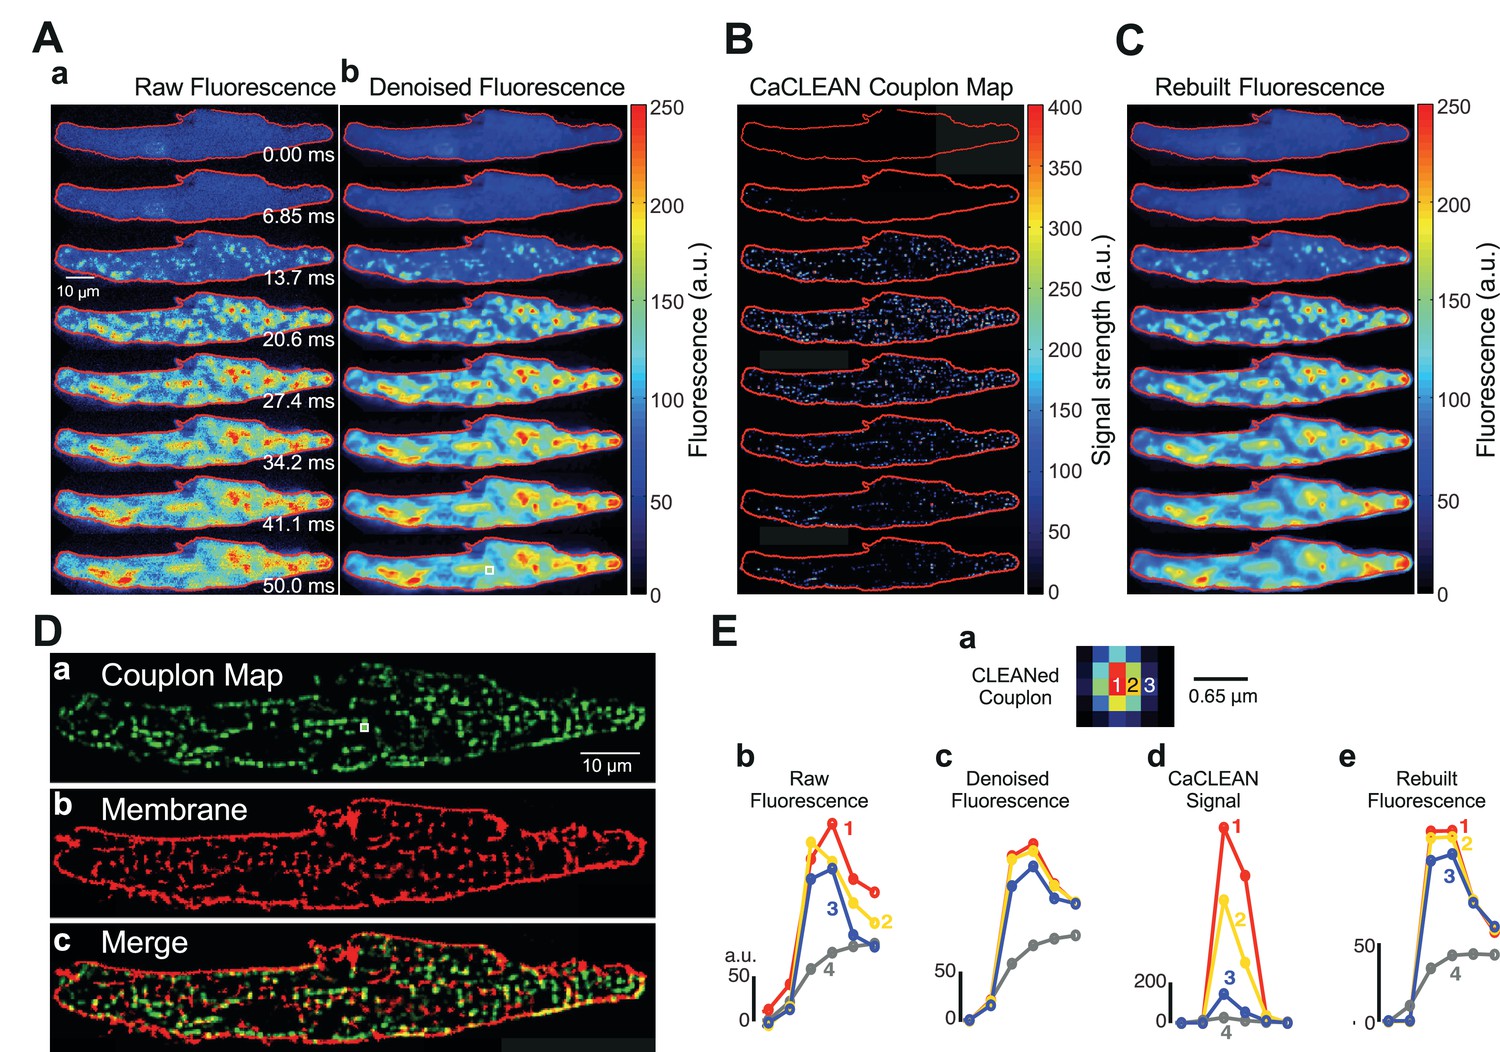
Identification, mapping and analysis of the behavior of ECC couplons in a mouse atrial myocyte during an individual Ca2+ transient.
(A) Panel a depicts raw confocal images of the first 50 ms of an electrically evoked Ca2+ transient; panel b the denoised images from (Aa). (B) CaCLEANed images with Ca2+ release sites clearly visible. (C) Ca2+ transient rebuilt from the CaCLEANed image series in (B). (D) The couplon map (a) the plasma membrane topology (b) and an overlay of both (c). (E) Single pixel transients (traces 1~3) or global transient (trace 4) of the raw fluorescence (b) denoised fluorescence (c) CaCLEANed fluorescence (d) and rebuilt fluorescence (e), respectively. The positions of the single-pixel data are depicted in panel (a). Similar results were found in all cells analyzed (n = 46 myocytes from three animals).
Figure 1—figure supplement 1
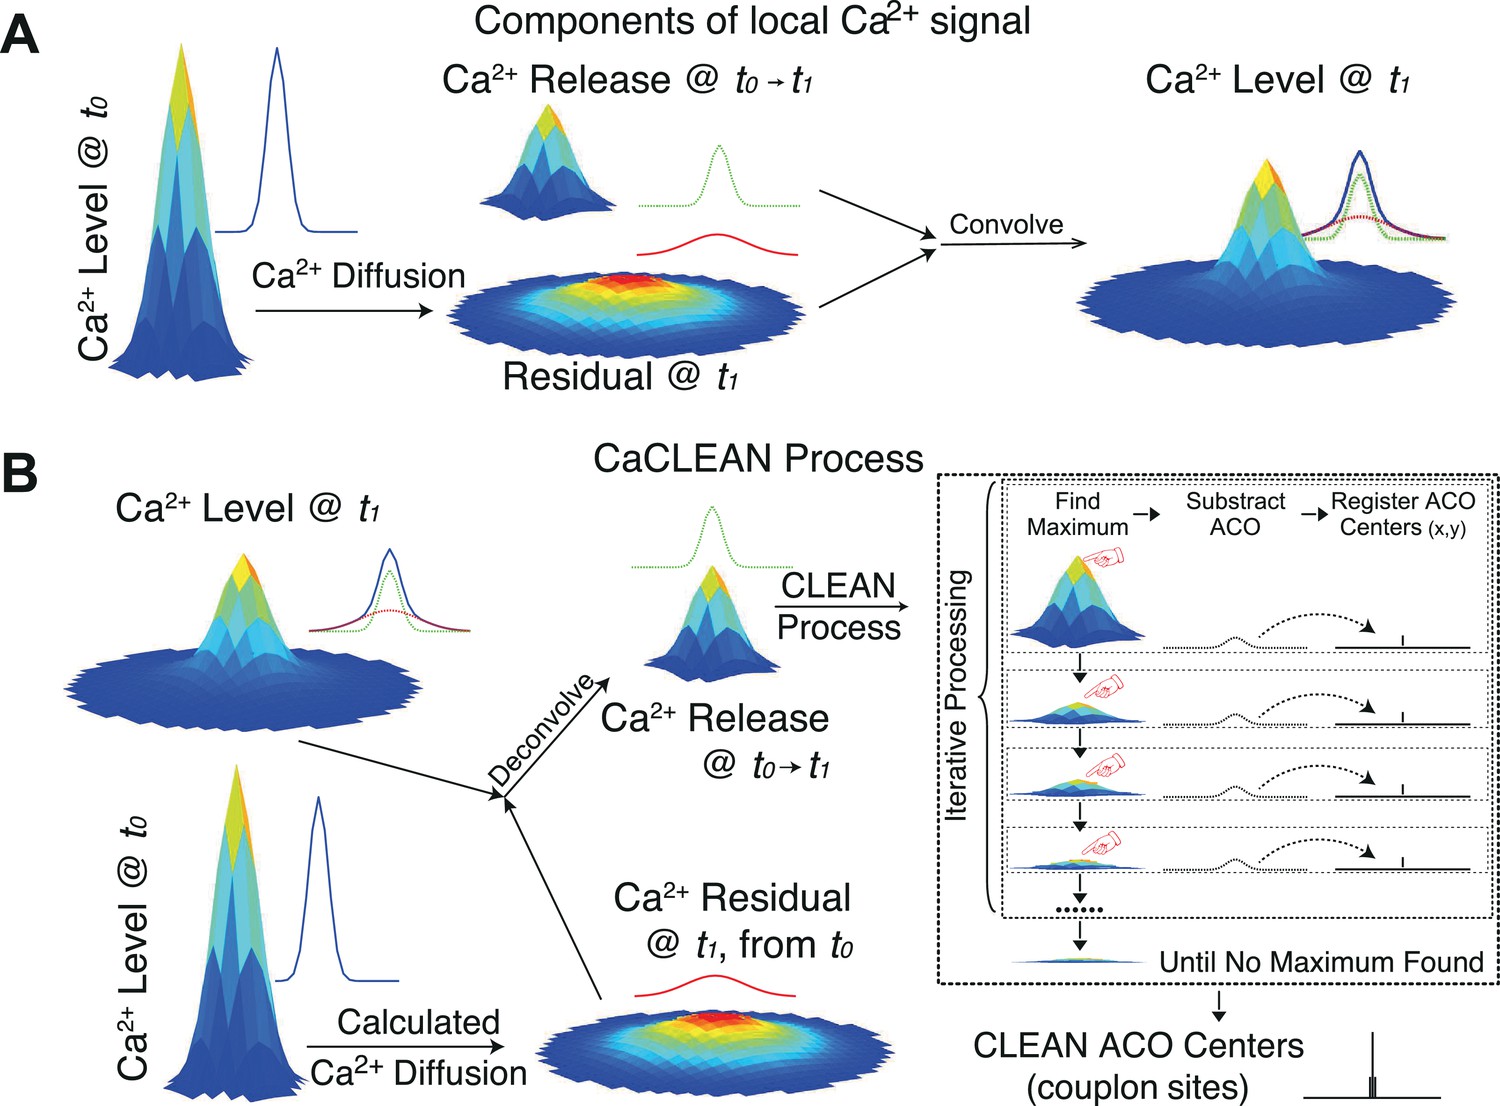
Components of local Ca2+ signals and the principle steps of the CaCLEAN algorithm.
(A,) Summary of the processes that build up a local Ca2+ signal at t1 (Ft1), taking into account the Ca2+ signal from t0 (Ft0), its diffusion during the time t0 to t1 (blue to red trace) and additional Ca2+ release (green trace, from left to right). (B) The data pipeline and principle steps of the CaCLEAN algorithm. First, the Ca2+ release component (between t0 and t1) is deconvolved (left part). Please note that we deliberately used the term ‘release’ for simplification, knowing that the signal comprises Ca2+ influx through LTCC and Ca2+ release from the RyRs. Thereafter the centers of the couplon sites are identified (right part in dashed box). ACO, ‘Analytical CLEAN Object’.
Figure 1—figure supplement 2
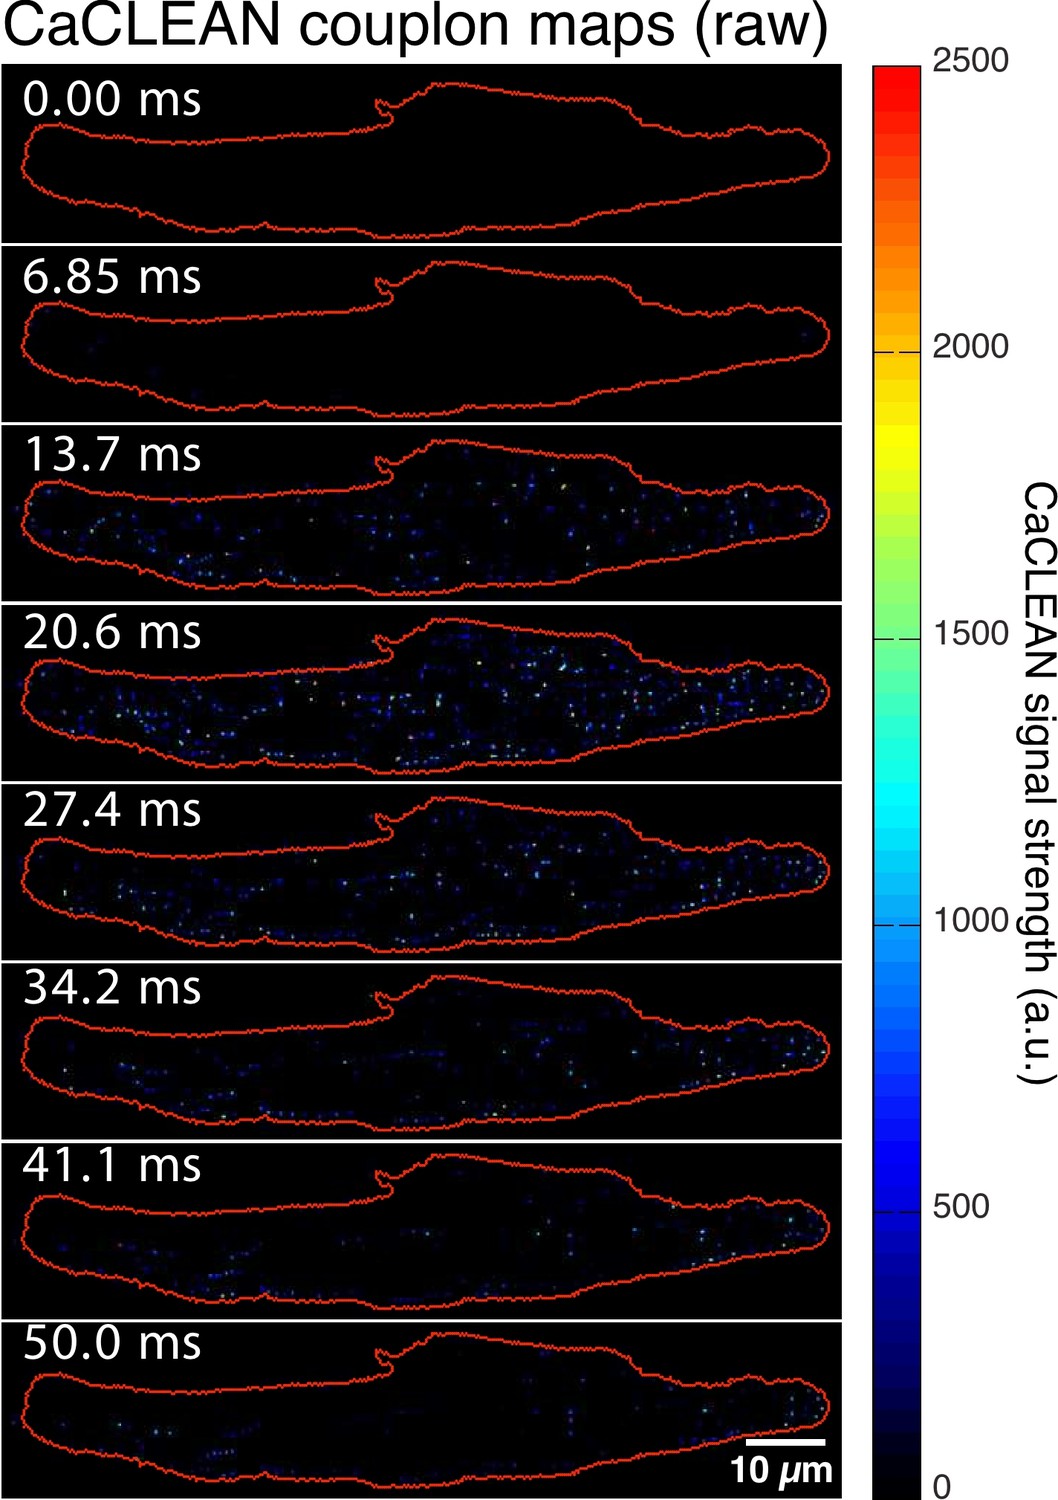
Original, un-smoothed version of the CaCLEAN maps from Figure 1B.
https://doi.org/10.7554/eLife.30425.004
Figure 1—figure supplement 3
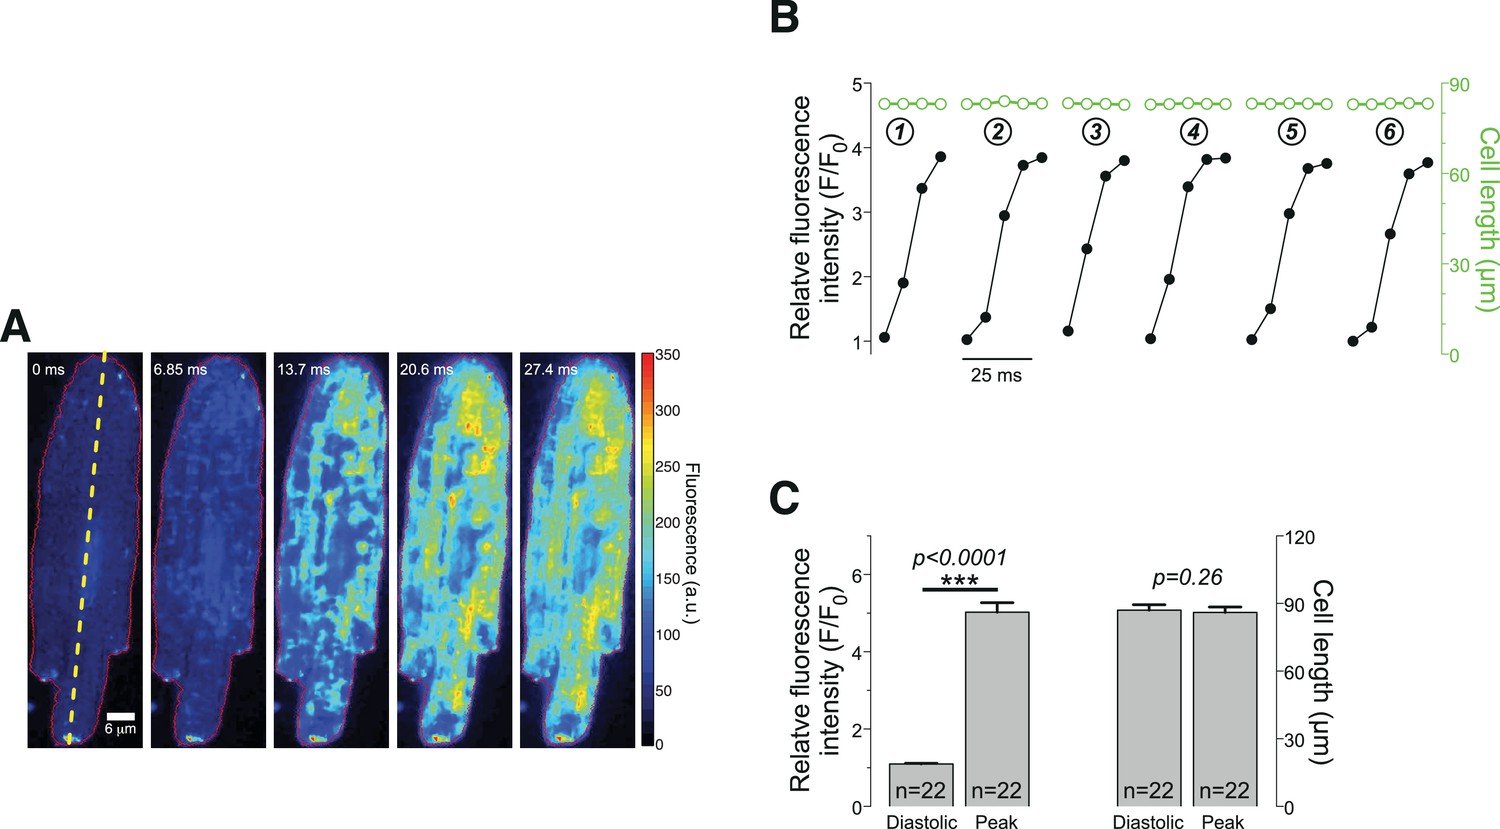
Evaluation of potential contraction artifacts.
Rat ventricular myocytes were loaded with Fluo-8 and subjected to electrical field stimulation @1.7 Hz. The responses to six consecutive stimulations under steady-state conditions were recorded. (A) Images exemplifying the five confocal sections obtained during the upstroke phase of such a Ca2+ transient. The global fluorescence was averaged from the entire cell while the cell length was determined along the yellow dashed line. (B) Quantitation of the average relative intensity and cell length for the six consecutive transients, indicating that despite a 4-fold increase in the fluorescence (black traces and symbols) the cell length did not change during this early phase of ECC (red traces and symbols). (C) Cells were collected from three different rats. In contrast to a robust fluorescence change, (left pairs of bars), the cell lengths were unchanged (right pairs of bars).
Figure 1—figure supplement 4
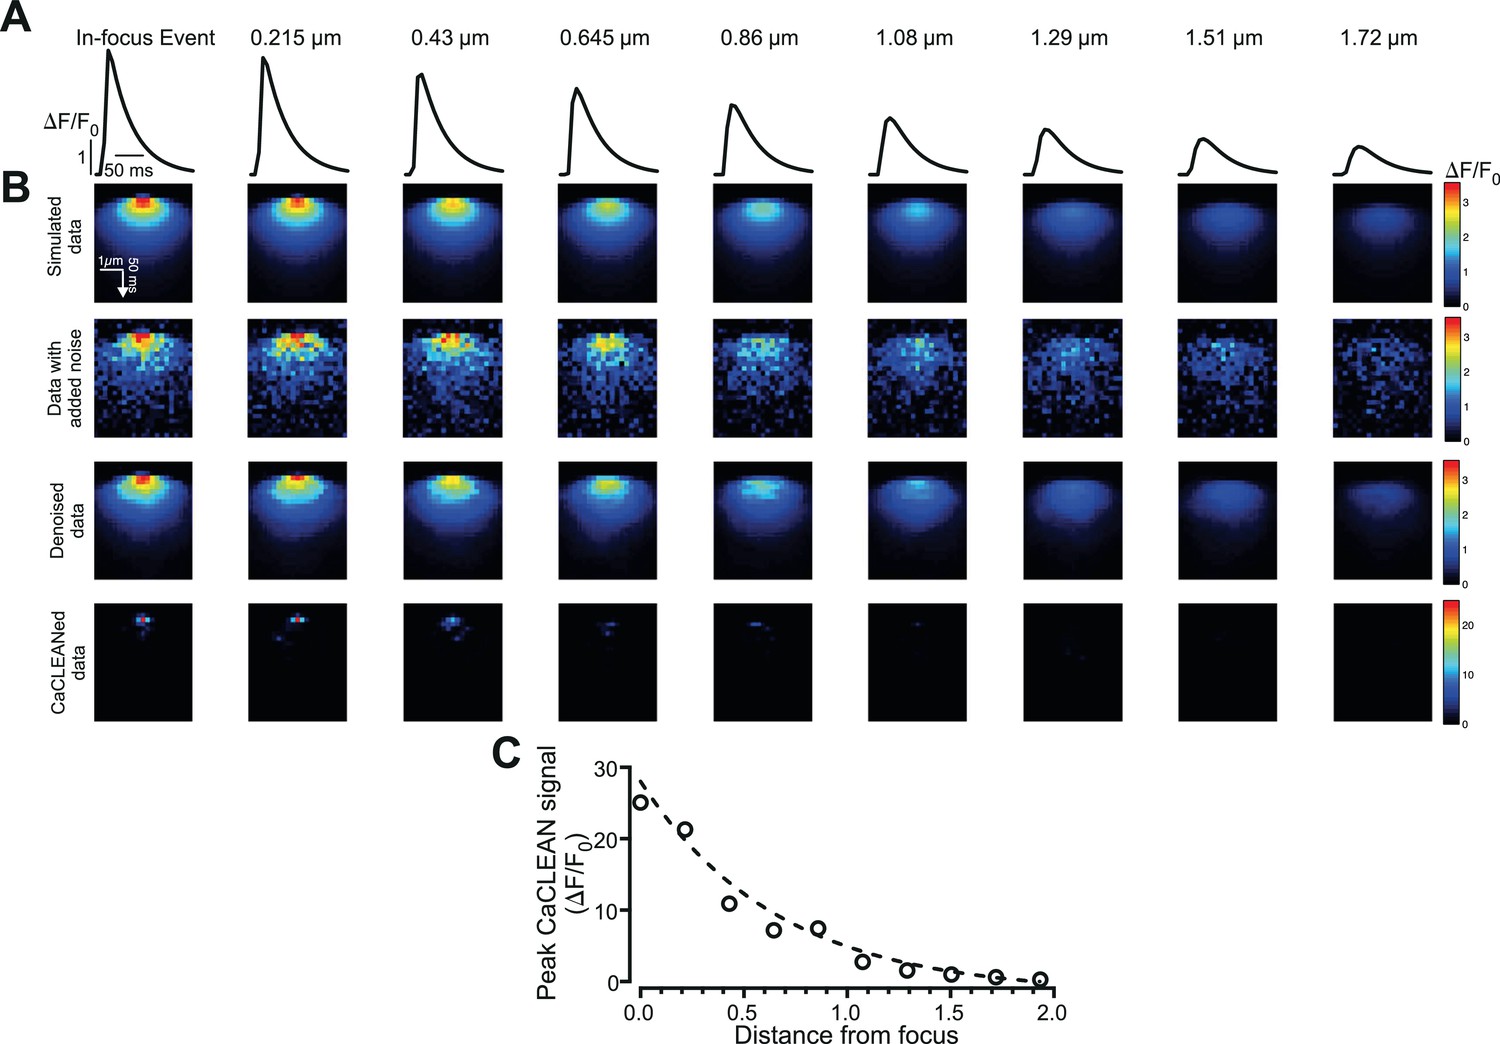
Behavior of the CaCLEAN algorithm with out-of-focus localized Ca2+ transients.
(A) Simulations of in-focus (furthest left) and out-of-focus localized Ca2+ transients. The distance to the central focus point is given above and the central pixel fluorescent transients are depicted. (B) (From top to bottom) Simulated localized Ca2+ release, noise convoluted data, subsequent denoised data and the resulting CaCLEAN maps. (C) The relationship between the peak CaCLEAN signals and the distance from the focus, indicating CaCLEAN’s inherent preference for in-focus events.
Figure 1—figure supplement 5
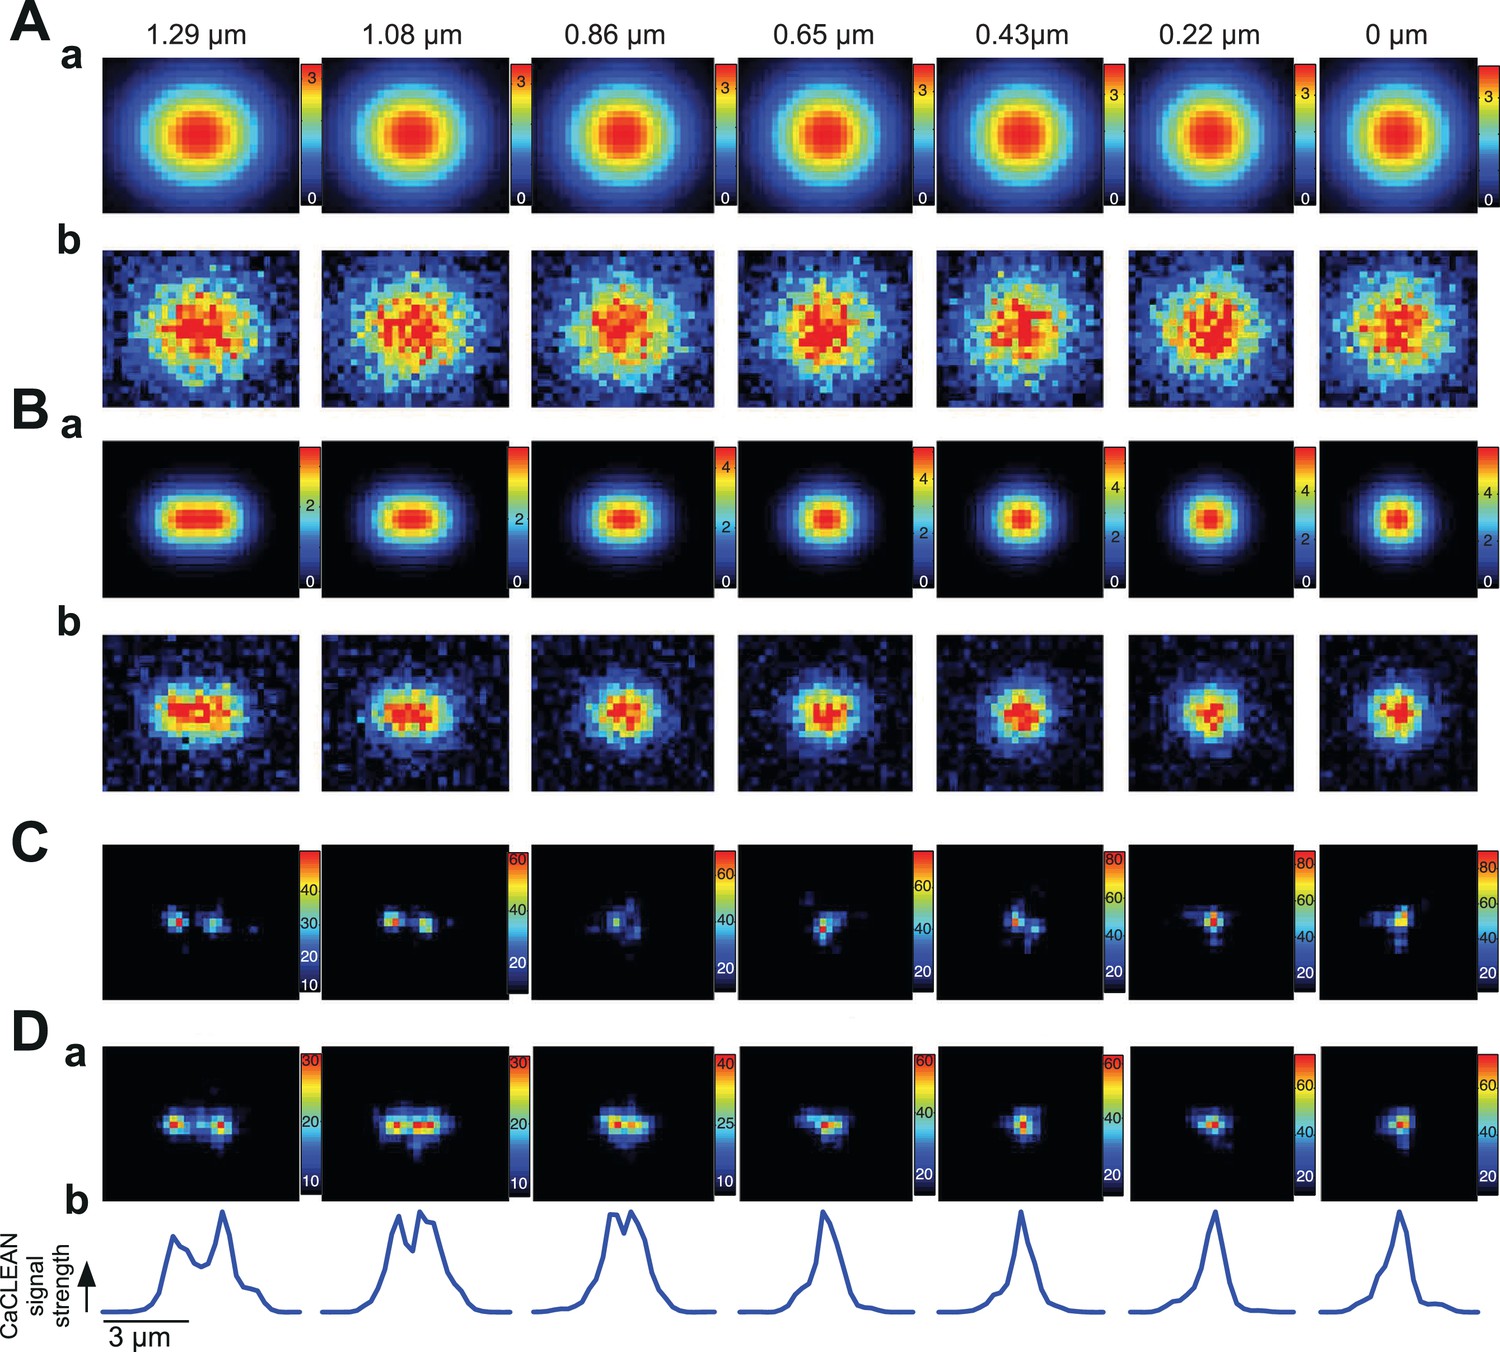
Evaluation of the resolution limits of the CaCLEAN algorithm in the x-y axis.
Two identical localized Ca2+ release events were horizontally aligned with variable distances between the centers of the Ca2+ release events, ranging from 6 pixels to 0 pixel, resulting a distance from 1.29 μm to 0 μm. (A) Frames with maximal intensities of global Ca2+ transients for the original noise-free version (a) and the version with simulated noise (b) observed in our recording conditions. (B) Frames with maximal central pixel intensities for the noise-free version (a) and the version with simulated noise (b). (C) The CaCLEANed maps from the simulated noisy data (as illustrated in A[b] or B[b]). (D) Panel (a) is the same as (C) but is an average of CaCLEANed maps from five independent simulations; panel (b) displays the profiles of the central lines in panel (a).
Figure 1—figure supplement 6
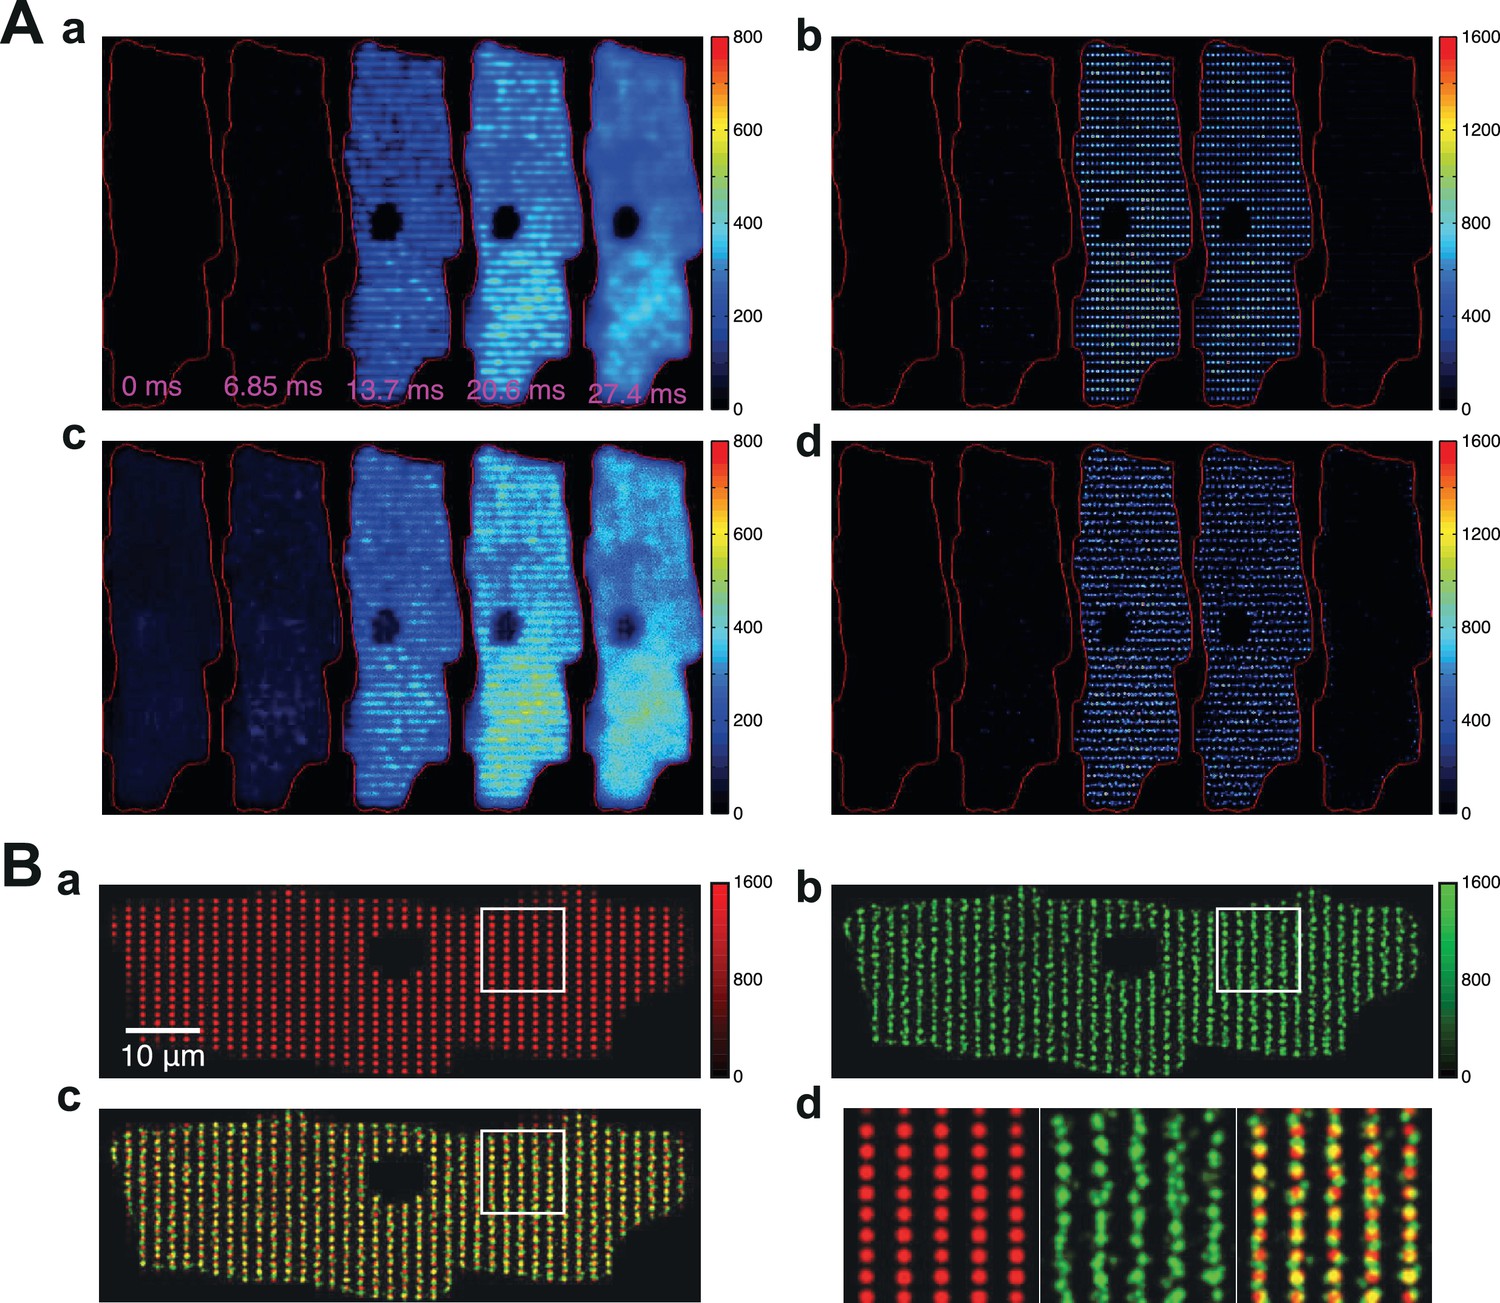
Evaluation of the fidelity of the CaCLEAN algorithm with gridded Ca2+ release sites.
(A) A simulated Ca2+ transient (a) and its Ca2+ release process (b) without noise; (c) and (d) display the version after noise simulation. (B) The simulated ECC couplon map (a) and the map generated from the CaCLEAN algorithm (b); (c) displays the merged image of the simulated ECC couplon map and the CaCLEANed image. The correlation coefficient between the simulated map and the CaCLEANed map was 0.62. The areas indicated in white square rectangles are replotted in panel (d).
Figure 1—figure supplement 7

Evaluation of the fidelity of the CaCLEAN algorithm with random Ca2+ release sites.
(A) The Ca2+ transient at the central pixel (a) and the global transient (b) of the simulated single Ca2+ release site; panel (c) shows the x-t spread of the Ca2+ release site. (B) The centers of all the Ca2+ release sites in this Ca2+ transient. (C) The image with maximal Ca2+ transient amplitude. (D) The CaCLEANed map from the simulated data with specific noise observed in our recordings. (E) The centers of the simulated Ca2+ release sites merged with the CaCLEANed map. The areas indicated with white rectangles in (B), (C), (D) and (E) are further replotted in the right columns of these parts of the figure.
Figure 2 with 1 supplement
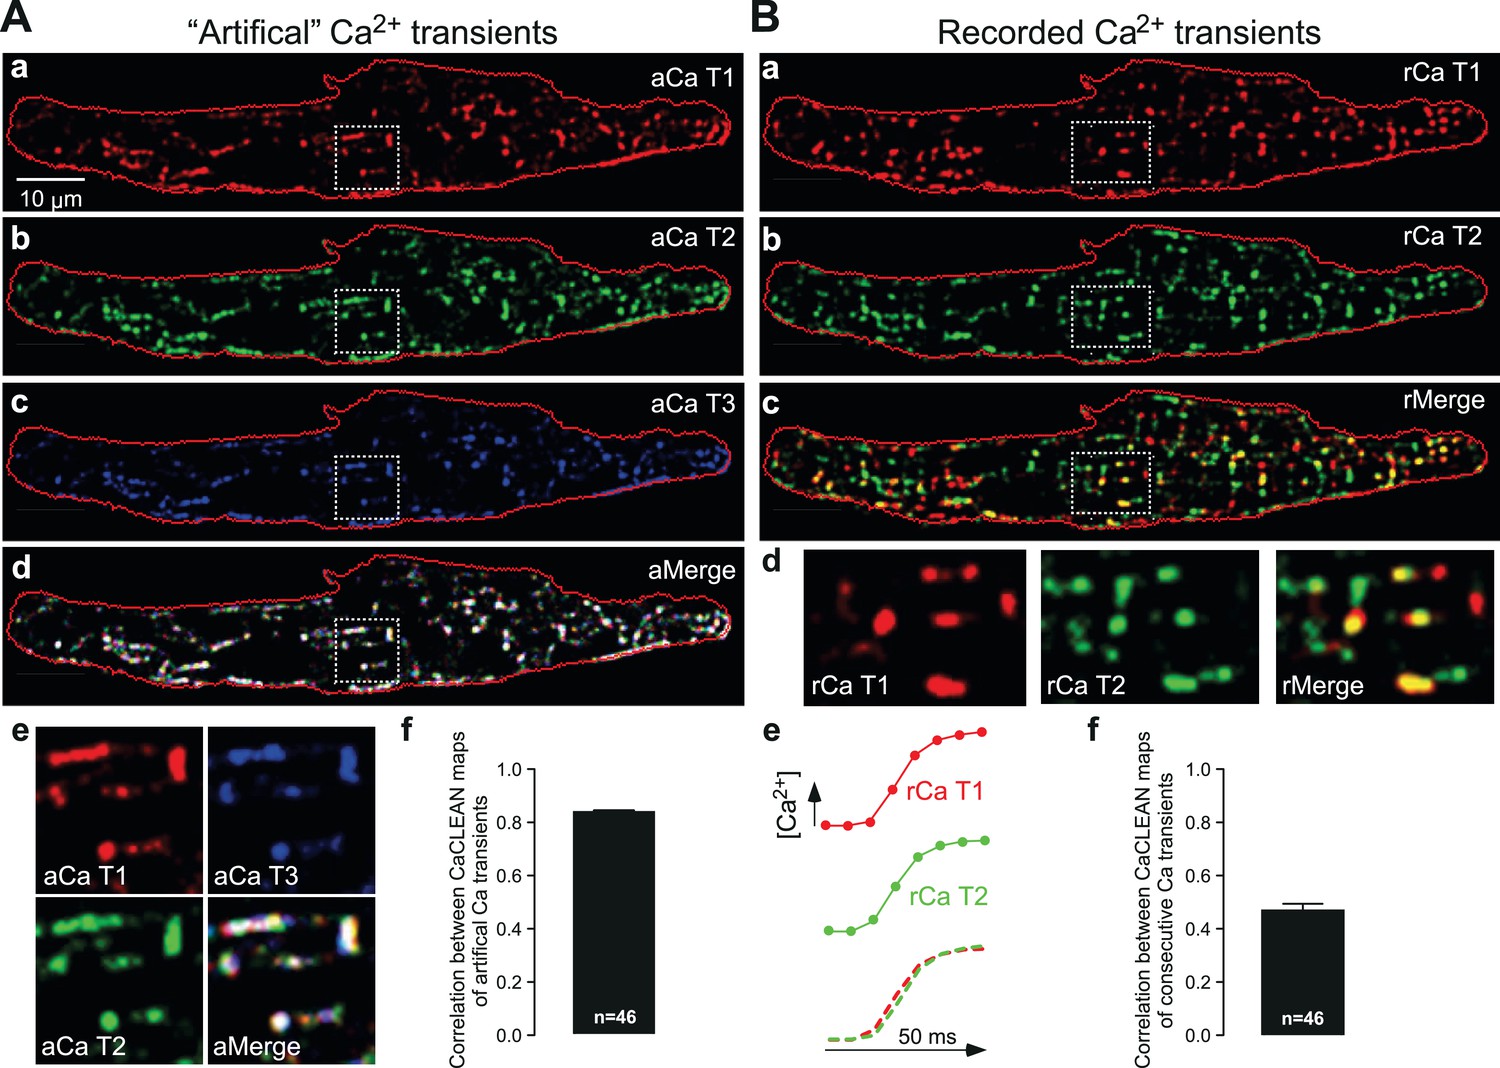
Robustness of CaCLEAN and reliability of ECC couplon firing.
(A) A denoised Ca2+ transient from the cell in Figure 1 was convoluted with simulated noise as observed in our raw data. Three different artificial Ca2+ transients were generated and the resulting couplon maps were calculated with CaCLEAN (a–c, aCaT1–3). The maps were superimposed (d aMerge). Selected subcellular regions marked with dashed white boxes were replotted at higher magnification (e). (f) Statistical summary of the correlation coefficient between CaCLEAN maps of simulated Ca2+ transients. (B) Two consecutive electrically evoked Ca2+ transients from a mouse atrial myocyte were recorded in steady-state (@ 1 Hz stimulation frequency), the corresponding ECC couplon maps were constructed with CaCLEAN (a and b, rCaT1–2) and superimposed (c, rMerge). Subcellular regions marked with white dashed boxes (a–c) were replotted at a higher magnification (d). Panel (e) depicts individual global Ca2+ transients for CaT1 (red), CaT2 (green) and their overlay (from left to right). (f) Statistical summary of the correlation coefficient between CaCLEAN maps of consecutive Ca2+ transients in a population of cells.
Figure 2—figure supplement 1
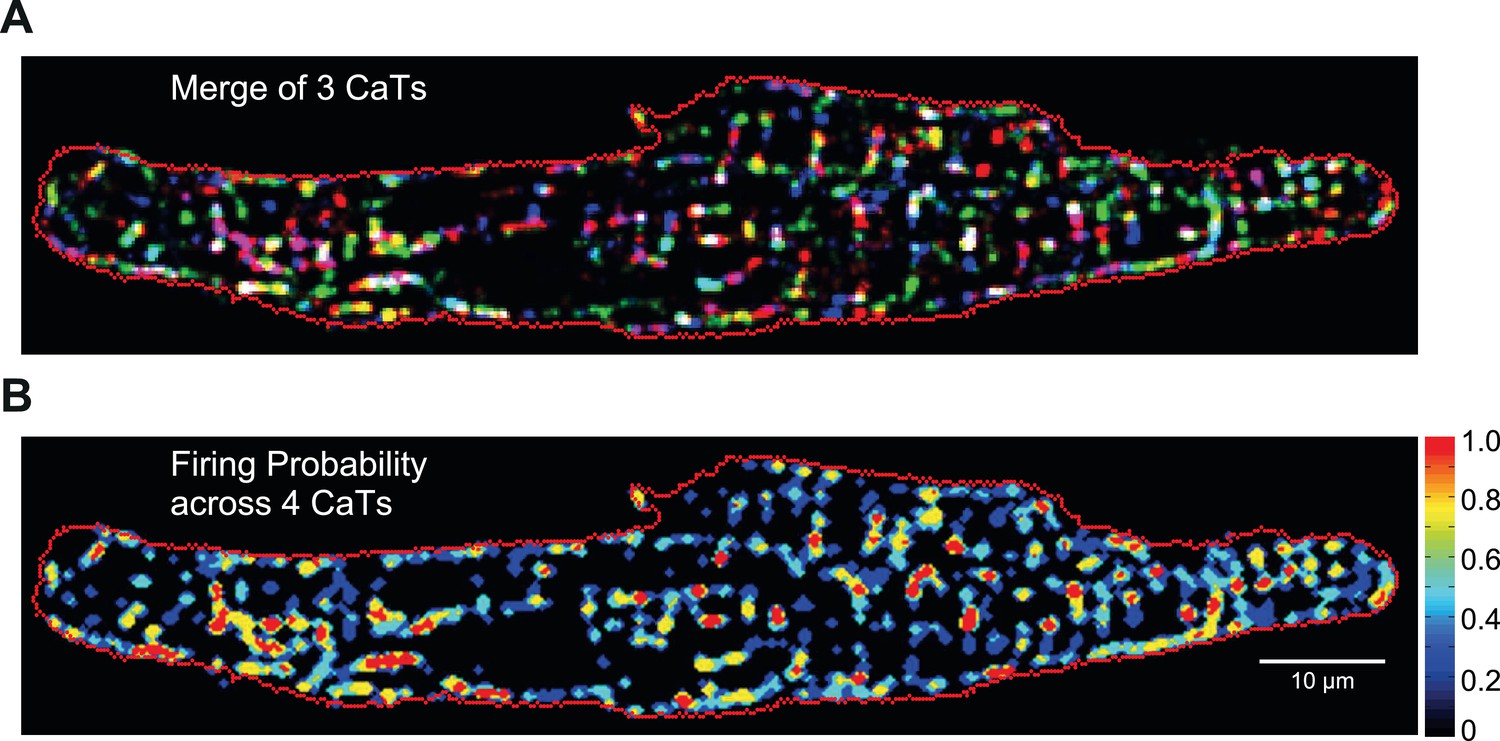
Firing probability of ECC couplons in mouse atrial myocyte.
(A) The merged ECC couplon maps of the cell in Figure 2B from three consecutive Ca2+ transients. (B) ECC couplon maps from four consecutive Ca2+ transients of the same cell were manually thresholded to separate active ECC couplons from their backgrounds, then the resulting masks were averaged and displayed as the firing probability of the ECC couplons.
Figure 3 with 2 supplements
Behavior of ECC couplons at variable stimulation frequencies and during β-adrenergic stimulation.
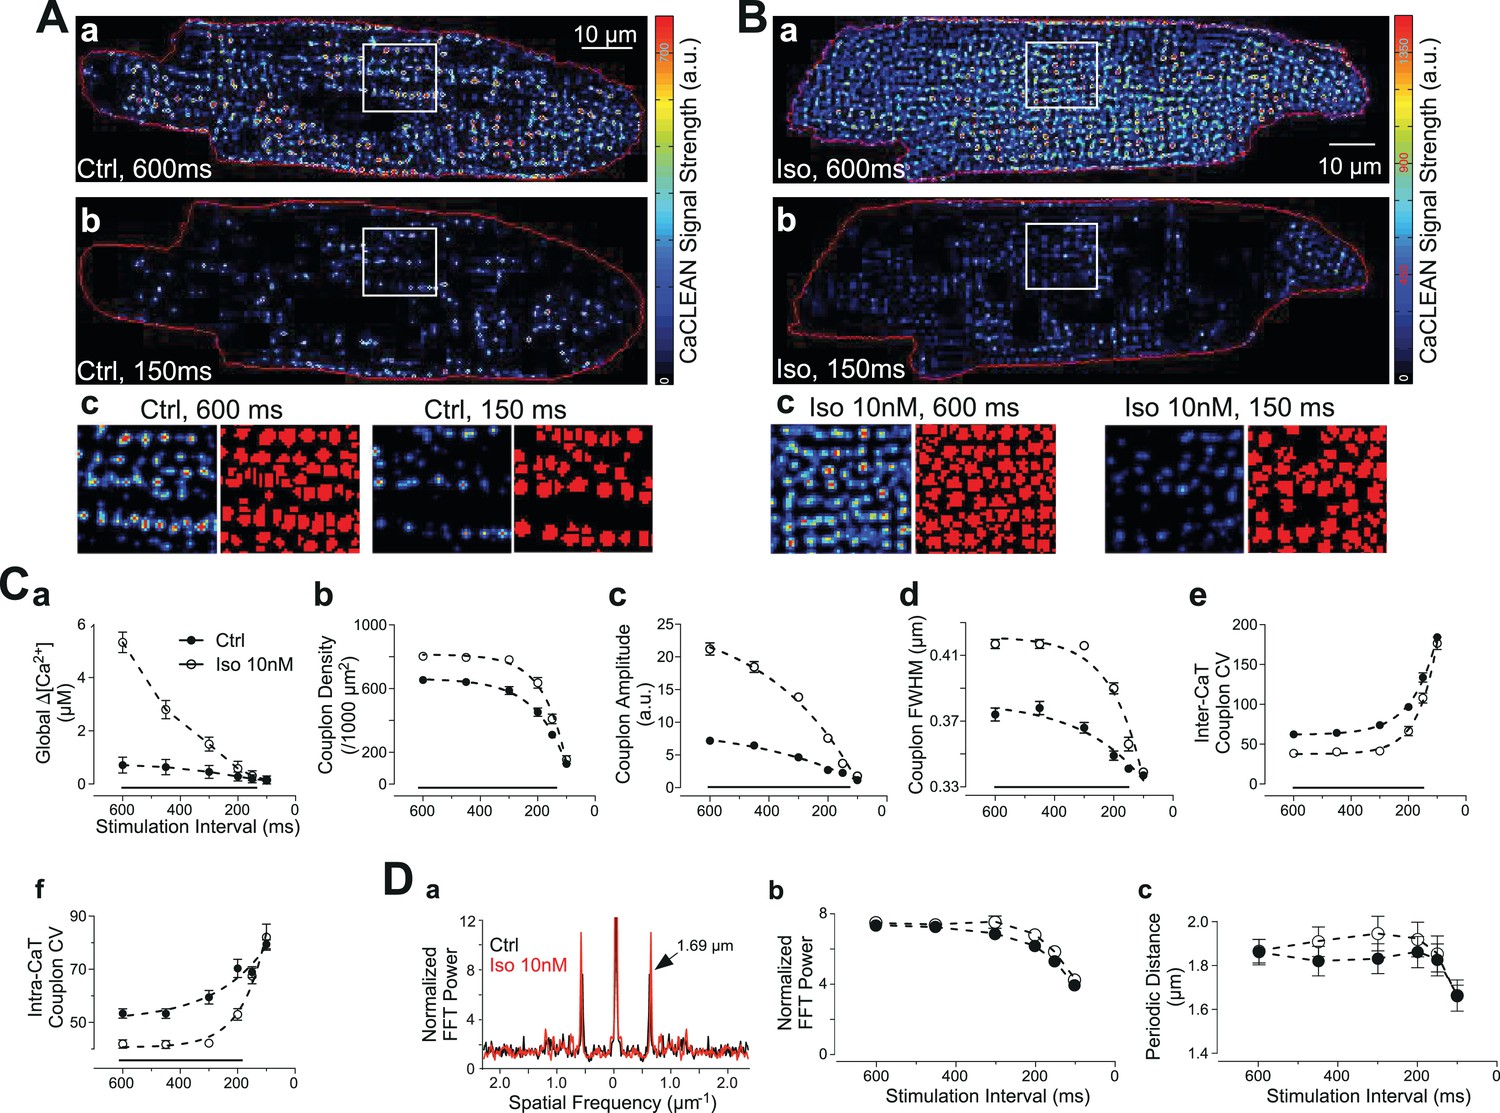
Rat ventricular myocytes were electrically paced into steady state at the stimulation intervals given. (A) The resulting CaCLEAN ECC couplon maps at 600 ms (a) and 150 ms (b) stimulation intervals under control conditions (Ctrl). Subcellular regions highlighted with white boxes were replotted at a high magnification (c) alongside with segmented ECC couplon sites (c, red). (B) Data similar to those in (A) but in a ventricular myocyte following β-adrenergic stimulation (10 nM isoproterenol, 5 min) (Iso). (C) (a) The negative Ca2+ transient amplitude-stimulation frequency relationship for control conditions and following stimulation with 10 nM isoproterenol, here, global refers to the average of the confocal section (b) The density of active ECC couplons. (c) The released Ca2+ amplitudes from individual ECC couplons and (d) the size of these ECC couplons (indicated as full width at half maximum, FWHM) decreases with increasing stimulation frequencies for control conditions (filled symbols) and following isoproterenol stimulation (open symbols); (e) the coefficient of variance (CV) of active ECC couplons increases between consecutive inter-CaT couplons and (f) within individual Ca2+ transients (intra-CaT couplon CV) with increasing stimulation frequencies under control conditions and during β-adrenergic stimulation. Significant differences are indicated by the black lines in the lower parts of the panels. (D) Fast Fourier Transform (FFT) analysis of CaCLEAN maps at increasing stimulation frequencies under control conditions and following β-adrenergic stimulation. Panel (a) exemplifies the power spectra of the FFT analysis; panel (b) displays the normalized amplitudes of the characteristic power peaks (marked with an arrow in a) and panel (c) shows the characteristic spatial distances of those power peaks. For all conditions, at least 23 cells from three different animals were analyzed. Error bars smaller than their symbols were omitted. For statistical details see Figure 3—source data 1.
-
Figure 3—source data 1
Detailed statistical summary of the data comparisons in Figure 3CandD.
- https://doi.org/10.7554/eLife.30425.015
Figure 3—figure supplement 1
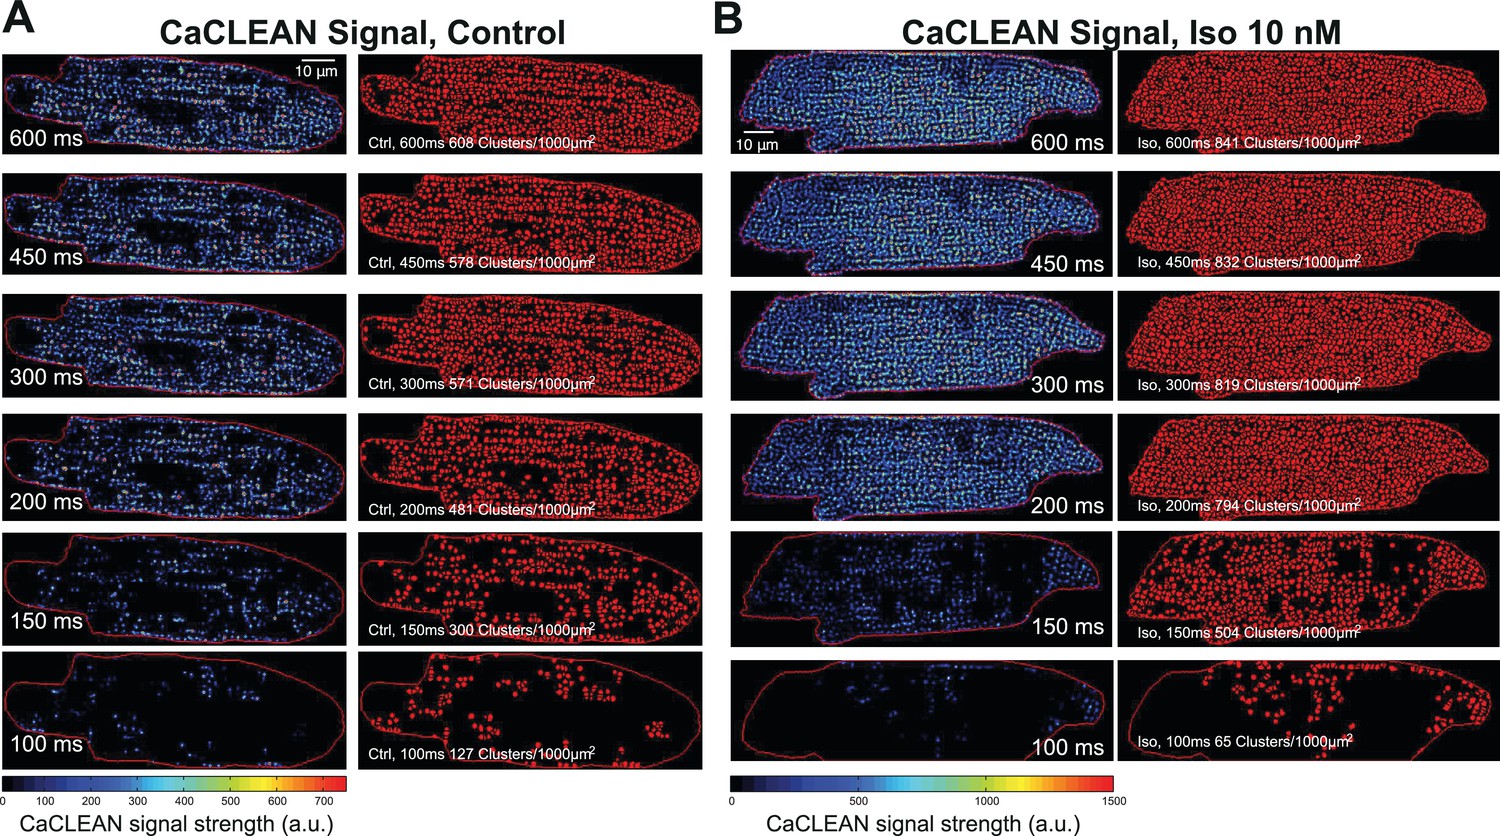
CaCLEAN map (left part of each panel) and segmented ECC couplons (right part of each panel) for a typical rat ventricular myocyte under control conditions (A) and during simulation with 10 nM isoproterenol (B) at the given stimulation intervals.
These are the complete data for the two cells exemplified in Figure 3.
Figure 3—figure supplement 2
Comparison of CaCLEAN couplon map and anti-RYR immunolabeling with Fast Fourier Transform (FFT) analysis.
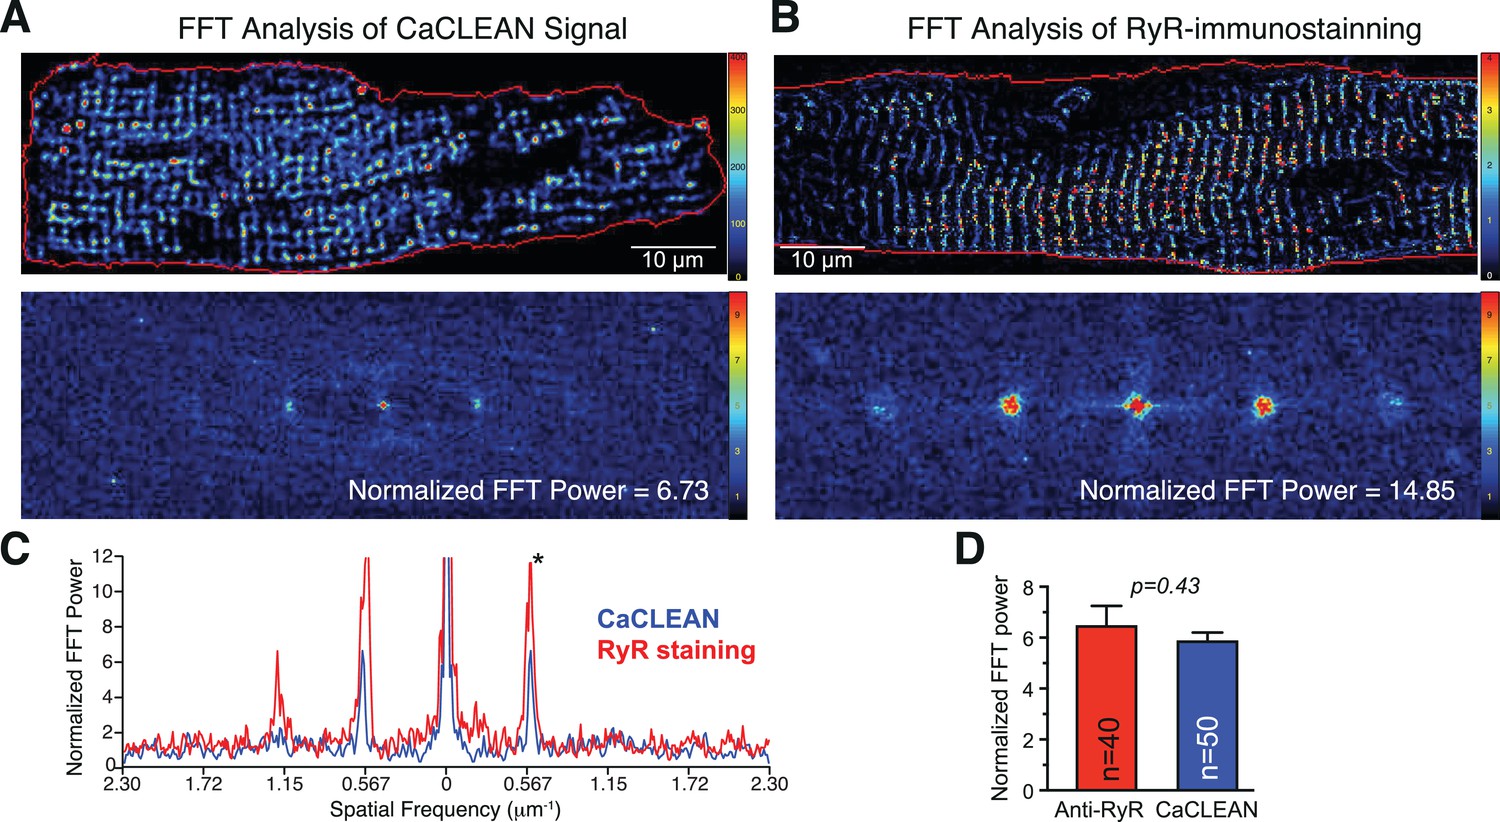
(A) A typical CaCLEAN couplon map taken from a rat ventricular myocyte (top) and its 2D-FFT transform (bottom). (B) A typical distribution of RyR proteins after immunolabeling with a RYR-specific primary antibody in a rat ventricular myocyte (top) and its 2D-FFT transform (bottom). (C) Line traces of the normalized FFT power taken along the longitudinal axis of the FFT power maps. Blue highlights the trace from the CaCLEAN map while the RyR trace is in red. Apart from the height of the frequency peaks, the two traces are superimposable. (D) Compares the height of the spatial frequency peak marked with an asterisk in (C) for the anti-RYR staining (red) and CaCLEAN (blue). The cells (n = 26 and 48 for immunolabeling and CaCLEAN maps, respectively) were analyzed from three different rats.
Figure 4 with 1 supplement

Three-dimensional reconstruction of active ECC couplons in a naïve rat ventricular myocyte.
(A) Experimental regime for the 3D reconstruction of ECC couplon distribution. From top to bottom, the movement of the z-focus, the electrical field stimulation, the on and off status of the laser, and the upstroke of five consecutive Ca2+ transients are displayed. The bottom panels depict exemplified consecutive CaCLEAN maps. (B) The resulting 3D surface rendering of active ECC couplons from a typical naïve rat ventricular myocyte (a) and their centers after spot segmentation (b); for panel (c), we cut the surface render open at the two planes indicated in (Ba) and turned the resulting object clock-wise into the paper plane. The stylized eye in (Ba) indicates the viewpoint (‘N’ and the blurred area in blue denote the nucleus). For (Bd) we color coded the depth of the individual objects with respect to the paper plane as indicated by the color wedge. (C) Summary of the mapping results as density of active ECC couplons calculated from 15 individual rat ventricular myocytes (from four hearts).
Figure 4—figure supplement 1
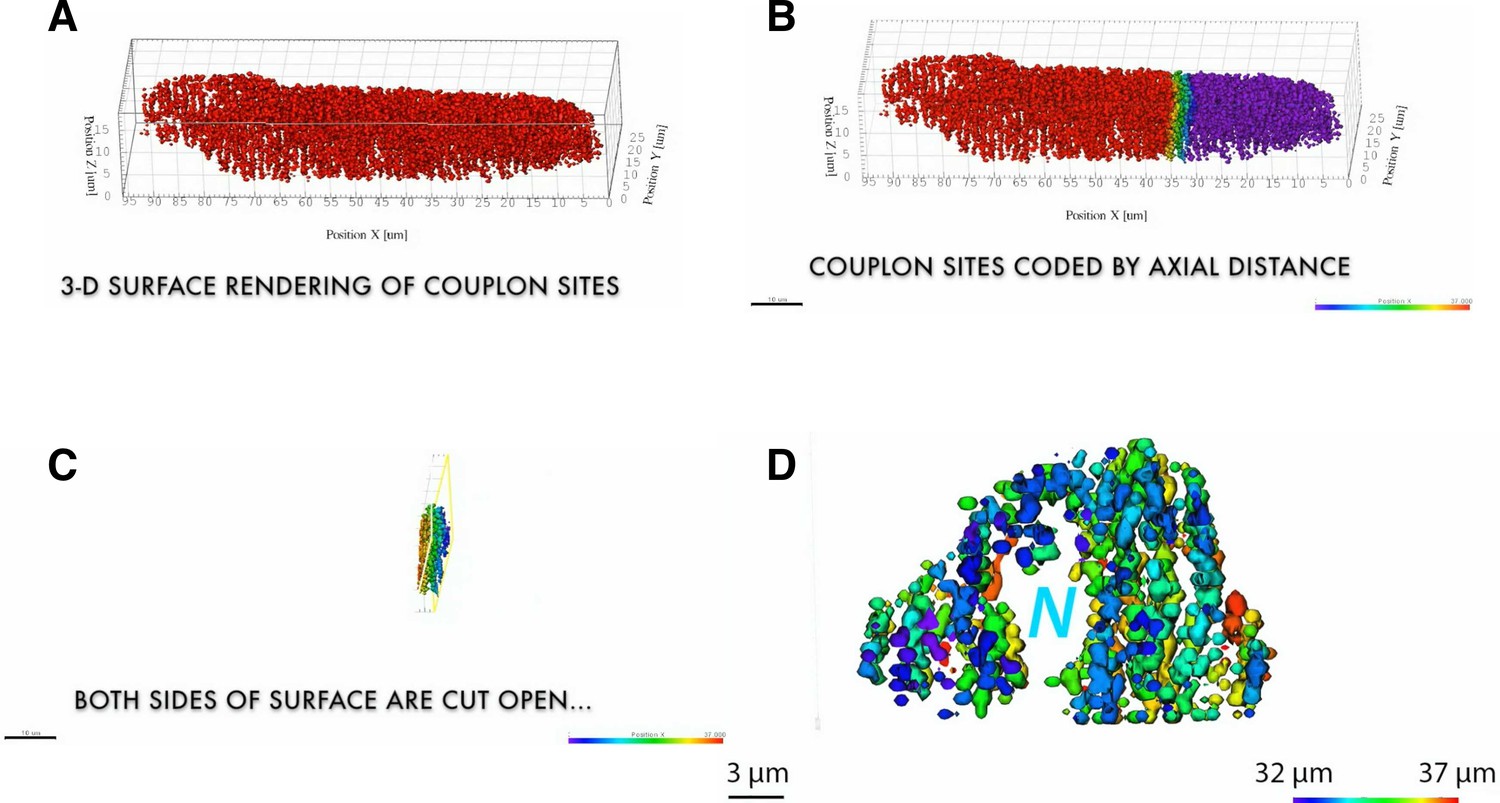
Still image a movie 1 illustrating the individual steps leading to 3D surface rendering.
Still image a movie illustrating the individual steps leading to 3D surface rendering (A) , how the rendered object was color coded for the axial distance (B) cut open (C) and rotated and zoomed-in (D, ‘N’ denotes the position of the nucleus). Renderings were performed in IMARIS software (BitPlane AG, CH) and movie compilation in iMovie (Apple Inc. USA).
Figure 5
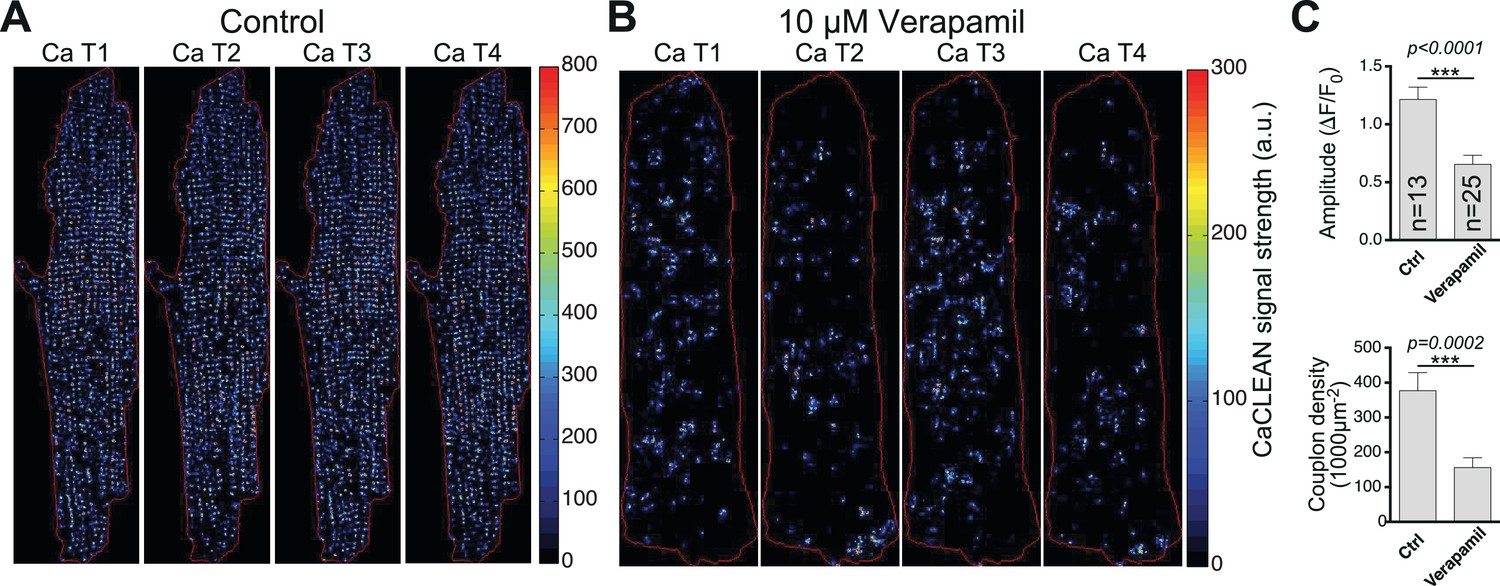
CaCLEAN-derived couplon distributions for typical rat ventricular myocytes (paced at 1 Hz).
(A) Under control conditions and (B) in the presence of 10 μM Verapamil (10 min after application) to reduce the number of operating L-Type Ca2+ channels substantially. Red lines outline the cell edges of the myocytes. (C) Statistical comparison of the ‘global’ Ca2+ transient amplitudes (top panel) and the density of active couplons (bottom panel) for these two conditions. Please note that for this series of experiments, the external Ca2+ concentration was lowered to 0.9 mM. Cells were analyzed from three different rats.
Figure 6
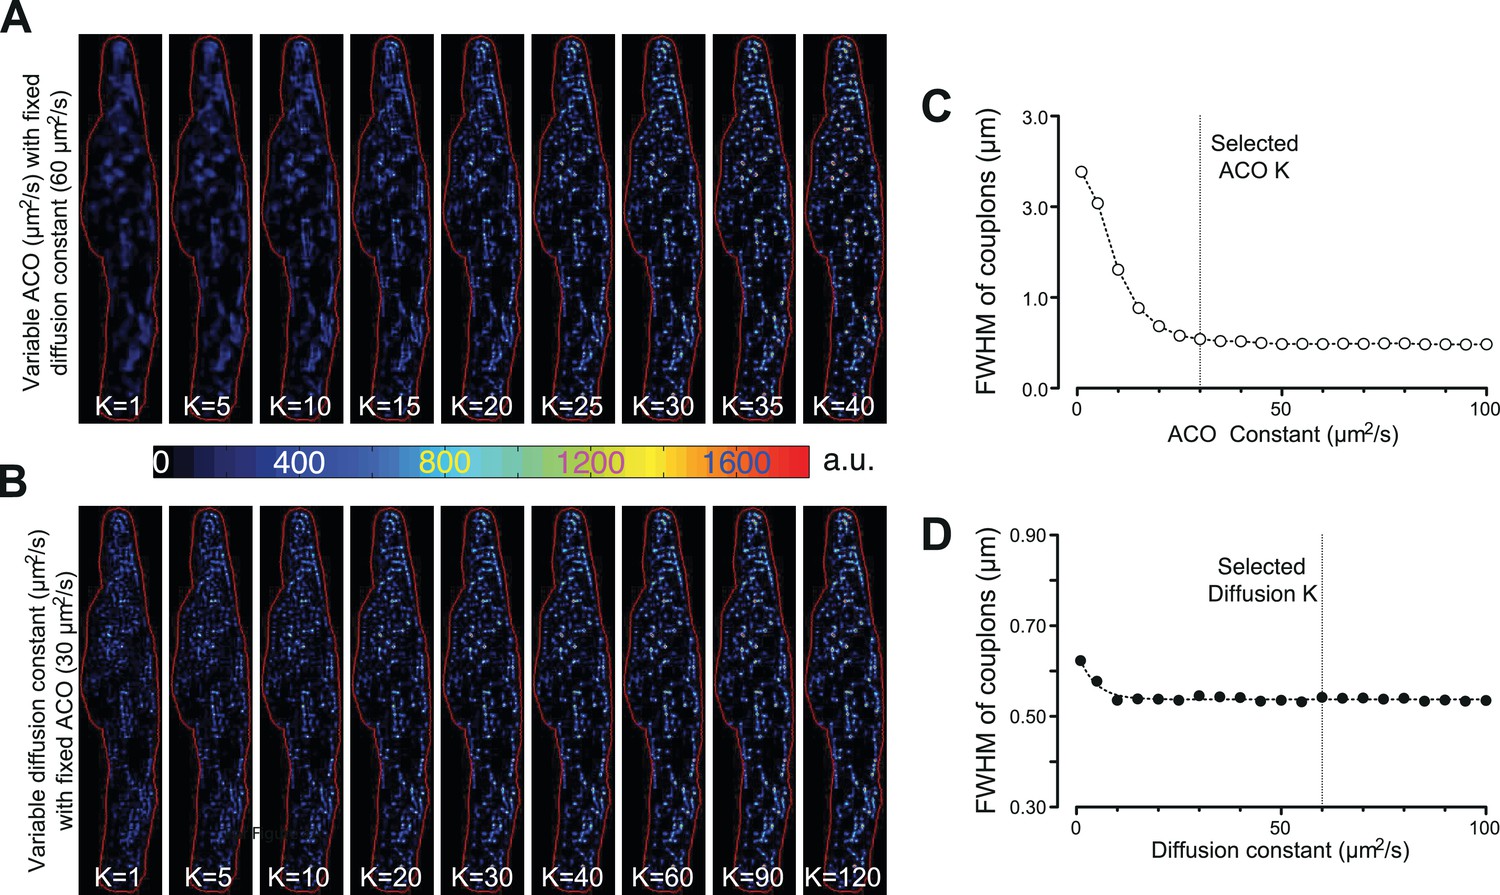
Effects of varying the ACO and diffusion constants on the characteristics of the detected couplon sites.
(A and B) Couplon maps with variable ACO or diffusion constant, respectively. (C and D) Plots of full width at half maximum (FWHM) of the identified couplons (averaged over all identified couplons of the resulting map) against the variable ACO or diffusion constant, respectively. The dotted vertical lines indicate the values for the two constants chosen for the calculations in this report.
Figure 7
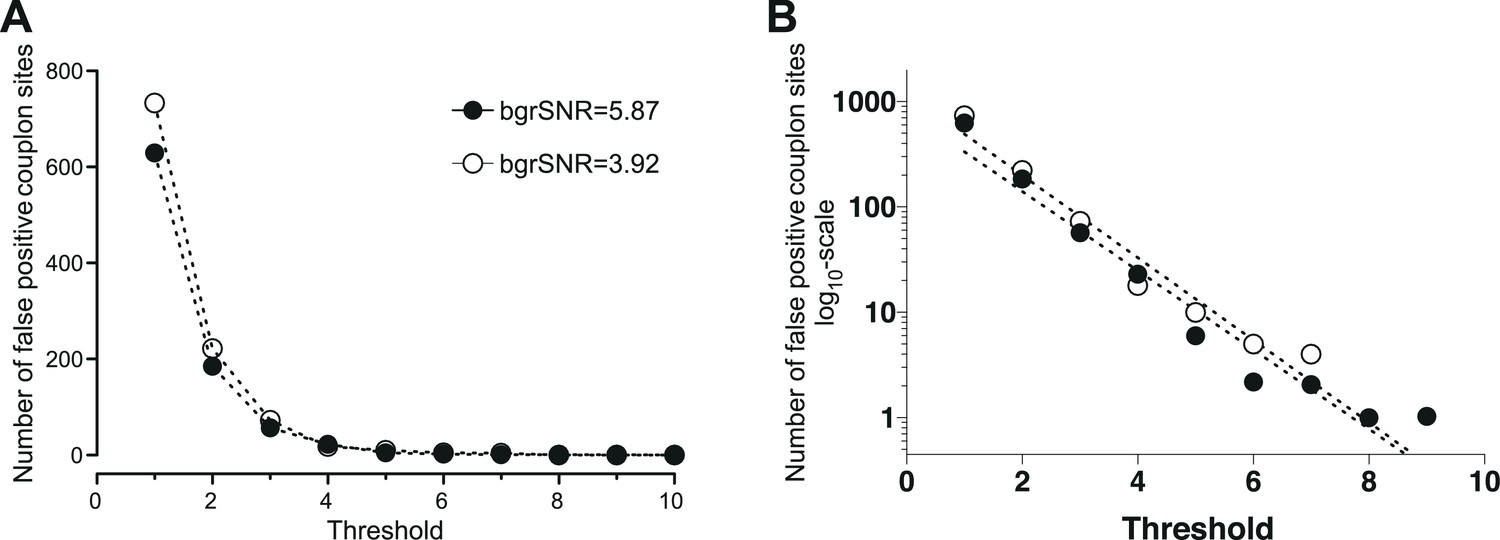
Determination of the minimal threshold for the CaCLEAN algorithm for avoiding false-positive events.
We recorded the basal fluorescence of a typical rat ventricular myocyte and averaged the data series to obtain a virtually ‘noise-free’ image. This image was duplicated seven times (equal to 48 ms) yielding an image series similar to those necessary for the CaCLEAN calculation during the upstroke phase of Ca2+ transients. The resultant image stack was convoluted with various signal amplification levels of the detector (also known as detector gain levels, e.g. 1, 3, 10, 20, 30) while keeping the white noise constant (σ = 5.95). These simulated recordings were finally passed to the CaCLEAN algorithm assuming various threshold levels. (A) For background signal to noise ratios (bgrSNR) that were close to our raw recordings (around 4), the number of false-positive couplon sites (original simulated data did not contain ANY Ca2+ release sites) are plotted against the assumed thresholds. (B) The same data as in (A), but this time the numbers of false-positive couplons have been plotted logarithmically and fitted to a linear function. We determined a threshold value of 10 as the optimal value to avoid false-positive detection of couplons while not discarding positive couplons.
Figure 8
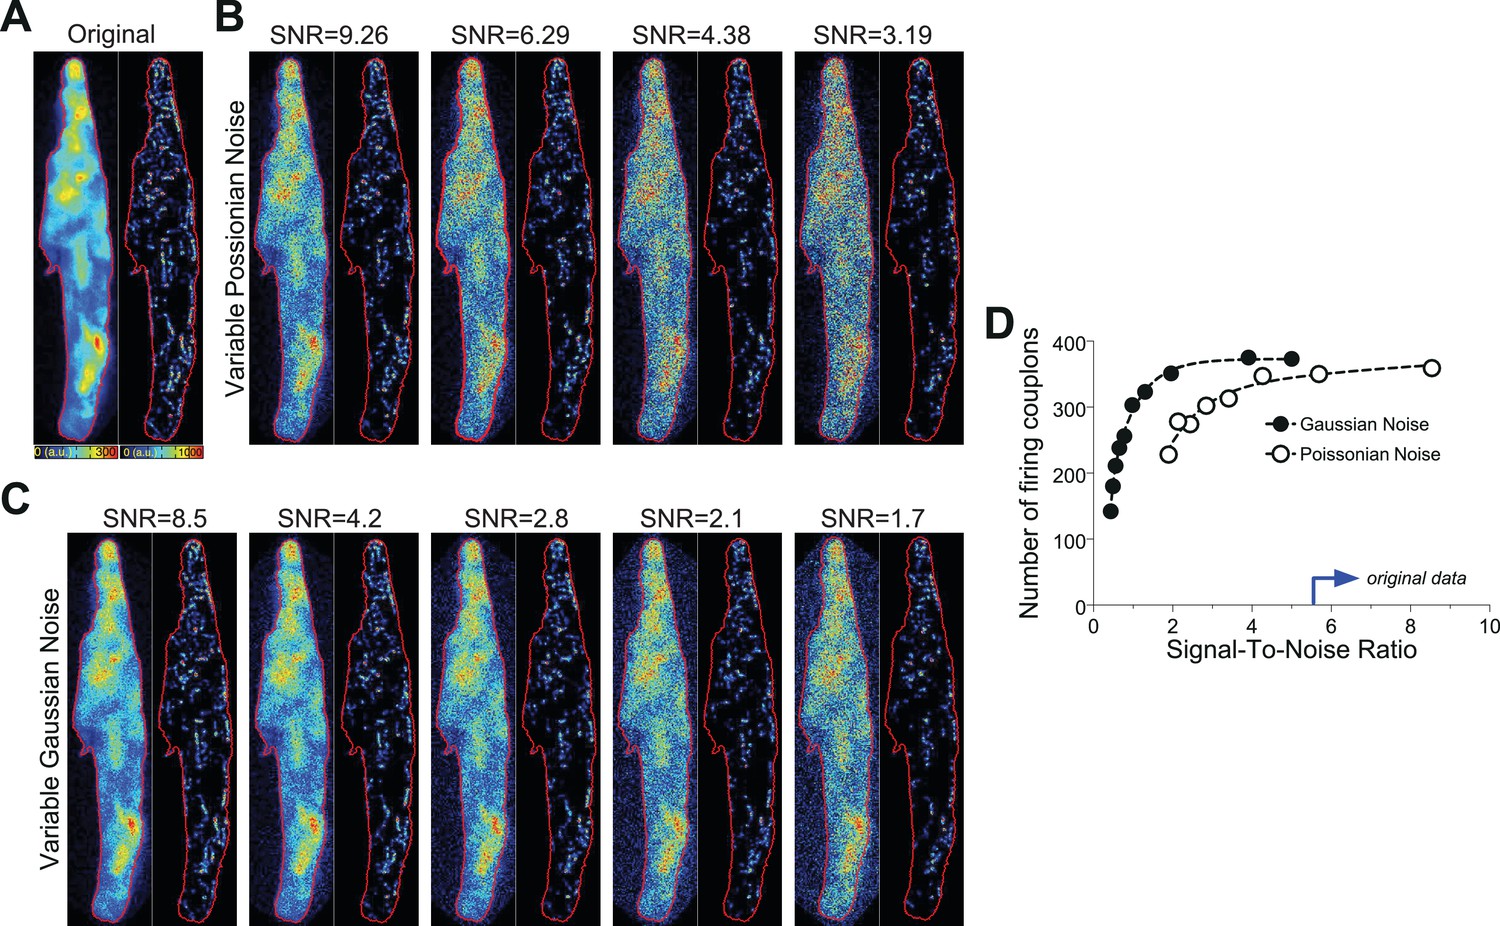
Noise tolerance test of the CaCLEAN algorithm.
(A) Original fluorescence image (left) from the peak of an electrically evoked Ca2+ transient in a mouse atrial myocyte and the resulting CaCLEAN couplon map (right). (B and C) Exemplified fluorescence data (left) and resulting CaCLEAN couplon maps (right) for various levels of added Poissonian (B) and Gaussian noise (C). (D) Summary of the entire data set. The blue arrow at the x-axis marks the lowest signal-to-noise ratio (SNR) in the data displayed in this report, emphasizing that the CaCLEAN algorithm can still preform robustly in even the ‘worst’ data sets.
Author response image 1
Author response image 2
Videos
Video 1
Illustrating individual steps leading to 3D surface rendering of active ECC couplons.
https://doi.org/10.7554/eLife.30425.018Additional files
-
Transparent reporting form
- https://doi.org/10.7554/eLife.30425.023
Download links
A two-part list of links to download the article, or parts of the article, in various formats.
Downloads (link to download the article as PDF)
Open citations (links to open the citations from this article in various online reference manager services)
Cite this article (links to download the citations from this article in formats compatible with various reference manager tools)
An adaptation of astronomical image processing enables characterization and functional 3D mapping of individual sites of excitation-contraction coupling in rat cardiac muscle
eLife 6:e30425.
https://doi.org/10.7554/eLife.30425


