GIPC proteins negatively modulate Plexind1 signaling during vascular development
- New York University Langone Medical Center, United States
- New York University School of Medicine, United States
Figures
Figure 1
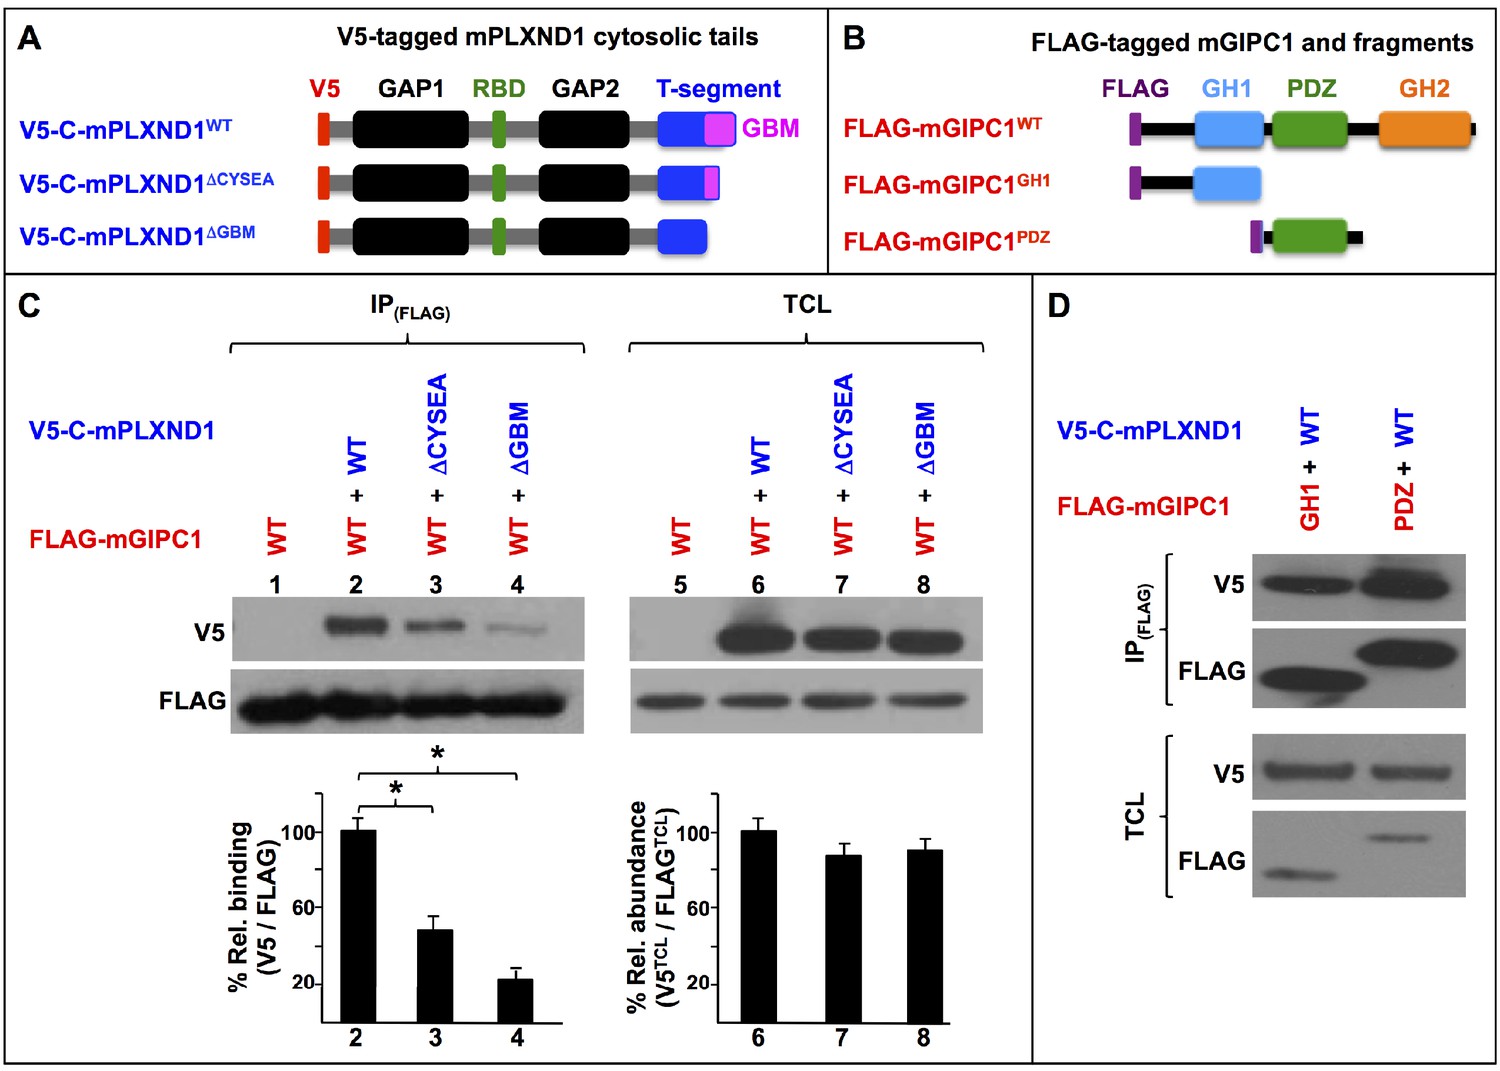
PLXND1’s C-terminal GBM and GIPC's GH1 and PDZ domains are the key molecular determinants of the PLXND1-GIPC interaction.
(A) Diagrams of the wild-type (WT) and truncated V5-tagged (red) forms of the cytosolic tail of murine PLXND1 (V5-C-mPLXND1) used for co-immunoprecipitation experiments. Color-coding is used to highlight the following domains and motifs. GAP1 and GAP2 (Guanosine triphosphatase-Activating Protein domains 1 and 2; black), RBD (Rho GTPase-Binding Domain; green), T-segment (C-terminal segment, includes the GBM; blue) and, GBM (GIPC-Binding Motif; magenta); see (Gay et al., 2011). (B) Diagrams of the wild-type (WT) and truncated FLAG-tagged (purple) forms of murine GIPC1 (FLAG-mGIPC) used for co-immunoprecipitation experiments. Domains indicated as follows: PDZ (PSD-95/Dlg/ZO-1; green) and GH (GIPC Homology domain) 1 (blue) and 2 (orange); see (Katoh, 2013). (C) Western blots (top) and their quantification (bottom, bar graphs). Numbers indicate lane positions. Left-side Western blot (IPFLAG): FLAG immunoprecipitates and V5 co-immunoprecipitates showing interactions between the indicated V5-C-mPLXND1 and FLAG-mGIPC forms. Right-side Western blot (TCL), expression levels of these proteins in total cell lysates as detected with V5 and FLAG antibodies. Quantifications. n = 3 independent experiments for each protein pair. Left-side bar graph (C). Means of percentual V5/FLAG relative binding [(V5CoIP/V5TCL)/(FLAGIP/FLAGTCL)] between the indicated protein pairs from the IPFLAG Western blot (top left) and the relative abundance of the expression levels of these proteins from the TCL Western blot (top right). Error bars, ± SEM. V5/FLAG relative binding was significantly different (p<0.05) between V5-C-mPLXND1 forms and FLAG-mGIPC, F(2, 6)=22.376, p=0.002, as determined by a one-way ANOVA test. A Tukey post hoc analysis was conducted to determine whether the percentual V5/FLAG relative binding between the three tested pairs of proteins was significantly different (p<0.05; asterisks). Right-side bar graph (C). Means of percentual V5TCL/FLAGTCL relative abundance between the indicated protein pairs from the TCL Western blot (top right). Error bars, ± SEM. A Kruskal-Wallis H test was conducted to determine significant differences (p<0.05) in V5TCL/FLAGTCL relative abundance between the indicated protein pairs. Distributions of V5TCL/FLAGTCL relative abundance were not similar for all groups. The medians of V5TCL/FLAGTCL relative abundances were 92.64 (for V5-C-mPLXND1WT/FLAG-mGIPC1), 87.79 (for V5-C-mPLXND1ΔCYSEA/FLAG-mGIPC1), and 96.22 (for V5-C-mPLXND1ΔGBM/FLAG-mGIPC1), but were not statistically significantly different between them (Ramasamy et al., 2015), χ(2)=0.8, p=0.670. (D) Western blots: Top (IPFLAG), FLAG immunoprecipitates and their V5 co-immunoprecipitates showing interactions between the indicated V5-C-mPLXND1 and FLAG-mGIPC forms; bottom, (TCL) detection of the expression levels of these proteins in total cell lysates using antibodies against V5 and FLAG. n = 3 independent experiments for each protein pair. For additional data and statistical comparisons related to this figure, see Supplementary file 1, Supplementary file 2 and Supplementary file 8.
Figure 2 with 2 supplements

The plxnd1skt6 allele encodes a functional Plxnd1 receptor putatively impaired in GIPC binding, and its homozygosity induces angiogenesis deficits with low frequency.
(A, B) Diagrams of the cytosolic tails of the zebrafish Plxnd1 proteins encoded by the WT (A) and plxnd1skt6 mutant (B) alleles including their C-terminal amino acid sequences. Color-coding is used to highlight the following domains and motifs. GAP1 and GAP2 (Guanosine triphosphatase-Activating Protein domains 1 (left) and 2 (right); black), RBD (Rho GTPase-Binding Domain; green), T-segment (C-terminal segment, includes the GBM; blue), and GBM (GIPC-Binding Motif; magenta). In the WT protein diagram (A), the canonical PBM (PDZ-Binding Motif) is underlined. In the mutant protein diagram (B), the thin horizontal red bar denotes the amino acid sequence replacing the PBM. (C–H) Confocal lateral images of the trunk vasculature (green) of 32 hpf embryos (region dorsal to the yolk extension). Anterior, left; dorsal, up. Scale bars (white horizontal lines), 100 μm. Genotypes indicated on top of each image in yellow font. Angiogenesis deficits are indicated with asterisks as follows: white (DLAV gaps), magenta (truncated Se). In the WT image (C), the vessels are designated with the white font as follows: DLAV (Dorsal Longitudinal Anastomotic Vessel), Se (Segmental Vessel), DA (Dorsal Aorta), and PCV (Posterior Cardinal Vein). The homozygous WT and homozygous plxnd1skt6 mutant embryos (F–H) are siblings derived from the incross of plxnd1skt6/+heterozygotes. (I) Bar graph. Percentage of Se-DLAV in 32 hpf embryos of the indicated genotypes belonging to each of the following four phenotypic classes. Truncated: maximal (red; includes missing Se), moderate (yellow), and minimal (gray). Non-truncated: Full (black). There was no statistically significant difference in the distribution of the four phenotypic classes between WT and plxnd1skt6 mutants as assessed by a two-sided Fisher Exact test, p=0.05905. Quantifications. To determine whether plxnd1skt6 complements the plxnd1fov01b null, we analyzed vascular patterning (C–E) and scored Se-DLAV angiogenesis (C, E) in embryos of the following three genotypes: WT (124 Se-DLAV, 11 embryos, an average of 11.27 Se-DLAV/embryo), plxnd1fov01b homozygotes (12 embryos), and plxnd1fov01b/plxnd1fov01b transheterozygotes (162 Se-DLAV, 16 embryos, an average of 10.13 Se-DLAV/embryo). All the WT and transheterozygotes displayed proper vascular patterns indistinguishable from each other and lacked Se-DLAV truncations. All the plxnd1fov01b mutants displayed hyperangiogenic vascular mispatterning. To determine how Plxnd1’s inability to interact with GIPCs impacts angiogenic growth, we scored Se-DLAV angiogenesis (F–I) in sibling embryos of the following two genotypes: Homozygous WT (126 Se-DLAV, 12 embryos, an average of 10.5 Se-DLAV/embryo) and plxnd1skt6 homozygous mutants (124 Se-DLAV, 12 embryos, an average of 10.33 Se-DLAV/embryo). For additional data, graphs and statistical comparisons related to this figure, see Figure 2—figure supplement 1 and Supplementary file 3.
Figure 2—figure supplement 1

Penetrance and expressivity of Se-DLAV truncations in plxnd1skt6 mutants at 32 hpf.
(A) Penetrance bar graph. Percentage of embryos of the indicated genotypes with Se-DLAV truncations (gray; a summation of the ‘minimal,’ ‘moderate,’ and ‘maximal’ categories) and with non-truncated Se-DLAV (black; ‘full’ category). The distributions of these two phenotypic classes were not statistically significantly different between WT and plxnd1skt6 mutants as assessed by a two-sided Fisher Exact test, p=0.21739. (B) Expressivity bar graph. Percentage of ‘maximal’ (red), ‘moderate’ (yellow), and ‘minimal’ (gray) Se-DLAV truncations, and of ‘full’ (black) non-truncated Se-DLAV in plxnd1skt6 mutants with Se-DLAV truncations. For additional supplementary information related to this figure, see Supplementary file 3. This figure is related to Figure 2.
Figure 2—figure supplement 2
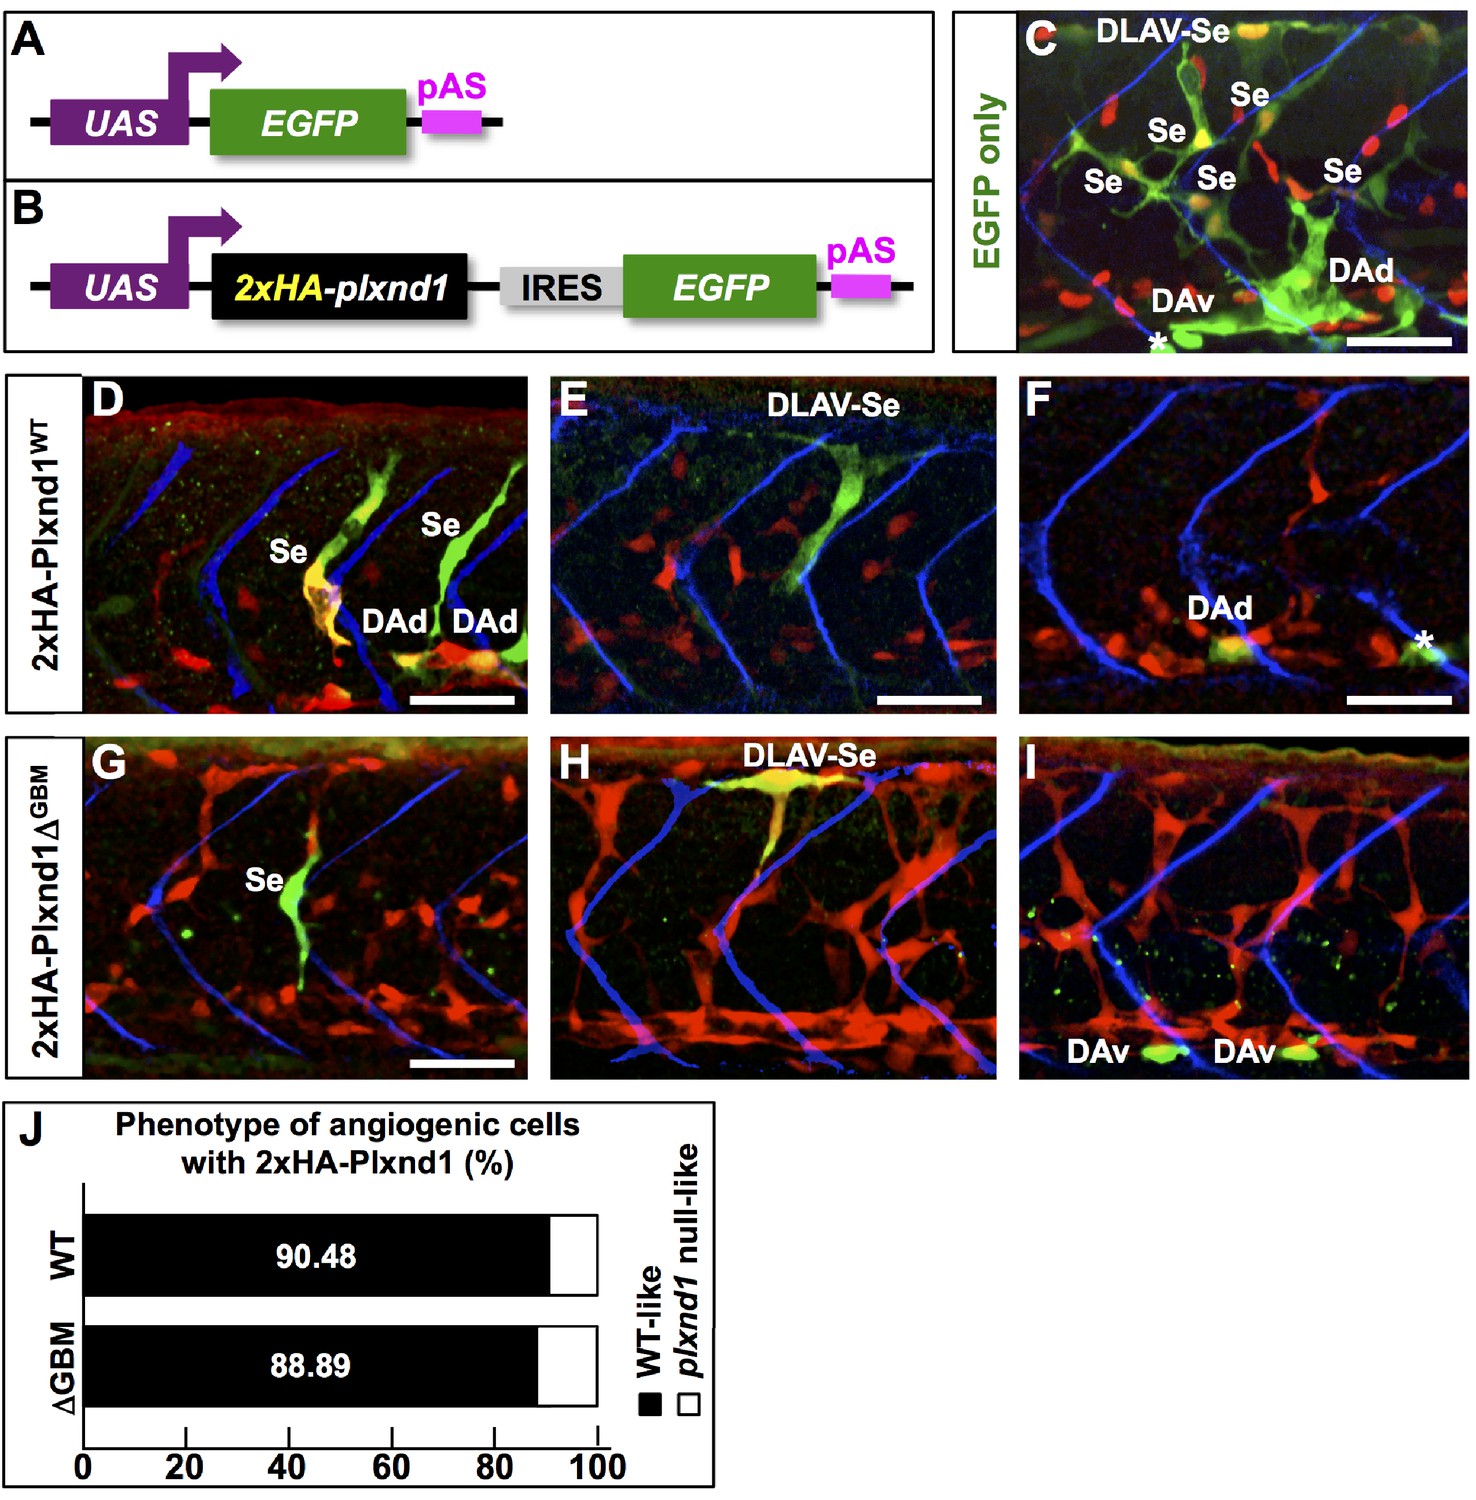
A Plxnd1 form deficient in GIPC binding because of deletion of the receptor’s GBM (Plxnd1ΔGBM) is active in vivo.
(A, B) Diagrams of the GAL4-responsive constructs used for forced endothelial expression in plxnd1fov01b; Tg(fli1a:GAL4FF)ubs4; Tg(flt1:nls-mCherry)skt7 embryos. (A) Construct for expression of the green fluorescent marker EGFP (negative control). (B) Construct for bicistronic coexpression of 2xHA-Plxnd1 (2xHA-Plxnd1WT or 2xHA-Plxnd1ΔGBM) and EGFP (to fluorescently label cells with exogenous 2xHA-Plxnd1 expression). (C–I) Confocal lateral images of 32 hpf embryo trunks. Anterior, left; dorsal, up. Scale bars (white horizontal lines), 50 μm. Image colors: Cells with exogenous gene expression, green (EGFP+); arterial nuclei, red; somite boundaries, blue. The position of EGFP+ clones within the arterial tree indicated as follows. DLAV (Dorsal Longitudinal Anastomotic Vessel), Se (Segmental vessel), DLAV-Se (both Se and DLAV), DAd (dorsal side of the Dorsal Aorta), and DAv (ventral side of the Dorsal Aorta). White asterisks mark clones with non-endothelial, ectopic expression. (C) Expression of EGFP alone fails to rescue the vascular defects of plxnD1fov01b mutants. EGFP+ arterial cells form mispatterned, ectopic and over branched Se vessels and aberrantly shaped DLAVs. (D–I) EGFP+ cells expressing 2xHA-Plxnd1WT (D–F) or 2xHA-Plxnd1ΔGBM (G–I) rescue the vascular defects of plxnd1fov01b mutants. These cells displayed a WT-like phenotype. Briefly, they were not found within ectopic Se sprouts, displayed normal shapes according to their position within Se and DLAVs and, when found at the base of a sprout, were properly positioned just anterior to a somite boundary; see (Zygmunt et al., 2011). (J) Bar graph. Quantification of the vascular phenotype (WT-like or plxnd1 null-like) of EGFP+ angiogenic endothelial cells (those at the DLAV, DLAV-Se, and DAd positions but not the DAV position) with exogenous expression of 2xHA-Plxnd1WT (top) or 2xHA-Plxnd1ΔGBM (bottom) in plxnd1fov01b mutants. Both 2xHA-Plxnd1 forms rescue the vascular defects of plxnd1fov01b mutants with similar efficiency. Quantifications. We scored the vascular phenotype of angiogenic endothelial cells in plxnd1fov01b mutants coexpressing EGFP and the following 2xHA-Plxnd1 forms: 2xHA-Plxnd1WT (21 clones, 15 embryos), 2xHA-Plxnd1ΔGBM (nine clones, 17 embryos). Note that embryos harboring only DAV clones were excluded from this analysis. The significance value (p=1) was calculated using a two-sided Fisher’s Exact test. The significant difference value is p<0.05. The proportions were not significantly different. For additional supplementary information related to this figure, see Supplementary file 1, Supplementary file 3 and Supplementary file 8. This figure is related to Figure 2.
Figure 3 with 1 supplement

plxnd1skt6 mutants are hypersensitive to the antiangiogenic drug SU5416.
(A–D) Confocal lateral images of the trunk vasculature (green) of 32 hpf embryos (region dorsal to the yolk extension). Anterior, left; dorsal, up. Scale bars (white horizontal lines), 100 μm. Treatments (DMSO or SU5416) indicated on top, genotypes (WT or plxnd1skt6) indicated on the left. Angiogenesis deficits are indicated with asterisks as follows: white (DLAV gaps), magenta (truncated Se). In the image of the DMSO-treated WT (C), the vessels are designated with the white font as follows: DLAV (Dorsal Longitudinal Anastomotic Vessel), Se (Segmental Vessel), DA (Dorsal Aorta), and PCV (Posterior Cardinal Vein). (E) Bar graph. Percentage of Se-DLAV in 32 hpf embryos of the indicated genotype and treatment combinations belonging to each of the following four phenotypic classes. Truncated: maximal (red; includes missing Se), moderate (yellow), and minimal (gray). Non-truncated: Full (black). The distributions of these four phenotypic classes were statistically significantly different between all the possible pairwise comparisons of the four combinations of treatments and genotypes. Significance values were calculated using a two-sided Fisher Exact test and significant differences (p<0.0083) assigned using a Bonferroni-type adjustment for six pairwise genotype comparisons (0.05/6 = 0.0083). Quantifications. We scored Se-DLAV angiogenesis (A–E) in embryos of the following four combinations of treatments and genotypes: DMSO-treated WT (312 Se-DLAV, 28 embryos, an average of 11.14 Se-DLAV/embryo), DMSO-treated plxnd1skt6 (284 Se-DLAV, 26 embryos, an average of 10.92 Se-DLAV/embryo), SU5416-treated WT (322 Se-DLAV, 29 embryos, an average of 11.10 Se-DLAV/embryo), and SU5416-treated plxnd1skt6 (320 Se-DLAV, 28 embryos, an average of 11.43 Se-DLAV/embryo). For additional data, graphs and statistical comparisons related to this figure, see Figure 3—figure supplement 1 and Supplementary file 4.
Figure 3—figure supplement 1
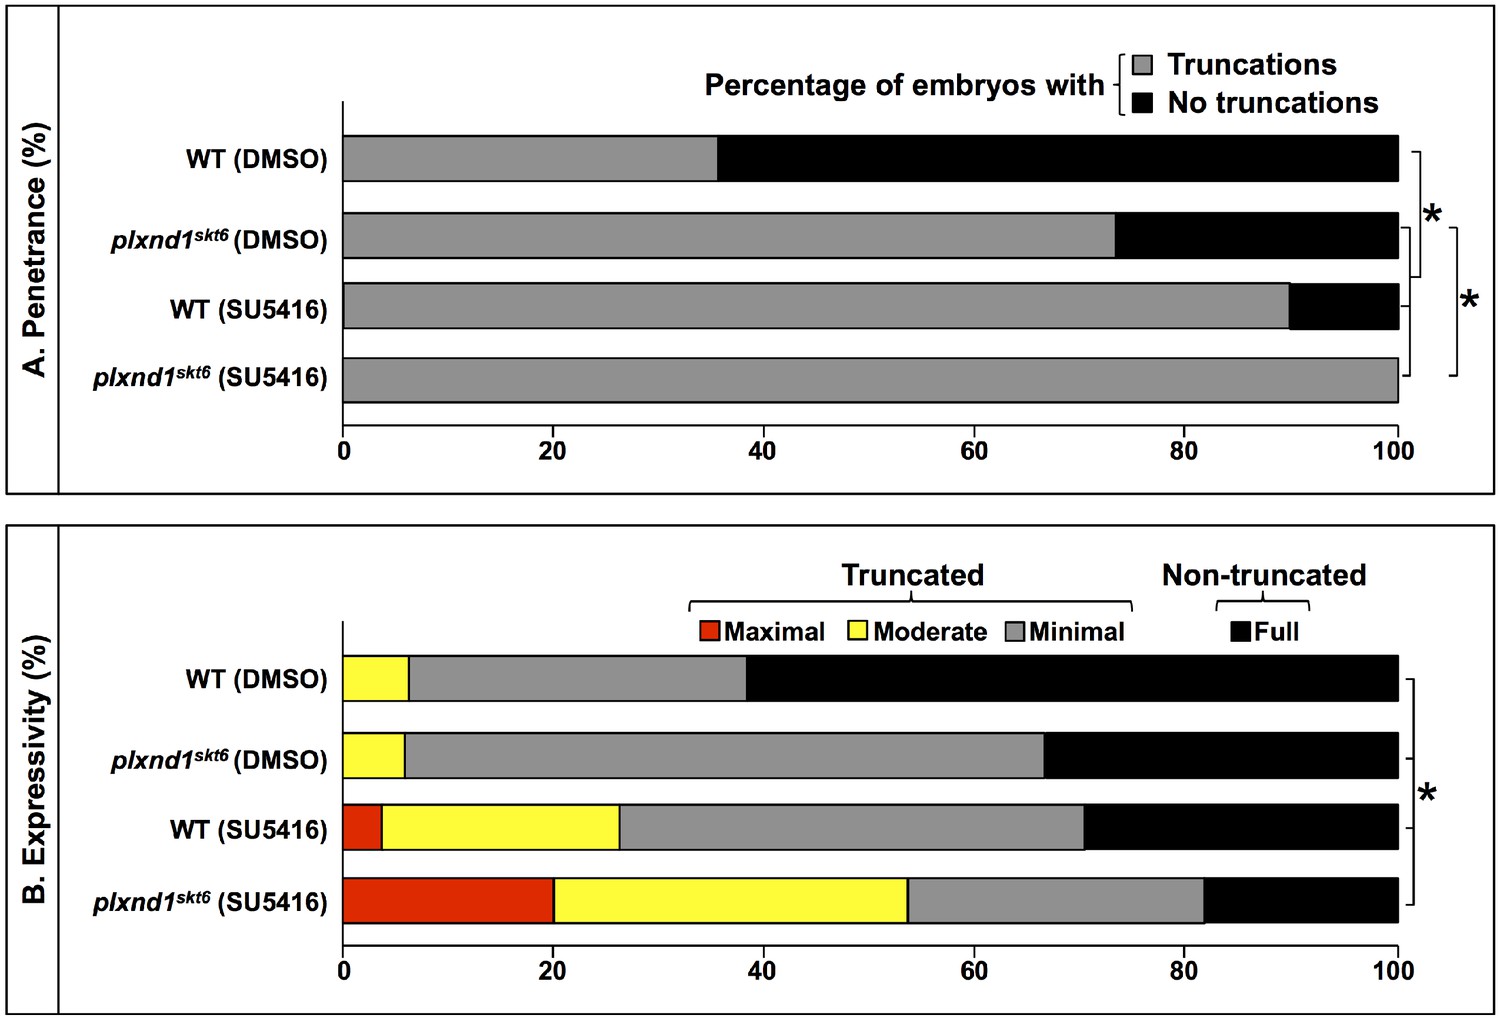
Penetrance and expressivity of Se-DLAV truncations in DMSO-treated and SU5416-treated WT and embryos and plxnd1skt6 mutants at 32 hpf.
(A) Penetrance bar graph. Percentage of embryos of the indicated combinations of genotypes and treatments with Se-DLAV truncations (gray; a summation of the ‘minimal,’ ‘moderate,’ and ‘maximal’ categories) and with non-truncated Se-DLAV (black; ‘full’ category). Brackets and asterisks indicate pairs of genotypes with significantly different distributions of these two phenotypic classes as assessed by a two-sided Fisher Exact test, p<0.0083. (B) Expressivity bar graph. Percentage of ‘maximal’ (red), ‘moderate’ (yellow), and ‘minimal’ (gray) Se-DLAV truncations and of ‘full’ (black) non-truncated Se-DLAV in embryos with Se-DLAV truncations of the indicated combinations of genotypes and treatments. Brackets and asterisks indicate pairs of genotypes with significantly different distributions of the four phenotypic classes as assessed by a two-sided Fisher Exact test, p<0.0083. For additional supplementary information related to this figure, see Supplementary file 4. This figure is related to Figure 3.
Figure 4 with 3 supplements
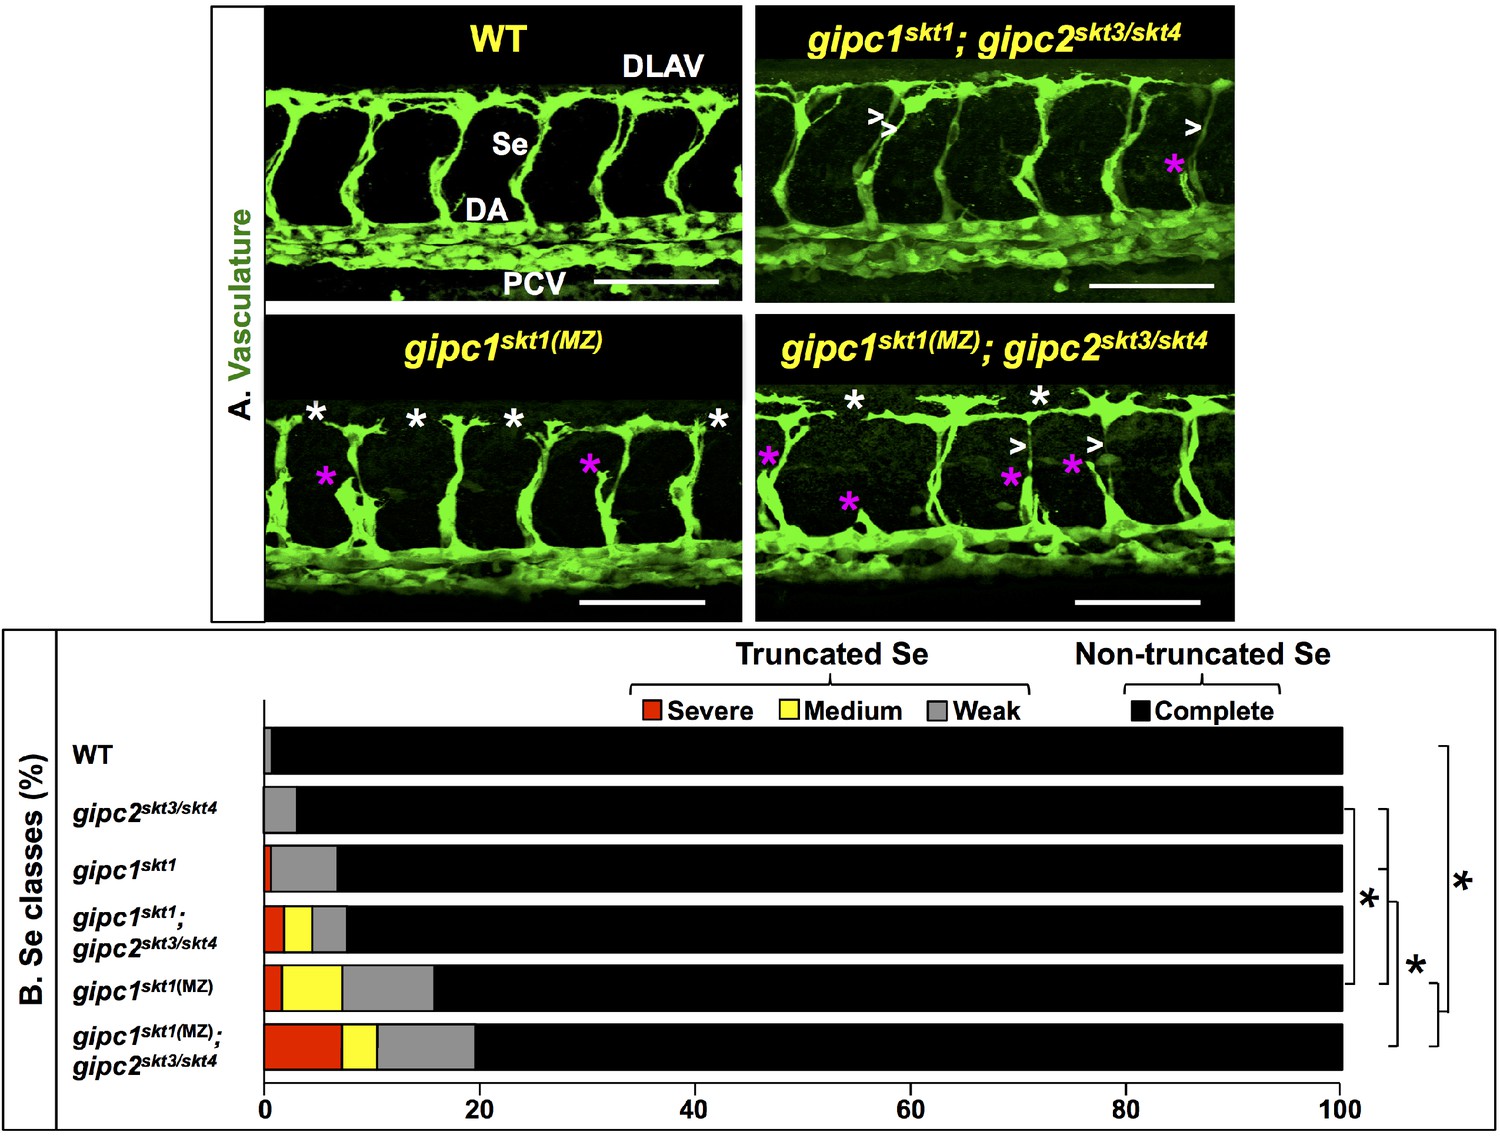
gipc mutants display angiogenesis deficits.
(A) Confocal lateral images of the trunk vasculature (green) of 32 hpf embryos (region dorsal to the yolk extension). Anterior, left; dorsal, up. Scale bars (white horizontal lines), 100 μm. Genotypes indicated on top of each image in yellow font. Angiogenesis deficits are indicated as follows: white asterisks (DLAV gaps), magenta asterisks (truncated Se), white greater-than sign (thin Se). Maternal-zygotic (MZ) removal of gipc activity is denoted by the designation ‘MZ’ in superscript. In the WT image (top left), the vessels are designated with the white font as follows: DLAV (Dorsal Longitudinal Anastomotic Vessel), Se (Segmental Vessel), DA (Dorsal Aorta), and PCV (Posterior Cardinal Vein). (B) Bar graph. Percentage of Se in 32 hpf embryos of the indicated genotypes belonging to each of the following four phenotypic classes. Truncated: severe (includes missing Se), medium (yellow), and weak (gray). Non-truncated: complete (black). Significance values were calculated using a two-sided Fisher Exact test and significant differences (p<0.0033) assigned using a Bonferroni-type adjustment for 15 pairwise genotype comparisons (0.05/15 = 0.0033). Brackets and asterisks indicate pairs of genotypes with significantly different distributions of these four phenotypic classes. Quantifications. We scored Se angiogenesis in embryos of the following six genotypes: WT (138 Se, 12 embryos; an average of 11.5 Se/embryo), gipc1skt1 (130 Se, 11 embryos; an average of 11.8 Se/embryo), gipc1skt1(MZ) (380 Se, 33 embryos; an average of 11.5 Se/embryo), gipc2skt3/skt4(130 Se, 11 embryos; an average of 11.8 Se/embryo), gipc1skt1; gipc2skt3/skt4 (152 Se, 13 embryos; an average of 11.6 Se/embryo), and gipc1skt1(MZ); gipc2skt3/skt4 (220 Se, 19 embryos; an average of 11.5 Se/embryo). For additional data, graphs, and statistical comparisons related to this figure, see Figure 4—figure supplement 2, Figure 4—figure supplement 3 and Supplementary file 5. Please note that given the use of different scales for scoring angiogenesis deficits, it is unfeasible to compare the quantifications in Figure 4 and Figure 5 directly.
Figure 4—figure supplement 1
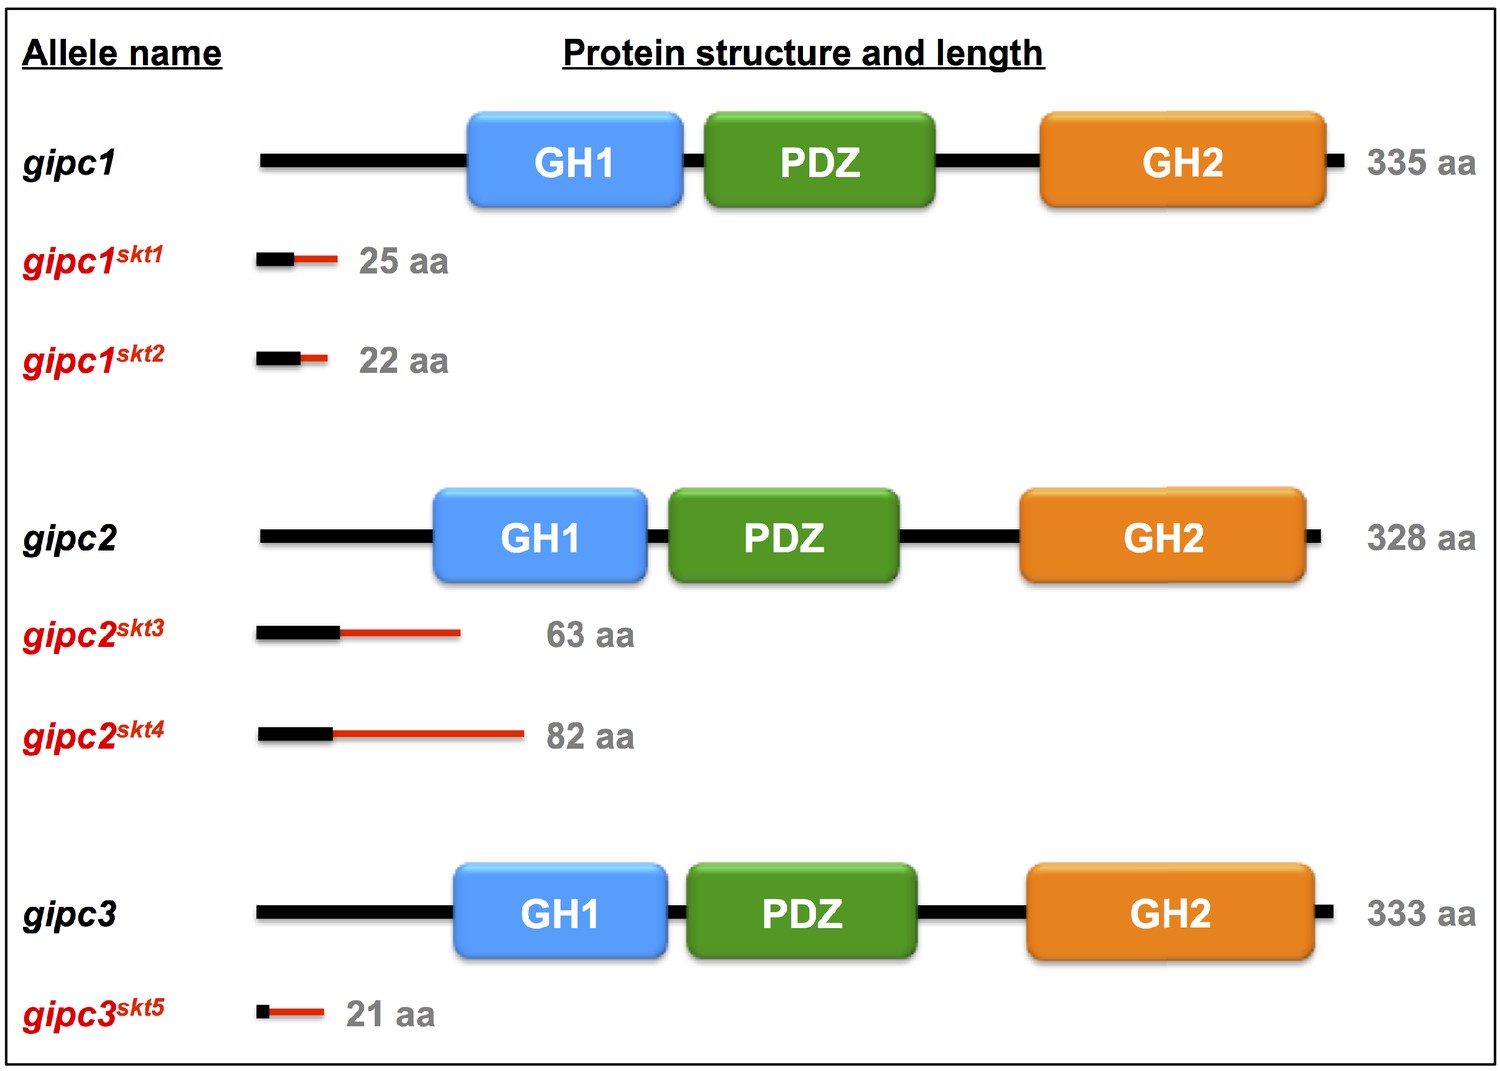
GIPC proteins encoded by both the wild-type and mutant gipc1, gipc2, and gipc3 alleles.
In the mutant proteins, the red bar denotes novel amino acid sequences resulting from mutagenic frameshift(s). See Supplementary file 1 and Supplementary file 8. Related to Figure 4.
Figure 4—figure supplement 2
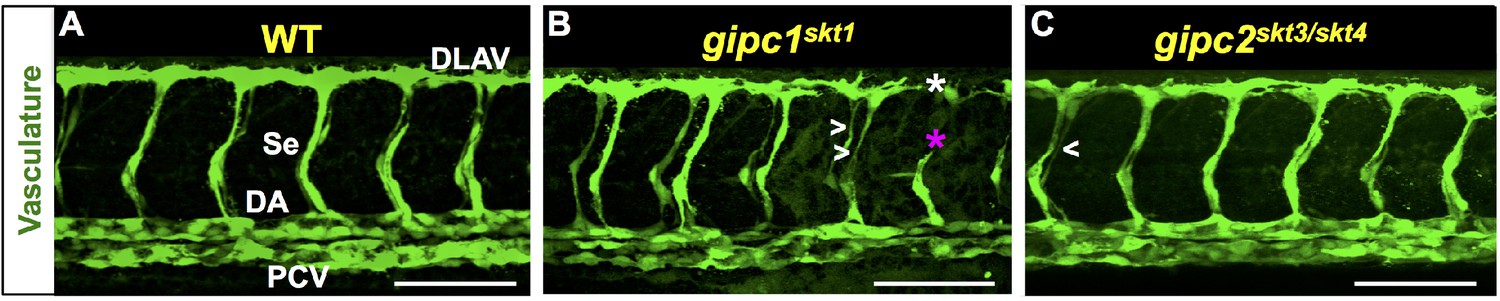
Angiogenesis deficits of gipc1skt1 and gipc2 skt3/skt4 mutants at 32 hpf.
(A–C) Confocal lateral images of the trunk vasculature (green) of 32 hpf embryos (region dorsal to the yolk extension). Anterior, left; dorsal, up. Scale bars (white horizontal lines), 100 μm. Genotypes indicated on top of each image in yellow font. Angiogenesis deficits are indicated as follows: white asterisks (DLAV gaps), magenta asterisks (truncated Se), white greater/less-than signs (thin Se). In the WT image (A), the vessels are designated with the white font as follows: DLAV (Dorsal Longitudinal Anastomotic Vessel), Se (Segmental Vessel), DA (Dorsal Aorta), and PCV (Posterior Cardinal Vein). Related to Figure 4.
Figure 4—figure supplement 3
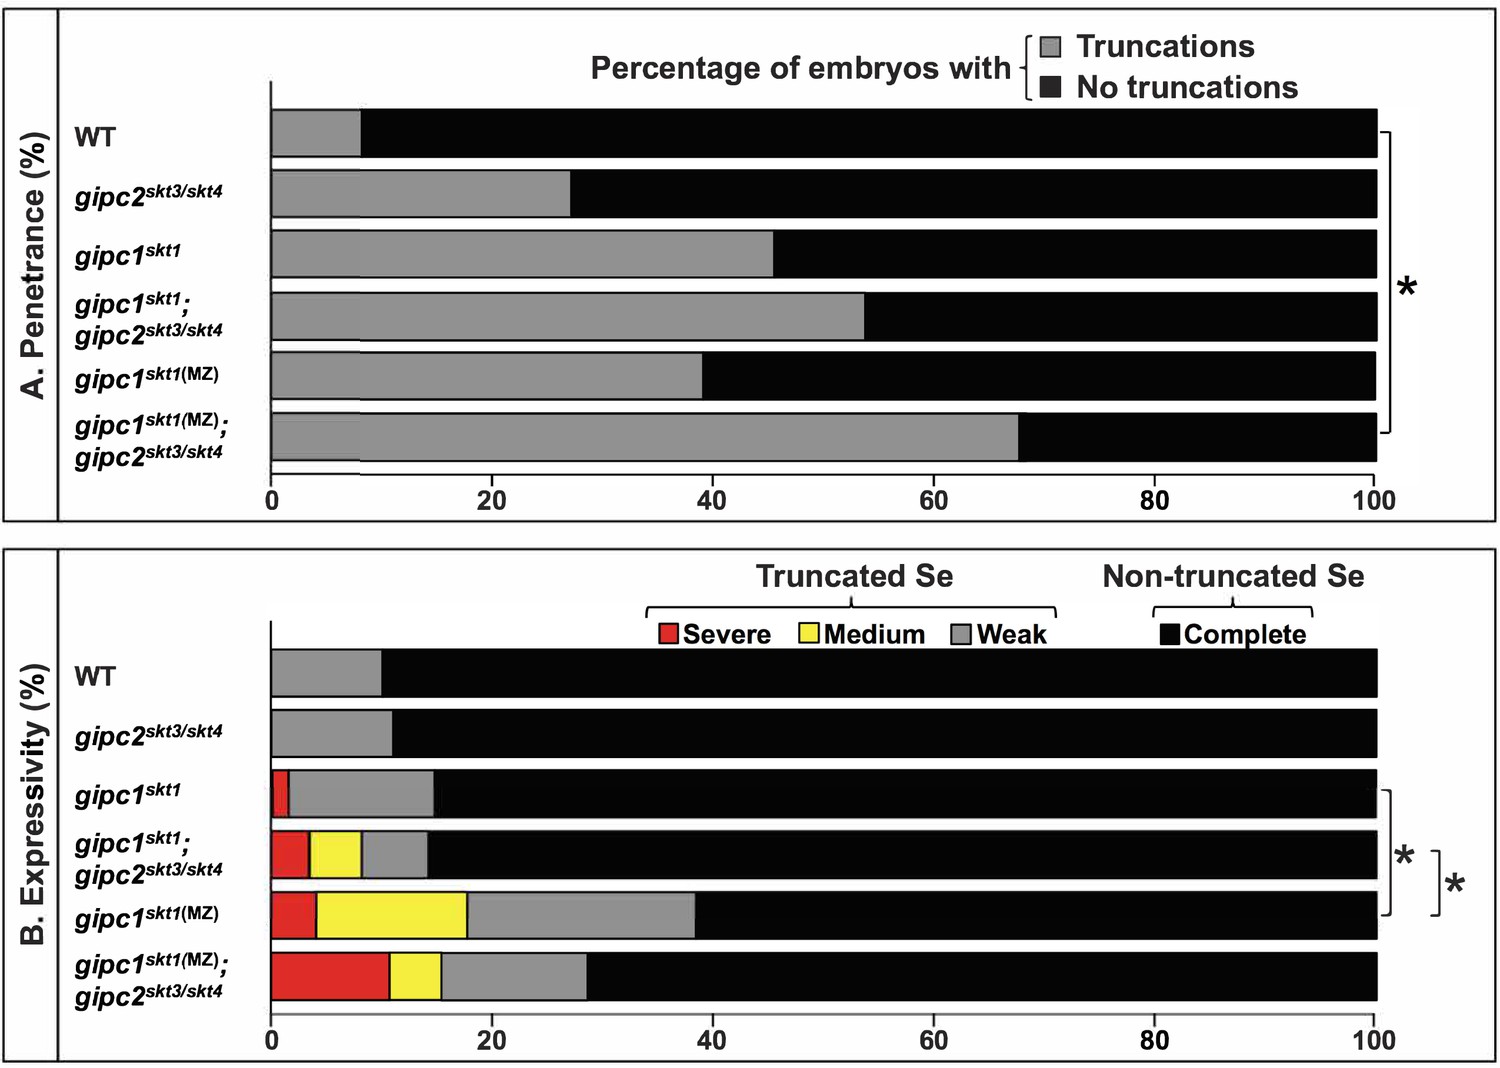
Penetrance and expressivity of Se truncations in gipc mutants at 32 hpf.
(A) Penetrance bar graph. Percentage of embryos of the indicated genotypes with Se truncations (gray; a summation of the ‘severe,’ ‘medium,’ and, ‘weak’ categories) and with non-truncated Se (black; ‘complete’ category). Brackets and asterisks indicate pairs of genotypes with significantly different distributions of these two phenotypic classes as assessed by a two-sided Fisher Exact test, p<0.0033. (B) Expressivity bar graph. Percentage of ‘severe’ (red), ‘medium’ (yellow), and weak (gray) Se truncations and of ‘complete’ (black) non-truncated Se in embryos with Se truncations of the indicated genotypes. Brackets and asterisks indicate pairs of genotypes with significantly different distributions of the four phenotypic classes as assessed by a two-sided Fisher Exact test, p<0.0033. For additional supplementary information related to this figure, see Supplementary file 5. This figure is related to Figure 4.
Figure 5 with 1 supplement
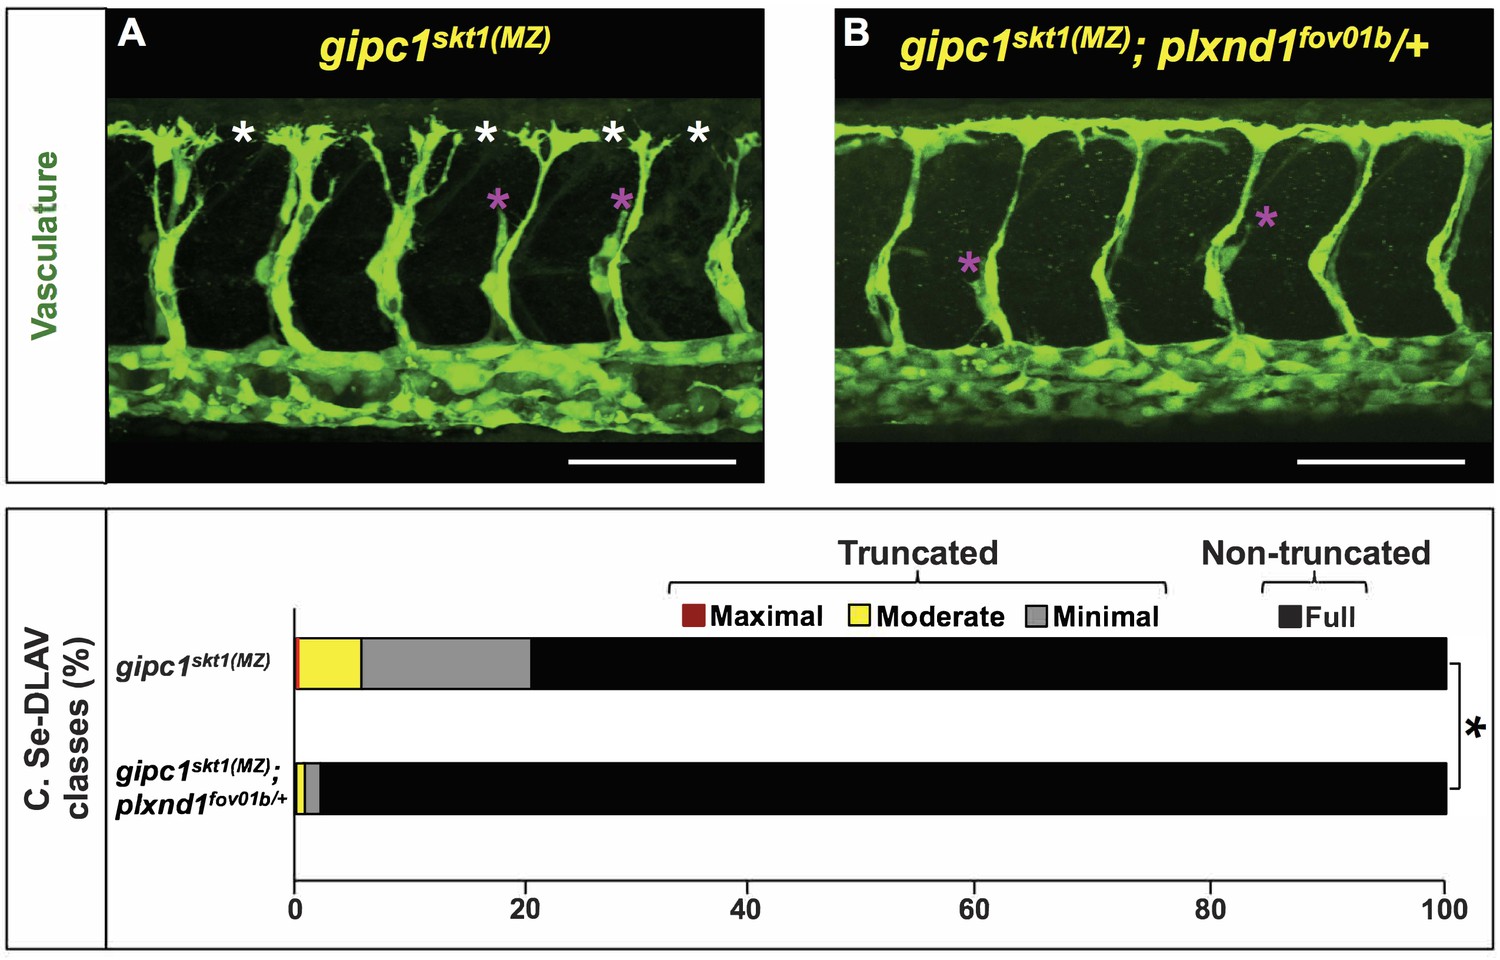
plxnd1 heterozygosity suppresses the angiogenesis deficits of gipc1skt1(MZ) mutants.
(A, B) Confocal lateral images of the trunk vasculature (green) of 32 hpf embryos (region dorsal to the yolk extension). Anterior, left; dorsal, up. Scale bars (white horizontal lines), 100 μm. Genotypes indicated on top of each image in yellow font. Angiogenesis deficits are indicated with asterisks as follows: white (DLAV gaps), magenta (truncated Se). (C) Bar graph. Percentage of Se-DLAV in 32 hpf embryos of the indicated genotypes belonging to each of the following four phenotypic classes. Truncated: maximal (red; includes missing Se), moderate (yellow), and minimal (gray). Non-truncated: full (black). There was a statistically significant difference (bracket with an asterisk) in distribution of the four phenotypic classes between gipc1skt1(MZ) and gipc1skt1(MZ); plxnd1fov01b/+ embryos, as assessed by a two-sided Fisher Exact test (p<0.05). Quantifications. We scored Se-DLAV angiogenesis in embryos of the following two genotypes: gipc1skt1(MZ) (390 Se-DLAV, 36 embryos, an average of 10.83 Se-DLAV/embryo) and gipc1skt1(MZ); plxnd1fov01b/+ (410 Se-DLAV, 38 embryos, an average of 10.79 Se-DLAV/embryo). For additional data, graphs, and statistical comparisons related to this figure, see Figure 5—figure supplement 1 and Supplementary file 6. Please note that given the use of different scales for scoring angiogenesis deficits, it is unfeasible to compare the quantifications in Figure 4 and Figure 5 directly.
Figure 5—figure supplement 1
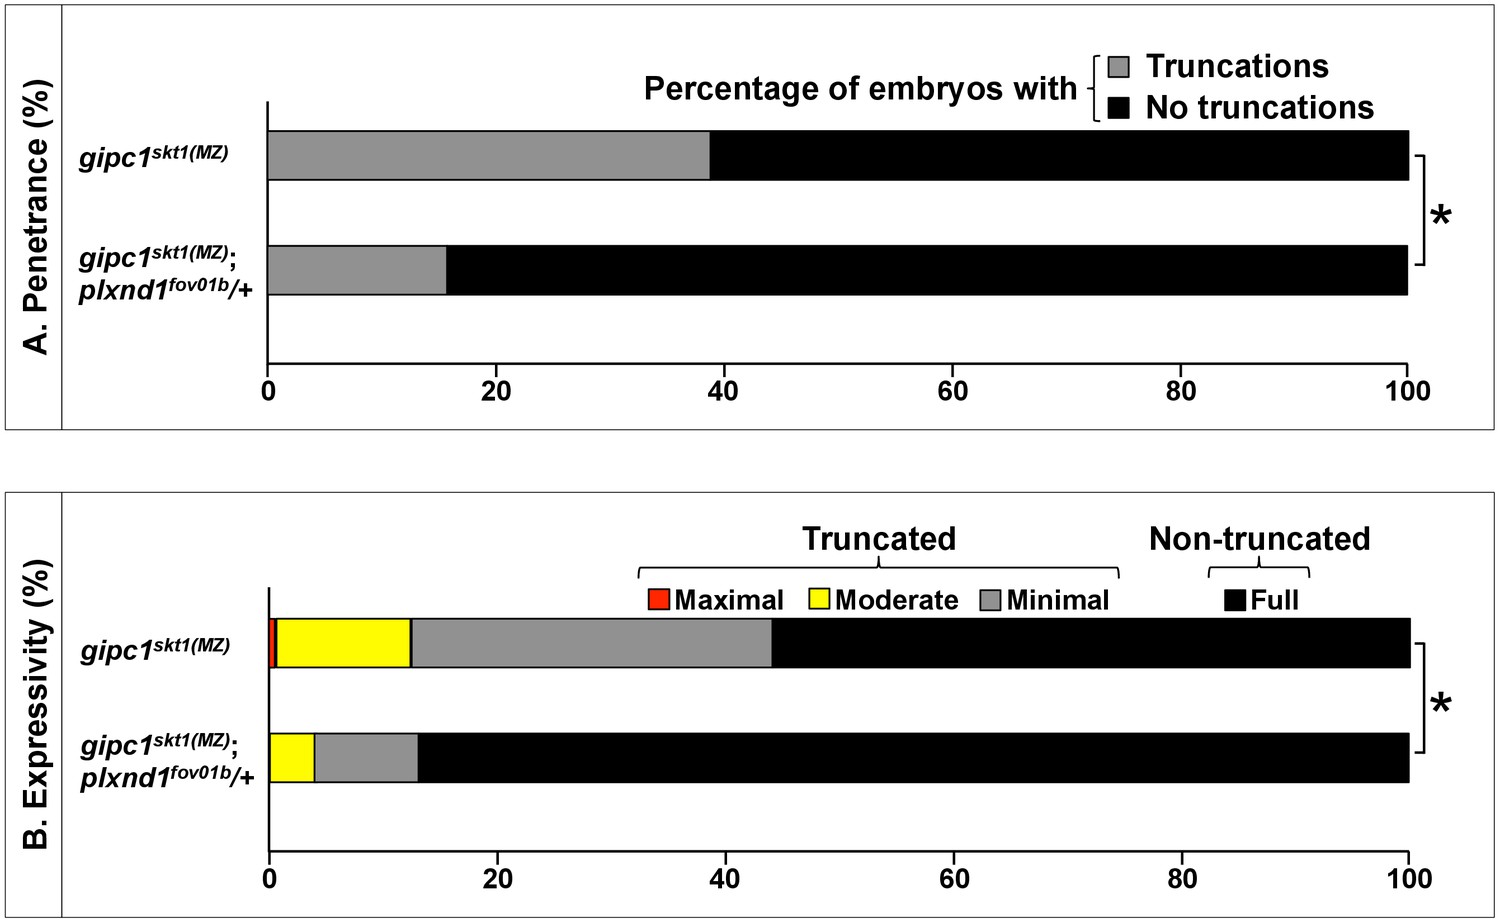
Penetrance and expressivity of Se-DLAV truncations in gipc1skt1(MZ) and gipc1skt1(MZ); plxnd1fov01b/+ embryos at 32 hpf.
(A) Penetrance bar graph. Percentage of embryos of the indicated genotypes with Se-DLAV truncations (gray; a summation of the ‘minimal,’ ‘moderate,’ and ‘maximal’ categories) and with non-truncated Se-DLAV (black; ‘full’ category). The distributions of these two phenotypic classes were statistically significantly different between gipc1skt1(MZ) and gipc1skt1(MZ); plxnd1fov01b/+ embryos as assessed by a two-sided Fisher Exact test, p=0.0361. (B) Expressivity bar graph. Percentage of ‘maximal’ (red), ‘moderate’ (yellow), and ‘minimal’ (gray) Se-DLAV truncations and of ‘full’ (black) non-truncated Se-DLAV in embryos with Se-DLAV truncations of the indicated genotypes. The distributions of these four phenotypic classes were statistically significantly different between gipc1skt1(MZ) and gipc1skt1(MZ); plxnd1fov01b/+ embryos (brackets and asterisks) as assessed by a two-sided Fisher Exact test, p=0.00004. For additional supplementary information related to this figure, see Supplementary file 6. This figure is related to Figure 5.
Figure 6
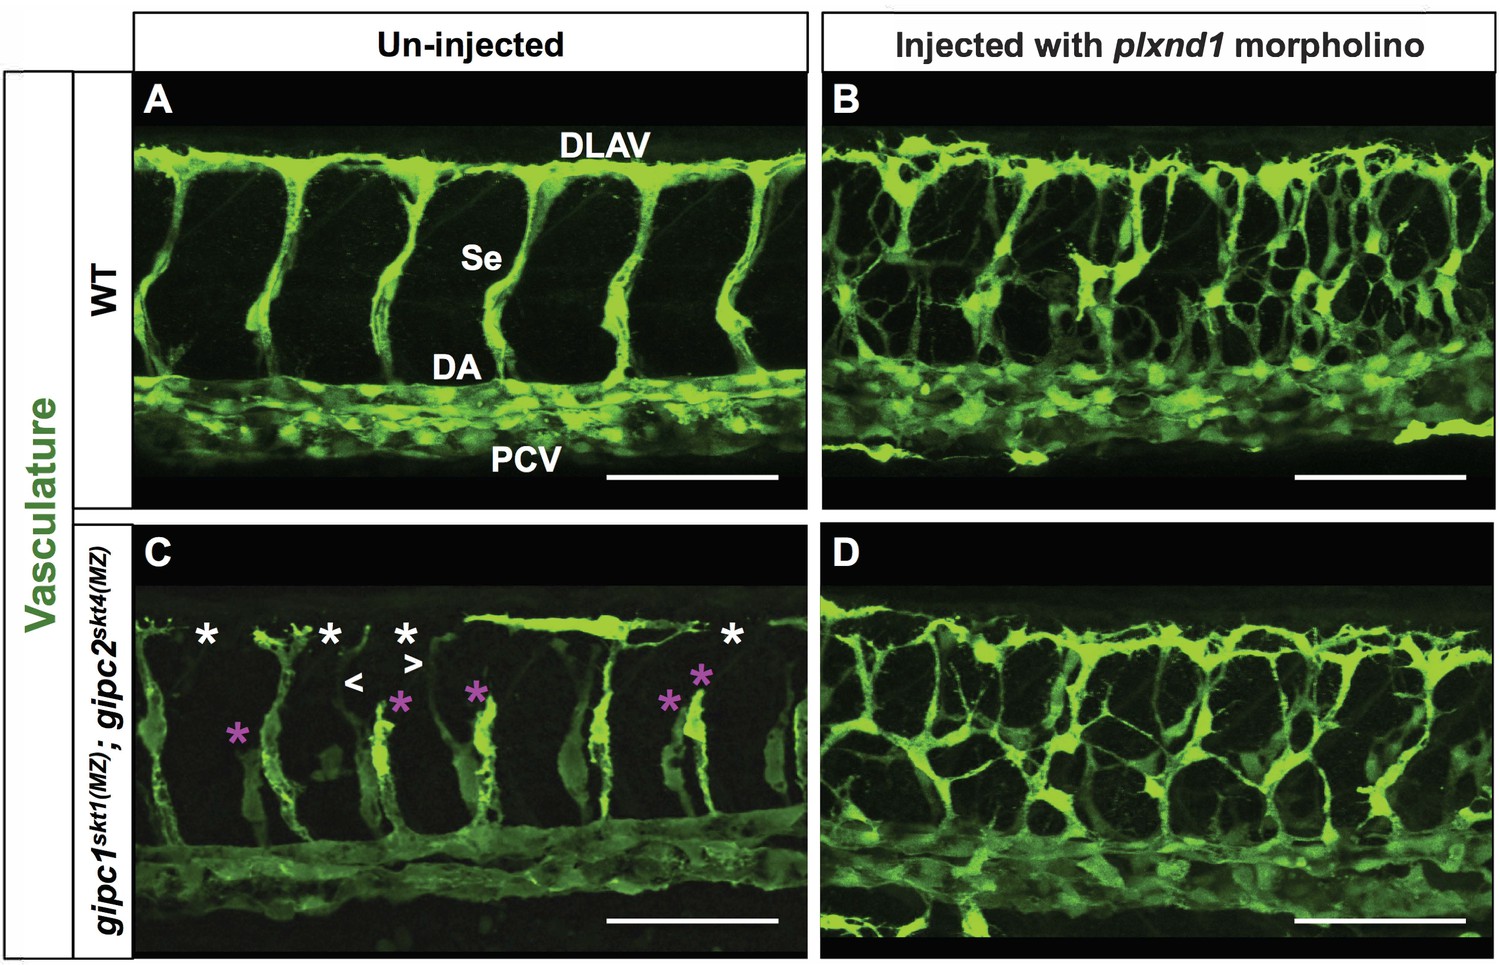
Removal of plxnd1 activity from gipc1skt1(MZ); gipc2skt4(MZ) maternal-zygotic (MZ) double mutants yields a phenotype similar to that of plxnd1 nulls.
(A–D) Confocal lateral images of the trunk vasculature (green) of 32 hpf embryos (region dorsal to the yolk extension). Anterior, left; dorsal, up. Scale bars (white horizontal lines), 100 μm. Morpholino injection (un-injected or injected with plxnd1 morpholino) indicated on top, genotypes (WT or gipc1skt1(MZ); gipc2skt4(MZ)) indicated on the left. The un-injected WT picture (A) shows the names of the major vessels in white font: DLAV (Dorsal Longitudinal Anastomotic Vessel), Se (Segmental Vessel), DA (Dorsal Aorta), and PCV (Posterior Cardinal Vein). Vascular defects highlighted as follows: truncated or missing Se (magenta asterisk), thin Se (white greater/less-than signs), DLAV gaps (white asterisk). Quantifications. The following number of embryos were analyzed: WT (four embryos), WT injected with plxnd1 morpholino (four embryos; 4/4 showed a vascular phenotype similar to that of plxnd1fov01b nulls), gipc1skt1(MZ); gipc2skt4(MZ) (12 embryos; 7/12 showed angiogenesis deficits), and gipc1skt1(MZ); gipc2skt4(MZ) injected with plxnd1 morpholino (11 embryos; 11/11 showed a vascular phenotype similar to that of plxnd1fov01b nulls).
Figure 7 with 4 supplements
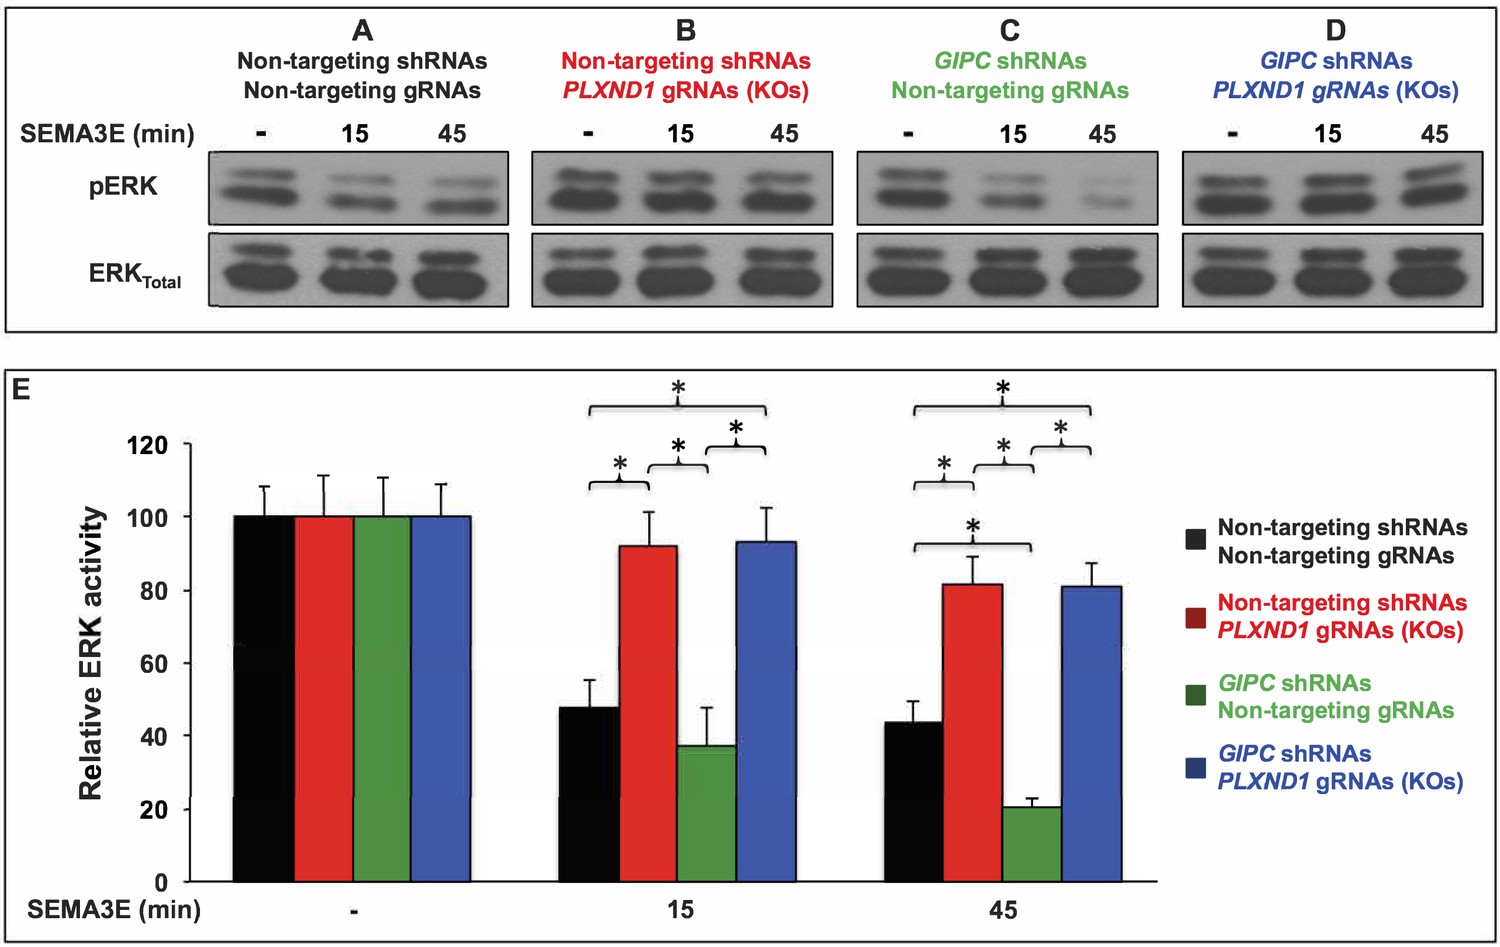
GIPC depletion potentiates SEMA3E-induced, PLXND1-dependent ERK inactivation in HUVEC/TERT2 cells.
(A–D) Representative Western blot of active ERK1/2 (pERK) and total ERK1/2 (ERKTotal) from total cell lysates of HUVEC/TERT2 cells under the four conditions (shRNA and gRNA combinations) and the three ligand treatments indicated. Conditions. Control (A; bold black font), PLXND1 loss (B; bold red font), GIPC loss (C; bold green font), and GIPC-PLXND1 double loss (D; bold blue font). Treatments. Vehicle (-) and 2 nM SEMA3E for the indicated times. Cells stably carried a vector coexpressing the Cas9 nuclease and the indicated gRNAs. The alleles of the PLXND1 gRNAs (KOs) are stable and defined (see Supplementary file 1 and Supplementary file 8). (E) Bar graph. Means of percentual relative ERK activity (pERK/ERKTotal) under the described conditions (color coded as above) and treatments. Error bars, ± SEM. Relative ERK activity. Statistically significant differences between pairwise combinations of conditions and treatments are indicated (brackets and asterisks). Quantifications. n = 4 independent experiments per PLXND1 gRNA KO (for a pooled total of 8 experiments); n = 4 independent experiments per non-targeting gRNA (for a pooled total of 8 experiments). One-way ANOVA tests were conducted to determine whether relative ERK activity was significantly different between cells in the control, PLXND1 loss, GIPC loss, and GIPC-PLXND1 double loss conditions across each treatment. There were no outliers in the data, as assessed by inspection of a boxplot. Relative ERK activity data were normally distributed, for each treatment, as determined by Shapiro-Wilk’s test (p>0.05) except for the SEMA3E 15 min treatment; p=0.031. There was homogeneity of variances, as assessed by Levene's test (p>0.05) for equality of variances in all conditions. One-way ANOVA tests summary. Relative ERK activity was not statistically significantly different between conditions under vehicle treatment (F(3, 28)=0.004, p=1). Relative ERK activity was statistically significantly different between conditions under SEMA3E 15 min treatment (F(3, 28)=10.291, p<0.0005), effect size was ω2 = 0.46. Relative ERK activity was statistically significantly different between conditions under SEMA3E 45 min treatment (F(3, 28)=28.738, p<0.0005), effect size was ω2 = 0.72. Summary of the four statistically significant differences revealed by Tukey post hoc analysis (between conditions under SEMA3E 15 min treatment). Control versus PLXND1 loss was statistically significantly different (p<0.05): (95% CI (17.2450 to 67.2680); p=0.001). Control versus GIPC- PLXND1 double loss was statistically significantly different (p<0.05): (95% CI (−80.9622 to −12.0628); p=0.005). GIPC loss versus PLXND1 loss was statistically significantly different (p<0.05): (95% CI (17.1753 to 86.0747); p=0.002). GIPC loss versus GIPC-PLXND1 double loss was statistically significantly different (p<0.05): (95% CI (−90.0872 to −21.1878); p=0.001). Summary of the five statistically significant differences revealed by Tukey post hoc analysis (between conditions under SEMA3E 45 min treatment). Control versus PLXND1 loss was statistically significantly different (p<0.05): (95% CI (−59.2432 to −16.5068); p<0.0005). Control versus GIPC-PLXND1 double loss was statistically significantly different (p<0.05): (95% CI (−57.3307 to −14.5943); p<0.0005). GIPC loss versus PLXND1 loss was statistically significantly different (p<0.05): (95% CI 39.9193 to 82.6557); p<0.0005). GIPC loss versus GIPC-PLXND1 loss was statistically significantly different (p<0.05): (95% CI-80.7432 to −38.0068); p<0.0005). Control versus GIPC loss was statistically significantly different (p<0.05): (95% CI (2.0443 to 44.7807); p=0.028). For additional data, graphs, and statistical comparisons related to this figure, see Supplementary file 7.
Figure 7—figure supplement 1

GIPC depletion potentiates SEMA3E-induced, PLXND1-dependent ERK inactivation in HUVEC/TERT2 cells.
(A, B) Bar graphs. Means of percentual relative ERK activity (pERK/ERKTotal) under the described conditions and SEMA3E treatments. Error bars, ± SEM. Relative ERK activity. (A) Conditions: control (black; cells with non-targeting gRNA#1 infected with non-targeting shRNAs), PLXND1 loss (red; cells with PLXND1 gRNA KO#1 infected with non-targeting shRNAs), GIPC loss (green; cells with non-targeting gRNA#1 infected with GIPC shRNAs), and GIPC-PLXND1 double loss (blue; cells with PLXND1 gRNA KO#1 infected with GIPC shRNAs). (B) Conditions: control (black; cells with non-targeting gRNA#2 infected with non-targeting shRNAs), PLXND1 loss (red; cells with PLXND1 gRNA KO#2 infected with non-targeting shRNAs), GIPC loss (green; cells with non-targeting gRNA#2 infected with GIPC shRNAs), and GIPC-PLXND1 double loss (blue; cells with PLXND1 gRNA KO#2 infected with GIPC shRNAs). For additional data, graphs, and statistical comparisons related to this figure, see Supplementary file 7. This figure is related to Figure 7.
Figure 7—figure supplement 2
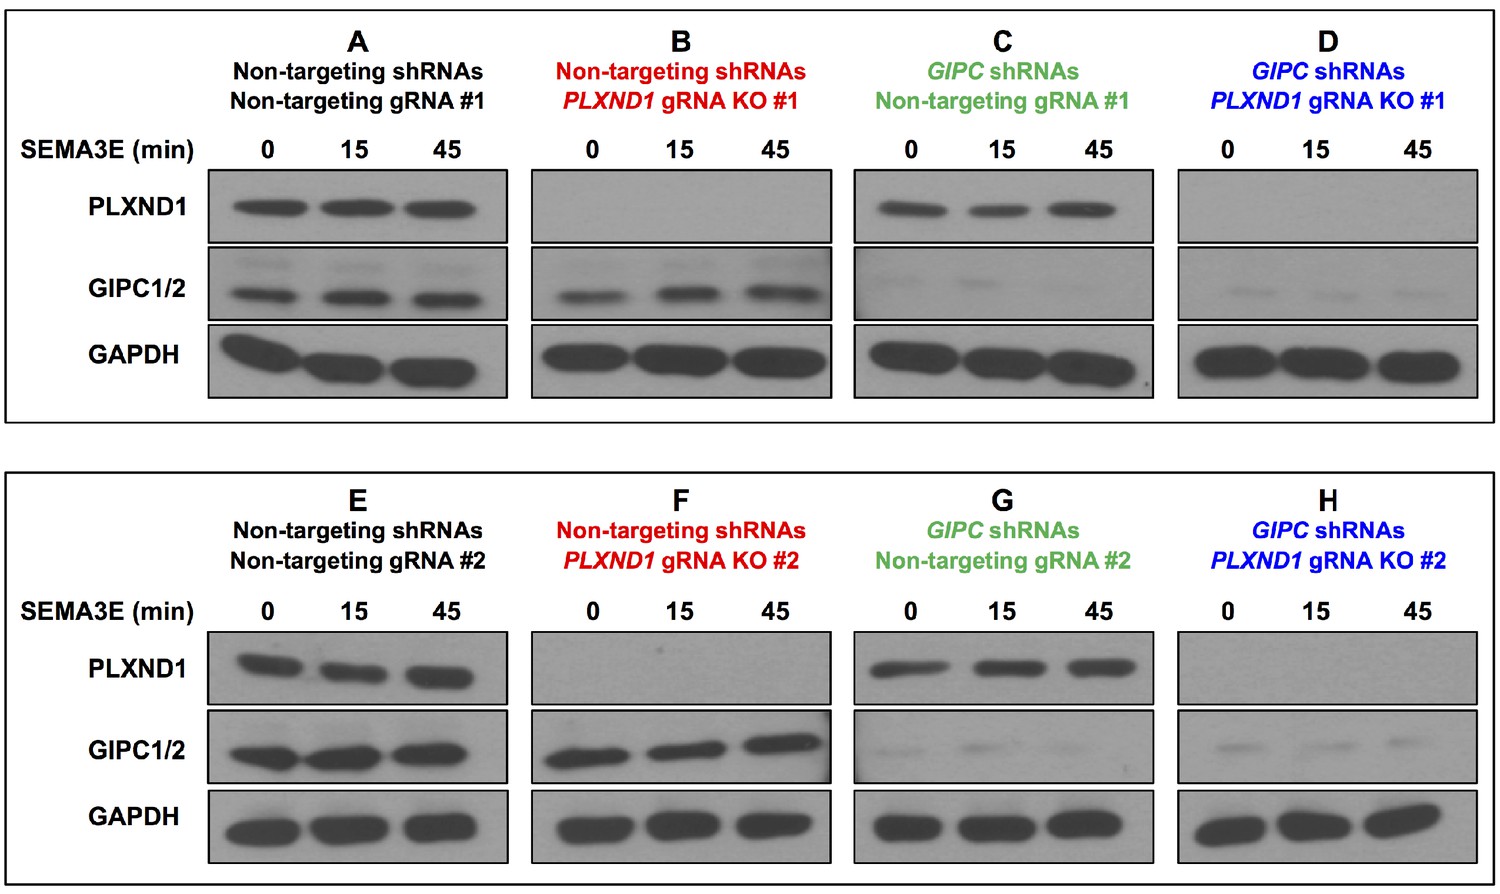
Efficient shRNA-mediated knockdown of GIPCs and CRISPR/Cas9-mediated knockout of PLXND1 in HUVEC/TERT2 cells.
(A–H) Western blots for GIPC1-2, PLXND1, and GAPDH (loading control) from TCLs of stable cells demonstrating the effective decrease of GIPC1-2 and PLXND1 levels. (A–D) TCLs from non-targeting gRNA#1 cells (A, C) and PLXND1 gRNA KO#1 cells (B, D) infected with the indicated shRNAs and under the different SEMA3E treatments. (E–H) TCLs from non-targeting gRNA#2 cells (E, G) and PLXND1 gRNA KO#2 cells (F, H) infected with the indicated shRNAs and under the different SEMA3E treatments. This figure is related to Figure 7 and Figure 7—figure supplement 1.
Figure 7—figure supplement 3
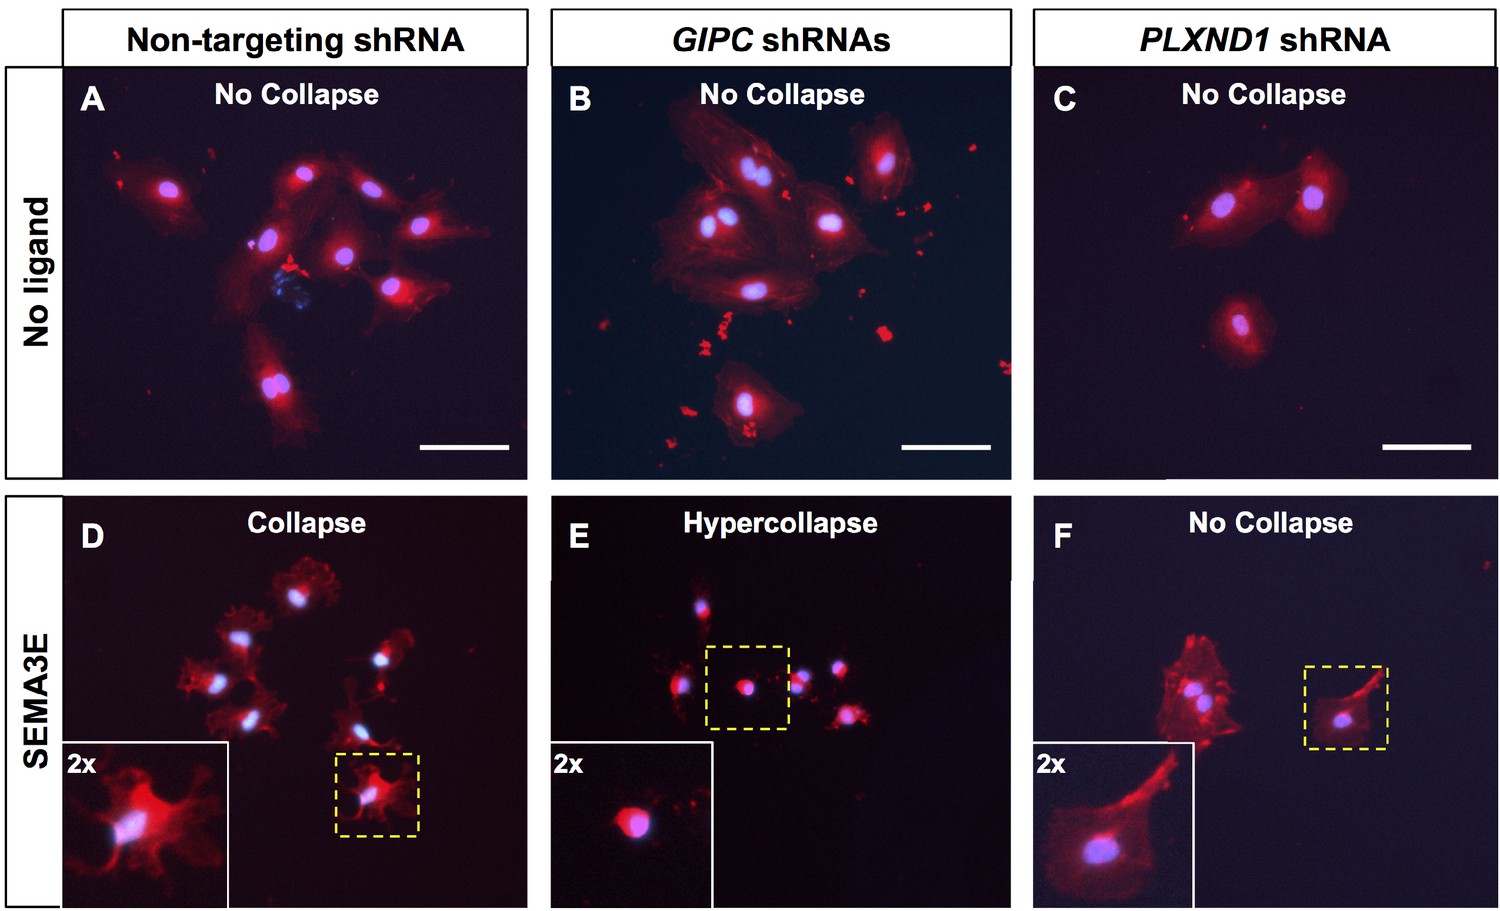
GIPC knockdowns potentiate the SEMA3E-induced/PLXND1-dependent cell collapse of primary HUVEC.
(A–F). Representative fluorescent images of HUVEC morphology in cell collapse experiments under the following conditions. No ligand (A–C; top) or 45 min stimulation with 10 nM of SEMA3E (D–F; bottom). In each picture, the square area marked by yellow dotted sides is shown at twice the magnification at the bottom left corner and delimited by white sides. shRNA treatments as follows. Non-targeting, control (A, D), GIPC (GIPC1, GIPC2, and GIPC3; B, E), and PLXND1 (C, F). Scale bars (white horizontal lines), 100 μm. (A–C) Without ligand stimulation cells are uncollapsed regardless of the knockdown condition. (D, E) Cell collapse under ligand stimulation. Cells treated with non-targeting, control shRNA collapse (D). GIPC knockdown cells hypercollapse (E). SEMA3E-induced collapse is PLXND1-dependent. PLXND1 knockdown abrogates the morphological response (F). Cell collapse data collected from three independent experiments. This figure is related to Figure 7—figure supplement 4.
Figure 7—figure supplement 4
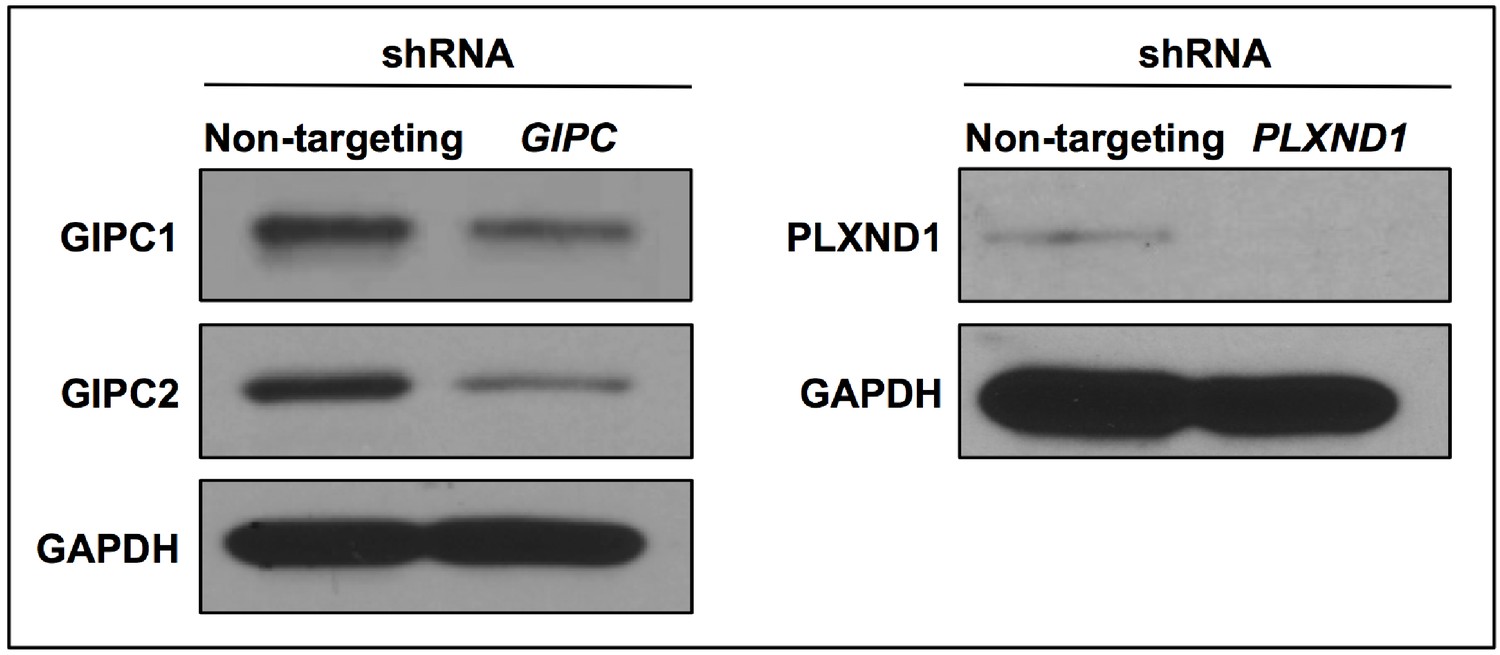
Efficient shRNA-mediated GIPC (GIPC1, GIPC2, and GIPC3) and PLXND1 knockdowns in primary HUVEC used for cell collapse experiments.
Western blots for GIPC1, GIPC2, PLXND1, and GAPDH (loading control) from TCLs of cells infected with the indicated shRNA lentiviral particles. Note the effective decrease of GIPC1-2 and PLXND1 levels. GIPC3 expression was absent under all the experimental conditions assayed. Hence, for brevity, the corresponding Western blots are not shown. This figure is related to Figure 7—figure supplement 3.
Tables
Key resources table
| Reagent type (species) or resource | Designation | Source or reference | Identifiers | Additional information |
|---|---|---|---|---|
| Genetic reagent (Danio rerio) | Tg(kdrl:HsHRAS-mCherry)s896 | DOI:10.1101/gad.1629408 | ZFIN ID: ZDB- ALT-081212–4 | Transgenic insertion |
| Genetic reagent (Danio rerio) | Tg(fli1a:EGFP)y1 | PMID:12167406 | ZFIN ID: ZDB- ALT-011017–8 | Transgenic insertion |
| Genetic reagent (Danio rerio) | Tg(fli1a:GAL4FF)ubs4 | DOI:10.1016/j.devcel. 2011.06.033 | ZFIN ID: ZDB- ALT-110921–1 | Transgenic insertion |
| Genetic reagent (Danio rerio) | Tg(flt1:nlsmCherry)skt7 | This paper | Transgenic insertion. Made using Torres-Vázquez lab plasmid #1208 | |
| Genetic reagent (Danio rerio) | gipc1skt1 | This paper | Putative null mutant allele | |
| Genetic reagent (Danio rerio) | gipc1skt2 | This paper | Putative null mutant allele | |
| Genetic reagent (Danio rerio) | gipc2skt3 | This paper | Putative null mutant allele | |
| Genetic reagent (Danio rerio) | gipc2skt4 | This paper | Putative null mutant allele | |
| Genetic reagent (Danio rerio) | gipc3skt5 | This paper | Putative null mutant allele | |
| Genetic reagent (Danio rerio) | plxnd1fov01b | PMID: 11861480 DOI:10.1016/j.devcel. 2004.06.008 | ZFIN ID: ZDB-ALT -010621–6 | Null mutant allele (point mutation) |
| Genetic reagent (Danio rerio) | plxnd1skt6 | This paper | Hypermorphic mutant allele | |
| Cell line (Cercopithecus aethiops) | COS-7 (Monkey Kidney Fibroblasts) | American Type Culture Collection | Cat. #CRL-1651. RRID:CVCL_0224 | https://www.atcc.org/products/All/CRL-1651.aspx |
| Cell line (Homo sapiens) | HUVEC/TERT2 (Immortalized Human Umbilical Vein Endothelial Cells) | American Type Culture Collection | Cat. #CRL-4053. RRID:CVCL_9Q53 | https://www.atcc.org/Products/All/CRL-4053.aspx |
| Cell line (Homo sapiens) | HUVEC (Normal Primary Human Umbilical Vein Endothelial Cells) | Lifeline Cell Technology | Cat. #FC-0003 | https://www.lifelinecelltech.com/shop/cells/human-endothelial-cells/umbilical-vein-endothelial-cells/huvec-fc-0003/ |
| Cell line (Homo sapiens) | Non-targeting gRNA1. Pool of HUVEC/TERT2 cells. | This paper | Derived from HUVEC/TERT 2 cell line (ATCC CRL4053). Cells were grown under blasticidin (4 μg/ml) selection and used between 7th and 10th passages. Cells stably coexpress Cas9 nuclease and non-targeting gRNA1 (from Torres-Vázquez lab plasmid #1859) | |
| Cell line (Homo sapiens) | Non-targeting gRNA2. Pool of HUVEC/TERT2 cells. | This paper | Derived from HUVEC/TERT 2 cell line (ATCC CRL4053). Cells were grown under blasticidin (4 μg/ml) selection and used between 7th-10th passages. Cells are stably coexpressing Cas9 nuclease and non- targeting gRNA2 (from Torres-Vázquez lab plasmid #1860) | |
| Cell line (Homo sapiens) | PLXND1 gRNA KO1. Monoclonal PLXND1 KO HUVEC/TERT2 cell line. | This paper | Biallelic (transheterozygous) PLXND1 knockout line. Derived from HUVEC/TERT 2 cell line (ATCC CRL4053). Cells were grown under blasticidin (4 μg/ml) selection and used between 7th-10th passages. Cells are stably coexpressing Cas9 nuclease and PLXND1 gRNA KO1 (from Torres-Vázquez lab plasmid #1846) | |
| Cell line (Homo sapiens) | PLXND1 gRNA KO2. Monoclonal PLXND1 KO HUVEC/TERT2 cell line. | This paper | Biallelic (transheterozygous) PLXND1 knockout line. Derived from HUVEC/TERT 2 cell line (ATCC CRL4053). Cells were grown under blasticidin (4 μg/ml) selection and used between 7th-10th passages. Cells are stably coexpressing Cas9 nuclease and PLXND1 gRNA KO2 (from Torres-Vázquez lab plasmid # 1847) | |
| Cell line (Homo sapiens) | HEK293T (embryonic kidney cells) | Matthias Stadtfeld lab, NYU | ||
| Recombinant DNA reagent | V5-C-mPLXND1WT | This paper | Torres-Vázquez lab plasmid #862. Vector backbone: pcDNA3.1/ nV5-DEST-V5 | |
| Recombinant DNA reagent | V5-C-mPLXND1ΔCYSEA | This paper | Torres-Vázquez lab plasmid #863. Vector backbone: pcDNA3.1/ nV5-DEST-V5 | |
| Recombinant DNA reagent | V5-C-mPLXND1ΔGBM | This paper | Torres-Vázquez lab plasmid #1774. Vector backbone: pcDNA3.1/ nV5-DEST-V5 | |
| Recombinant DNA reagent | FLAG-mGIPC1WT | DOI:10.1091/mbc.12.3.615 | Torres-Vázquez lab plasmid #864. Vector backbone: pFLAG-CMV1 | |
| Recombinant DNA reagent | FLAG-mGIPC1GH1 | DOI:10.1091/mbc.12.3.615 | Torres-Vázquez lab plasmid #868. Vector backbone: pFLAG-CMV2 | |
| Recombinant DNA reagent | FLAG-mGIPC1PDZ | DOI:10.1091/mbc.12.3.615 | Torres-Vázquez lab plasmid #866. Vector backbone: pFLAG-CMV3 | |
| Recombinant DNA reagent | 2xHA-Plxnd1WT | This paper | GAL4-responsive, Gateway and IRES-based bicistronic vector for Tol2- mediated zebrafish transgenesis. Torres-Vázquez lab plasmid #1414 | |
| Recombinant DNA reagent | 2xHA-Plxnd1ΔGBM | This paper | GAL4-responsive, Gateway and IRES-based bicistronic vector for Tol2-mediated zebrafish transgenesis. Torres-Vázquez lab plasmid #1685 | |
| Recombinant DNA reagent | lentiCRISPR v2-Blast | Addgene | Cat. #83480 | A gift from Mohan Babu. https://www.addgene.org/83480/ |
| Recombinant DNA reagent | Non-targeting gRNA1 | This paper | Torres-Vázquez lab plasmid #1859. Vector backbone: lentiCRISPR v2-Blast | |
| Recombinant DNA reagent | Non-targeting gRNA2 | This paper | Torres-Vázquez lab plasmid #1860. Vector backbone: lentiCRISPR v2-Blast | |
| Recombinant DNA reagent | PLXND1-KO1 | This paper | Torres-Vázquez lab plasmid #1846. Vector backbone: lentiCRISPR v2-Blast | |
| Recombinant DNA reagent | PLXND1-KO2 | This paper | Torres-Vázquez lab plasmid #1847. Vector backbone: lentiCRISPR v2-Blast | |
| Recombinant DNA reagent | Control shRNA Lentiviral Particles-A (Non-targeting control shRNA) | Santa Cruz Biotechnology | Cat. #sc-108080 | Encodes a non-targeting shRNA sequence, will not lead to the specific degradation of any known cellular mRNA |
| Recombinant DNA reagent | GIPC shRNA (h) Lentiviral Particles | Santa Cruz Biotechnology | Cat. #sc-35475-V | shRNA pool (three target-specific constructs against human GIPC1 that encode 19–25 nt (plus hairpin) shRNAs). Target sequences (sense sequences 5’ to 3’): (1) CUGACGAGUUCGUCUUUGA (2) CCACCACUUUCCACCAUCA (3) CUGAAUUUGCUGUCUUGAA |
| Recombinant DNA reagent | GIPC2 shRNA (h) Lentiviral Particles | Santa Cruz Biotechnology | Cat. # sc-75132-V | shRNA pool (three target-specific constructs against human GIPC2 that encode 19–25 nt (plus hairpin) shRNAs). Target sequences (sense sequences 5’ to 3’): (1) CAGACGAAUUUGUCUUUGA (2) GGACACCUUUACUAACUCU (3) CCAACUUUCUCUCUUUGUA |
| Recombinant DNA reagent | GIPC3 shRNA (h) Lentiviral Particles | Santa Cruz Biotechnology | Cat. #sc-62376-V | shRNA pool (three target-specific constructs against human GIPC3 that encode 19–25 nt (plus hairpin) shRNAs). Target sequences (sense sequences 5’ to 3’): (1) CCUUCAUCAAGAGAAUCAA (2) GGAGUUUGCACGCUGUUUA (3) GACAAGUUCCUCUCUAGAA |
| Recombinant DNA reagent | Plexin-D1 shRNA (h) Lentiviral Particles | Santa Cruz Biotechnology | Cat. #sc-45585-V | shRNA pool (three target-specific constructs against human PLXND1 that encode 19–25 nt (plus hairpin) shRNAs). Target sequences (sense sequences 5’ to 3’): (1) GUCAAGAUAGGCCAAGUAA (2) CCAUGAGUCUCAUAGACAA (3) CCACAGACAGUUUCAAGUA |
| Sequenced-based reagent | plxnd13207-3462 morpholino | DOI:10.1016/j.devcel. 2004.06.008 | Validated splice-blocking morpholino against zebrafish plxnd1. Synthesized by GENE TOOLS, LLC). Sequence (5’ to 3’): CACACACACTCACGTTGATGATGAG | |
| Antibody | Chicken anti-GFP | Invitrogen | Cat. #A10262 | IF (1:1,000); zebrafish |
| Antibody | Sheep anti-mCherry | Holger Knaut lab, NYU | IF (1:1,000); zebrafish. Custom made antibody | |
| Antibody | Mouse anti-pFAK Tyr397 | Millipore | Cat. #05–1140 | IF (1:1,000); zebrafish |
| Antibody | Rabbit anti-GIPC1 | Proteintech Group | Cat. #14822–1-AP. RRID:AB_2263269 | WB (1:3,000). This antibody detects GIPC1, GIPC2, and GIPC3 (our data) |
| Antibody | Rabbit anti-GIPC2 | Abcam | Cat. #ab175272 | WB (1:5,000). This antibody detects GIPC1 and GIPC2 (our data) |
| Antibody | Rabbit anti-GIPC3 | Abcam | Cat. #ab186426 | WB (1:5000). This antibody is specific for GIPC3 (our data). Validated against HeLa TCL (positive control; a gift from Mamta Tahiliani’s lab, NYU) |
| Antibody | Mouse anti-PLXND1 | R and D Systems | Cat. #MAB41601 Clone #752815 | WB (1:250). Lyophilized reagent reconstituted in 200 μl of sterile PBS (GIBCO, Cat. #10010–023) |
| Antibody | Rabbit anti-Phospho- p44/42 MAPK (Erk1/2) (Thr202/Tyr204) (D13.14.4E) XPTM | Cell Signaling Technology | Cat. #4370S. RRID:AB_2315112 | WB (1:20,000) |
| Antibody | Mouse anti-p44/42 MAPK (Erk1/2) (L34F12) | Cell Signaling Technology | Cat. #4696S | WB (1:10,000) |
| Antibody | Rabbit anti-GAPDH (D16H11) | Cell Signaling Technology | Cat. #5174P. RRID:AB_10622025 | WB (1:20,000) |
| Antibody | Mouse anti-FLAG M2 | SIGMA-ALDRICH | Cat. #F3165, clone M2. RRID:AB_259529 | WB (1:20,000) |
| Antibody | Rabbit anti-V5-Tag (D3H8Q) | Cell Signaling Technology | Cat. #13202S. RRID:AB_2687461 | WB (1:10,000) |
| Peptide, recombinant protein | Human Semaphorin 3E | R and D Systems | Cat. #3239-S3B | Working concentration of 2 nM (prepared in 1xPBS with 0.1%BSA (SIGMA_ALDRICH, Cat.A8022) |
| Chemical compound, drug | SU5416 | SIGMA-ALDRICH | Cat. #S8442 | Working concentration of 0.2 μM in fish water. From 10.5 mM stock solution in DMSO (SIGMA-ALDRICH, Cat. #D8418) |
| Chemical compound, drug | Gelatin, from porcine skin | SIGMA-ALDRICH | Cat. # G1890-100G | Working concentration of 0.1% (prepared in distilled water and then autoclaved) |
| Chemical compound, drug | Blasticidin S HCl, powder | ThermoFisher Scientific | Cat. #R21001 | From a stock solution of 10 mg/ml. Prepared in UltraPure Distilled water (Invitrogen Cat. # 10977–015) |
| Chemical compound, drug | Puromycin Dihydrochloride | ThermoFisher Scientific | Cat. #A1113803 | From a stock solution of 10 mg/ml |
Additional files
-
Supplementary file 1
Miscellaneous tables listing the following information.
Vectors for expressing PLXND1 and GIPC proteins/fragments, primers for genotyping Tg(fli1a:GAL4FF)ubs4 zebrafish, oligos for assembling DNA templates for in vitro transcription of gRNAs for zebrafish genome editing and for making lentiCRISPRv2-Blast vectors for Cas9 and gRNA coexpression for use in HUVEC, cognate sequences of WT alleles and mutant alleles generated in this study via genome editing, and primers for genotyping mutant alleles generated in this study via genome editing. Related to Figures 1–7, Figure 2—figure supplement 1, Figure 2—figure supplement 2, Figure 4—figure supplement 1, Figure 4—figure supplement 2, Figure 5—figure supplement 1, Figure 7—figure supplement 1 and, Figure 7—figure supplement 2.
- https://doi.org/10.7554/eLife.30454.021
-
Supplementary file 2
Tables of the raw and average densitometry values of tagged proteins in Western blots of CoIP experiments and their statistical significances.
Related to Figure 1.
- https://doi.org/10.7554/eLife.30454.022
-
Supplementary file 3
Tables of the plxnd1skt6 complementation of plxnd1fov01b (related to Figure 2C–E), the comparison of the vascular phenotypes of homozygous WT and homozygous plxnd1skt6 mutant siblings (related to Figure 2F–I, Figure 2—figure supplement 1), and the mosaic transgenic endothelial expression of tagged forms of zebrafish Plxnd1 in plxnd1fov01b null mutants (related to Figure 2—figure supplement 2J).
- https://doi.org/10.7554/eLife.30454.023
-
Supplementary file 4
Tables comparing the Se-DLAV truncations of wild-type embryos and plxnd1skt6 mutants (at 32 hpf) in animals treated with DMSO and SU5416. Related to Figure 3E and Figure 3—figure supplement 1.
- https://doi.org/10.7554/eLife.30454.024
-
Supplementary file 5
Tables comparing the Se truncations of wild-type embryos and gipc mutants at 32 hpf.
Related to Figure 4B and Figure 4—figure supplement 3.
- https://doi.org/10.7554/eLife.30454.025
-
Supplementary file 6
Tables comparing the Se-DLAV truncations of gipc1skt1 (MZ) and gipc1skt1 (MZ); plxnd1fov01/+ mutants at 32 hpf.
Related to Figure 5C and Figure 5—figure supplement 1.
- https://doi.org/10.7554/eLife.30454.026
-
Supplementary file 7
Tables of raw and average densitometry values for both pERK and ERKTotal, relative ERK activities and the statistical significances of the latter. Related to Figure 7E and Figure 7—figure supplement 1.
- https://doi.org/10.7554/eLife.30454.027
-
Supplementary file 8
Protein sequences. Related to Figure 1, Figure 2A–B, Figure 4—figure supplement 1, Figure 7—figure supplement 2, Supplementary file 1 (see ‘Vectors for expressing PLXND1 and GIPC proteins/fragments’ and ‘Cognate sequences of WT alleles and mutant alleles generated in this study via genome editing’), and Supplementary file 2.
- https://doi.org/10.7554/eLife.30454.028
-
Transparent reporting form
- https://doi.org/10.7554/eLife.30454.029
Download links
A two-part list of links to download the article, or parts of the article, in various formats.
Downloads (link to download the article as PDF)
Open citations (links to open the citations from this article in various online reference manager services)
Cite this article (links to download the citations from this article in formats compatible with various reference manager tools)
GIPC proteins negatively modulate Plexind1 signaling during vascular development
eLife 8:e30454.
https://doi.org/10.7554/eLife.30454


