LRP1 regulates peroxisome biogenesis and cholesterol homeostasis in oligodendrocytes and is required for proper CNS myelin development and repair
- University of Michigan School of Medicine, United States
- University of Michigan Medical School, United States
- University of Rochester Medical Center, United States
Figures
Figure 1 with 2 supplements
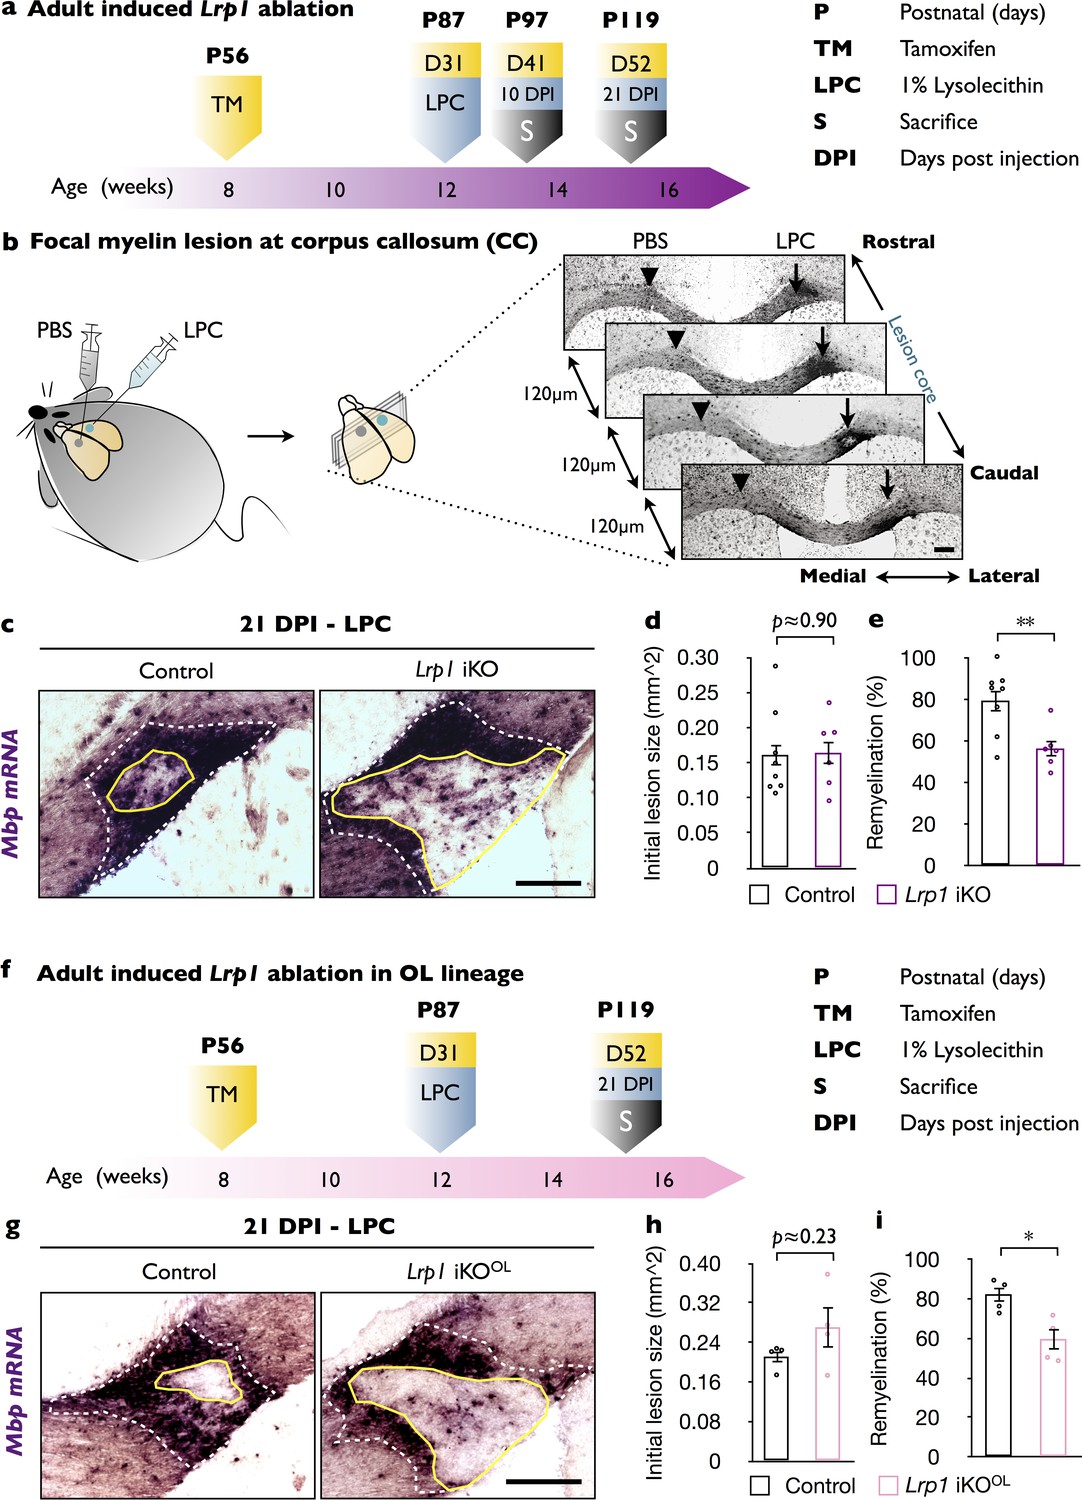
In adult mice, global and OL-lineage selective ablation of Lrp1 attenuates white matter repair.
(a) Timeline in weeks indicating when Lrp1 ablation was induced (Lrp1flox/flox;CAG-CreERTM, Lrp1 iKO), lysolecithin (LPC) injected, and animals sacrificed. (b) Cartoon showing unilateral injection of LPC in the corpus callosum (CC) and PBS into the contralateral side. Coronal brain sections (series of 6, each 120 µm apart) probed for Mbp by in situ hybridization (ISH). Brain sections containing the lesion center were identified and subjected to quantification. (c) Coronal brain sections through the CC 21 days post LPC injection (21 DPI). The outer rim of the lesion area (lesionout) is demarcated by the elevated Mbp signal (white dashed line). The non-myelinated area of the lesion is defined by the inner rim of elevated Mbp signal (lesionin) and delineated by a solid yellow line. Scale bar = 200 µm. (d) Quantification of the initial lesion size (lesionout) in Lrp1 control (n = 8) and iKO (n = 6) mice. (e) Quantification of white matter repair in Lrp1 control (n = 8) and iKO (n = 6) mice. The extent of repair was calculated as the percentile of (lesionout - lesionint)/(lesionout) x 100. (f) Timeline in weeks showing when OL-lineage-specific Lrp1 ablation (Lrp1flox/flox;Pdgfra-CreERTM, Lrp1 iKOOL) was induced, LPC injected, and animals sacrificed. (g) Coronal brain sections through the CC at 21 days post LPC injection of Lrp1 control and iKOOL mice. The initial lesion area is demarcated by a white dashed-line. A solid yellow line delineates the non-myelinated area. Scale bar = 200 µm. (h) Quantification of the initial lesion size in Lrp1 control (n = 4) and iKOOL (n = 4) mice. (i) Quantification of white matter repair in Lrp1 control (n = 4) and iKOOL (n = 4) mice. Results are shown as mean ±SEM, *p<0.05, **p<0.01, and ***p<0.001, Student’s t-test. For a detailed statistical report, see Figure 1—source data 1.
-
Figure 1—source data 1
Raw data and detail statistical analysis report.
- https://doi.org/10.7554/eLife.30498.005
Figure 1—figure supplement 1
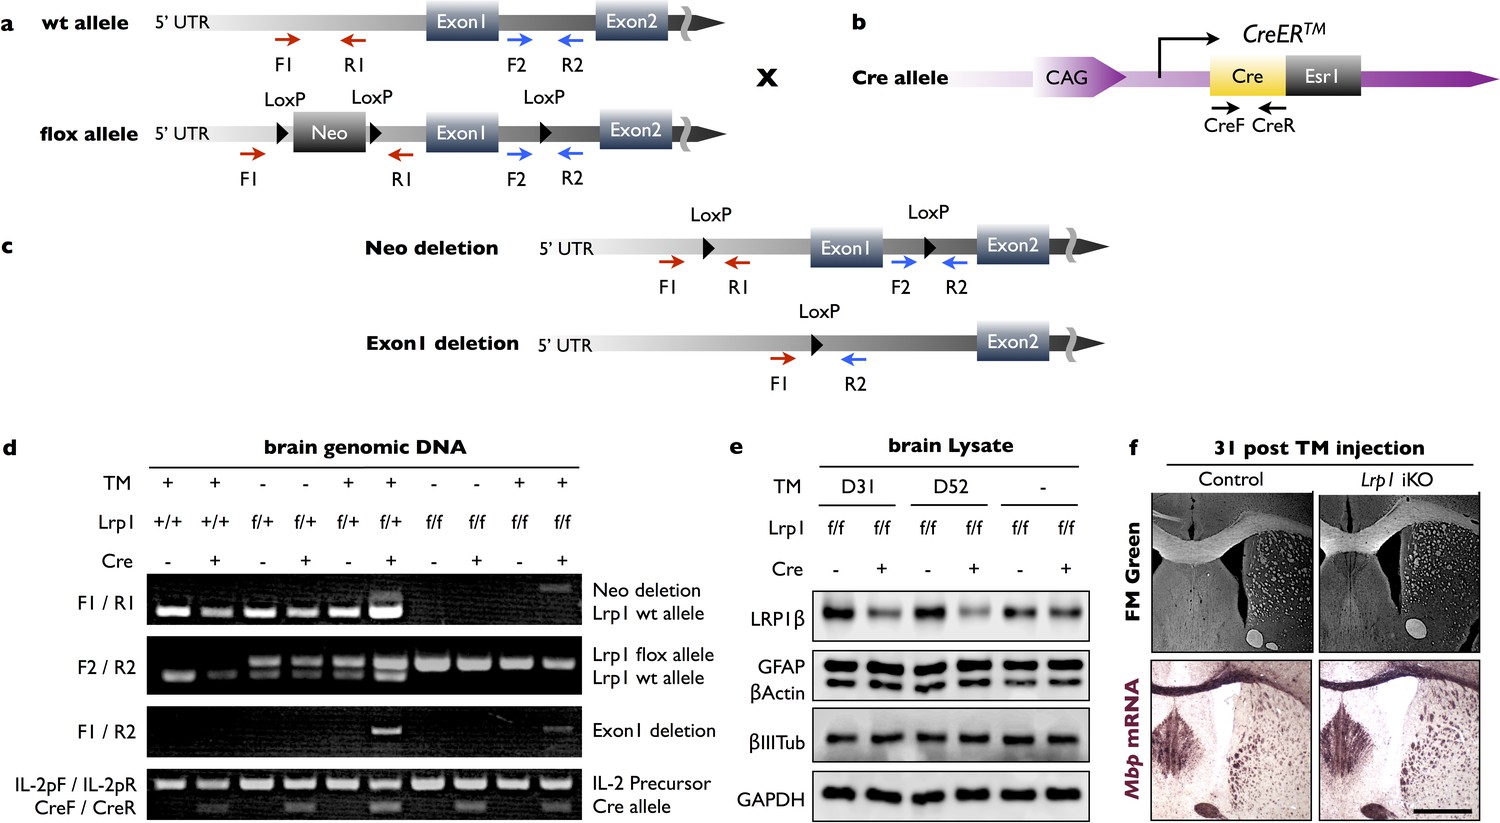
Generation of Lrp1 global iKO mice.
(a) Lrp1 wildtype (wt) and conditional, LoxP flanked (floxed), alleles. The location of PCR primers used for genotyping, the neomycin cassette (Neo), and LoxP sites are shown. (b) For global inducible gene ablation, the CAG-CreERTM mouse line was used, in which the Cre recombinase is fused with a tamoxifen (TM)-responsive estrogen receptor (Ers1) and expressed under the control of a ubiquitous chicken β-actin-CMV hybrid (CAG) promoter. (c) Following TM administration, recombination can lead to deletion of Neo only or deletion of Neo and exon 1. (d) PCR genotyping of brain genomic DNA. Analysis of PCR products amplified from of Lrp1+/+ mice with (+) or without (-) the cre allele; Lrp1flox/+ mice ± Cre allele and ±TM treatment; Lrp1flox/flox mice ± Cre allele and ±TM treatment. The F1/R1 primer pair amplifies a ~300 bp PCR product from the wt Lrp1 allele and a ~400 bp PCR product if the Neo cassette is deleted. The F2/R2 primer pair amplifies a 291 bp PCR product from wt Lrp1 allele and a 350 bp PCR product from Lrp1 flox allele. The F1/R2 primer pair amplifies a ~500 bp PCR product if exon1 in deleted. The IL-2pF/IL-2pR primer pair amplifies a 324 bp fragment and served as internal PCR quality control. The CreF/CreR primer pair amplifies a ~200 bp PCR product if Cre is present. (e) Immunoblots of whole brain lysates prepared from Lrp1flox/flox;CAG-CreERTM mice 31 and 52 days after TM (+) or vehicle (-) treatment. Representative blots probed with anti-LRP1β, anti-GFAP, anti-β-actin, anti-β-III tubulin, and anti-GAPDH. (f) Coronal-sections of adult Lrp1 control and iKO mice 31 days after i.p. TM administration. Sections were stained with FM Green or probed for Mpb mRNA by in situ hybridization. Scale bar = 1 mm.
Figure 1—figure supplement 2
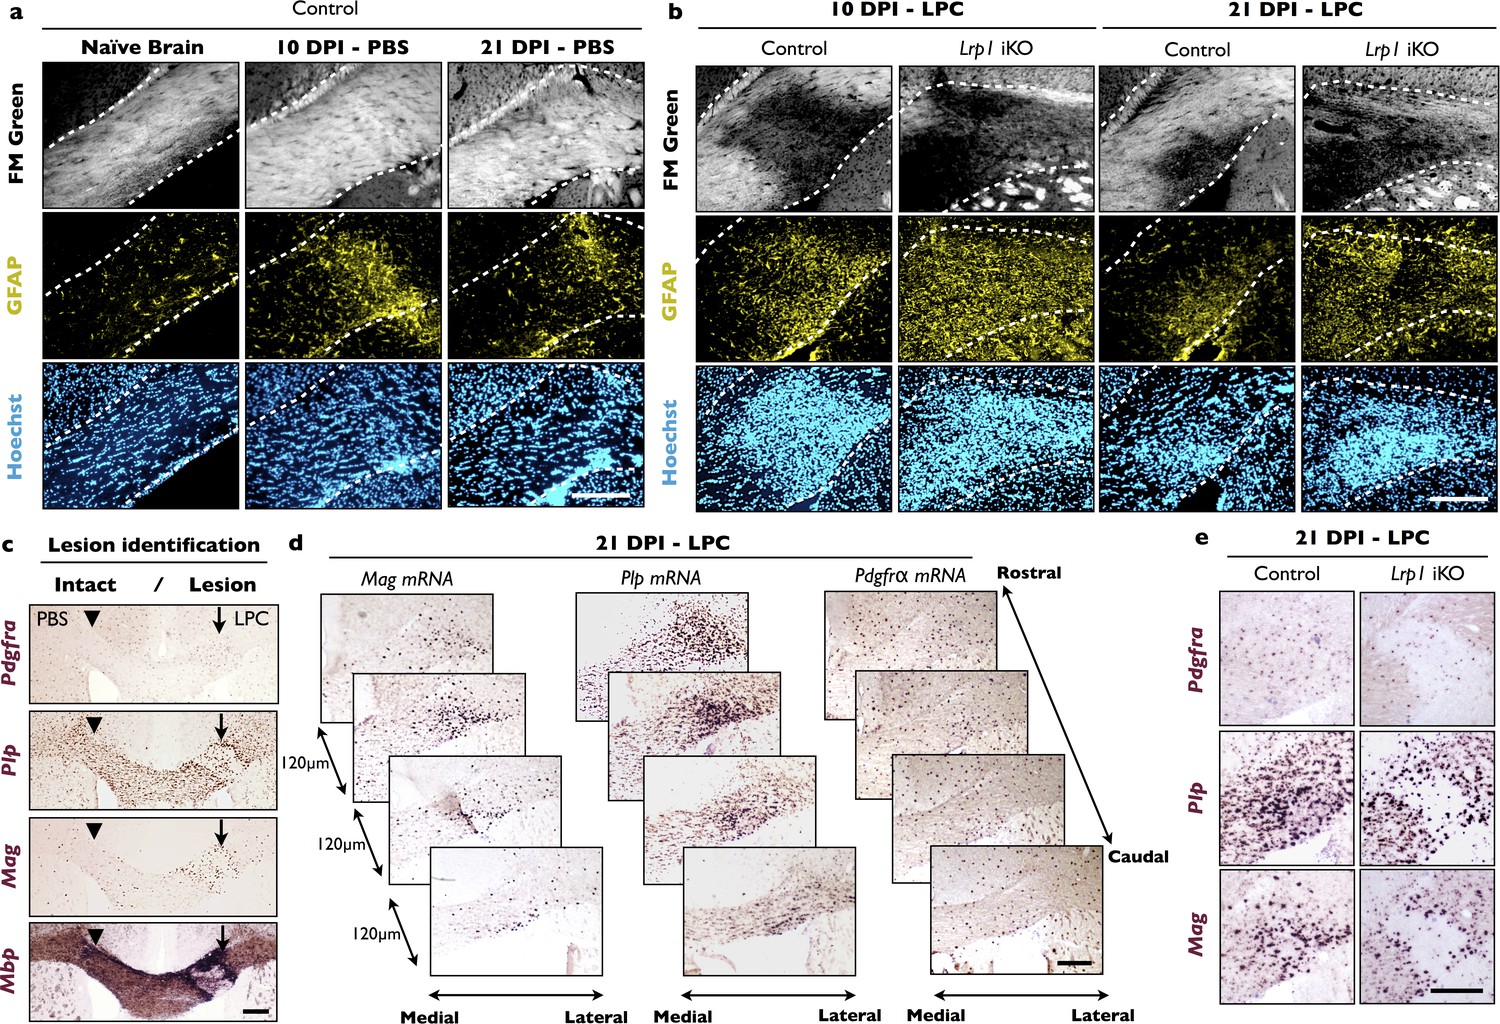
LPC injection into the corpus callosum leads to focal white matter damage and upregulation of myelin-associated gene products.
(a) Coronal forebrain sections of adult Lrp1 control (naive) mice and mice subjected to stereotaxic injection of PBS into the corpus callosum. At 10 days post injection (10 DPI) and 21 DPI of PBS, brains were collected, serially sectioned, and stained with FM Green, anti-GFAP and Hoechst dye33342. The white dotted lines demarcate the corpus callosum. The injection site is readily identified by the elevated GFAP immunoreactivity. (b) Coronal forebrain sections of Lrp1 control and iKO mice at 10 DPI and 21 DPI of LPC stained with FM Green, anti-GFAP, and Hoechst dye33342. White dotted lines demarcate the corpus callosum. The white matter lesion is identified by the absence of FM Green labeling. Scale bar = 200 µm. (c) Serial coronal-sections of adult brain after PBS and LPC injection in the corpus callosum, probed for Pdgfra, Plp1, Mag, and Mbp mRNA expression to identify the lesion area and to examine gene expression changes in the OL lineage. The site injected with PBS is marked by an arrowhead and the LPC injection site is marked by an arrow. The lesion boarder shows elevated staining for Plp1, Mag and Mbp. Scale bar = 200 µm. (d) Serial brain sections of adult Lrp1 control mice injected with LPC at 21 DPI. Serial sections through the lesion area (120 µm apart) were probed for Mag, Plp1, and Pdgfra, mRNA expression. Scale bar = 200 µm. (e) Coronal brain sections through the CC including the lesion center of Lrp1 control and Lrp1 iKO mice injected with LPC at 21 DPI. Serial sections were probed for Pdgfra, Plp1, and Mag mRNA expression. Scale bar = 200 µm.
Figure 2 with 2 supplements
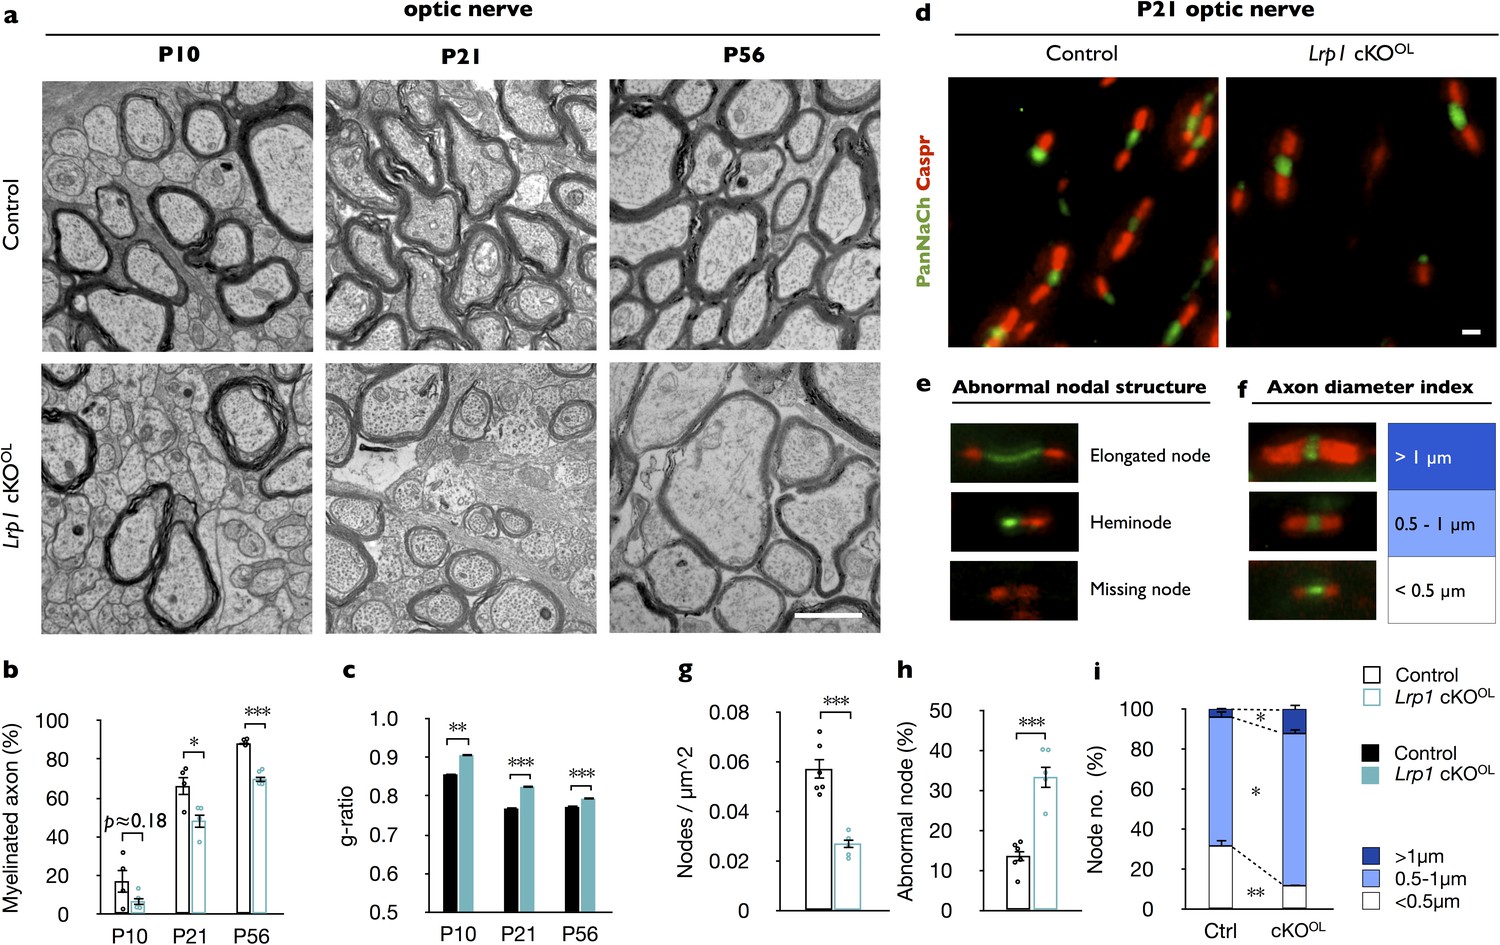
Lrp1 ablation in the OL-lineage leads to hypomyelination and nodal defects.
(a) Ultrastructural images of optic nerve cross-sections from P10, P21, and P56 control and Lrp1flox/flox;Olig2-Cre conditional knockout mice (Lrp1 cKOOL). Scale bar = 1 µm. (b) Quantification of myelinated axons in the optic nerve of Lrp1 control and cKOOL mice at P10, P21 and P56 (n = 4 mice per genotype for each three time point). (c) Averaged g-ratio of Lrp1 control and cKOOL optic nerve fibers from four mice per genotype for each of the three time points. At P10, n = 488 myelinated axons for control and n = 261 for cKOOL; at P21, n = 1015 for control and n = 997 for cKOOL; at P56, n = 1481 for control and n = 1020 for cKOOL mice. (d) Nodes of Ranvier in P21 optic nerves of Lrp1 control and cKOOL mice were labeled by anti-PanNaCh (green, node) and anti-Caspr (red, paranode) staining. Scale bar = 1 µm. (e) Nodal defects detected include elongated node, heminode, and missing node (Na+ channels absent). (f) Representative nodal staining categorized by axon diameter. (g) Quantification of nodal density in P21 Lrp1 control (n = 6) and cKOOL (n = 5) optic nerves. (h) Quantification of abnormal nodes of Ranvier in Lrp1 control (n = 6) and cKOOL (n = 5) optic nerves. (i) Quantification of nodes associated with large (>1 μm), intermediate (0.5–1 μm), and small caliber fibers (<0.5 μm) in Lrp1 control (n = 6) and cKOOL (n = 5) optic nerves. Results are shown as mean ±SEM, *p<0.05, **p<0.01, and ***p<0.001, Student’s t-test. For a detailed statistical report, see Figure 2—source data 1.
-
Figure 2—source data 1
Raw data and detail statistical analysis report.
- https://doi.org/10.7554/eLife.30498.009
Figure 2—figure supplement 1
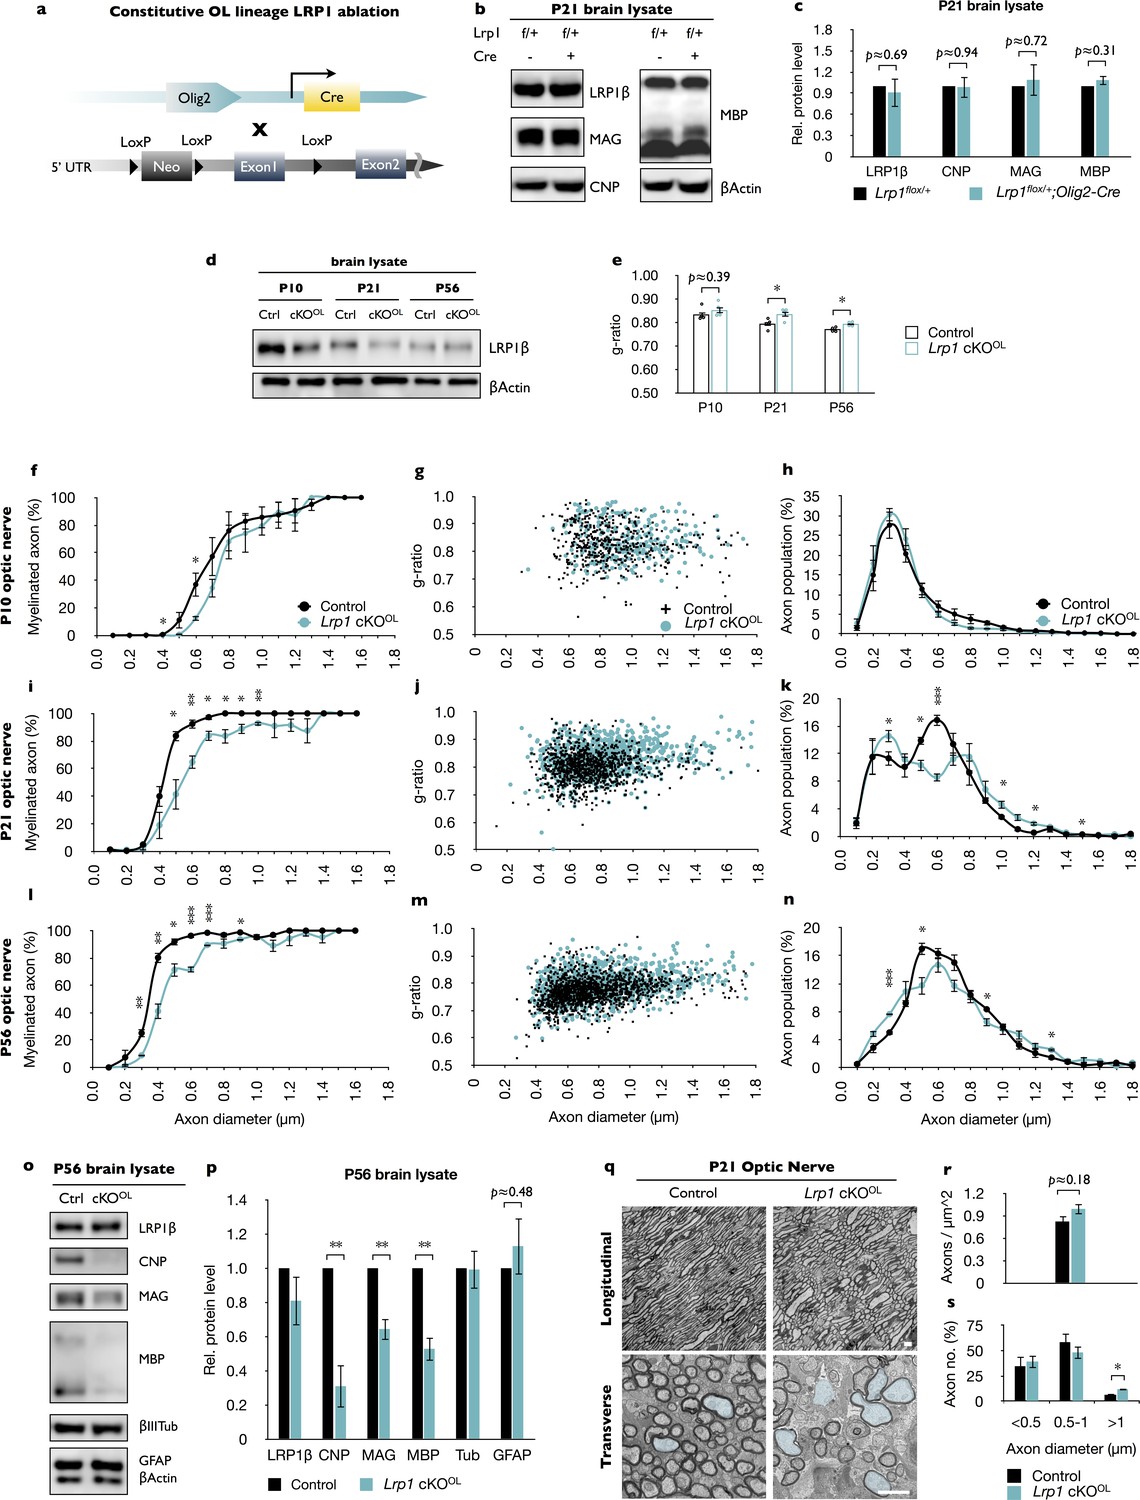
Lrp1 ablation in the OL lineage leads to CNS hypomyelination.
(a) Lrp1flox/flox mice were crossed with Olig2-Cre mice to conditionally ablate Lrp1 in OL lineage (cKOOL). (b) To ensure that the presence of the Olig2-Cre allele does not lead to altered expression of myelin-associated proteins or LRP1, P21 brains of Lrp1flox/+ and Lrp1flox/+;Olig2-Cre mice were lysed and subjected to SDS-PAGE. Representative Western blots probed with anti-LRP1β, anti-MAG, anti-CNP, anti-MBP, and anti-β-actin are shown. (c) Quantification of protein levels detected by Western blotting of Lrp1flox/+ (n = 3) and Lrp1flox/+;Olig2-Cre (n = 3) brain lysates revealed no differences in the presence or absence of the Olig2-Cre allele. (d) Immunoblotting of whole brain lysates prepared from P10, P21, and P56 of Lrp1 control (Ctrl) and cKOOL mice. Representative blots probed with anti-LRP1β and anti-β-Actin. (e) Average g-ratio of myelinated optic nerve axons of Lrp1 control and cKOOL mice, n = 4 mice per genotype for each of the three time points. (f, i, and l) Graphs show the percentage of myelinated axons in the optic nerve at P10, P21 and P56 as a function of axon caliber in Lrp1 control (n = 4 for each time point) and cKOOL (n = 4 for each time point) mice. Axon calibers were binned into nine groups of 0.2 μm intervals, ranging from 0.1 to 1.7 μm. (g, j, and m) Scatter plot showing the distribution of g ratios for individual fibers in the optic nerve at P10, P21, and P56 of Lrp1 control and cKOOL mice. P10, n = 488 axons from Lrp1 control mice and n = 261 axons from cKOOL mice; P21, n = 1015 axons from Lrp1 control mice and n = 997 axons from 4 cKOOL mice; P56, n = 1481 axons from Lrp1 control mice and n = 1020 axons from 4 cKOOL mice. (h, k, and n) Morphometric assessment of axon caliber distribution in P10, P21, and P56 optic nerves of Lrp1 control (n = 4) and cKOOL (n = 4) mice. Measurements of axon diameter were made from electron microscopy images. (o) Immunoblotting of whole brain lysates prepared from P56 Lrp1 control (Ctrl) and cKOOL mice. Representative blots probed with anti-LRP1β, anti-CNP, anti-MAG, anti-MBP, anti-β-III tubulin, anti-GFAP, and anti-β-actin. (p) Quantification of protein levels detected by Western blotting of Lrp1 control (n = 3) and cKOOL (n = 3) brain lysates. (q) Electron microscopy images of optic nerve cross- and longitudinal-sections acquired from P21 Lrp1 control and cKOOL mice. Axons that are >1 μm in diameter are colored in light blue. Scale bar = 1 μm. (r) Quantification of axon density in the P21 optic nerve for Lrp1 control (n = 4) and cKOOL (n = 4) mice. (s) Quantification of optic nerve axons smaller than <0.5 µm, between 0.5–1.0 µm and larger than 1 µm in Lrp1 control (n = 4) and cKOOL (n = 4) mice. Results are presented as the mean ±SEM, *p<0.05, **p<0.01, and ***p<0.001, Student’s t-test. For a detailed statistical report, see Figure 2—source data 1.
Figure 2—figure supplement 2
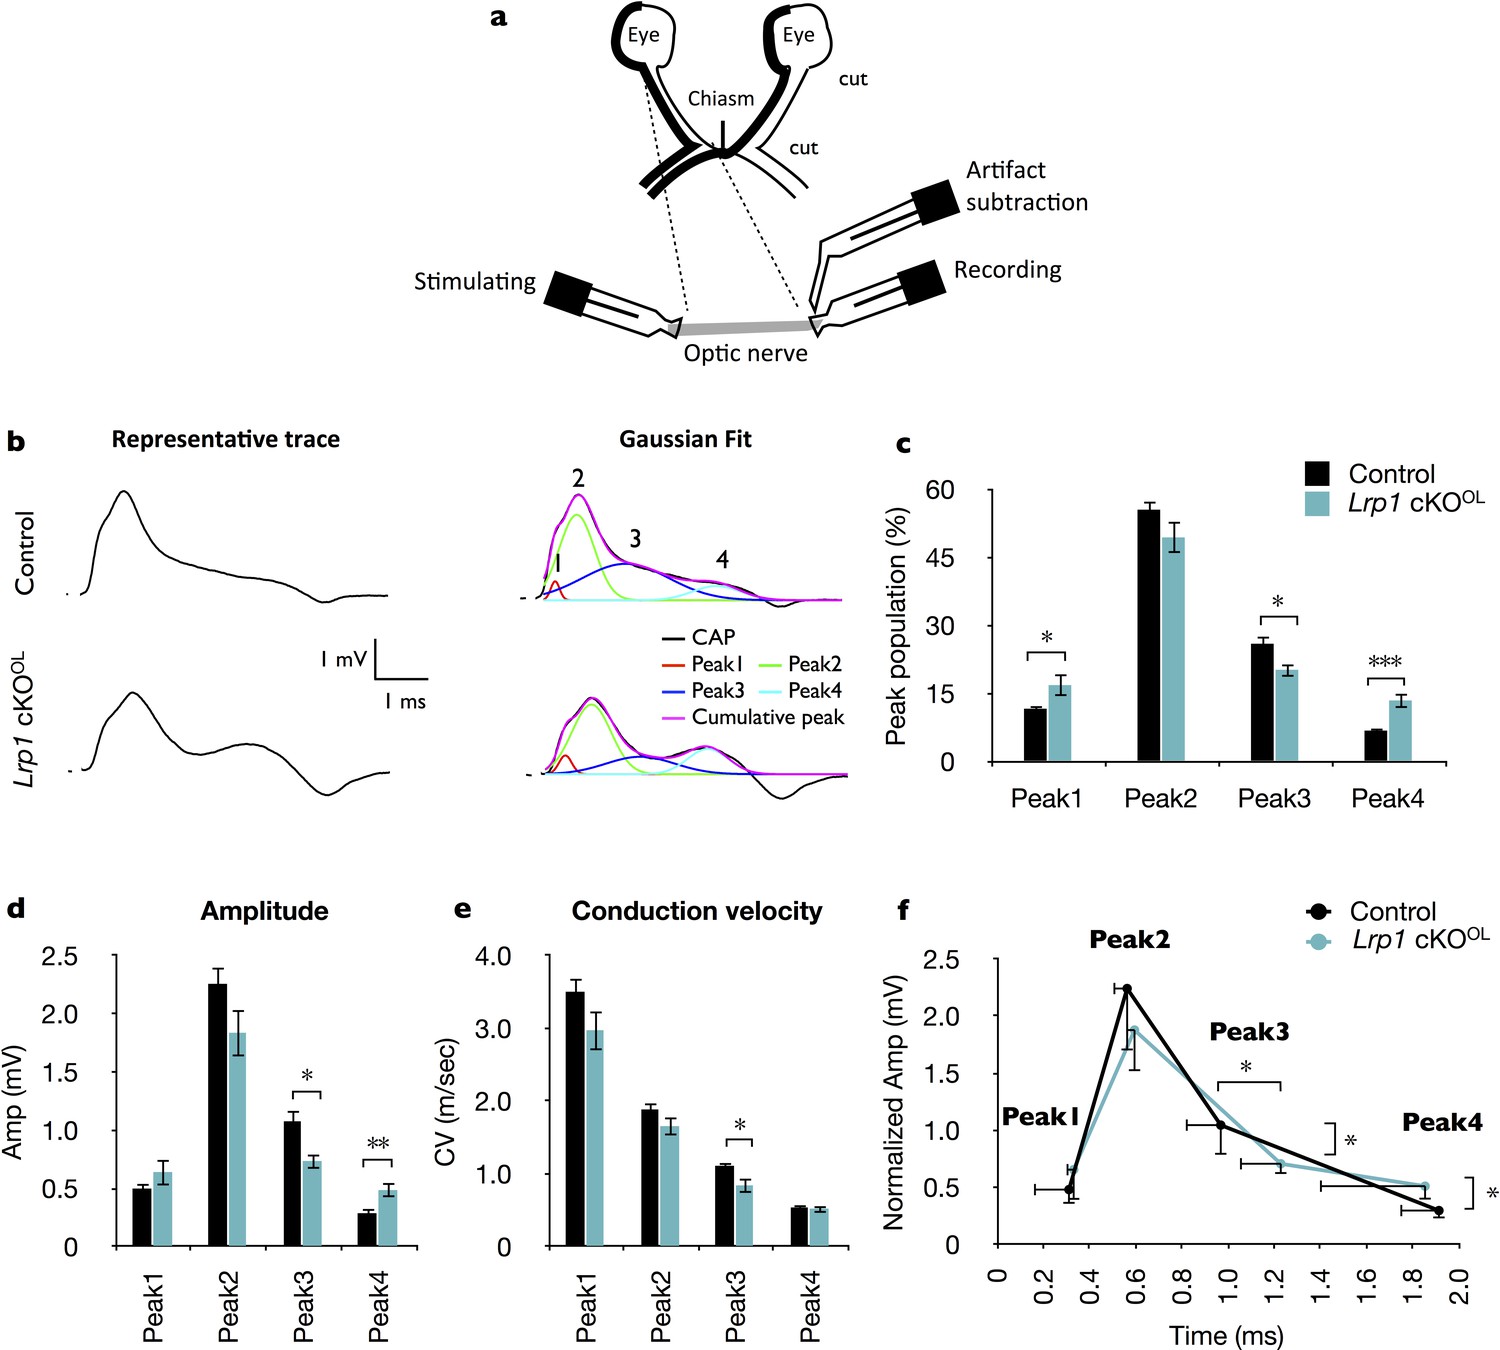
Loss of Lrp1 in the OL lineage leads to faulty optic nerve conduction.
(a) Scheme depicting the orientation of an optic nerve prepared for compound action potential (CAP) recordings. Positions of the stimulating electrode, the recording electrode, and artifact subtraction electrode are shown. (b) Left: representative raw CAP traces of P21 optic nerves. Right: For each recording, traces were fitted with four Gaussians representing peak 1 (red), peak 2 (green), peak 3 (blue), peak 4 (cyan), and the sum of the four peaks (magenta). (c) The distribution of peak populations in Lrp1 control and cKOOL mice. (d) Quantification of amplitudes (mV) of peaks 1, 2, 3, and 4 in Lrp1 control and cKOOL optic nerves. (e) Quantification of conduction velocities (m/sec) of peaks 1, 2, 3, and 4 in Lrp1 control and cKOOL optic nerves. (f) Reconstituted averaged peaks 1–4 amplitude as a function of time. Lrp1 control (n = 21 nerves/14 mice) and cKOOL (n = 9 nerves/7 mice). Results are presented as the mean ±SEM, *p<0.05, **p<0.01, and ***p<0.001, Student’s t-test. For a detailed statistical report, see Figure 2—source data 1.
Figure 3 with 1 supplement
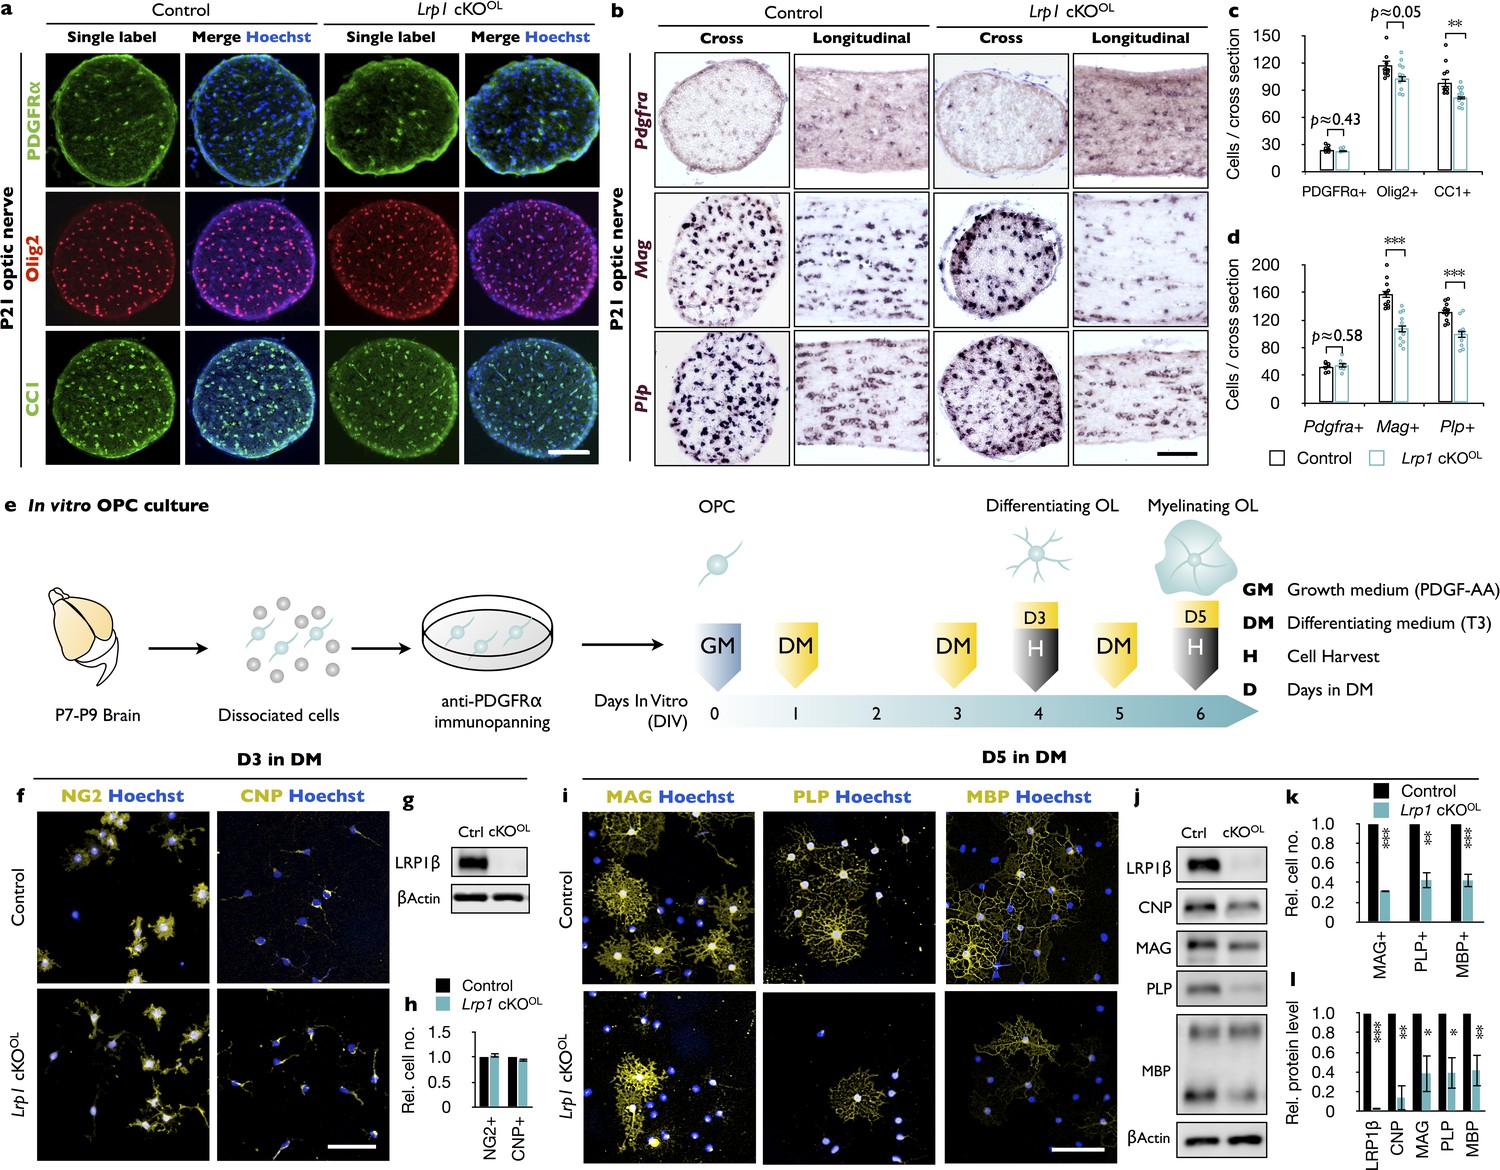
Loss of Lrp1 in the OL-lineage attenuates OL differentiation.
(a) Cross-sections of Lrp1 control and cKOOL optic nerves stained with anti-PDGFRα (OPC marker), anti-Olig2 (pan-OL marker), anti-CC1 (mature OL marker), and Hoechst dye33342. Scale bar = 100 µm. (b) Cross- and -longitudinal sections of Lrp1 control and cKOOL optic nerves probed for Pdgfra, Mag, and Plp mRNA expression. Scale bar = 100 µm. (c) Quantification of labeled cells per nerve cross-section. Anti-PDGFRα in control (n = 8) and cKOOL (n = 6) mice; anti-Olig2 and anti-CC1 in control (n = 11) and cKOOL (n = 12) mice. (d) Quantification of labeled cells per nerve cross-section. Pdgfra, control (n = 8) and cKOOL (n = 6) mice; Mag, control (n = 11) and cKOOL (n = 11) mice; Plp, control (n = 11) and cKOOL (n = 10) mice. (e) Workflow for OPC isolation and culturing with timeline when growth medium (GM) or differentiation medium (DM) was added and cells were harvested. (f) OPC/OL cultures after 3 days in DM stained with anti-NG2 (premyelinating marker), anti-CNP (differentiating OL marker), and Hoechst dye33342. Scale bar = 100 µm. (g) Immunoblot of OL lysates prepared from Lrp1 control and cKOOL cultures after 3 days in DM probed with anti-LRP1β and anti-β-actin. (h) Quantification of NG2+ (n = 3) and CNP+ (n = 3) cells in Lrp1 control and cKOOL cultures. (i) Control and Lrp1 deficient OL cultures after 5 days in DM stained with anti-MAG, anti-PLP, and anti-MBP. Scale bar = 100 µm. (j) Immunoblotting of OL lysates prepared from Lrp1 control and cKOOL cultures after 5 days in DM probed with anti-LRP1β, anti-CNP, anti-MAG, anti-PLP, anti-MBP, and anti-β-actin. (k) Quantification of MAG+, PLP+, and MBP+ cells in Lrp1 control (n = 3) and cKOOL (n = 3) cultures. (l) Quantification of protein levels in OL lysates detected by immunoblotting. Anti-LRP1, CNP, and PLP, n = 3 per condition; anti-MAG, n = 4 per condition; anti-MBP n = 5 per condition. Results are shown as mean values ± SEM, *p<0.05, **p<0.01, and ***p<0.001, Student’s t-test. For a detailed statistical report, see Figure 3—source data 1.
-
Figure 3—source data 1
Raw data and detail statistical analysis report.
- https://doi.org/10.7554/eLife.30498.012
Figure 3—figure supplement 1
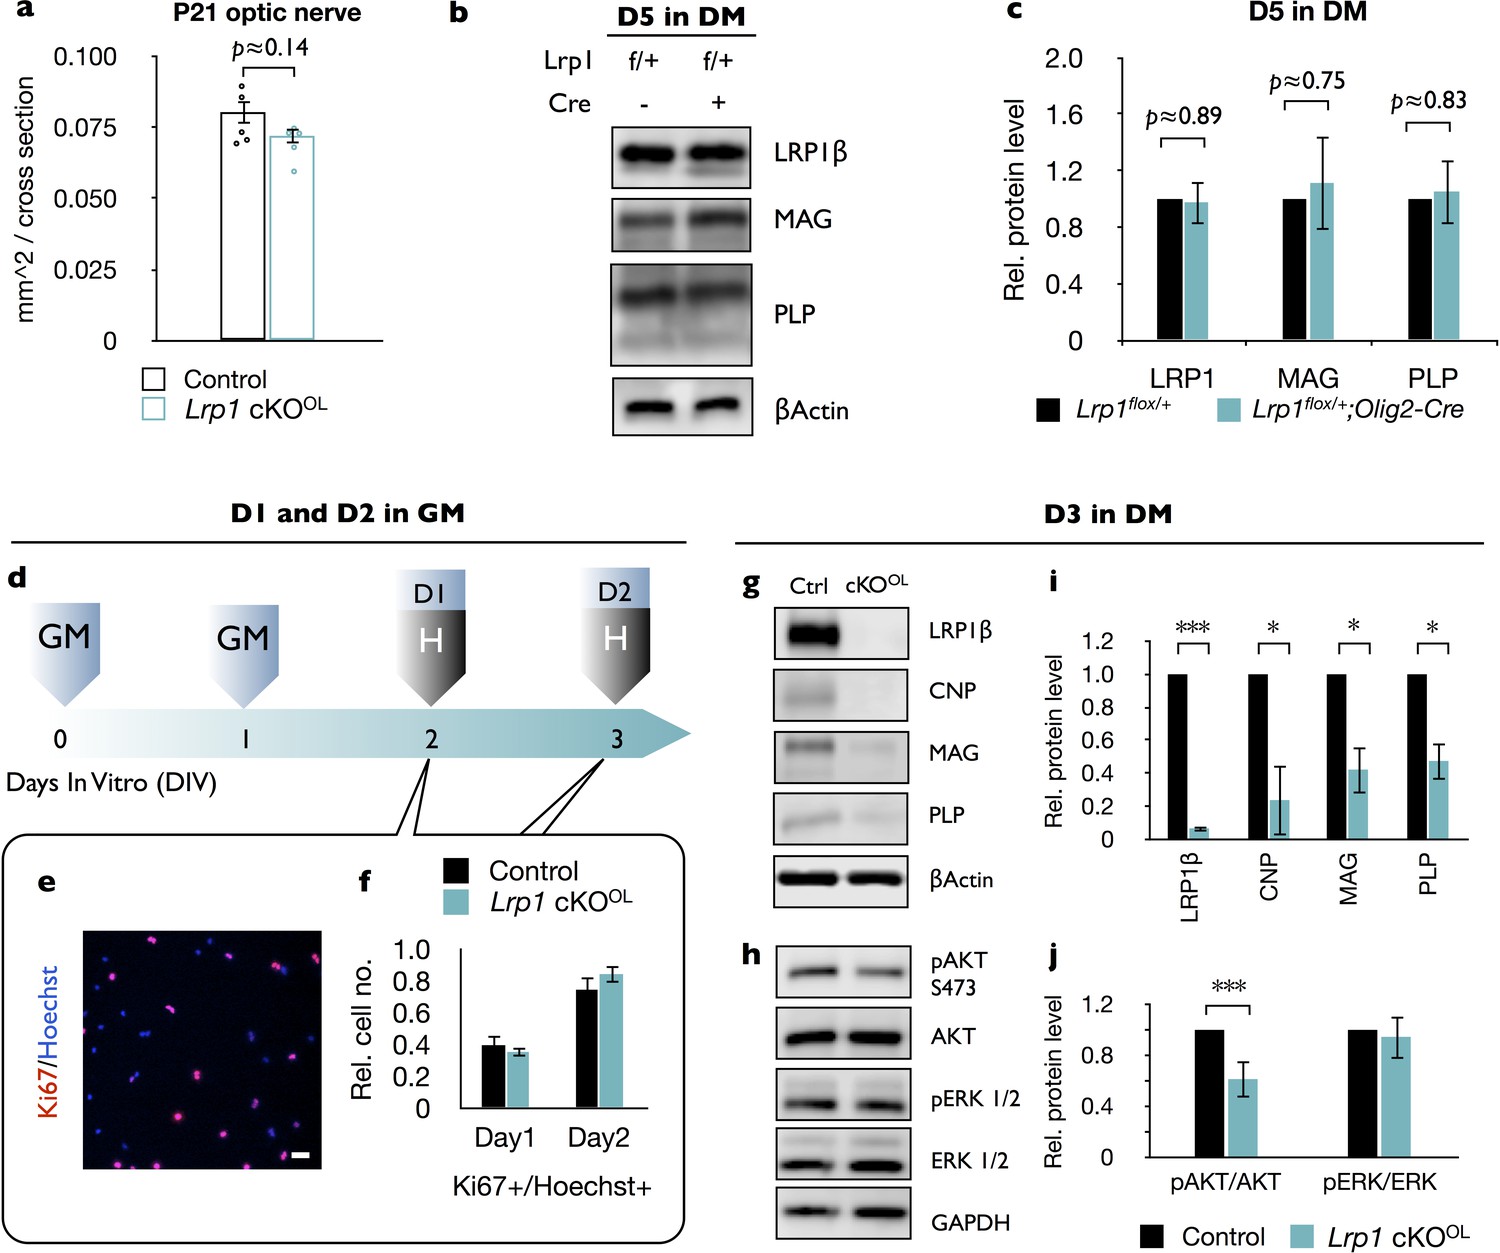
Loss of Lrp1 does not alter optic nerve size and OPC proliferation.
(a) Quantification of optic nerve diameter in Lrp1 control (n = 5) and cKO (n = 5) mice. (b) To ensure that the presence of the Olig2-Cre allele does not lead to altered expression of myelin-associated proteins or LRP1, in primary OPCs/OLs prepared from Lrp1flox/+ or Lrp1flox/+;Olig2-Cre pups, cells were lysed and subjected to Western blot analysis. OPCs/OLs were cultured for 5 days in differentiation medium (DM). Cell lysates were separated by SDS-PAGE and protein blots probed with anti-LRP1β, anti-CNP, anti-MAG, anti-PLP and anti-β-actin. Equal amounts of total protein were loaded per lane. (c) Quantification of LRP1, MAG, and PLP protein levels detected by immunoblotting of Lrp1flox/+ and Lrp1flox/+;Olig2-Cre OPC/OL culture lysates (n = 3 per genotype) revealed no differences in the presence or absence of the Olig2-cre allele. (d) Timeline in days indicating when growth medium (GM) was added to cells and when cells were harvested (H) to assess proliferation. (e) OPC/OL culture after 1 or 2 days in GM stained with anti-Ki67 (proliferation marker) and Hoechst dye33342. Scale bar = 100 µm. (f) Quantification of cell proliferation in OPC/OL cultures prepared from Lrp1 control and cKOOL mice. The percentile of Ki67+/Hoechst+ cells was calculated on day 1 for Lrp1 control (n = 5) and cKOOL (n = 5) cultures and on day 2 for Lrp1 control (n = 4) and cKOOL (n = 4) cultures. (g) Immunoblots of cell lysates prepared from Lrp1 control and cKOOL OPC/OL cultures after 3 days in differentiation medium (DM). Blots were probed with anti-LRP1β, anti-CNP, anti-MAG, anti-PLP, and anti-β-actin. (h) Immunoblots of lysates prepared from Lrp1 control and cKOOL OPC/OL cultures after 3 days in DM. Representative blots were probed with anti-pAKT (S473), anti-AKT, anti-pERK (1/2), anti-ERK (1/2), and anti-GAPDH. (i) Quantification of protein levels detected by immunoblotting of Lrp1 control and cKOOL cell culture lysate. Anti-LRP1β (n = 3), anti-MAG (n = 3), anti-CNP (n = 4) and anti-PLP (n = 4) per genotype. (j) Quantification of protein levels detected by immunoblotting of Lrp1 control and cKOOL cell lysates. pAKT/AKT, n = 5 for Lrp1 control and cKOOL cultures; pERK/ERK, n = 3 for Lrp1 control and cKOOL cultures. Results are presented as the mean ±SEM, *p<0.05, **p<0.01, and ***p<0.001, Student’s t-test. For a detailed statistical report, see Figure 3—source data 1.
Figure 4 with 1 supplement

Free cholesterol is reduced in OPCs deficient for Lrp1.
(a) OPCs were isolated from P8 brains by anti-PDGFRα immunopanning, sonicated and subjected to measurement of cholesterol (Chol). (b and c) Quantification of free Chol (b) and total Chol (Chol and Chol ester) (c) in OPCs isolated from Lrp1 control (n = 5) and cKOOL (n = 5) mouse pups. (d) Lrp1 control and cKOOL OLs after 5 days in DM stained with filipin and anti-MBP. Scale bar = 10 µm. (e–g) Quantification of OL size in µm2 (e), the intensity of filipin and MBP labeling per cell (f), and the intensity of filipin and MBP staining per µm2 (g). For Lrp1 control and cKOOL OLs, n = 29 cells from three mice in each group. (h) Timeline in days showing when growth medium (GM) or differentiation medium (DM) with (+) or without (-) Chol was added and when cells were harvested. (i and k) Immunoblotting of OL lysates prepared from Lrp1 control and cKOOL cultures after 3 days in DM. Representative blots were probed with anti-LRP1β, anti-SREBP2, anti-β-actin, anti-PLP, anti-MAG, anti-CNP, and anti-GAPDH. (j, l–n) Quantification of SREBP2 (j), PLP (l), MAG (m), and CNP (n) in Lrp1 control and cKOOLcultures ± bath applied Chol. Number of independent immunoblots: anti-PLP and MAG, n = 3 per condition; anti-SREBP2 and anti-CNP, n = 4 per condition. (o) Immunoblotting of OL lysates prepared from Lrp1 control and cKOOL cultures after 5 days in DM ±bath applied Chol. Representative blots were probed with anti-LRP1β, anti-PLP/DM20, and anti-β-actin. (p) Quantification of PLP (n = 4 per condition) in Lrp1 control and cKOOLcultures ± bath applied Chol (q) Immunostaining of OLs after 5 days in DM ±bath applied Chol. Primary OLs stained with anti-MBP and Hoechst dye33342. Scale bar = 100 µm. (r) Quantification showing relative number of MBP+ cells in Lrp1 control and cKOOL cultures (n = 3–5 per condition). Results are shown as mean values ± SEM, *p<0.05, **p<0.01, and ***p<0.001, 2-way ANOVA, post hoc t-test. For a detailed statistical report, see Figure 4—source data 1.
-
Figure 4—source data 1
Raw data and detail statistical analysis report.
- https://doi.org/10.7554/eLife.30498.015
Figure 4—figure supplement 1
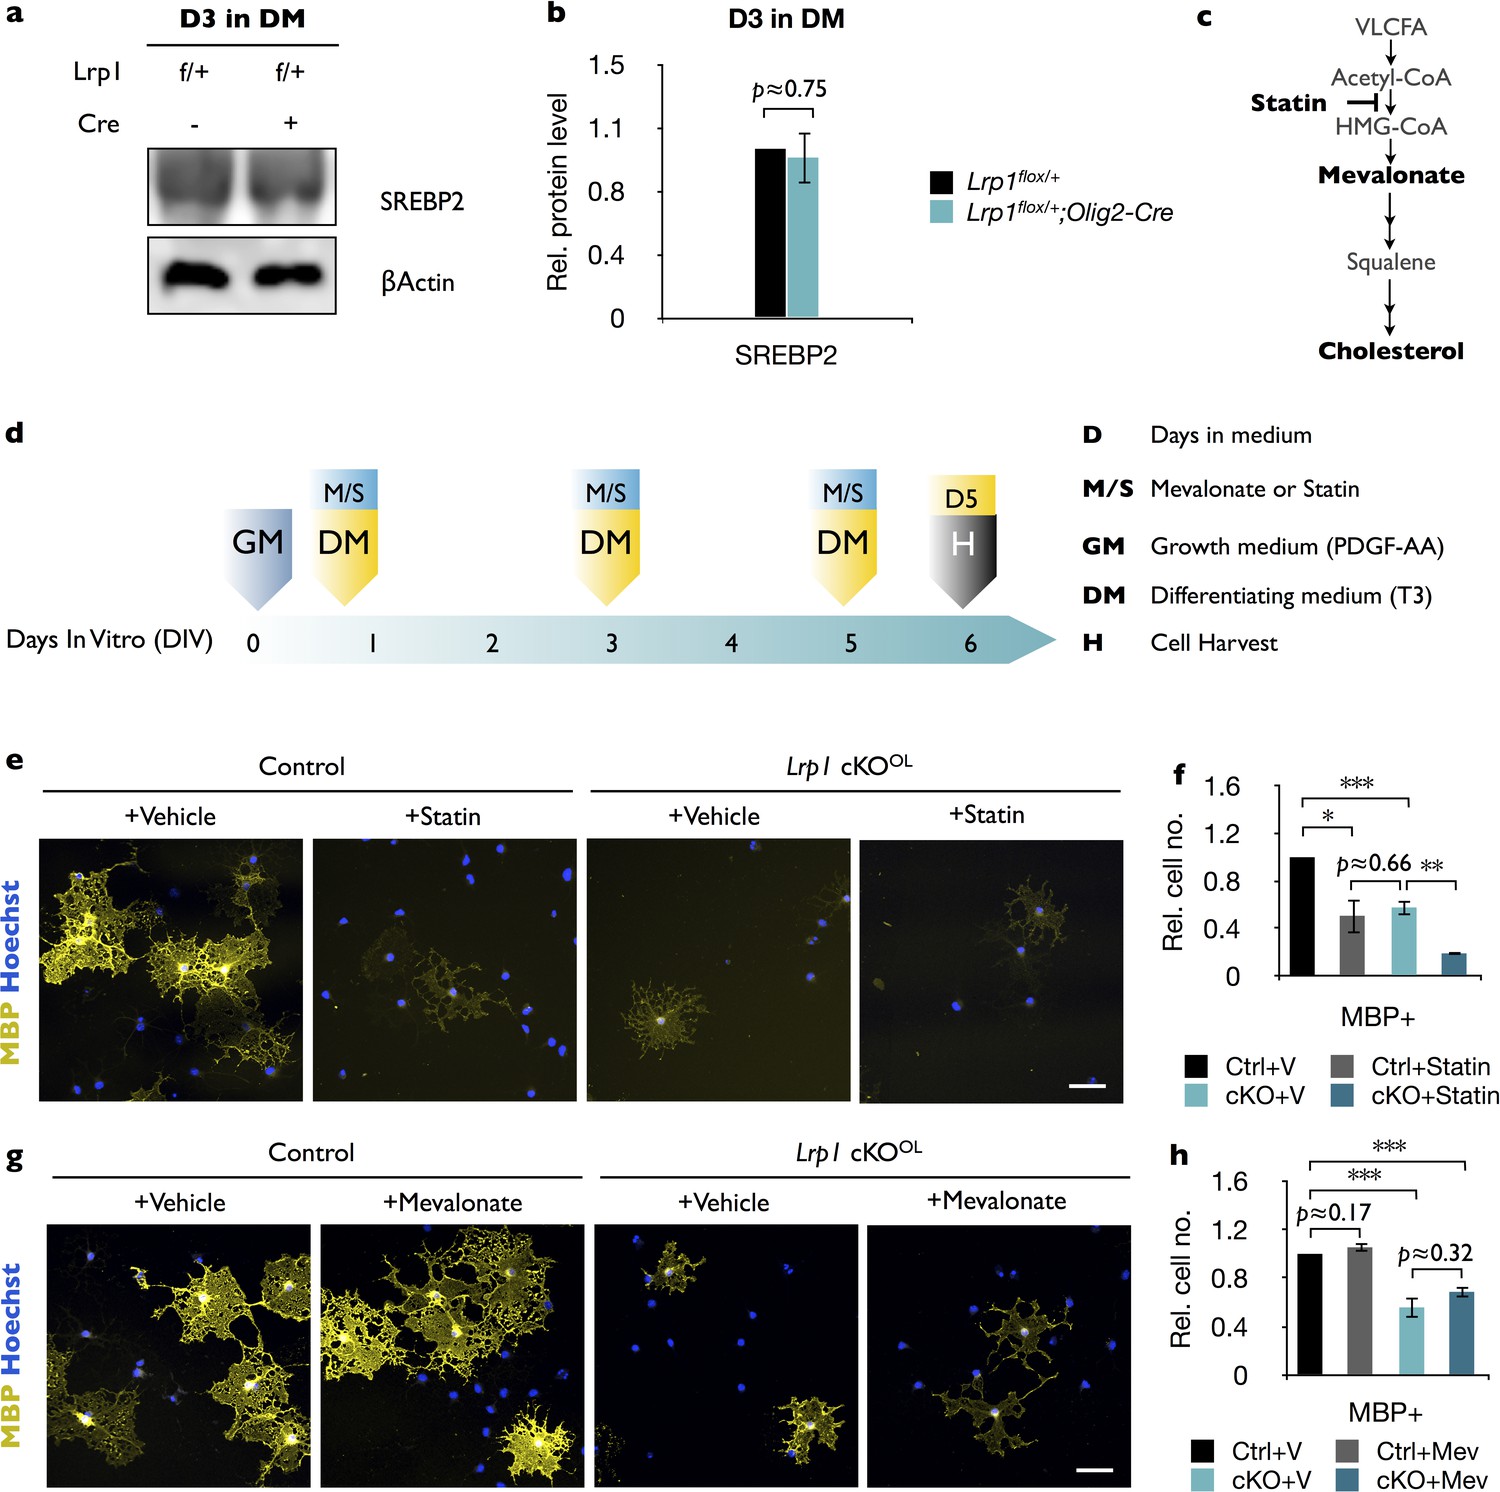
Lrp1-deficient OLs are sensitive to statin treatment but not to bath applied mevalonate.
(a) Primary OPCs were isolated by anti-PDGFRα immunopanning from Lrp1flox/+ and Lrp1flox/+;Olig2-Cre pups and cultured for 3 days in differentiation medium (D3 in DM). Cells were lysed and subjected to immunoblotting with anti-SREBP2 and anti-β-actin. (b) Quantification of SREBP2 protein levels in cell lysates of Lrp1flox/+ (n = 4) and Lrp1flox/+;Olig2-Cre (n = 4) cultures revealed comparable levels. This demonstrates that the presence or absence of the Olig2-Cre allele does not affect SREBP2 levels. (c) Cholesterol biosynthetic pathway and site of action of statins (simvastatin), which function as inhibitors of 3-hydroxy-3methyl-glutaryl-coenzyme A reductase (HMG-CoA), the rate controlling enzyme of the mevalonate pathway. (d) Timeline in days showing when growth medium (GM) and differentiation medium (DM), either containing simvastatin or mevalonate (M/S) were added to cultures and when cells were harvested (H) for immunofluorescence labeling. (e) Immunostaining of control and Lrp1-deficient OL cultures after 5 days in DM treated with vehicle or statin. Cell cultures were labeled with anti-MBP and Hoechst dye33342. Scale bar = 50 µm. (f) Quantification of MBP+ cells in Lrp1 control cultures treated with vehicle (n = 4), Lrp1 control cultures treated with statin (n = 3), Lrp1 cKOOL cultures treated with vehicle (n = 4), and Lrp1 cKOOL cultures treated with statin (n = 3). (g) Immunostaining of control and Lrp1 deficient OL cultures after 5 days in DM treated with vehicle or mevalonate. Cell cultures were labeled with anti-MBP and Hoechst dye33342. Scale bar = 50 µm. (h) Quantification of MBP+ cells in Lrp1 control cultures treated with vehicle (n = 3), Lrp1 control cultures treated with mevalonate (n = 3), Lrp1 cKOOL cultures treated vehicle (n = 3), and Lrp1 cKOOL cultures treated with mevalonate (n = 3). Results are shown as mean values ± SEM, *p<0.05, **p<0.01, and ***p<0.001, 2-way ANOVA, post hoc t-test. For a detailed statistical report, see Figure 4—source data 1.
Figure 5 with 1 supplement
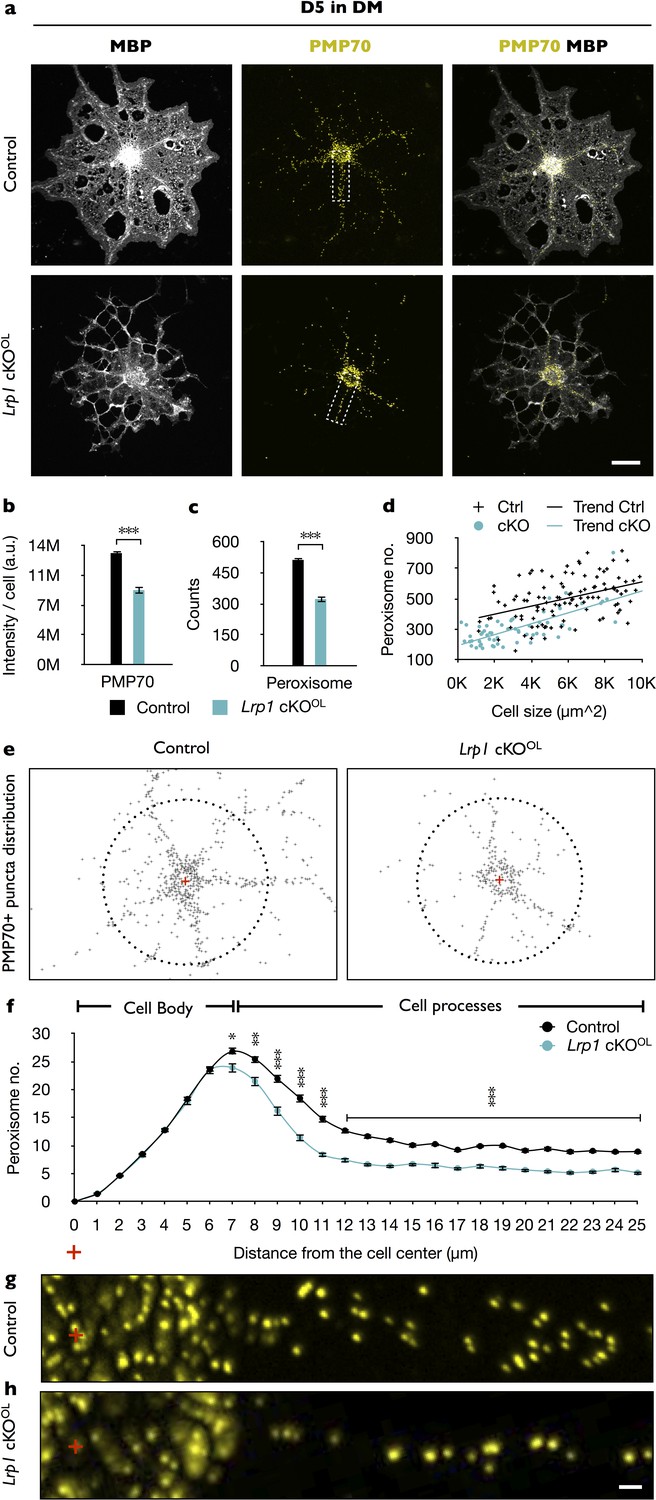
In primary OLs, peroxisome density and distribution is regulated by Lrp1.
(a) Primary OLs prepared from Lrp1 control and cKOOL OL pups, cultured for 5 days in DM were stained with anti-MBP and anti-PMP70. Scale bar = 10 µm. (b–d) Quantification of PMP70 labeling intensity per cell (b), PMP70+ puncta per cell (c), and scatter plot showing the number of PMP70+ peroxisomes as a function of cell size for MBP+ OLs of Lrp1 control and Lrp1 cKOOL cultures (d). For Lrp1 control OLs, n = 112 cells from three mice. For Lrp1 cKOOL OLs, n = 60 cells from three mice. (e) Representative distribution of PMP70+ puncta of Lrp1 control and cKOOL OL. For quantification, the center of the cell was marked with a red cross. Puncta within a 25 µm radius from the center (dashed circle) were subjected to quantification. (f) Quantification of peroxisome number plotted against the distance from the center of Lrp1 control (n = 113 cells, three mice) and cKOOL (n = 63 cells, three mice) OLs. (g and h) Representative high-magnification views of PMP70+ puncta from areas boxed in panel (a). Scale bar = 1 µm. Results are shown as mean values ± SEM, *p<0.05, **p<0.01, and ***p<0.001, Student’s t-test. For a detailed statistical report, see Figure 5—source data 1.
-
Figure 5—source data 1
Raw data and detail statistical analysis report.
- https://doi.org/10.7554/eLife.30498.018
Figure 5—figure supplement 1
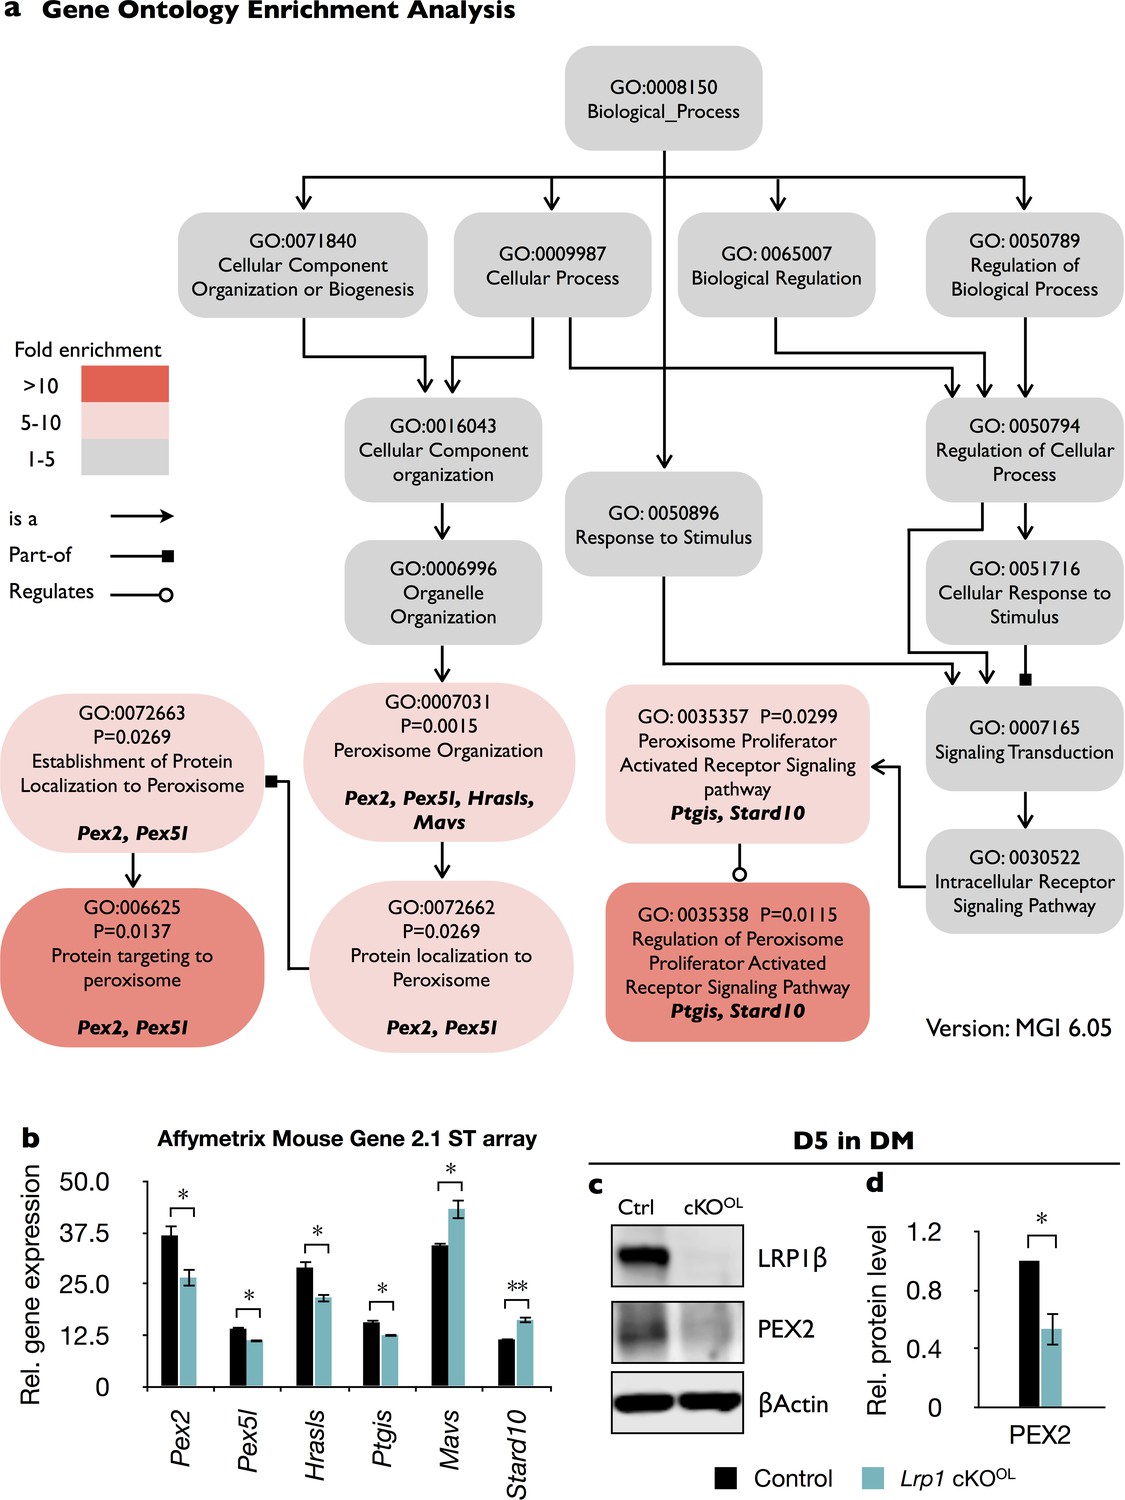
Gene ontology (GO) analysis of Lrp1-deficient OPCs revealed enrichment of peroxisomal genes.
Acutely isolated OPCs from Lrp1+/+ and Lrp1flox/flox;Olig2-Cre mouse pups were subjected to microarray analysis. (a) GO structure of biological process module related to peroxisome function. Each box shows the GO term ID, p-value, GO term, and the genes from the input list associated with the GO term. The color of each box shows the level of enrichment for each GO term. Specific GO terms were queried with the Mouse Genome Informatics (MGI) GO browser. p-Values were calculated by Fisher’s exact test. The fold-enrichment was calculated by dividing the ratio of genes that are associated with each GO term from the input list by the ratio of genes that are expected in the database. (b) Quantification of relative expression levels of gene products that are associated with specific GO terms listed in (a). mRNA was prepared from acutely isolated OPCs of Lrp1 controls (n = 4) and cKOOL (n = 4) pups and analyzed with the Affymetrix mouse gene 2.1 ST array. Differentially regulated gene products include Pex2 (peroxisomal biogenesis factor 2), Pex5l (peroxisomal biogenesis factor five like), Hrasls (hRas-like suppressor), Ptgis (prostaglandin I2 synthase), Mavs (Mitochondrial antiviral signaling), and Stard10 (StAR-related lipid transfer protein 10). (c) Immunoblotting of lysates prepared from Lrp1 control and cKOOL OL cultures after 5 days in DM. Representative blots probed with anti-LRP1β, anti-PEX2, and anti-β-actin. (d) Quantification of PEX2 in Lrp1 control (n = 3) and cKOOL (n = 3) cultures. Results are shown as mean values ± SEM, *p<0.05 and **p<0.01, Student’s t-test. For a detailed statistical report, see Figure 5—source data 1.
Figure 6
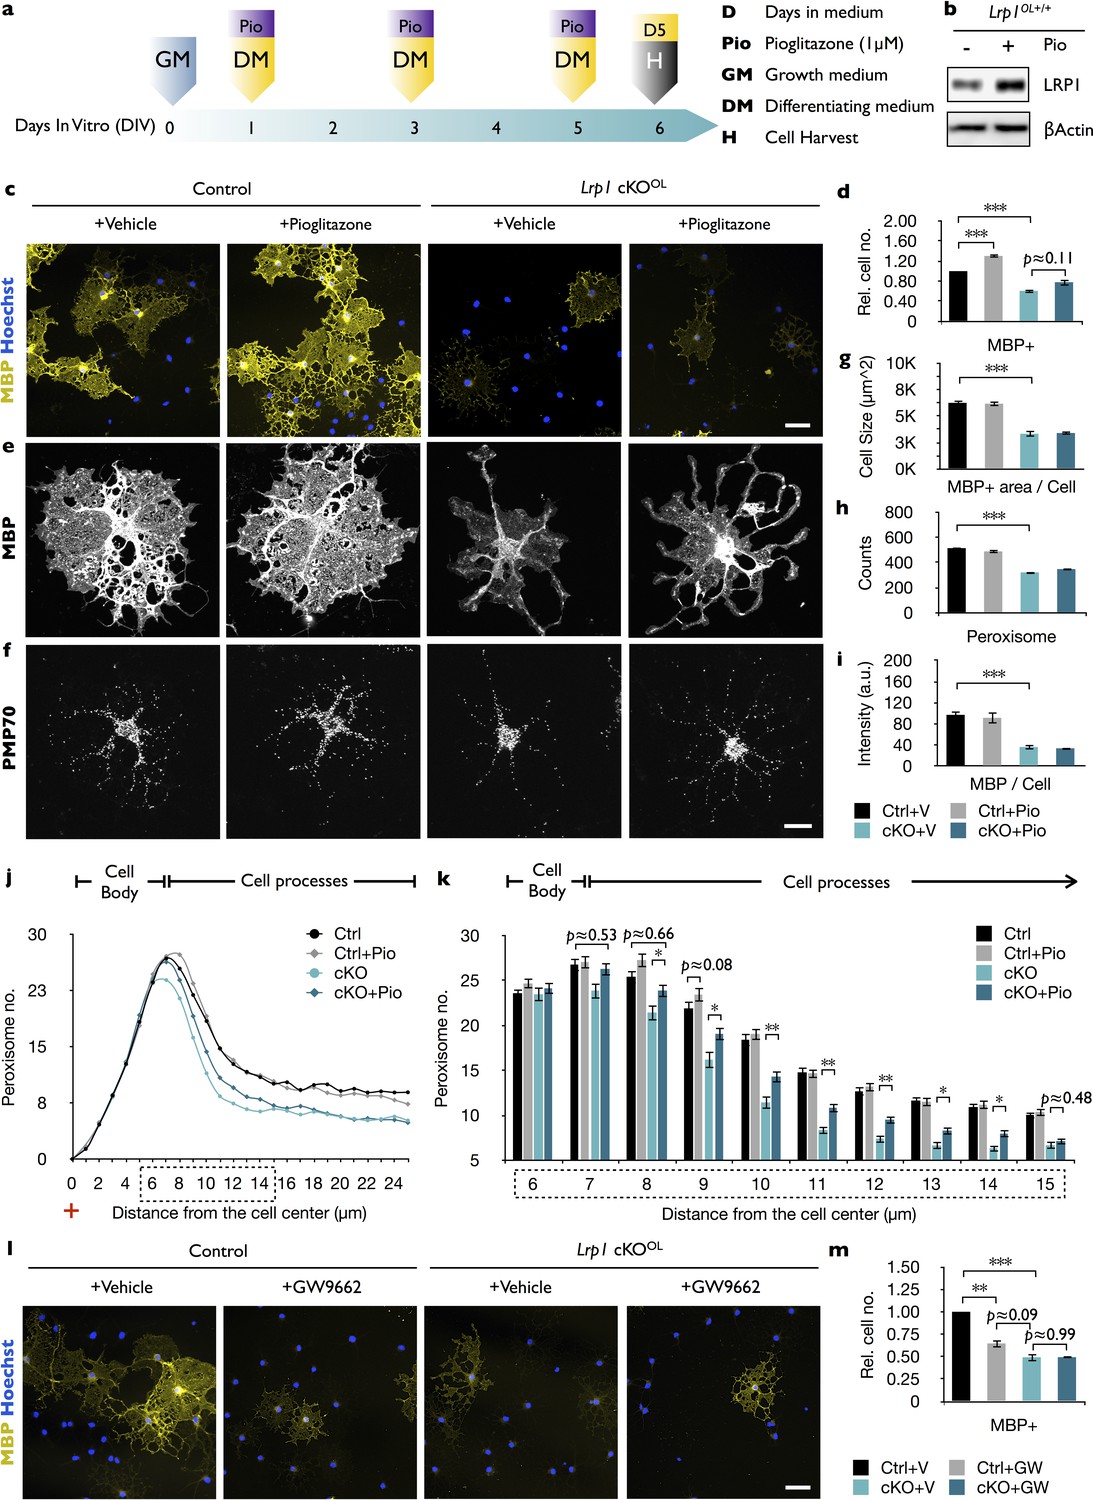
In Lrp1-deficient OPCs, PPARγ activation increases peroxisome density but does not promote cell differentiation.
(a) Timeline in days showing when growth medium (GM) or differentiation medium (DM) with pioglitazone (Pio) were supplied and cells were harvested for analysis. (b) Immunoblots of OL lysates prepared from Lrp1 wildtype cultures after 5 days in DM with (+) or without (-) Pio, probed with anti-LRP1β. Anti-β-actin is shown as loading control. (c) Immunostaining of Lrp1 control and cKOOL cultures after 5 days in DM. Representative cell cultures stained with anti-MBP and Hoechst dye 33342. Scale bar = 50 µm. (d) Quantification of MBP+ cells in Lrp1 control cultures with vehicle (n = 6), Lrp1 control cultures with Pio (n = 6), cKOOL cultures with vehicle (n = 4), and cKOOL cultures with Pio (n = 4). (e–f) Primary OLs probed with anti-MBP and anti-PMP70. Scale bar = 10 µm. (g–i) Quantification of OL size in µm2 (g), the number of PMP70+ puncta (h), and the intensity of MBP staining per cell (i). (j) Distribution of peroxisomes as a function of distance from the cell center in Lrp1 control and cKOOL OLs treated ±Pio. The number of PMP70+ peroxisomes between 6–15 µm in Lrp1 control and cKOOL cultures was subjected to statistical analysis in (k). Lrp1 control (n = 112 cells, three mice), Lrp1 control cultures with Pio (n = 180 cells, three mice), cKOOL (n = 60 cells, three mice), and cKOOL cultures with Pio. (n = 110 cells, three mice) (k). (l) Immunostaining of OLs after 5 days in DM ±GW9662, probed with anti-MBP and Hoechst dye33342. Scale bar = 50 µm. (m) Quantification of MBP+ cells under each of the four different conditions (n = 3 per condition). Results are shown as mean values ± SEM, *p<0.05, **p<0.01, and ***p<0.001, 2-way ANOVA, post hoc t-test. For a detailed statistical report, see Figure 6—source data 1.
-
Figure 6—source data 1
Raw data and detail statistical analysis report.
- https://doi.org/10.7554/eLife.30498.020
Figure 7
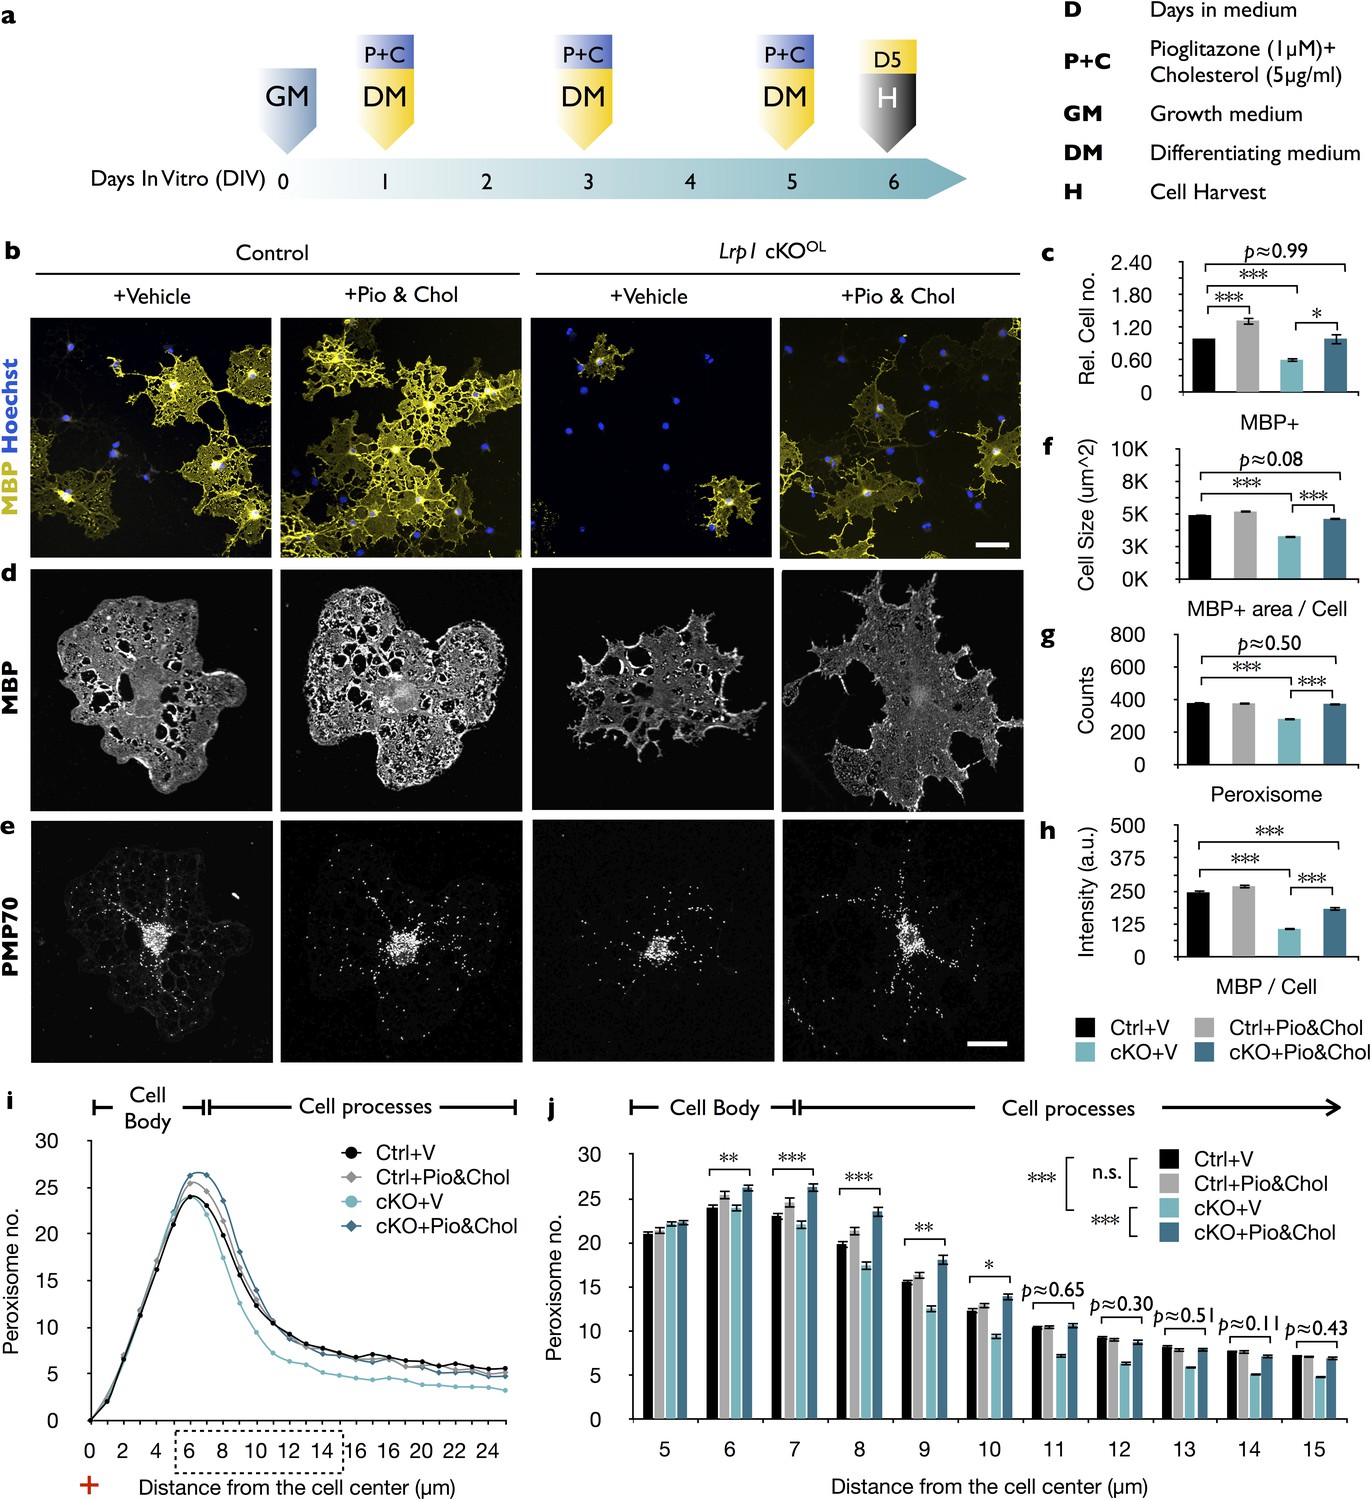
The combined treatment with cholesterol and pioglitazone rescues the differentiation block of Lrp1 deficient OPCs.
(a) Timeline in days showing when growth medium (GM) or differentiation medium (DM) with pioglitazone (Pio) and cholesterol (Chol) was supplied and cells were harvested for analysis. (b) Immunostaining of Lrp1 control and cKOOL cultures after 5 days in DM, probed with anti-MBP and Hoechst dye 33342. Scale bar = 50 µm. (c) Quantification of MBP+ cells in Lrp1 control cultures treated with vehicle (n = 4), Lrp1 control cultures treated with Pio and Chol (n = 3), cKOOL cultures treated with vehicle (n = 4), and cKOOL cultures treated with Pio and Chol (n = 3). (d and e) Primary OLs probed with anti-MBP and anti-PMP70. Scale bar = 10 µm. (f–h) Quantification of OL size in µm2 (f), the number of PMP70+ puncta and (g), the intensity of MBP staining per cell (h). (i) Distribution of peroxisomes as a function of distance from the cell center in Lrp1 control and cKOOL cultures with (+) or without (-) Pio and Chol combo-treatment. The number of PMP70+ peroxisomes between 5–15 µm in Lrp1 control and cKOOL cultures was subjected to statistical analysis in (j). Lrp1 control cultures with vehicle (n = 210 cells, three mice), Lrp1 control cultures treated with Pio and Chol (n = 208 cells, three mice), cKOOL cultures treated wtih vehicle (n = 199 cells, three mice), and cKOOL cultures treated wtih Pio and Chol (n = 190 cells, three mice) (k). Results are shown as mean values ± SEM, *p<0.05, **p<0.01, and ***p<0.001, 2-way ANOVA, post hoc t-test. For a detailed statistical report, see Figure 7—source data 1.
-
Figure 7—source data 1
Raw data and detail statistical analysis report.
- https://doi.org/10.7554/eLife.30498.022
Figure 8
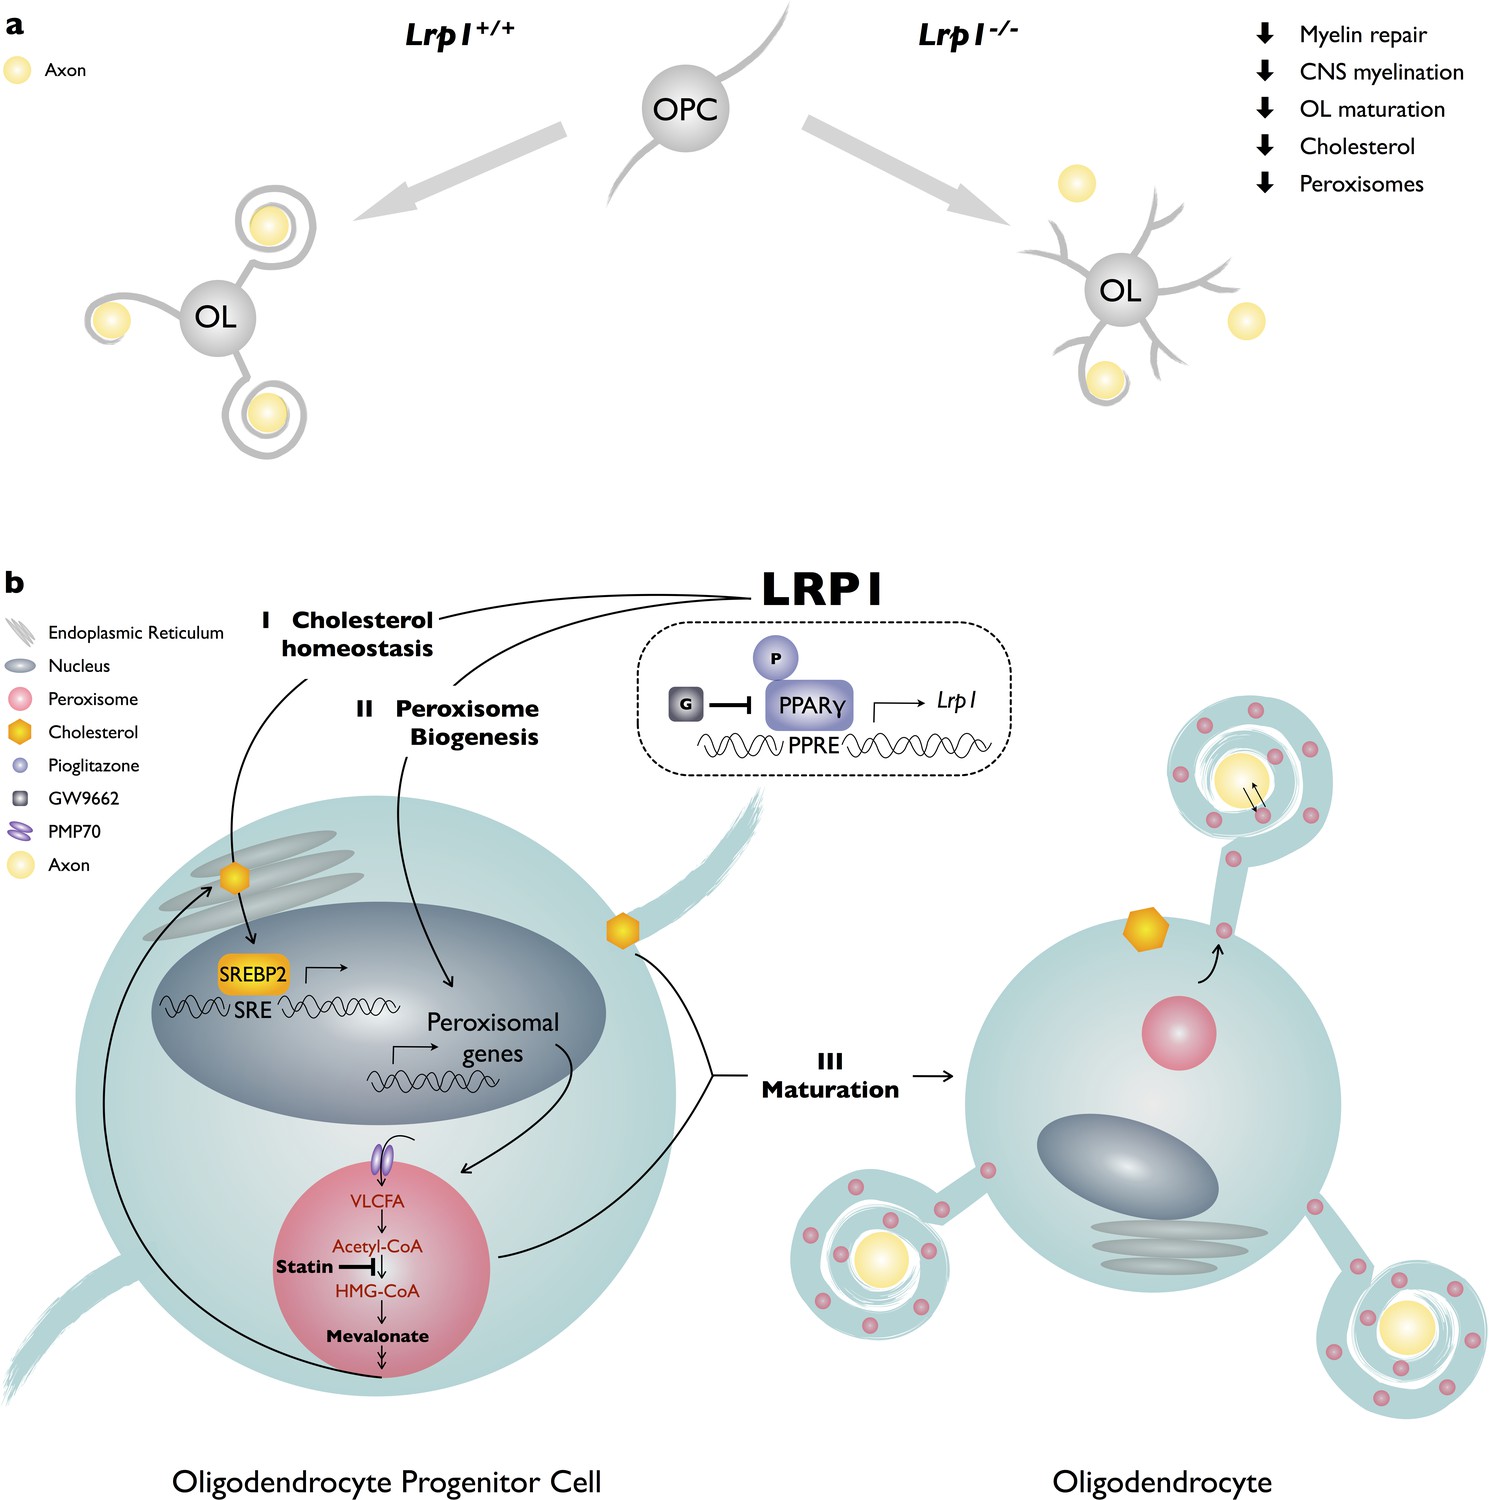
Working model of LRP1 regulated pathways in developing OLs.
(a) LRP1 in the OL-lineage is necessary for proper CNS myelin development and the timely repair of a chemically induced focal white matter lesion. In OPCs, Lrp1 deficiency leads to dysregulation of cholesterol homeostasis and impaired peroxisome biogenesis. (b) LRP1 is a key regulator of multiple pathways important for OPC differentiation into mature myelin producing OLs: (I) LRP1 regulates cholesterol homeostatsis; (II) LRP1 regulates peroxisome biogenesis; and (III) the combined treatment of Lrp1 deficient primary OPCs with cholesterol and pioglitazone is sufficient to drive maturation into MBP+ myelin sheet producing OLs.
Tables
Key resources table
| Reagent type (species) or resource | Designation | Source or reference | Identifiers | Additional information |
|---|---|---|---|---|
| Genetic reagent (Mus musculus) | Lrp1flox/flox | PMID:9634821 | RRID:IMSR_JAX:012604 | |
| Genetic reagent (Mus musculus) | Olig2-Cre | PMID:18691547 | RRID:MMRRC_011103-UCD | |
| Genetic reagent (Mus musculus) | CAG-CreERTM | PMID:11944939 | RRID:IMSR_JAX:004682 | |
| Genetic reagent (Mus musculus) | Pdgfra-CreERTM | PMID: 21092857 | RRID:IMSR_JAX:018280 | |
| Sequence-based reagent (cRNA) | Pdgfra cRNA | PMID:24948802 | ||
| Sequence-based reagent (cRNA) | Plp1 cRNA | PMID:24948802 | ||
| Sequence-based reagent (cRNA) | Mag cRNA | PMID:22131434 | ||
| Sequence-based reagent (cRNA) | Mbp cRNA | this study | Based on Allen Brain Atlas | |
| Antibody | anti-Digoxigenin-AP antibody | Roche | #11093274910 | |
| Antibody | rabbit anti-Olig2 | Millipore | #AB9610, RRID:AB_570666 | |
| Antibody | rat anti-PDGFRα | BD Pharmingen | #558774, RRID:AB_397117 | |
| Antibody | rabbit anti-GFAP | DAKO | # A 0334, RRID:AB_10013482 | |
| Antibody | mouse anti-APC | Calbiochem | #OP80, Clone CC1, RRID:AB_2057371 | |
| Antibody | rabbit anti-Caspr | PMID: 9118959 | RRID:AB_2572297 | |
| Antibody | mouse anti-Na Channel | PMID: 10460258 | K58/35 | |
| Antibody | rabbit anti-CNPase | Aves Labs | #27490 R12-2096 | |
| Antibody | mouse anti-MAG | Millipore | #MAB1567, RRID:AB_2137847 | |
| Antibody | rat anti-MBP | Millipore | #MAB386, RRID:AB_94975 | |
| Antibody | chicken anti-PLP | Aves Labs | #27592 | |
| Antibody | mouse anti-GFAP | Sigma | #G3893, RRID:AB_477010 | |
| Antibody | chicken anti-GFAP | Aves Labs | #GFAP | |
| Antibody | rabbit anti-NG2 | Millipore | #AB5320, RRID:AB_91789 | |
| Antibody | rabbit anti-LRP1β | Abcam | #ab92544, RRID:AB_2234877 | |
| Antibody | rabbit anti-PMP70 | Thermo | #PA1-650, RRID:AB_2219912 | |
| Antibody | mouse anti-βIII tubulin | Promega | #G7121, RRID:AB_430874 | |
| Antibody | mouse anti-β-actin | Sigma | #AC-15 A5441, RRID:AB_476744 | |
| Antibody | rabbit anti-MAG | PMID: 27008179 | ||
| Antibody | rabbit anti-PLP | Abcam | #ab28486, RRID:AB_776593 | |
| Antibody | rat anti-PLP/DM20 | PMID: 27008179 | AA3 hybridoma | Wendy Macklin |
| Antibody | mouse anti-CNPase | Abcam | #ab6319, RRID:AB_2082593 | |
| Antibody | rabbit anti-PXMP3 (PEX2) | One world lab | #AP9179c | |
| Antibody | rabbit anti-SREBP2 | One world lab | #7855 | |
| Commercial assay or kit | Cholesterol/Cholesteryl Ester Quantitation Kit | Chemicon | #428901 | |
| Commercial assay or kit | DCTM Protein Assay | Bio-Rad | #5000112 | |
| Commercial assay or kit | RNeasy Micro Kit | Qiagen | #74004 | |
| Chemical compound, drug | 10 mM dNTP mix | Promega | #C1141 | |
| Chemical compound, drug | 5X Green GoTaq Buffer | Promega | #M791A | |
| Chemical compound, drug | GoTaq DNA polymerase | Promega | #M3005 | |
| Chemical compound, drug | L-α-Lysophosphatidylcholine | Sigma | #L4129 | |
| Chemical compound, drug | Hoechst dye 33342 | Life technology | #H3570 | |
| Chemical compound, drug | ProLong Gold antifade reagent | Life technology | #P36930 | |
| Chemical compound, drug | Fluoromyelin-Green | Life technology | #F34651 | |
| Chemical compound, drug | PDGF-AA | Peprotech | #100-13A | |
| Chemical compound, drug | Forskolin | Sigma | #F6886 | |
| Chemical compound, drug | CNTF | Peprotech | #450–02 | |
| Chemical compound, drug | NT-3 | Peprotech | #450–03 | |
| Chemical compound, drug | T3 | Sigma | #T6397 | |
| Chemical compound, drug | Cholesterol | Sigma | #C8667 | |
| Chemical compound, drug | Pioglitazone | Sigma | #E6910 | |
| Chemical compound, drug | Simvastatin | Sigma | #S6196 | |
| Chemical compound, drug | GW9662 | Sigma | #M6191 | |
| Chemical compound, drug | Filipin | Sigma | #F9765 | |
| Chemical compound, drug | Super Signal West Pico substrate | Thermo | #34080 | |
| Chemical compound, drug | WesternSure PREMIUM Chemiluminescent Substrate | LI-COR Biosciences | #926–95000 | |
| Chemical compound, drug | Super Signal West Femto substrate | Thermo | #34095 | |
| Software, algorithm | Fiji | PMID: 22743772 | ||
| Software, algorithm | Axon pAlamp10.3 software | Molecular Devices | ||
| Software, algorithm | Origin9.1 software | Origin Lab | ||
| Software, algorithm | Image Studio Lite Western Blot Analysis Software | LI-COR Biosciences | ||
| Other | C-DiGit blot scanner | LI-COR Biosciences | #P/N 3600–00 | |
| Other | Multimode Plate Reader | Molecular Devices | #SpectraMax M5e | |
| Other | Stoelting stereotaxic instrument | Stoelting | #51730D | |
| Other | Stoelting quintessential stereotaxic injector | Stoelting | #53311 |
Additional files
-
Source code 1
ANOVA source code.
- https://doi.org/10.7554/eLife.30498.024
-
Transparent reporting form
- https://doi.org/10.7554/eLife.30498.025
Download links
A two-part list of links to download the article, or parts of the article, in various formats.
Downloads (link to download the article as PDF)
Open citations (links to open the citations from this article in various online reference manager services)
Cite this article (links to download the citations from this article in formats compatible with various reference manager tools)
LRP1 regulates peroxisome biogenesis and cholesterol homeostasis in oligodendrocytes and is required for proper CNS myelin development and repair
eLife 6:e30498.
https://doi.org/10.7554/eLife.30498


