Chromatin accessibility underlies synthetic lethality of SWI/SNF subunits in ARID1A-mutant cancers
- Salk Institute for Biological Studies, United States
- University of California San Diego, United States
Figures
Figure 1 with 3 supplements
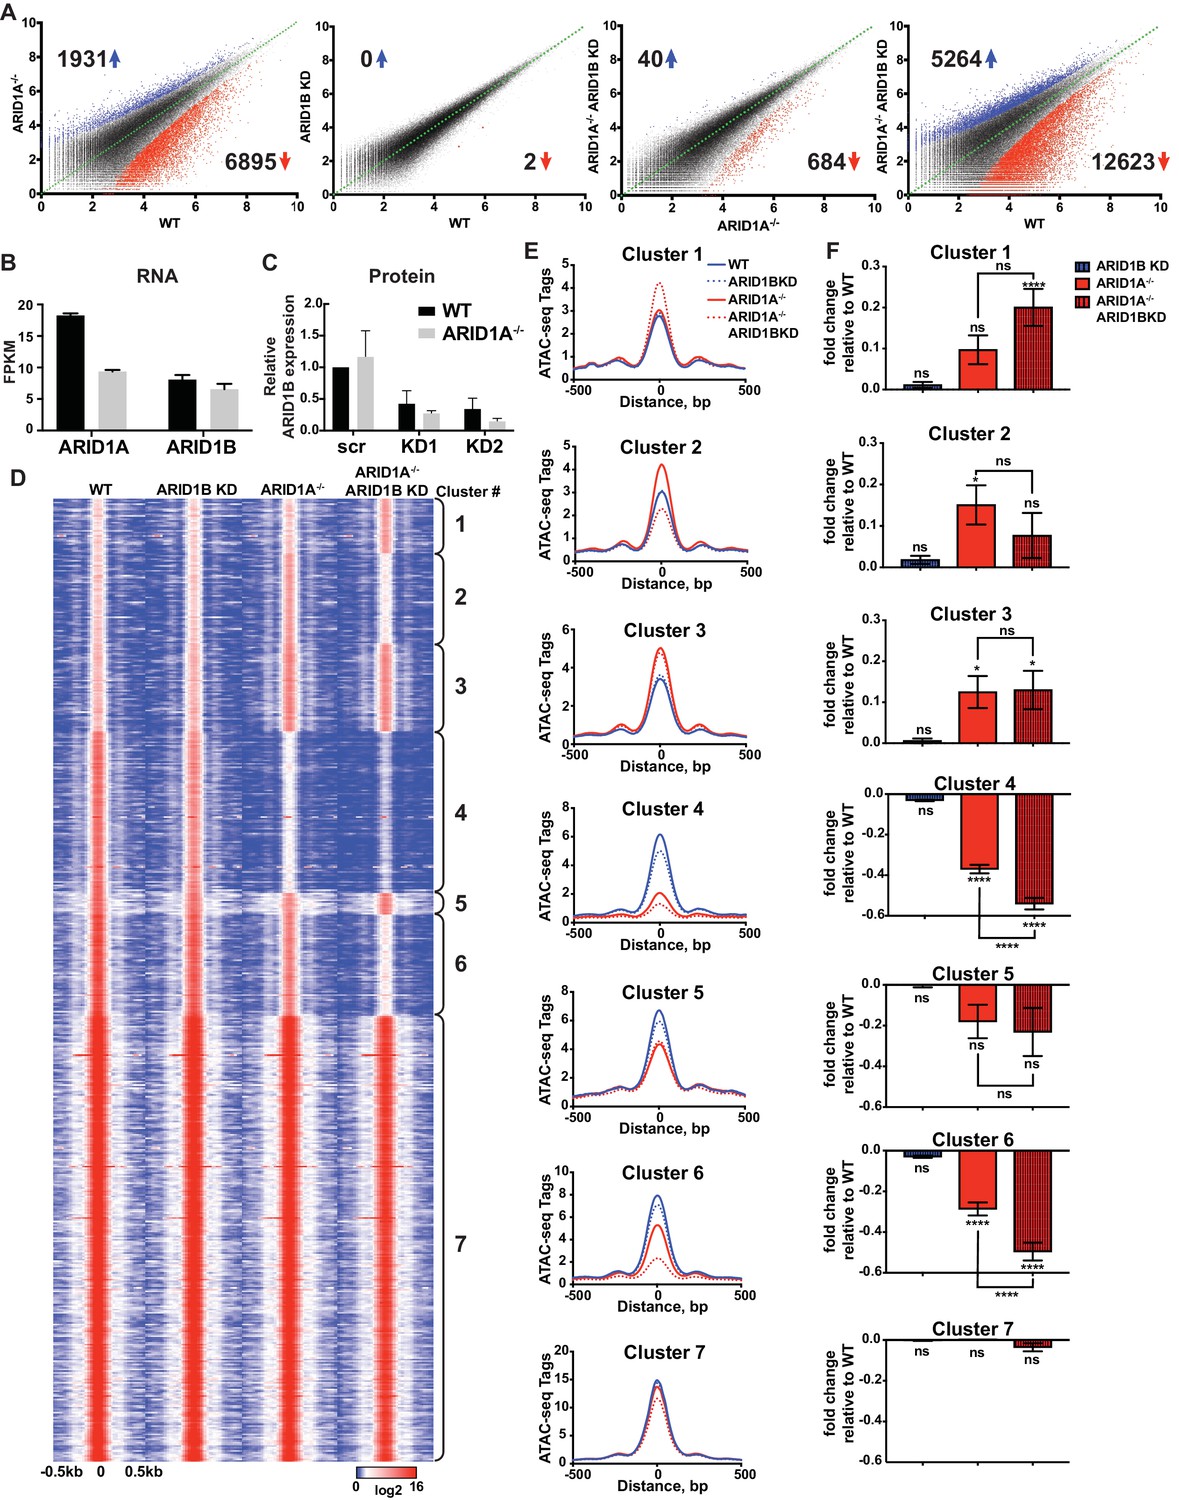
ARID1A and ARID1B have unique and shared roles in the maintenance of chromatin accessibility.
(A) Differential peak calls from ATAC-seq in HCT116 WT cells expressing shRNAs to scrambled control (WT) or ARID1B (ARID1B KD), or HCT116 ARID1A-/- cells expressing shRNAs to scrambled control (ARID1A-/-) or ARID1B (ARID1A-/- ARID1B KD). These cells were validated for the expression, complex association, and function of ARID1A and ARID1B (Figure 1—figure supplement 1A–D). Blue and red dots represent differential ATAC-seq peaks whose read density increased or decreased by 1.5 fold or more (FDR < 0.05), respectively, in two independent biological replicates. Numbers in the upper left and lower right corners refer to numbers of called peaks increased or decreased in accessibility. Percent of changed sites was calculated from total number of accessible sites (Figure 1—figure supplement 2A). Replicate experiments showed strong correlation (Figure 1—figure supplement 2B) and overlap with DNAseI Hypersensitivity data (Figure 1—figure supplement 2C). (B) FPKM expression of ARID1A and ARID1B quantified by RNA-seq of two biological replicates from wild-type (WT) and ARID1A-/- (ARID1A-/-) HCT116 cells. (C) ARID1B protein expression in wild-type (WT) and ARID1A-/- (ARID1A-/-) HCT116 cells expressing shRNAs to scrambled control (scr) or ARID1B (KD1, KD2). ARID1B levels are quantified relative to TBP control (Figure 1—figure supplement 1B). Values shown are averages from three biological replicates where error bars indicate standard deviation. (D) k-means clustering analysis of ATAC-seq read density (log2) from WT, ARID1B KD, ARID1A-/-, and ARID1A-/- ARID1B KD HCT116 cells. Reads are centered on the middle of the accessible peak ±0.5 kb. (E) Average ATAC-seq read density in WT, ARID1B KD, ARID1A-/-, and ARID1A-/- ARID1B KD HCT116 cells centered on accessible peaks from Clusters 1–7. (F) Fold change in RNA expression relative to WT HCT116 cells for the top 25% of expressed genes nearest to called accessible peaks from Clusters 1–7. Ns, not significant; *p<0.05; **p<0.01; ***p<0.001, ****p<0.0001. Gene Set Enrichment analysis of hallmark gene sets was performed on annotated sites from Clusters 1–7 (Figure 1—figure supplement 3).
-
Figure 1—source data 1
ARID1B protein expression in WT and ARID1A-/- HCT116 cells with ARID1B knockdown.
ARID1B protein expression in wild-type (WT) and ARID1A-/- (ARID1A-/-) HCT116 cells expressing shRNAs to scrambled control (scr) or ARID1B (KD1, KD2) was quantified by western blotting. ARID1B levels were normalized to TBP control and then KD1 and KD2 were normalized to scrambled (scr) control in WT cells.
- https://doi.org/10.7554/eLife.30506.006
-
Figure 1—source data 2
Proliferation of WT and ARID1A-/- HCT116 cells with ARID1B knockdown.
Relative proliferation over 9 days normalized to scrambled (scr) control at day 3, as determined by CellTiterGlo. Data shown from two independent biological replicates with averages and standard deviation.
- https://doi.org/10.7554/eLife.30506.007
Figure 1—figure supplement 1
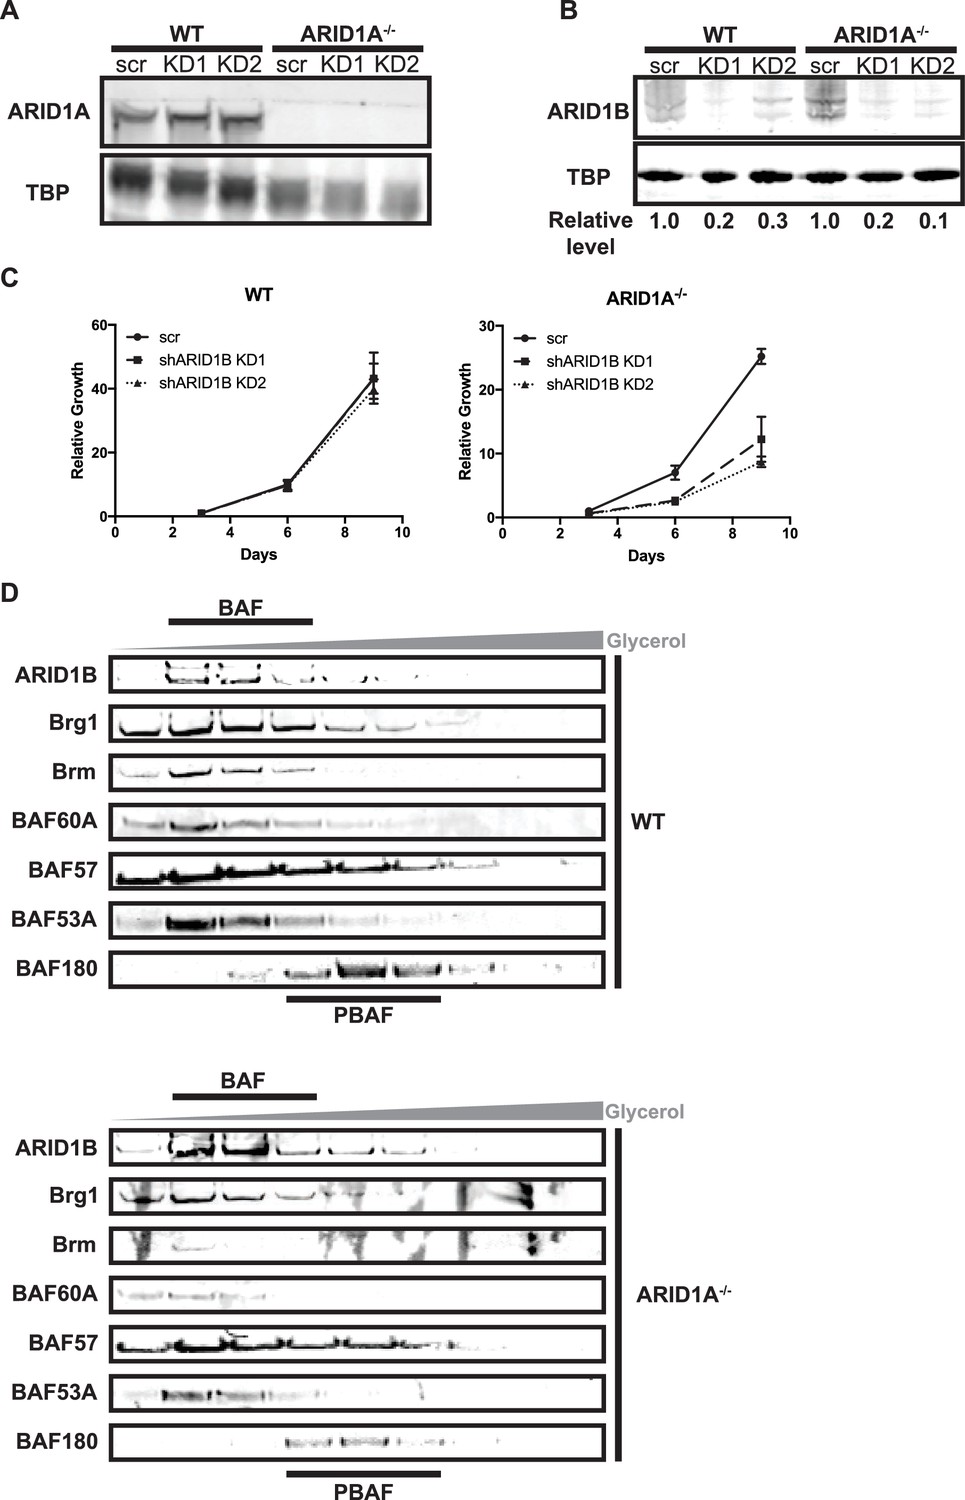
Knockdown of ARID1B is synthetically lethal with ARID1A deletion in HCT116 cells.
(A) Representative Western blot of ARID1A expression in WT and ARID1A-/- HCT116 cells with shRNAs to scrambled control (scr) or ARID1B (KD1, KD2). TBP used as loading control. Three independent experiments were performed. (B) Representative western blot of ARID1B expression in WT and ARID1A-/- HCT116 cells with shRNAs to scrambled control (scr) or ARID1B (KD1, KD2). Relative level indicates ARID1B expression normalized to TBP loading control. Average relative level from three independent experiments is shown in Figure 1C. (C) CellTiterGlo measurements after 3, 6, or 9 days of growth of WT or ARID1A-/- HCT116 cells expressing shRNAs to scrambled control (scr) or ARID1B (shARID1B KD1, shARID1B KD2) normalized to WT scr control at day 3. Averages shown from two independent biological replicates with standard deviation. (D) Western blot of WT and ARID1A-/- HCT116 nuclear extracts separated by glycerol gradient centrifugation. Antibodies used for blotting are indicated. Representative of three biological replicates.
Figure 1—figure supplement 2
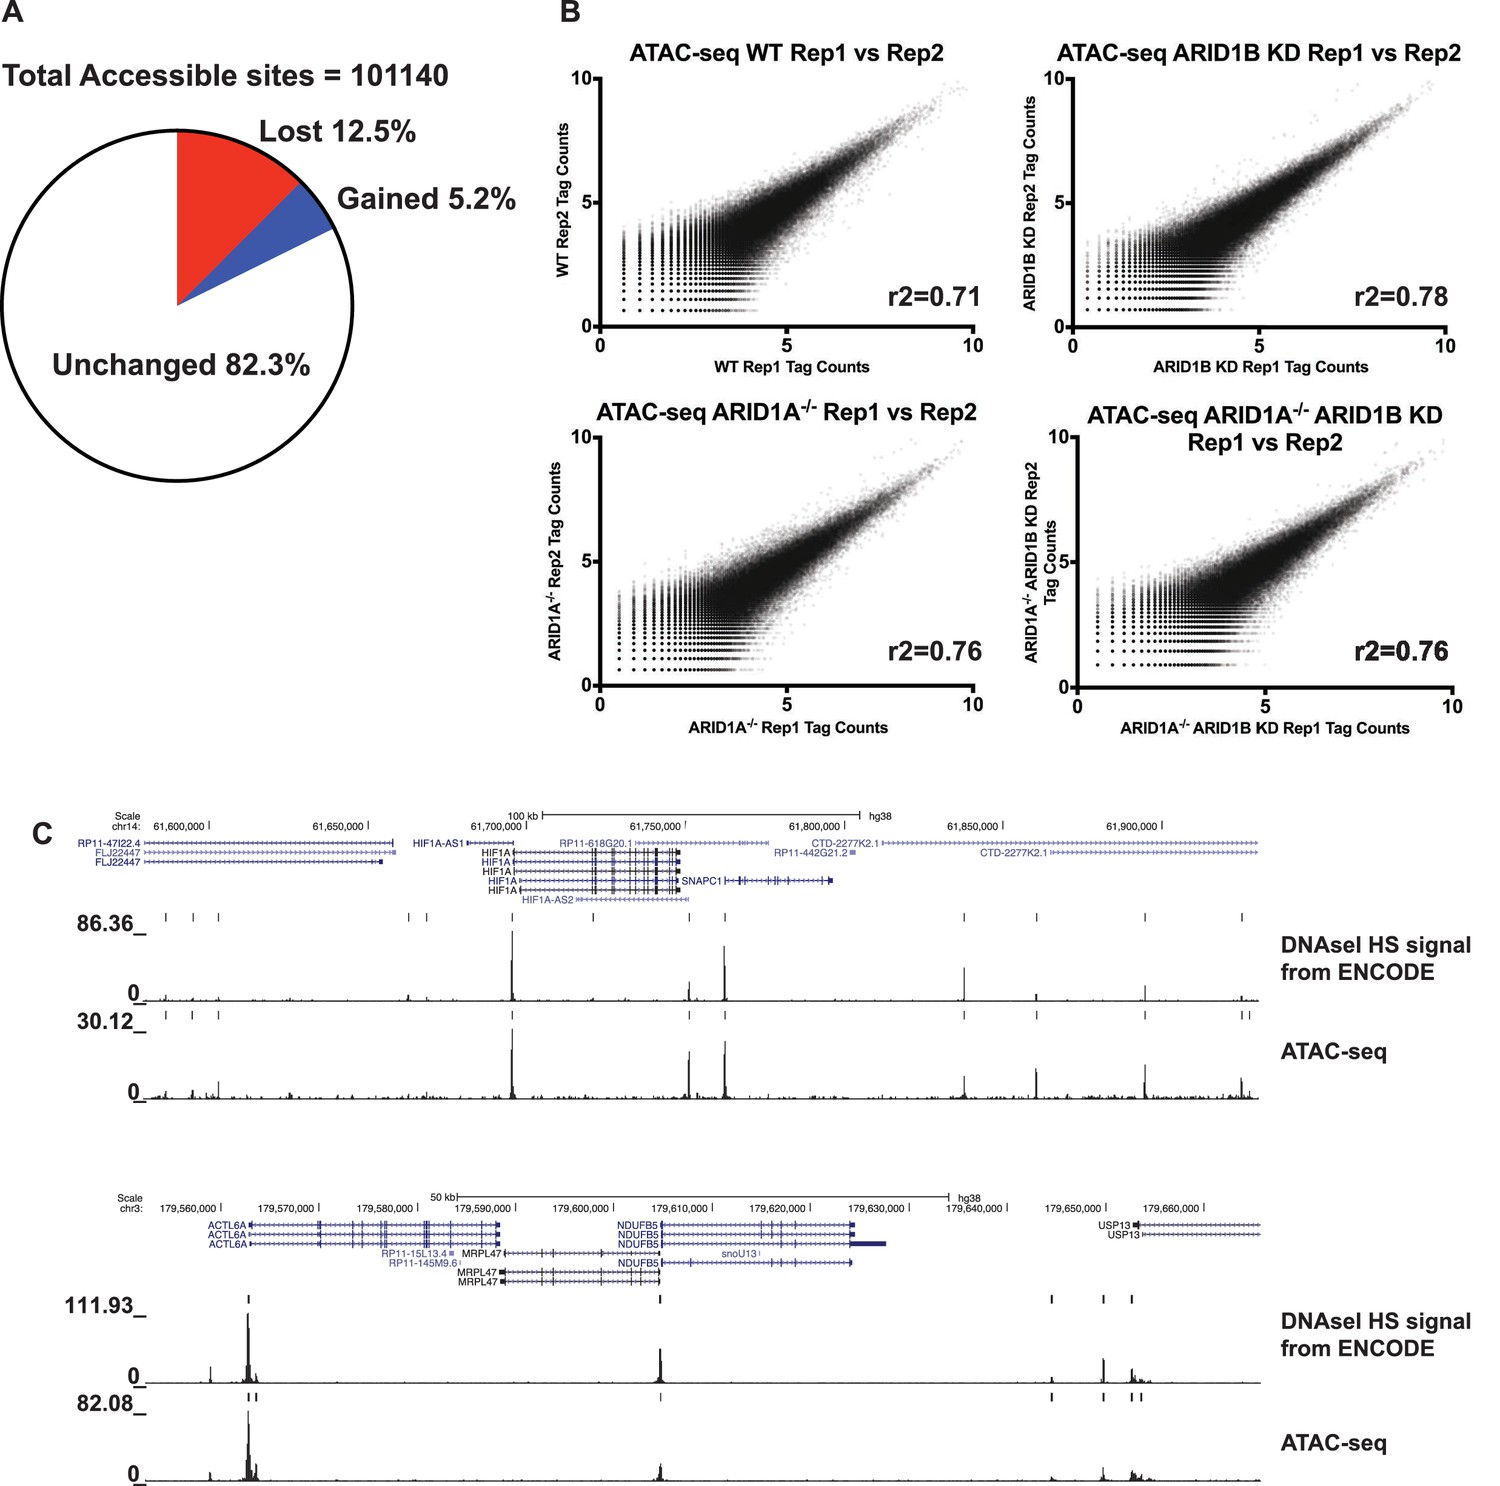
Quality control of ATAC-seq datasets.
(A) Pie chart of all accessible sites reflecting percent of sites unchanged, increased, and decreased called from WT versus ARID1A-/-/ARID1B HCT116 ATAC-seq comparisons. Data from two independent biological replicates. (B) Correlation of ATAC-seq tag count in HCT116 WT cells expressing shRNAs to scrambled control (WT) or ARID1B (ARID1B KD), or HCT116 ARID1A-/- cells expressing shRNAs to scrambled control (ARID1A-/-) or ARID1B (ARID1A-/-ARID1B KD) from two independent biological replicates. The correlation coefficient (r2) between biological replicates is shown. (C) Genome browser tracks of ATAC-seq data and DNAseI hypersensitivity (HS) data from the ENCODE project.
Figure 1—figure supplement 3
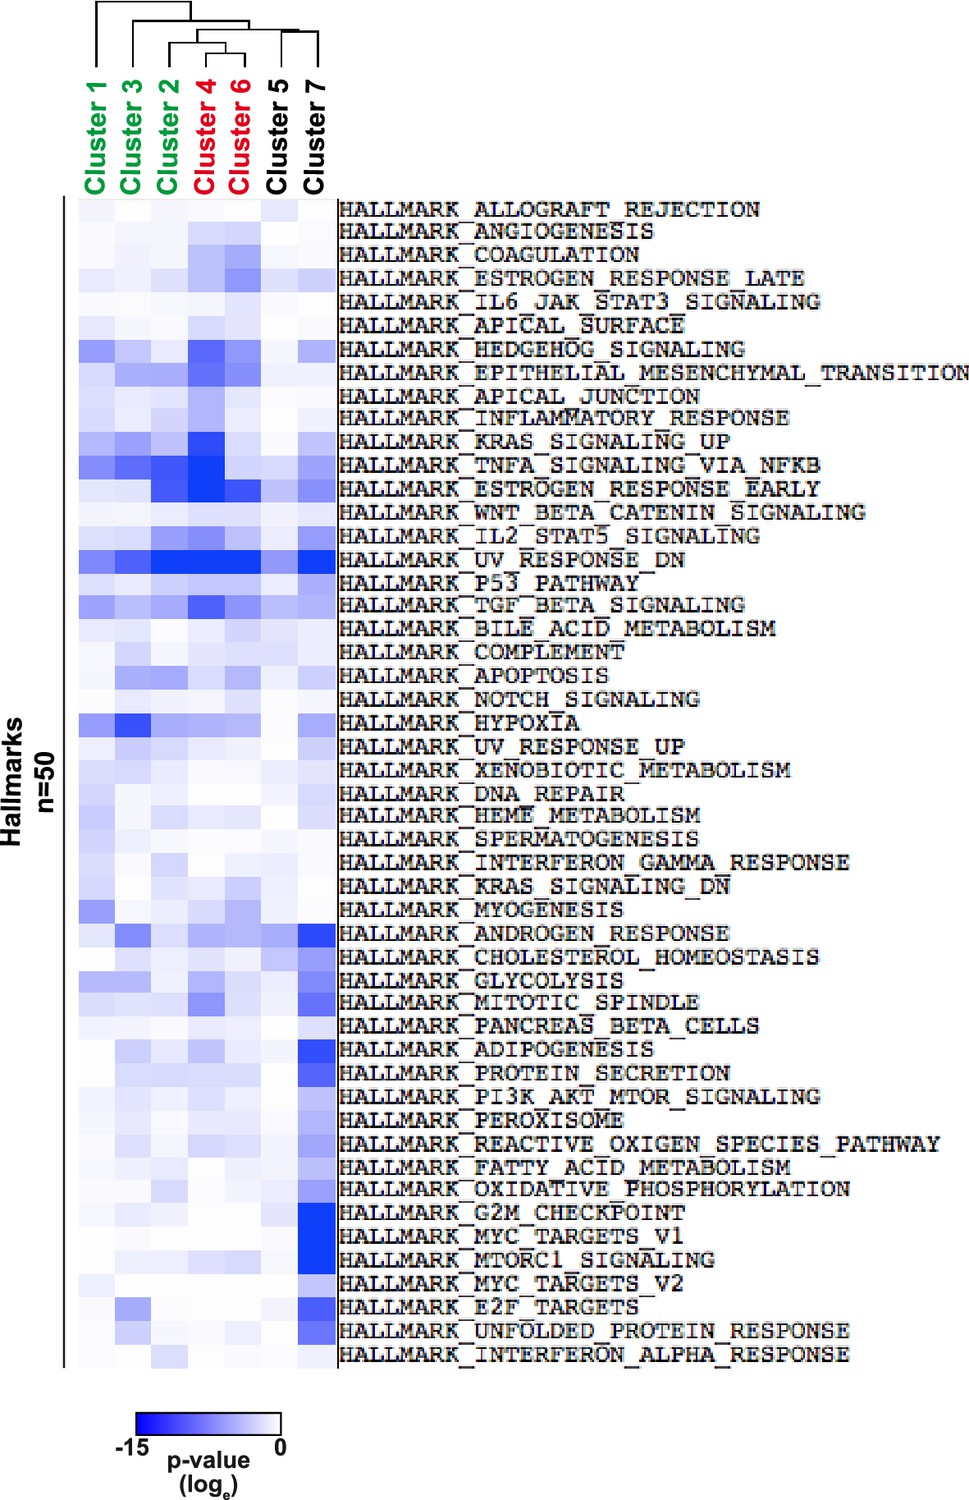
Hierarchical clustering of enrichment p-values (loge) using Gene Set Enrichment Analysis (GSEA) with Hallmark gene sets.
https://doi.org/10.7554/eLife.30506.005
Figure 2
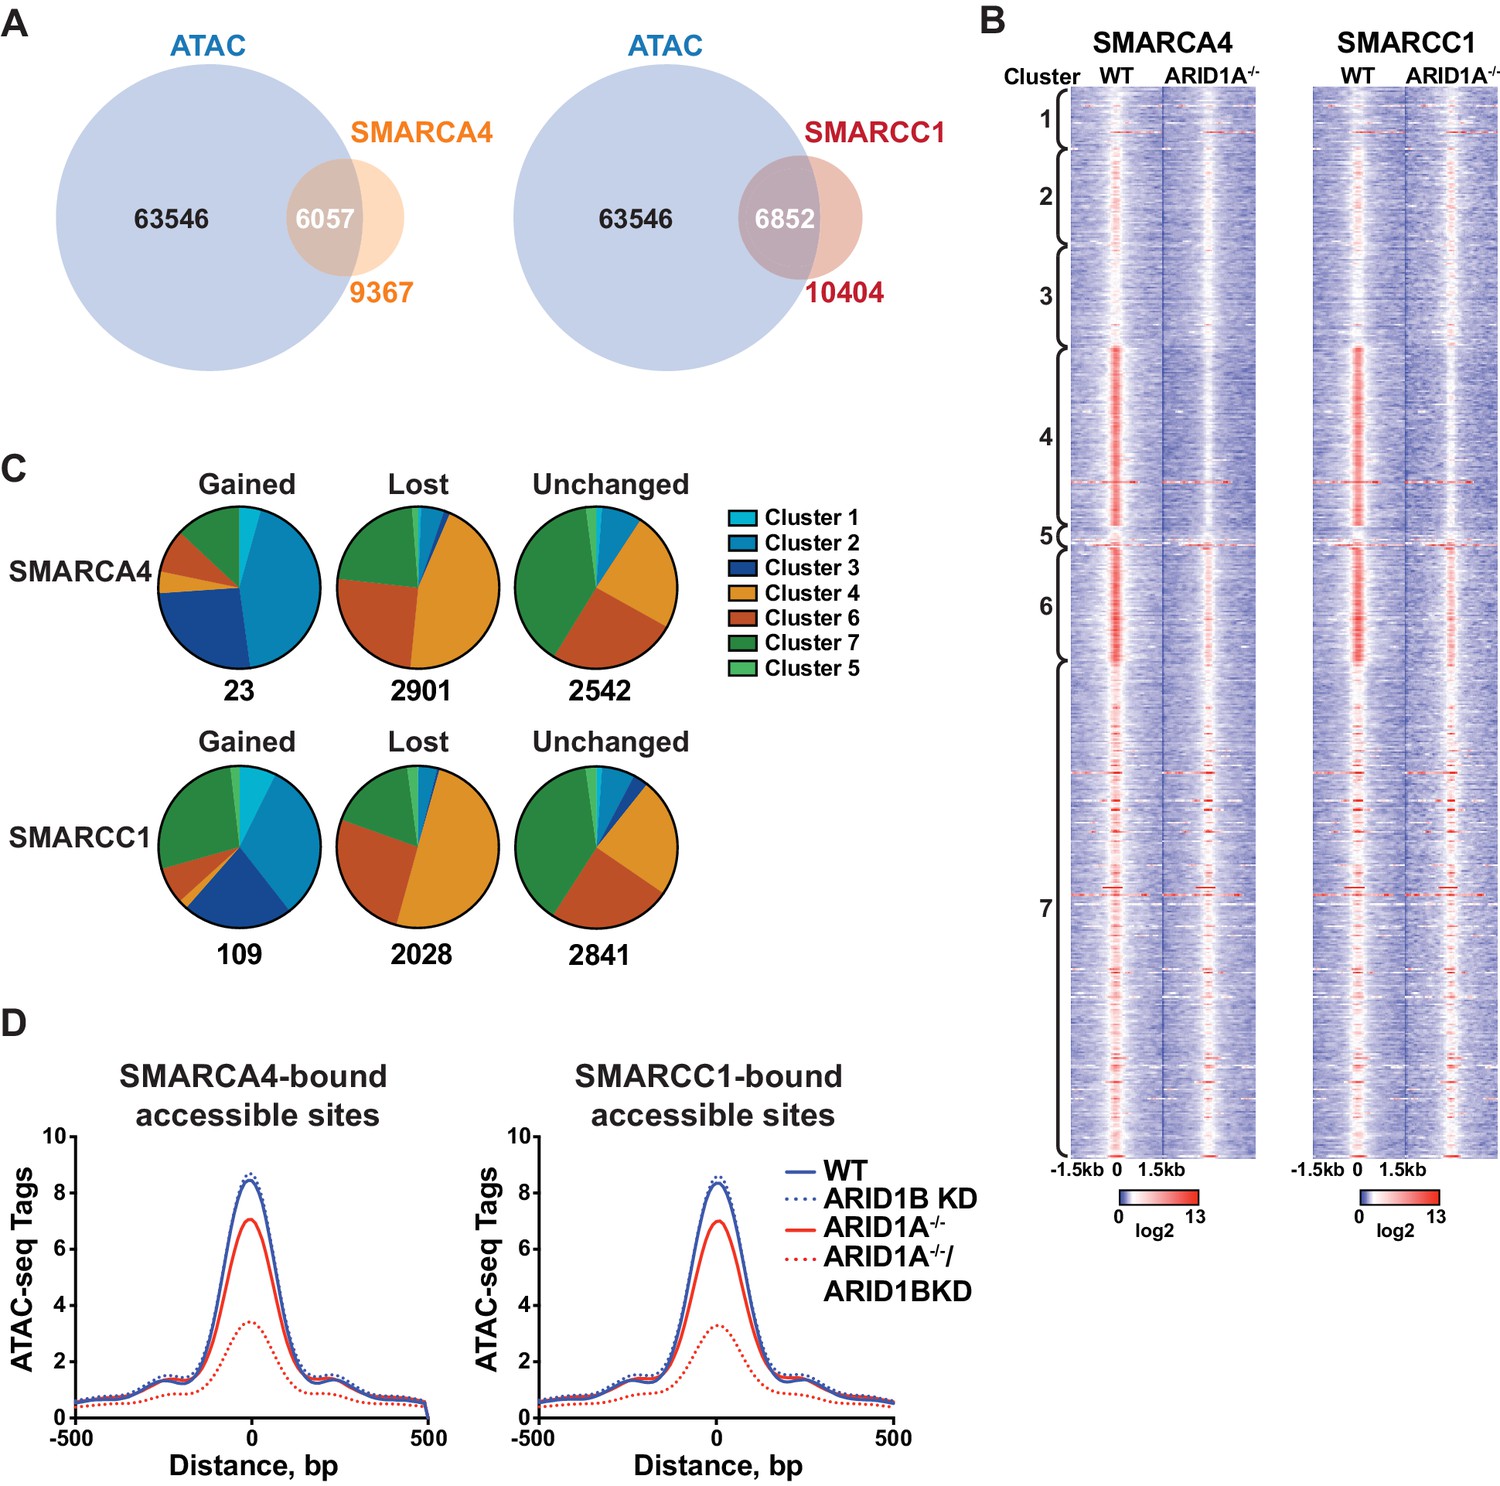
SWI/SNF occupancy correlates with ARID1A/1B-dependent changes in accessibility.
(A) Venn diagram overlap of SMARCA4 or SMARCC1 ChIP binding sites with accessible sites in WT HCT116 cells. (B) ChIP-seq tag density of SMARCA4 or SMARCC1 from WT and ARID1A-/- HCT116 cells centered on accessible sites in Clusters 1–7 ± 1.5 kb. (C) Distribution of SMARCA4 or SMARCC1 binding sites that are gained, lost, or unchanged in ARID1A-/- versus WT HCT116 cells across ATAC-seq Clusters 1–7. Number of total gained, lost, or unchanged SMARCA4/SMARCC1-bound accessible sites is shown. (D) ATAC-seq tag density from HCT116 WT, ARID1B KD, ARID1A-/-, and ARID1A-/-/ARID1B KD cells at SMARCA4 or SMARCC1-bound accessible sites.
Figure 3 with 3 supplements
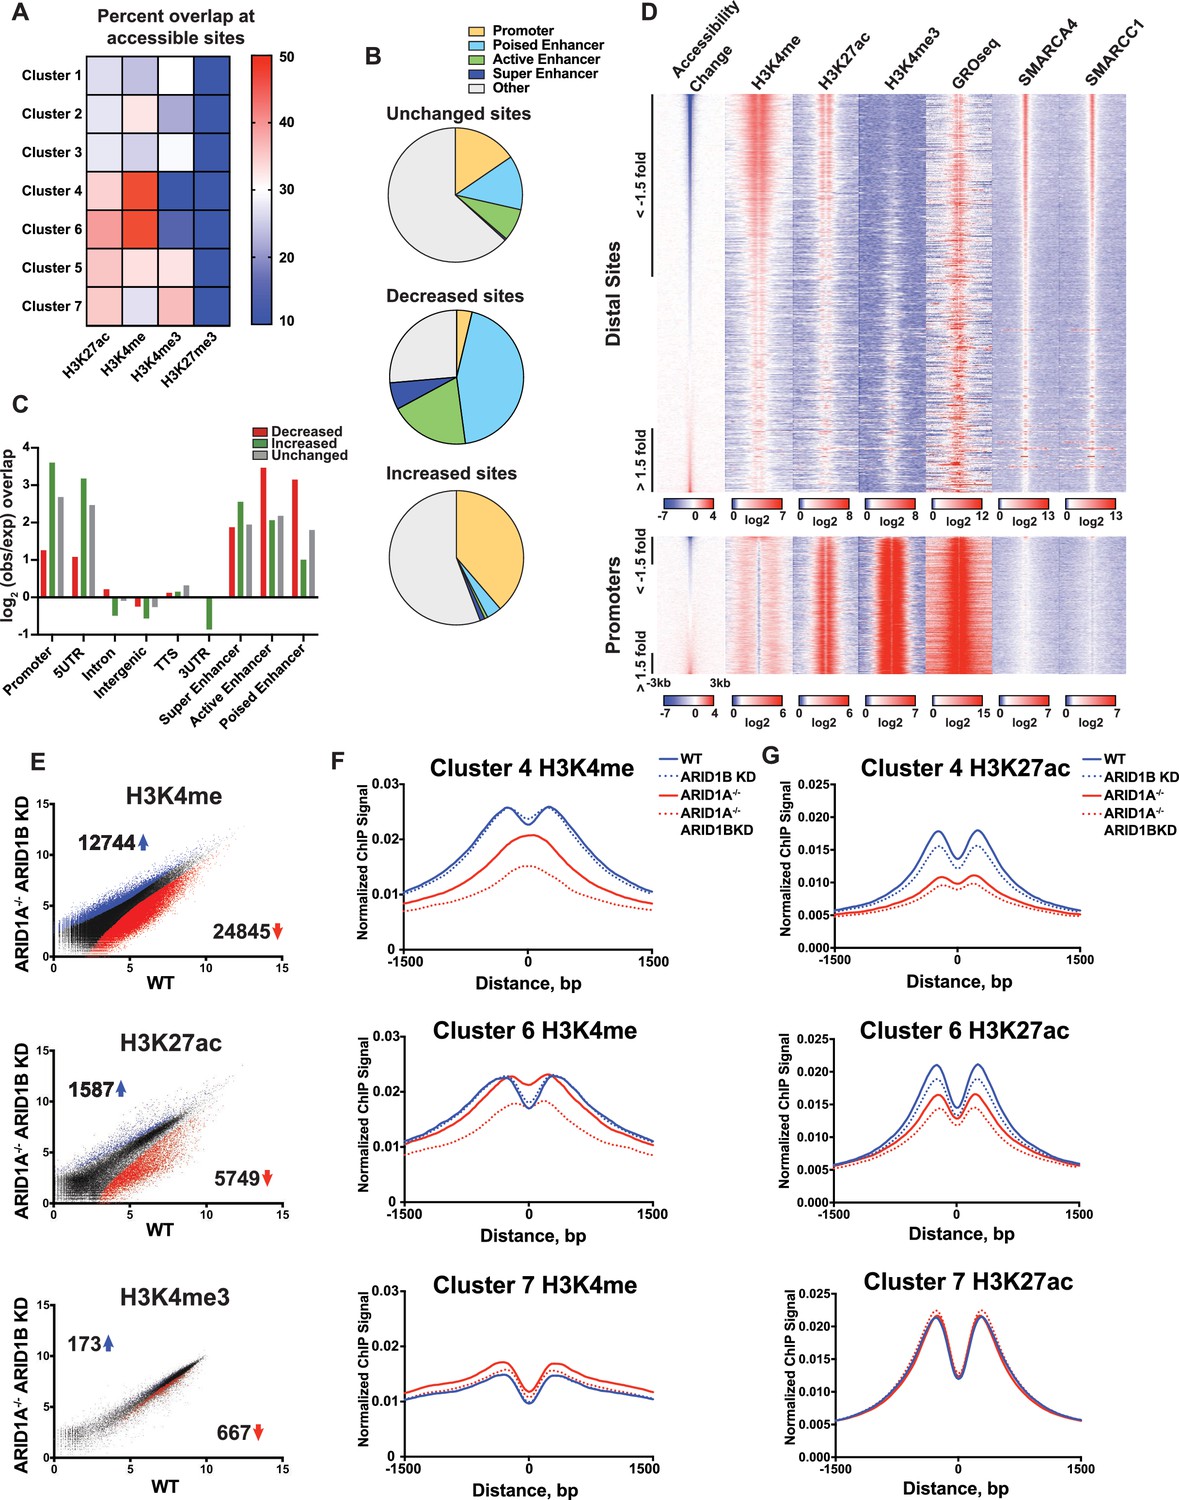
ARID1A/1B maintain accessibility at enhancers.
(A) Proportion of accessible sites in Clusters 1–7 that directly overlap with ChIP-seq regions for histone 3 lysine 27 acetylation (H3K27ac), histone 3 lysine 4 monomethylation (H3K4me), histone 3 lysine 4 trimethylation (H3K4me3), and histone 3 lysine 27 trimethylation (H3K27me3) in WT HCT116 cells. Overlaps ≥0.5 were marked in red; overlaps ≤0.1 were marked in blue. Intergenic GRO-seq signal at Clusters 1–7 reveals bi-directional transcription at accessible sites (Figure 3—figure supplement 1). (B) Percent of unchanged, increased, and decreased accessible sites called from WT versus ARID1A-/- ARID1B KD HCT116 cells present in promoters, poised enhancers, active enhancers, super enhancers, or other genomic elements. (C) Observed/expected enrichment of unchanged, increased, and decreased accessible sites called from WT versus ARID1A-/- ARID1B KD HCT116 cells at promoters, 5' and 3' untranslated regions (UTR), introns, intergenic regions, transcription termination sites (TTS), poised enhancers, active enhancers, and super enhancers. (D) Accessible sites sorted by log2 fold change in accessibility in WT versus ARID1A-/- ARID1B KD HCT116 cells at distal sites and promoters, where distal is defined as greater than 3 kb from the nearest TSS. Corresponding H3K4me, H3K27ac, H3K4me3, GRO-seq, SMARCA4, and SMARCC1 tag density from WT HCT116 cells is displayed. Reads are centered on middle of accessible region ±3 kb. (E) Differential peak calls from H3K27ac, H3K4me, or H3K4me3 ChIP-seq from HCT116 WT cells expressing shRNAs to scrambled control (WT) versus HCT116 ARID1A-/- cells expressing shRNAs to ARID1B (ARID1A-/- ARID1B KD). Blue and red dots represent differential ChIP-seq peaks whose read density increased or decreased by 1.5 fold or more (FDR < 0.05), respectively, from two independent biological replicates. Numbers in the upper left and lower right corners refer to numbers of increased and decreased peaks. Breakdown of H3K4me3 changes in Clusters 1–7 can be found in Figure 3—figure supplement 2A,B. (F) Normalized average ChIP-seq tag density for H3K4me from two independent biological replicates at accessible sites in Clusters 4, 6, and 7 from HCT116 WT, ARID1A-/-, ARID1B KD, and ARID1A-/- ARID1B KD cells. Reads are centered on middle of accessible region ±1.5 kb. Data for all 7 clusters can be found in Figure 3 – Figure Supplement 3A, B. (G) Normalized average ChIP-seq tag density for H3K27ac from two independent biological replicates at accessible sites in Clusters 4, 6, and 7 from HCT116 WT, ARID1A-/-, ARID1B KD, and ARID1A-/- ARID1B KD cells. Reads are centered on middle of accessible region ±1.5 kb. Data for all 7 clusters can be found in Figure 3—figure supplement 3C,D.
Figure 3—figure supplement 1

GRO-seq signal from intergenic sites in Clusters 1–7 centered on the middle of the accessible region ±2 kb.
https://doi.org/10.7554/eLife.30506.010
Figure 3—figure supplement 2
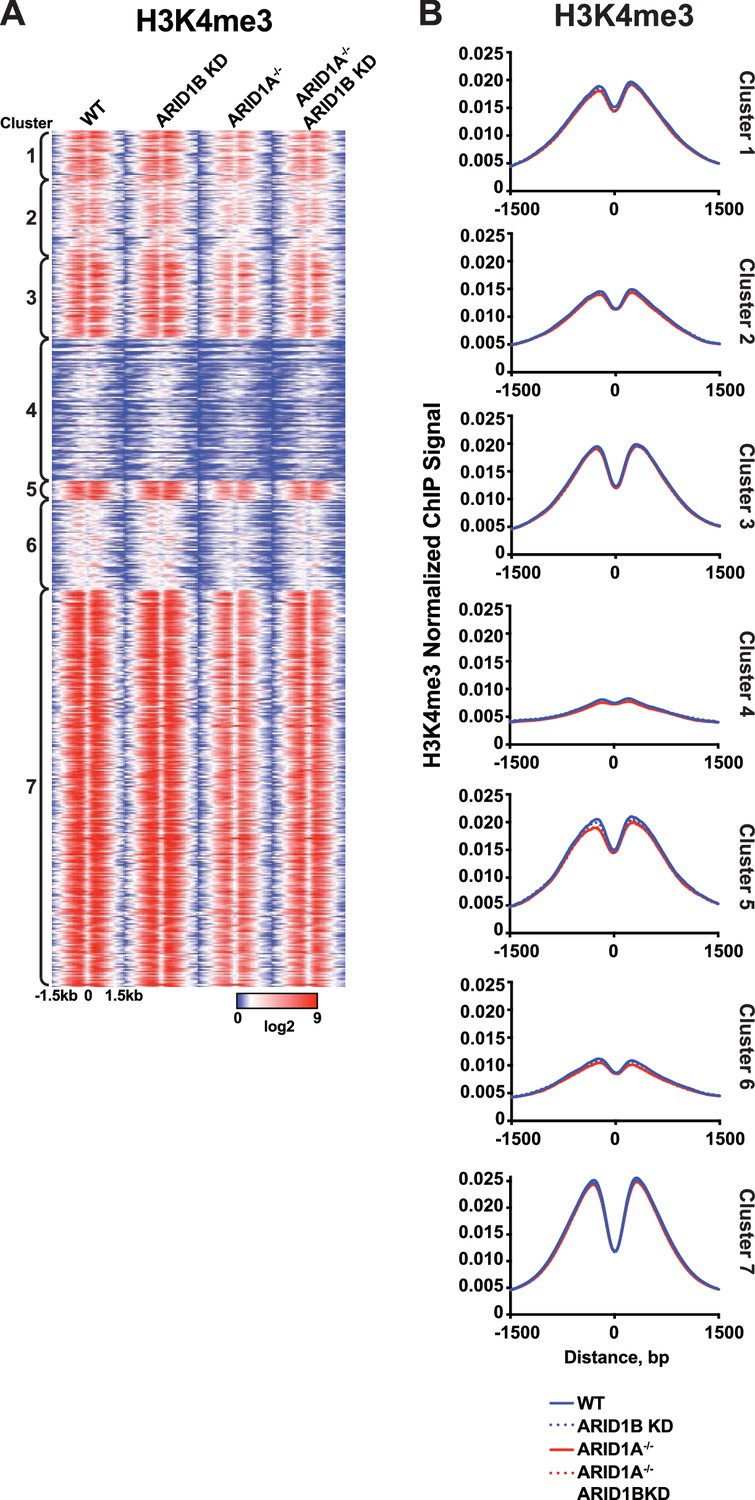
Analysis of H3K4me3 ChIP-seq reads at accessible sites in Clusters 1-7,
(A) ChIP-seq tag density for H3K4me3 at accessible sites from Clusters 1–7 from HCT116 WT, ARID1B KD, ARID1A-/-, and ARID1A-/- ARID1B KD HCT116 cells. Reads centered on middle of accessible region ±1.5 kb. (B) Normalized average ChIP-seq tag density for H3K4me3 from two independent biological replicates at accessible sites from Clusters 1–7 from HCT116 WT, ARID1B KD, ARID1A-/-, and ARID1A-/- ARID1B KD HCT116 cells. Reads centered on middle of accessible region ±1.5 kb.
Figure 3—figure supplement 3

Analysis of H3K4me and H3K27ac ChIP-seq reads at accessible sites in Clusters 1-7,
(A) ChIP-seq tag density for H3K4me at accessible sites from Clusters 1–7 from HCT116 WT, ARID1B KD, ARID1A-/-, and ARID1A-/- ARID1B KD HCT116 cells. Reads centered on middle of accessible region ±1.5 kb. (B) Normalized average ChIP-seq tag density for H3K4me from two independent biological replicates at accessible sites from Clusters 1–7 from HCT116 WT, ARID1B KD, ARID1A-/-, and ARID1A-/- ARID1B KD HCT116 cells. Reads centered on middle of accessible region ±1.5 kb. (C) ChIP-seq tag density for H3K27ac at accessible sites from Clusters 1–7 from HCT116 WT, ARID1B KD, ARID1A-/-, and ARID1A-/- ARID1B KD HCT116 cells. Reads centered on middle of accessible region ±1.5 kb. (D) Normalized average ChIP-seq tag density for H3K27ac from two independent biological replicates at accessible sites from Clusters 1–7 from HCT116 WT, ARID1B KD, ARID1A-/-, and ARID1A-/- ARID1B KD HCT116 cells. Reads centered on middle of accessible region ±1.5 kb.
Figure 4 with 1 supplement
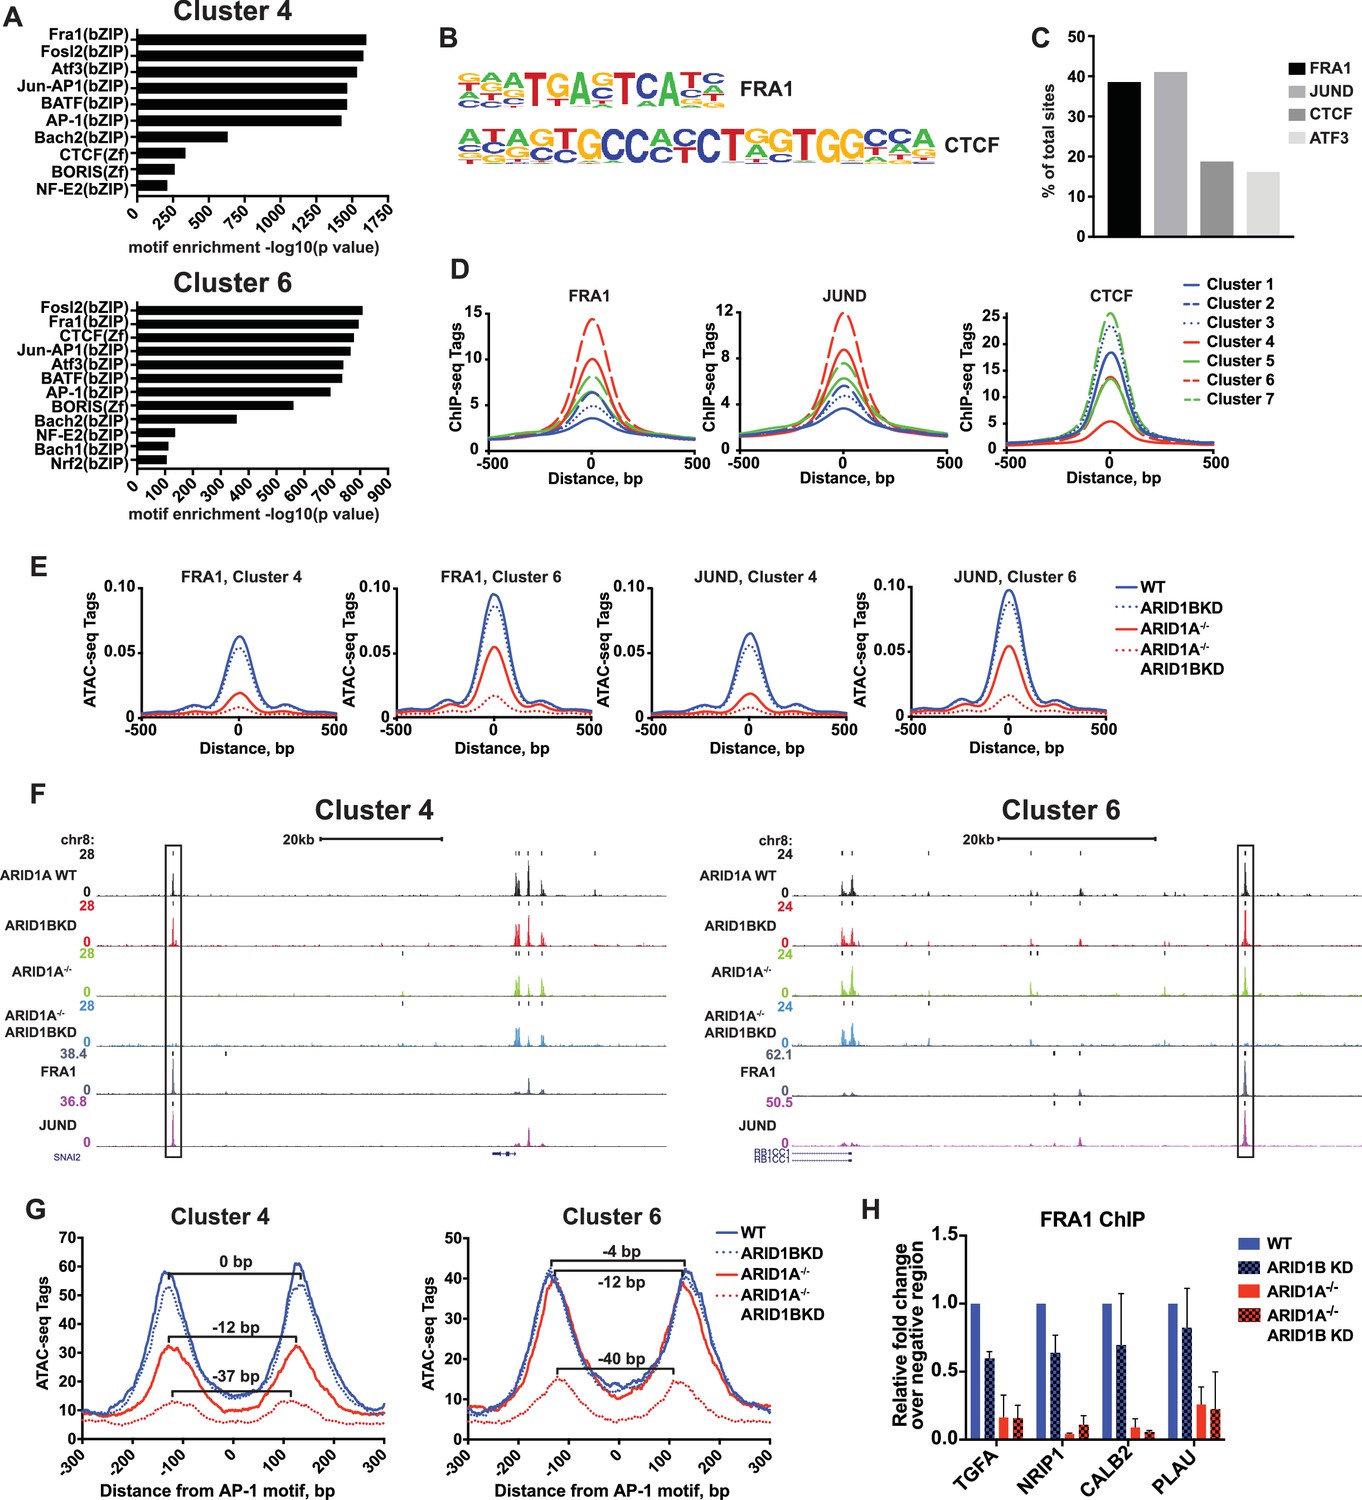
ARID1A/1B are required for the binding of AP-1 transcription factors at accessible sites.
(A) Significance of motif enrichment of known motifs on Cluster 4 and 6 accessible sites. Motif enrichment for Clusters 1–7 can be found in Figure 4—figure supplement 1. (B) Known FRA1 and CTCF motif from HOMER database. (C) Proportion of decreased accessible sites in WT versus ARID1A-/- ARID1B KD HCT116 cells with overlapping ChIP-seq peaks for FRA1, JUND, CTCF and ATF3 from ENCODE ChIP-seq datasets. (D) FRA1, JUND, and CTCF ChIP-seq occupancy at accessible sites in Clusters 1–7. (E) ATAC-seq tag density at FRA1 and JUND binding sites in Clusters 4 and 6 from WT, ARID1B KD, ARID1A-/-, and ARID1A-/- ARID1B KD HCT116 cells. (F) Genome browser tracks of ATAC-seq data (top four tracks) from WT, ARID1B KD, ARID1A-/-, and ARID1A-/- ARID1B KD HCT116 cells and ChIP-seq data from WT HCT116 ENCODE data (bottom two tracks). Representative Cluster 4 and Cluster 6 sites overlapping FRA1 and JUND binding sites are indicated with a black box. (G) Nucleosome spacing for mononucleosome fragments at AP-1 motifs in Clusters 4 and 6. Distance between mononucleosome peaks in ARID1B KD, ARID1A-/-, and ARID1A-/- ARID1B KD HCT116 cells was calculated relative to WT HCT116 cells. (H) FRA1 binding by ChIP-qPCR at two Cluster 4 sites (TGFA, NRIP1) and two Cluster 6 sites (CALB2, PLAU) in ARID1B KD, ARID1A-/-, and ARID1A-/- ARID1B KD HCT116 cells relative to WT HCT116 cells. Values shown are averages from two biological replicates where error bars indicate standard deviation.
-
Figure 4—source data 1
FRA1 occupancy by ChIP-qPCR in WT and ARID1A-/- HCT116 cells with ARID1B knockdown.
FRA1 ChIP levels determined by ChIP-qPCR at TGFA, NRIP1, CALB2, and PLAU1 for wild-type (WT) and ARID1A-/- (ARID1A-/-) HCT116 cells expressing shRNAs to scrambled control (WT) or ARID1B (ARID1B KD). Values were normalized to WT for each primer set. Data is from two independent experiments.
- https://doi.org/10.7554/eLife.30506.015
Figure 4—figure supplement 1
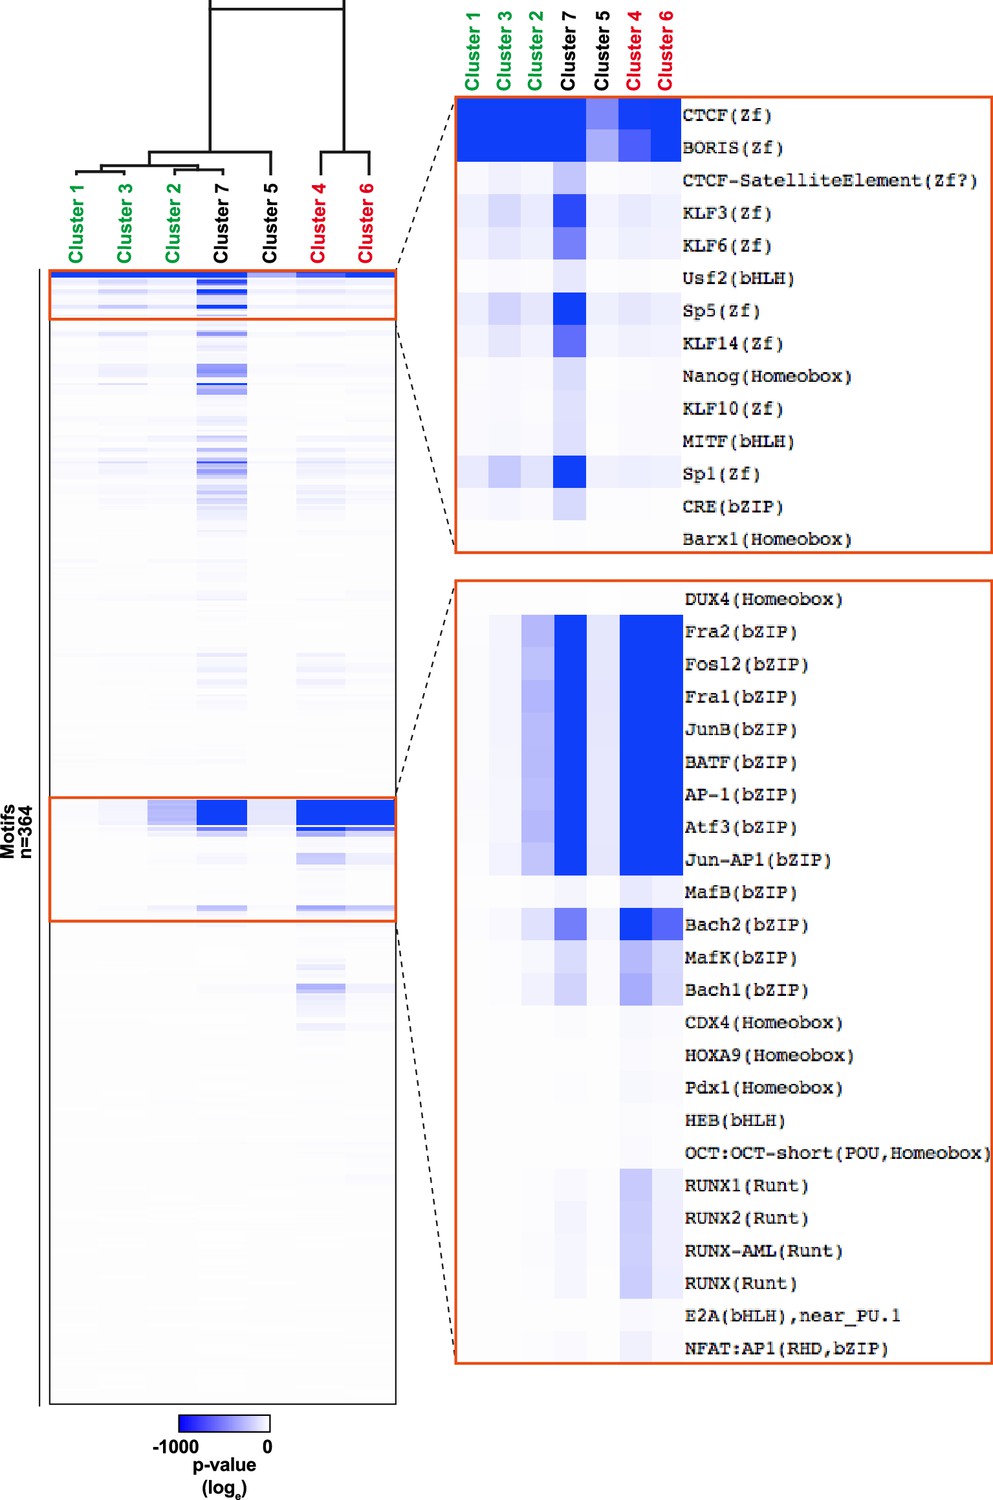
Heatmap of motif enrichment p values (loge) in Clusters 1–7.
https://doi.org/10.7554/eLife.30506.014
Figure 5 with 4 supplements
ARID1A/1B regulate gene expression of cell growth pathway genes by maintaining active enhancer architecture.
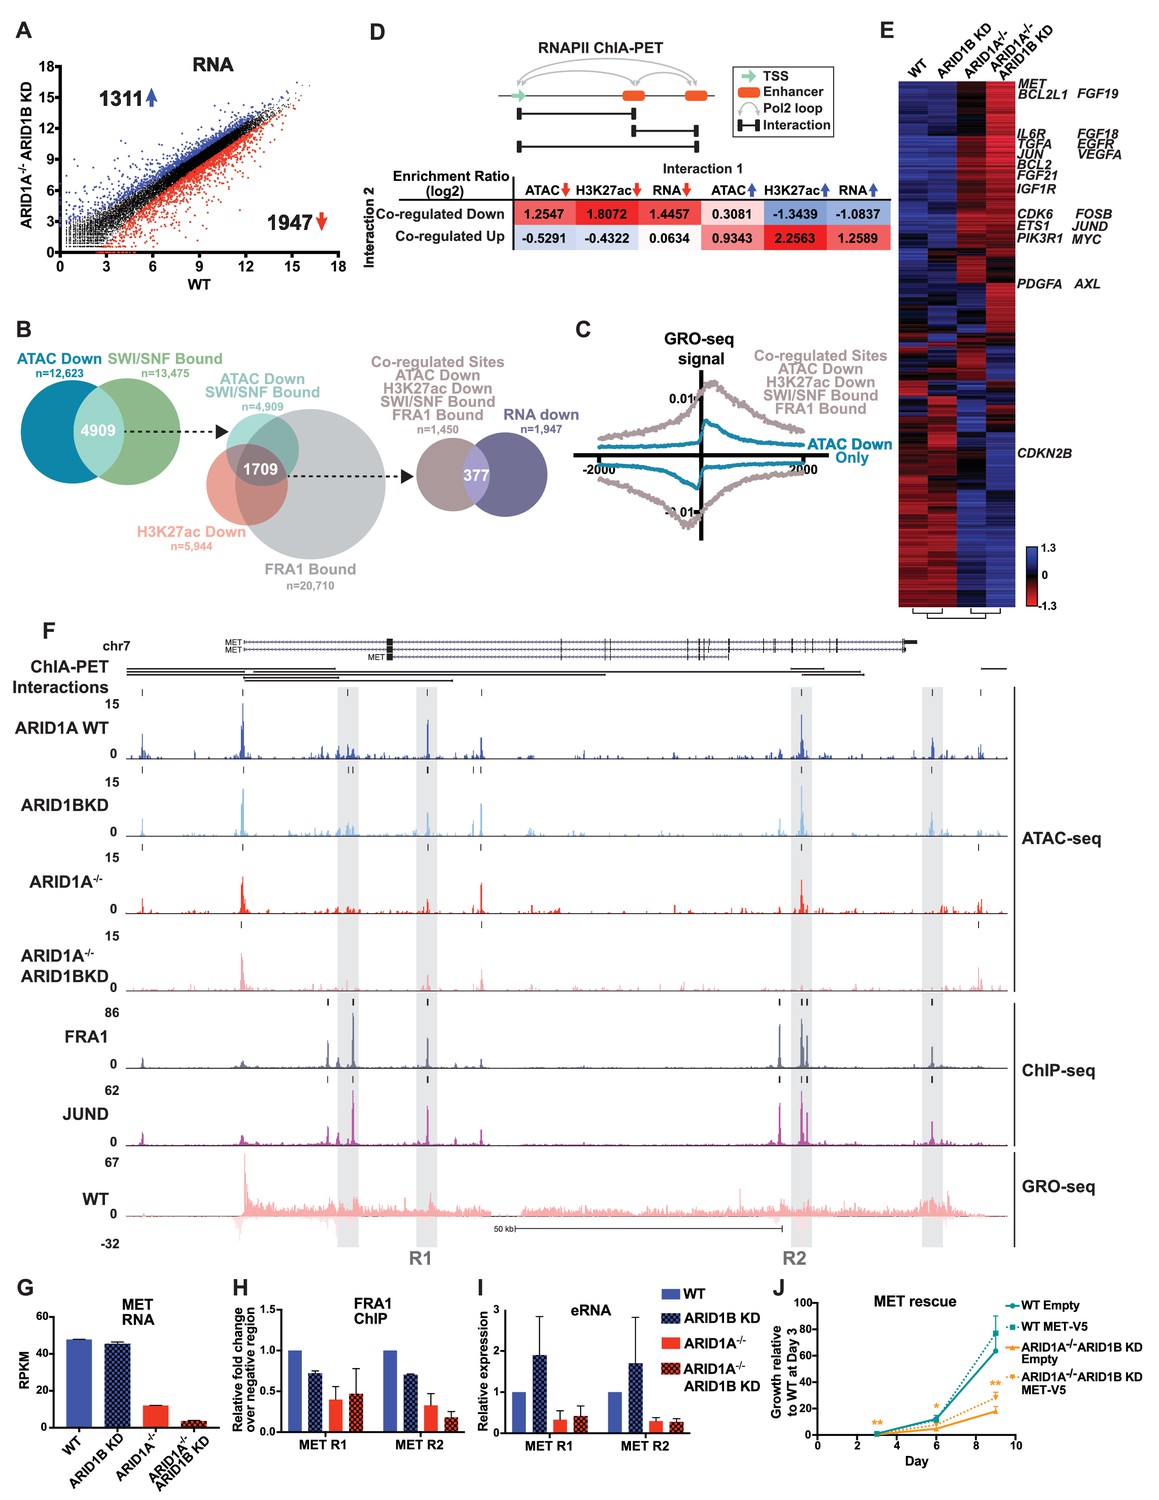
(A) Differentially expressed genes in WT versus ARID1A-/- ARID1B KD HCT116 cells. Blue and red dots represent differential RNA-seq expression increased or decreased by 1.5 fold or more (FDR < 0.05), respectively, from two independent biological replicates. Numbers in upper left and lower right hand corners indicate number of differentially expressed genes. (B) Genomic locations with reduced accessibility in ARID1A-/- ARID1B KD HCT116 cells (ATAC Down) were overlapped with SMARCA4 and/or SMARCC1 binding sites identified in WT HCT116 cells (SWI/SNF Bound). Common positions (ATAC Down, SWI/SNF Bound) were then overlapped with reduced H3K27ac sites in ARID1A-/- ARID1B KD cells (H3K27ac Down) and FRA1-bound sites identified in WT HCT116 cells (FRA1 Bound). Co-regulated sites (ATAC Down, H3K27ac Down, SWI/SNF Bound, FRA1 Bound) were annotated and overlapped with genes downregulated in ARID1A-/-/ARID1B KD cells (RNA Down). 377 genes were identified with SWI/SNF- and FRA1 binding and decreased accessibility, H3K27ac and RNA expression. Examples of co-regulated down sites in and around TGFA, TGFBR2, PLAU, and EGFR can be found in Figure 5—figure supplement 1. (C) GRO-seq signal at co-regulated sites (ATAC Down, H3K27ac Down, SWI/SNF Bound, FRA1 Bound) compared to sites that are not bound by SWI/SNF or FRA1 but demonstrated reduced accessibility (ATAC Down Only). (D) Observed/expected enrichment ratio (log2) for interactions between transcription start sites (TSSs) and regulatory regions through chromatin looping. Sites bound by SWI/SNF and FRA1 and exhibiting reduced accessibility and H3K27ac (Co-regulated Down) were compared to sites with decreased/increased accessibility (ATAC Down/Up), sites with decreased/increased H3K27ac (H3K27ac Down/Up), or TSSs of genes with decreased/increased expression (RNA Down/Up). Examples of interacting co-regulated down sites in and around TGFA, TGFBR2, PLAU, and EGFR can be found in Figure 5—figure supplement 1. The same analysis was applied to sites exhibiting increased accessibility and H3K27ac (Co-regulated Up). Examples of interacting co-regulated up sites in and around ANXA10, BMP4, WLS, and OBFC1 can be found in Figure 5—figure supplement 2. (E) Hierarchical clustering of 7890 genes increased or decreased by ≥1.5 fold gene expression from RNA-seq of WT, ARID1B KD, ARID1A-/-, and ARID1A-/-ARID1B KD HCT116 cells. KEGG pathway analysis of affected genes can be found in Figure 5—figure supplement 3. (F) Regulatory regions in and around the MET gene. Gray boxes indicate sites with decreased accessibility in ARID1A-/- ARID1B KD HCT116 cells that are bound by the AP-1 complex and have GRO-seq signal. Not shown: ChIP-seq tracks demonstrating that gray boxed sites are also bound by SMARCA4 and SMARCC1 and have decreased H3K27ac in ARID1A-/- ARID1B KD HCT116 cells. (G) MET expression from RNA-seq. Error bars indicate standard deviation for two independent replicates. (H) FRA1 ChIP levels determined by ChIP-qPCR at R1 and R2 (see 5F) within MET. Averages from two independent experiments are shown with standard deviation. (I) Enhancer RNA levels determined by RT-qPCR at R1 and R2 (see 5F) within MET. Averages from three independent experiments are shown with standard deviation. (J) Growth of WT and ARID1A-/- ARID1B KD cells with forced expression of MET (MET-V5) or empty vector (Empty) as control. Protein expression of MET and V5 is shown in Figure 5—figure supplement 4. Averages from three replicates from two different infections. *p<0.05; **p<0.01.
-
Figure 5—source data 1
FRA1 occupancy by ChIP-qPCR at MET regions in WT and ARID1A-/- HCT116 cells with ARID1B knockdown.
FRA1 ChIP levels determined by ChIP-qPCR at R1 and R2 within MET for wild-type (WT) and ARID1A-/- (ARID1A-/-) HCT116 cells expressing shRNAs to scrambled control (WT) or ARID1B (ARID1B KD). Values were normalized to WT for each primer set. Data is from two independent experiments.
- https://doi.org/10.7554/eLife.30506.021
-
Figure 5—source data 2
eRNA level at MET regions in WT and ARID1A-/- HCT116 cells with ARID1B knockdown.
eRNA levels determined by qPCR at R1 and R2 within MET for wild-type (WT) and ARID1A-/- (ARID1A-/-) HCT116 cells expressing shRNAs to scrambled control (WT) or ARID1B (ARID1B KD). Values were normalized to WT for each primer set. Data is from two independent experiments.
- https://doi.org/10.7554/eLife.30506.022
-
Figure 5—source data 3
Proliferation of cells with forced MET expression in WT and ARID1A-/- HCT116 cells with ARID1B knockdown.
Relative proliferation as determined by CellTiterGlo over 9 days in wild-type (WT) and ARID1A-/- (ARID1A-/-) HCT116 cells expressing shRNAs to scrambled control (WT) or ARID1B (ARID1B KD) with forced MET expression (MET) or empty vector control (Empty), normalized to WT Empty or WT MET at day 3. Data shown from three replicates from two different infections.
- https://doi.org/10.7554/eLife.30506.023
-
Figure 5—source data 4
MET protein expression in WT and ARID1A-/- HCT116 cells with ARID1B knockdown.
Relative MET protein expression as determined by western blotting in wild-type (WT) and ARID1A-/- (ARID1A-/-) HCT116 cells expressing shRNAs to scrambled control (WT) or ARID1B (ARID1B KD), normalized to WT control. Data shown from three biological replicates.
- https://doi.org/10.7554/eLife.30506.024
-
Figure 5—source data 5
MET protein expression in WT and ARID1A-/- HCT116 cells with ARID1B knockdown with forced MET expression.
Relative MET protein expression as determined by western blotting in wild-type (WT) and ARID1A-/- (ARID1A-/-) HCT116 cells expressing shRNAs to scrambled control (WT) or ARID1B (ARID1B KD) with forced MET expression (MET) or empty vector control (Empty), normalized to WT control. Data shown from three biological replicates.
- https://doi.org/10.7554/eLife.30506.025
Figure 5—figure supplement 1
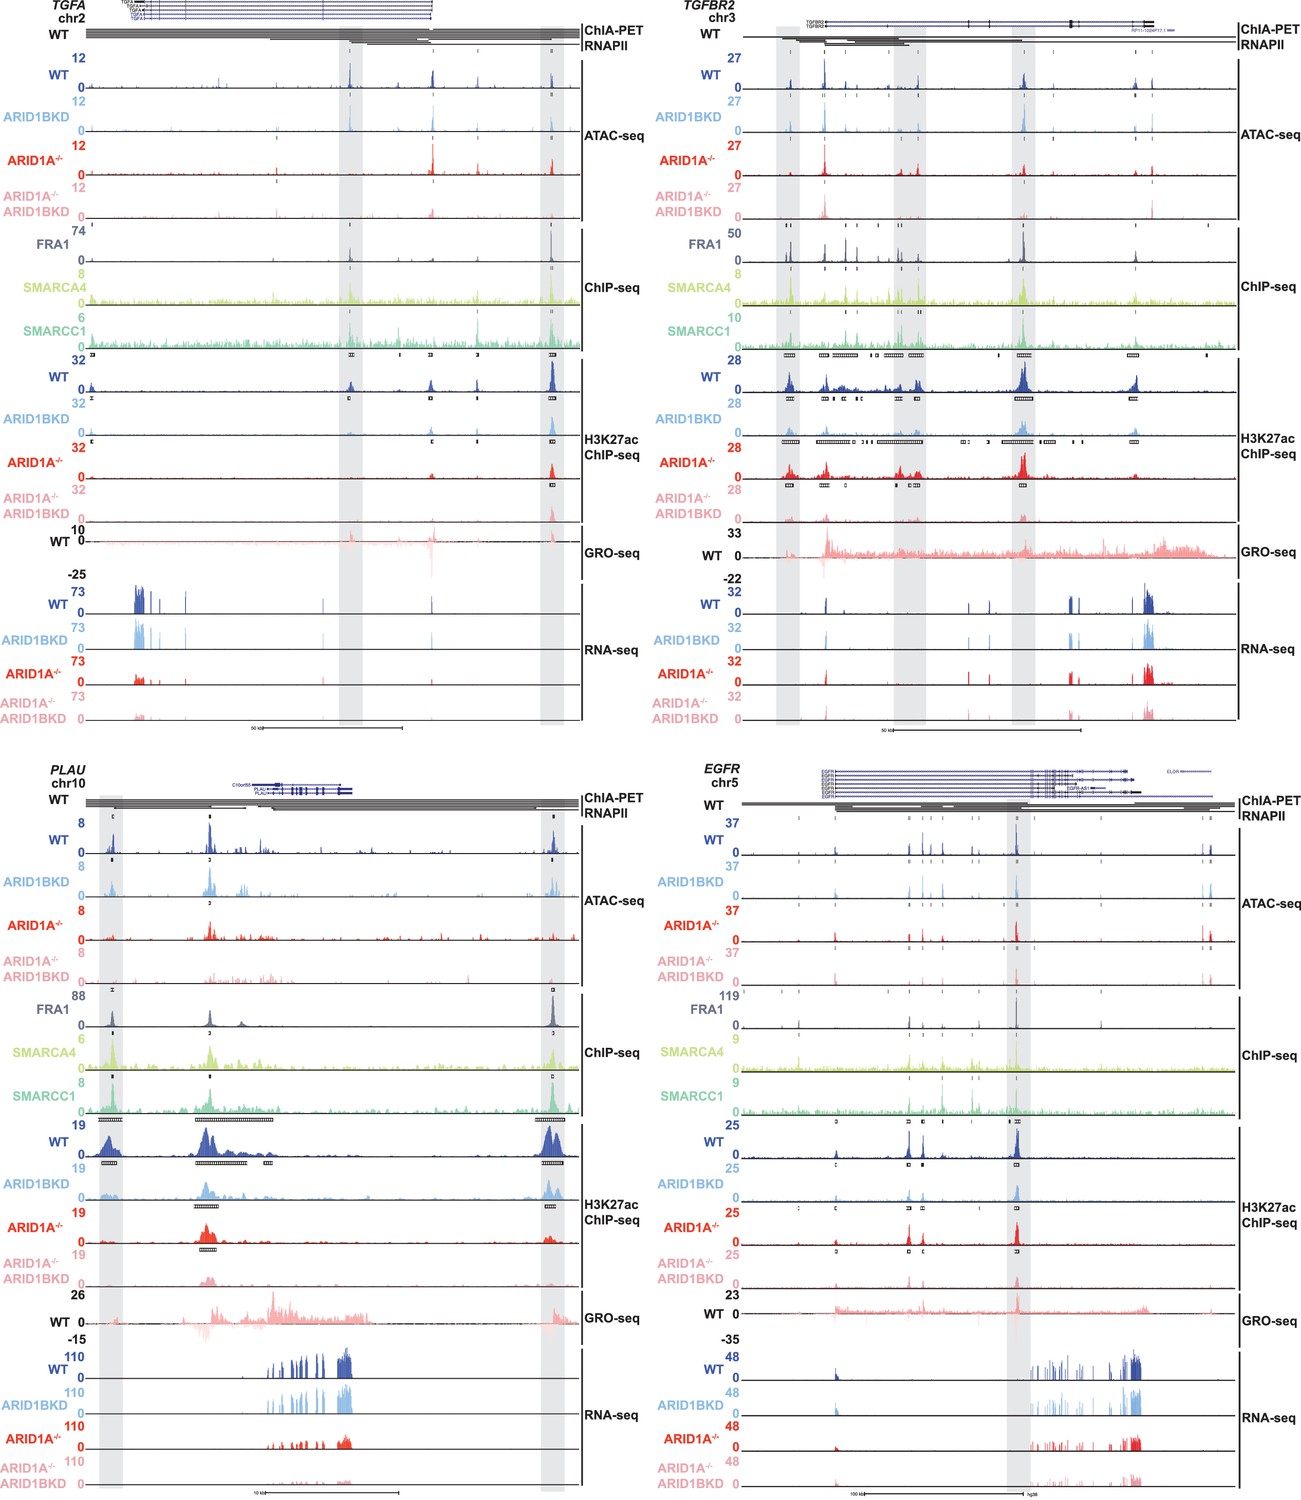
Genome browser tracks of representative downregulated genes in ARID1A-/- ARID1B KD cells.
Genome browser tracks for POLR2A ChIA-PET interactions for WT HCT116 cells, ATAC-seq from WT, ARID1B KD, ARID1A-/-, and ARID1A-/- ARID1B KD cells, FRA1, SMARCA4 and SMARCC1 ChIP-seq data from WT HCT116 cells, H3K27ac ChIP-seq data for WT, ARID1B KD, ARID1A-/-, and ARID1A-/- ARID1B KD cells, GRO-seq data for WT HCT116 cells, and RNA-seq from WT, ARID1B KD, ARID1A-/-, and ARID1A-/- ARID1B KD cells at the TGFA, TGFBR2, PLAU, and EGFR genes. Gray boxes indicate examples of intergenic accessible regions with SMARCA4, SMARCC1, and FRA1 binding in WT HCT116 cells, decreased accessibility and H3K27ac levels in ARID1A-/- ARID1B KD cells, which exhibit POLR2A ChIA-PET interactions to promoters of genes downregulated in ARID1A-/- ARID1B KD cells.
Figure 5—figure supplement 2
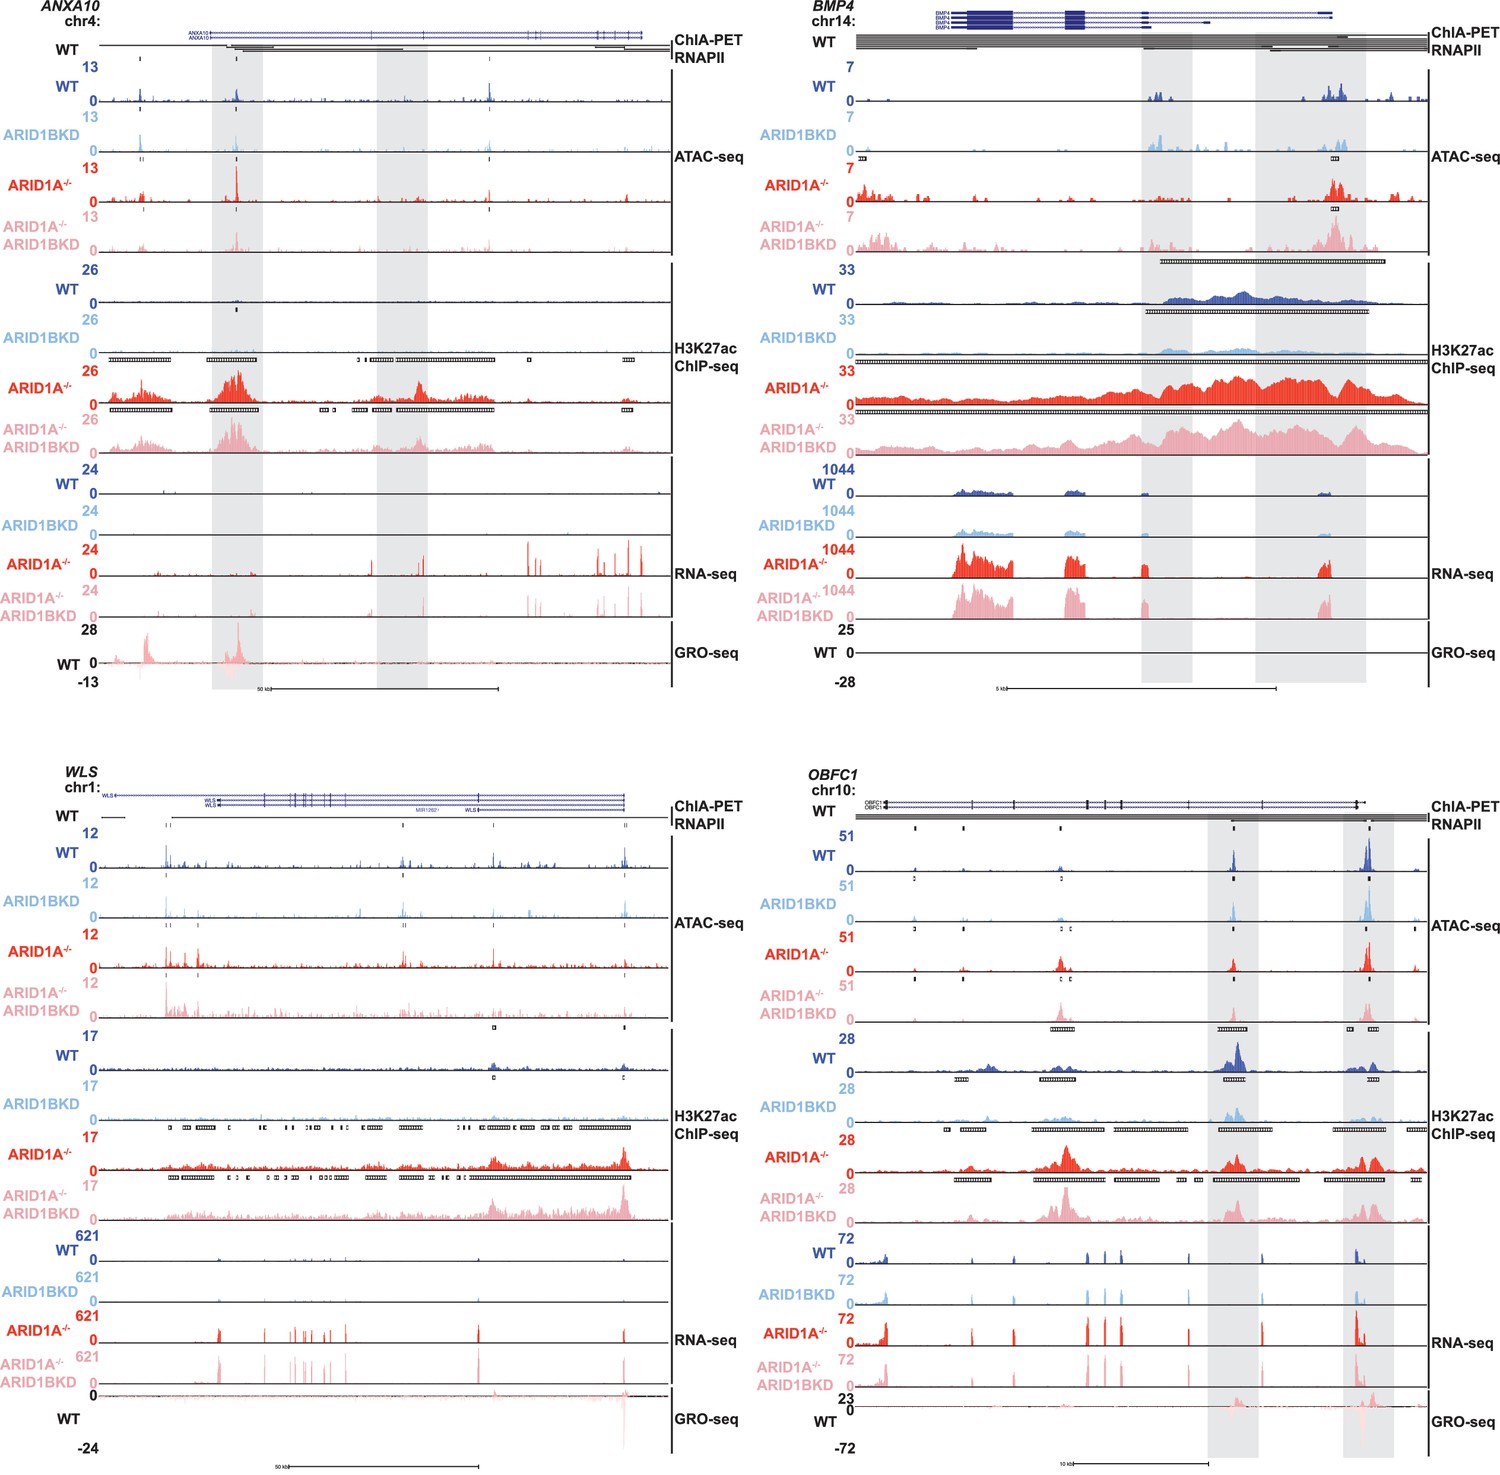
Genome browser tracks of representative upregulated genes in ARID1A-/- ARID1B KD cells.
Genome browser tracks for ATAC-seq from WT, ARID1B KD, ARID1A-/-, and ARID1A-/- ARID1B KD cells, H3K27ac ChIP-seq data for WT, ARID1B KD, ARID1A-/-, and ARID1A-/- ARID1B KD cells, RNA-seq from WT, ARID1B KD, ARID1A-/-, and ARID1A-/- ARID1B KD cells, and GRO-seq data for WT HCT116 cells at sites with gained or stable SWI/SNF occupancy. Gray boxes indicate interacting sites of increased accessibility and/or H3K27ac. These genes show no dependence on ARID1B for accessibility, H3K27ac and RNA expression in the absence of ARID1A.
Figure 5—figure supplement 3
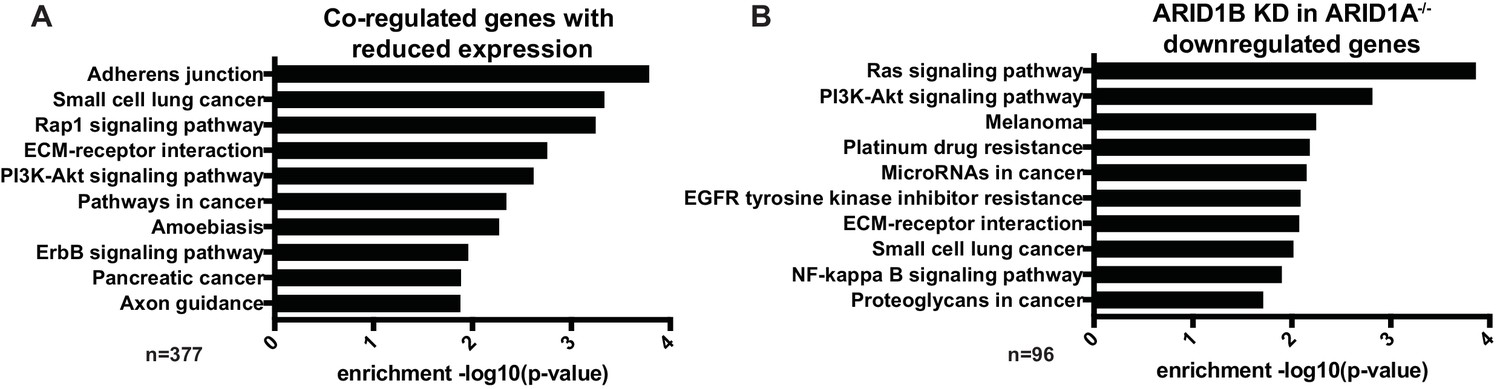
KEGG pathway analysis of ARID1A/1B-dependent genes reveals enrichment in Ras/PI3K-Akt signaling pathways.
(A) Enrichment of KEGG Pathway terms on 377 genes with reduced expression in ARID1A-/- ARID1B KD cells that exhibit decreased accessibility and H3K27ac at regulatory regions following ARID1A/ARID1B loss and are bound by SWI/SNF and FRA1. (B) Enrichment of KEGG Pathway terms for genes downregulated by ARID1B KD in ARID1A-/- HCT116 cells.
Figure 5—figure supplement 4
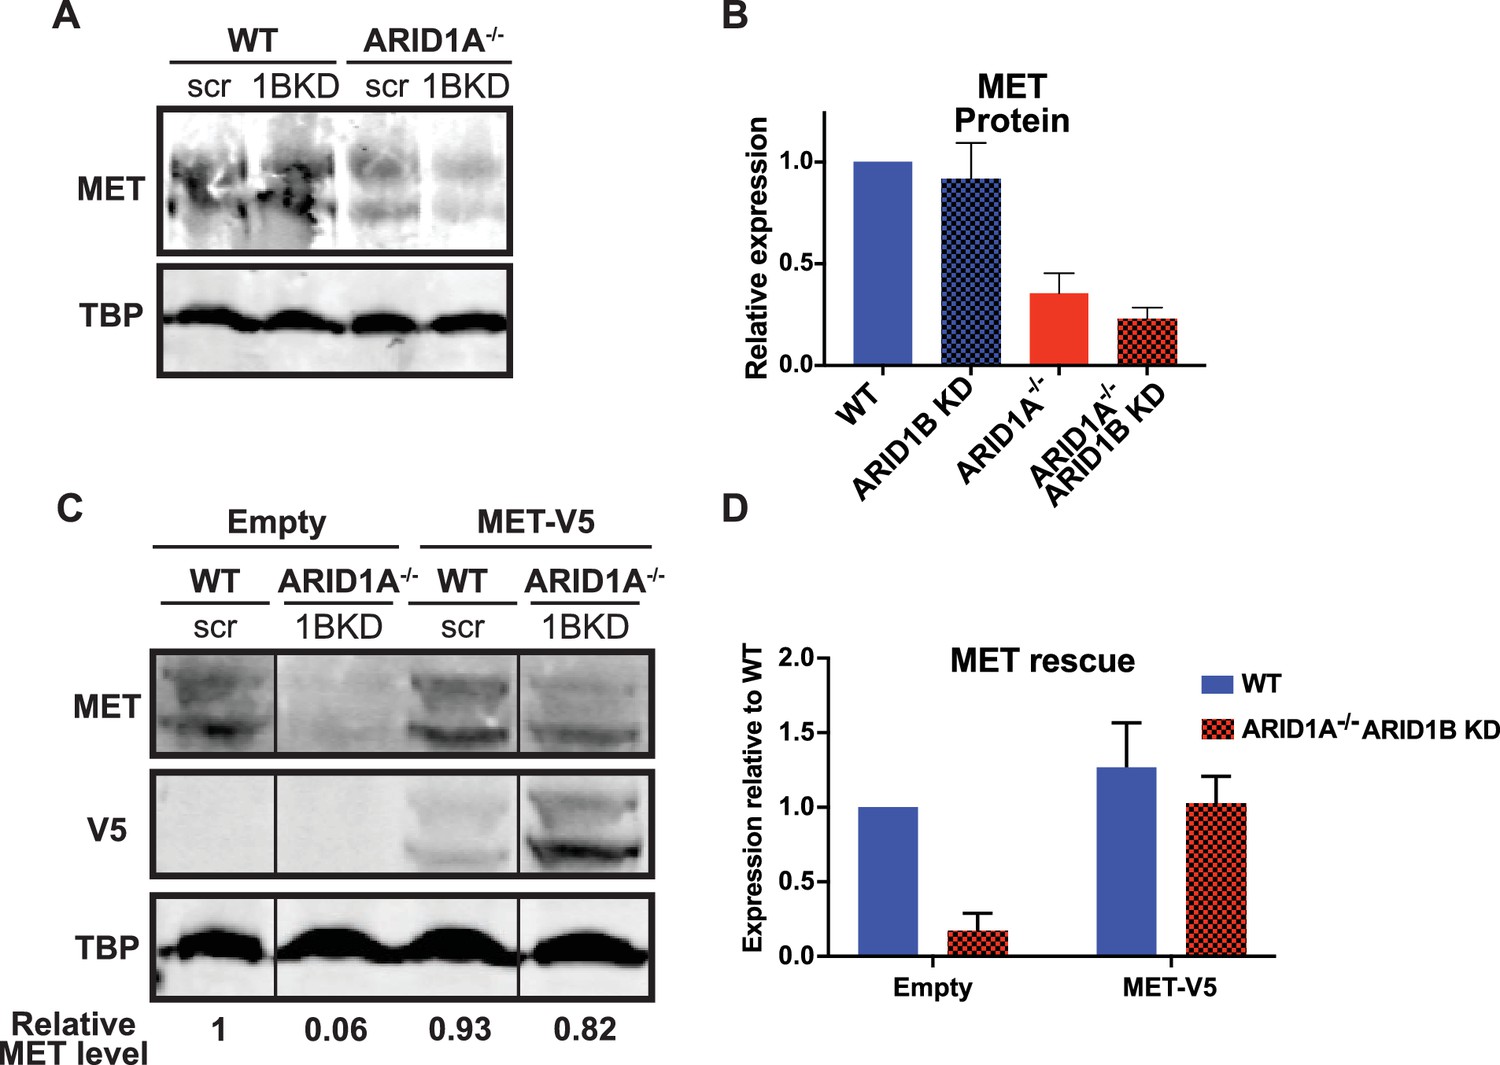
MET protein expression is ARID1A/1B-dependent in HCT116 cells, but can be reconstituted by forced expression of MET.
(A) Western blot of MET expression in WT and ARID1A-/- cells expressing scrambled or ARID1B shRNA. (B) MET protein expression determined by western blotting in WT and ARID1A-/- cells expressing scrambled or ARID1B shRNA. Average relative expression from three independent experiments. (C) Western blot of MET and V5 expression in WT and ARID1A-/- cells expressing scrambled or ARID1B shRNA and pLX_Empty or pLX_MET-V5. Representative of three independent experiments from three separate infections. (D) MET protein expression determined by western blotting in WT and ARID1A-/- cells expressing scrambled or ARID1B shRNA and pLX_Empty or pLX_MET-V5. Average relative expression from three independent experiments from three separate infections.
Figure 6
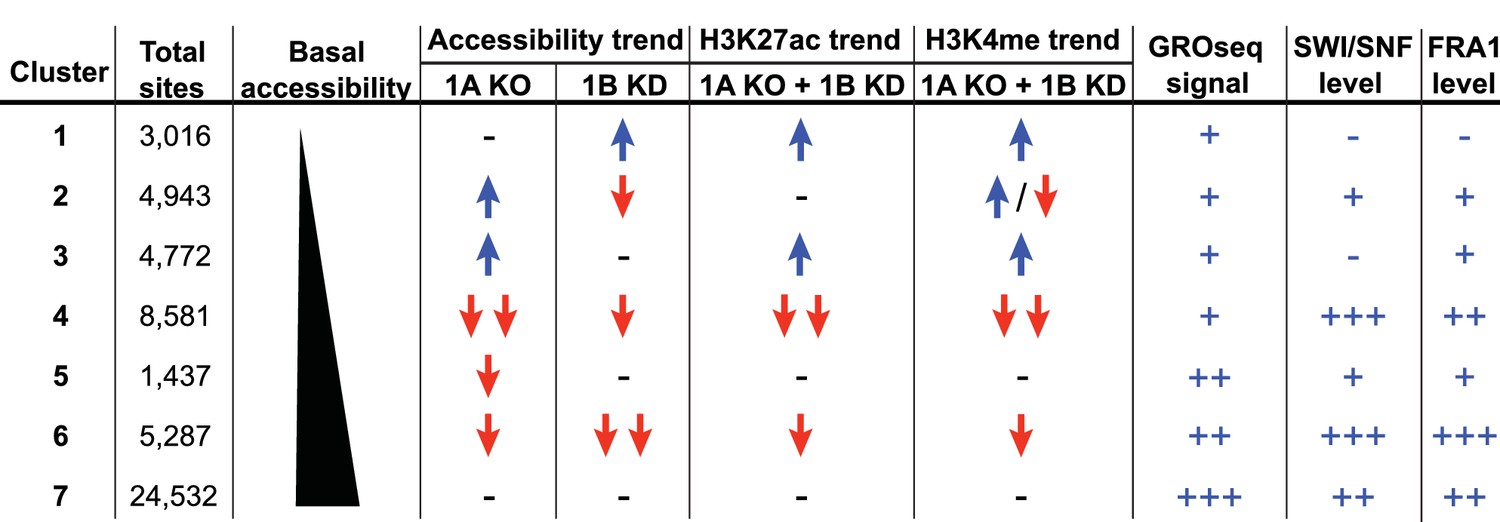
Summary of ARID1A/1B dependent changes in Clusters 1–7.
Blue arrows indicate increased, red arrows indicate decreased. Signal strength is represented as negative (-−), low (+), moderate (++), and high (+++).
Figure 7 with 2 supplements
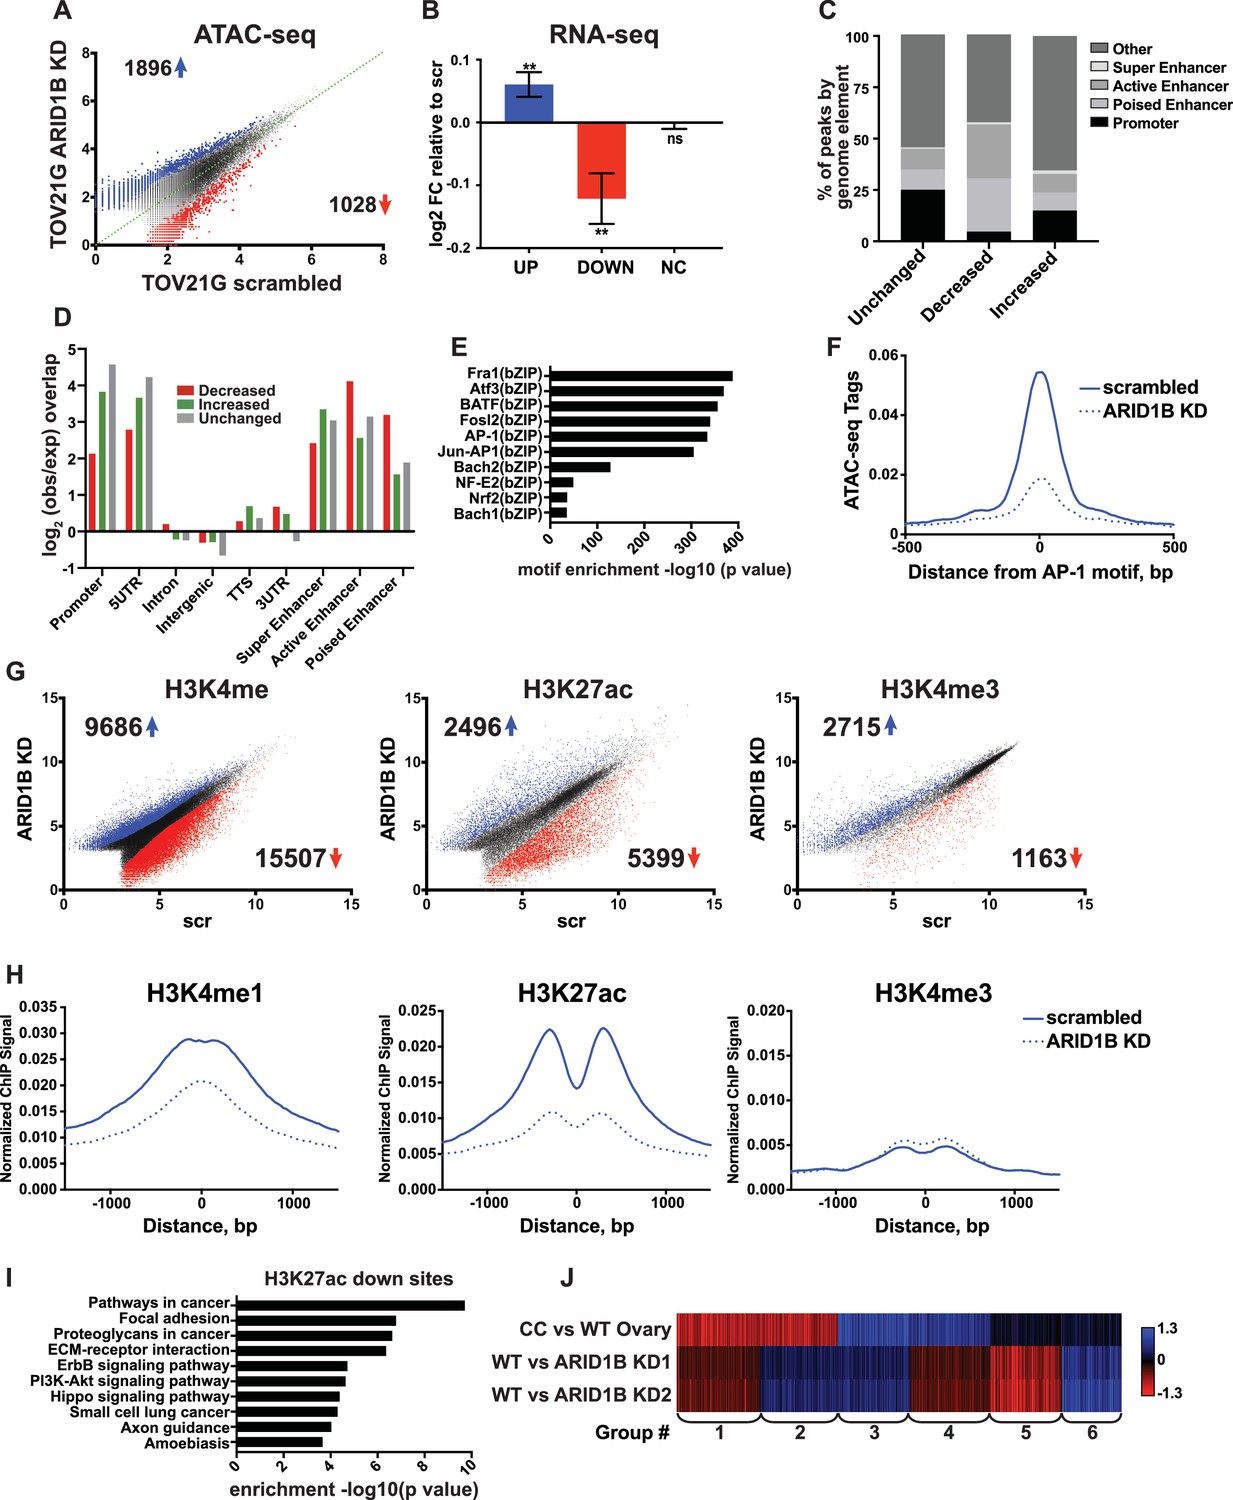
ARID1B function at enhancers is conserved in ARID1A mutant ovarian clear cell carcinoma cells.
(A) ATAC-seq differential peaks in TOV21G cells expressing shRNAs to scrambled control (scrambled) or ARID1B (ARID1B KD). Cell lines were validated for ARID1B expression and function (Figure 7—figure supplement 1). Blue and red dots represent differential ATAC-seq peaks whose read density is increased or decreased by 1.5 fold or more, FDR < 0.05, respectively, from two independent biological replicates. Numbers in the upper left and lower right corners refer to numbers of called peaks increasing or decreasing in accessibility. (B) Log2 fold change in RNA expression for genes nearest to differentially called accessible sites. Changes are shown for top 10% of genes from increased, decreased, or unchanged (NC) accessible sites for ARID1B KD cells relative to scrambled TOV21G cells. Ns, not significant; **, p<0.01. (C) Percent of unchanged, increased, and decreased accessible sites called from scrambled versus ARID1B KD TOV21G cells present in promoters, poised enhancers, active enhancers, super enhancers, or other genomic elements. (D) Enrichment of unchanged, increased, and decreased accessible sites called from scrambled versus ARID1B KD TOV21G cells at promoters, poised enhancers, active enhancers, super enhancers, 5' and 3' untranslated regions (UTR), introns, intergenic regions, and transcription termination sites (TTS). (E) Motif enrichment in decreased accessible sites from scrambled versus ARID1B KD TOV21G cells. (F) ATAC-seq tag density at AP-1 motifs in scrambled and ARID1B KD TOV21G cells. (G) Differential peak calls from H3K27ac, H3K4me, or H3K4me3 ChIP-seq from TOV21G cells expressing shRNAs to scrambled control (scr) versus shRNAs to ARID1B (ARID1B KD). Blue and red dots represent differential ChIP-seq peaks whose read density increased or decreased by 1.5 fold or more, FDR < 0.05, respectively, from two independent biological replicates. Numbers in the upper left and lower right corners refer to numbers of increased and decreased peaks. (H) Normalized average ChIP-seq tag density for H3K4me, H3K27ac and H3K4me3 from two independent biological replicates at decreased accessible sites from WT and ARID1B KD TOV21G cells. Reads are centered on middle of accessible region ±1.5 kb. Normalized ChIP-seq tag density for H3K4me, H3K27ac and H3K4me3 at increased accessible sites from WT and ARID1B KD TOV21G cells can be found in Figure 7—figure supplement 2. (I) Pathway analysis for accessible sites with reduced H3K27ac in ARID1B KD TOV21G cells. (J) k-means clustering of 4878 differentially expressed genes in TOV21G cells expressing shRNAs to scrambled control (scrambled) or ARID1B (ARID1B KD1, KD2) from two independent biological replicates compared to expression in ovarian clear cell carcinoma versus normal ovaries (CC vs WT Ovary).
-
Figure 7—source data 1
Proliferation of TOV21G cells with ARID1B knockdown.
Proliferation over 9 days, as determined by CellTiterGlo. Data shown in luminescence units from two independent biological replicates with averages and standard deviation.
- https://doi.org/10.7554/eLife.30506.030
Figure 7—figure supplement 1
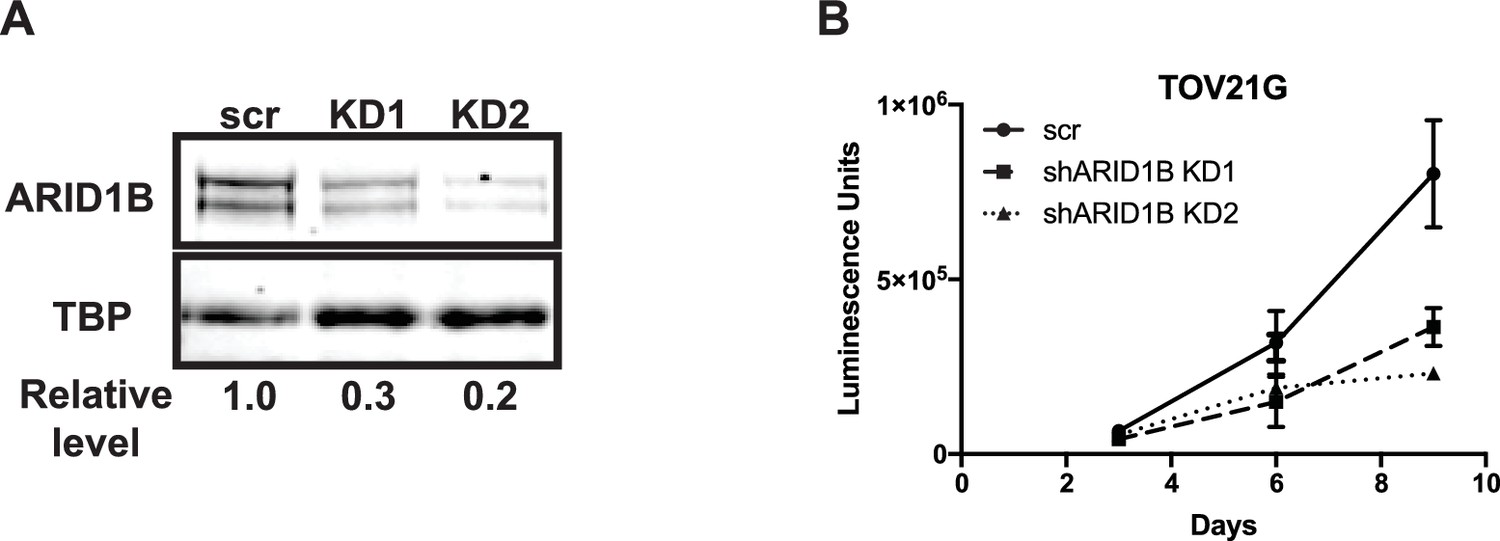
Knockdown of ARID1B is synthetically lethal with ARID1A mutation in ovarian clear cell carcinoma.
(A) Western blot of ARID1B expression in TOV21G cells with shRNAs to scrambled control (scr) or ARID1B (KD1, KD2). TBP used as loading control. Representative of two independent biological replicates. (B) CellTiterGlo measurements at 3, 6, or 9 days of growth of TOV21G cells expressing shRNAs to scrambled control (scr) or ARID1B (shARID1B KD1, shARID1B KD2). Averages shown from two independent biological replicates with standard deviation.
Figure 7—figure supplement 2
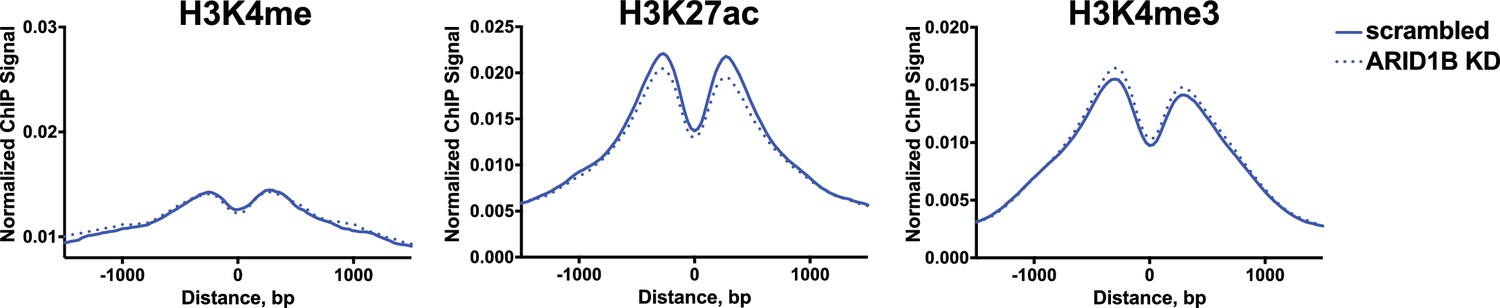
Normalized average ChIP-seq tag density for H3K4me, H3K27ac, and H3K4me from two independent biological replicates at increased accessible sites from scrambled or ARID1B KD TOV21G cells.
Reads centered on middle of accessible region ±1.5 kb.
Additional files
-
Supplementary file 1
Sequencing metrics for datasets generated in the current study
- https://doi.org/10.7554/eLife.30506.032
-
Transparent reporting form
- https://doi.org/10.7554/eLife.30506.033
Download links
A two-part list of links to download the article, or parts of the article, in various formats.
Downloads (link to download the article as PDF)
Open citations (links to open the citations from this article in various online reference manager services)
Cite this article (links to download the citations from this article in formats compatible with various reference manager tools)
Chromatin accessibility underlies synthetic lethality of SWI/SNF subunits in ARID1A-mutant cancers
eLife 6:e30506.
https://doi.org/10.7554/eLife.30506


