Autophagic cell death is dependent on lysosomal membrane permeability through Bax and Bak
- University of Cincinnati, United States
- Howard Hughes Medical Institute, United States
Figures
Figure 1 with 1 supplement
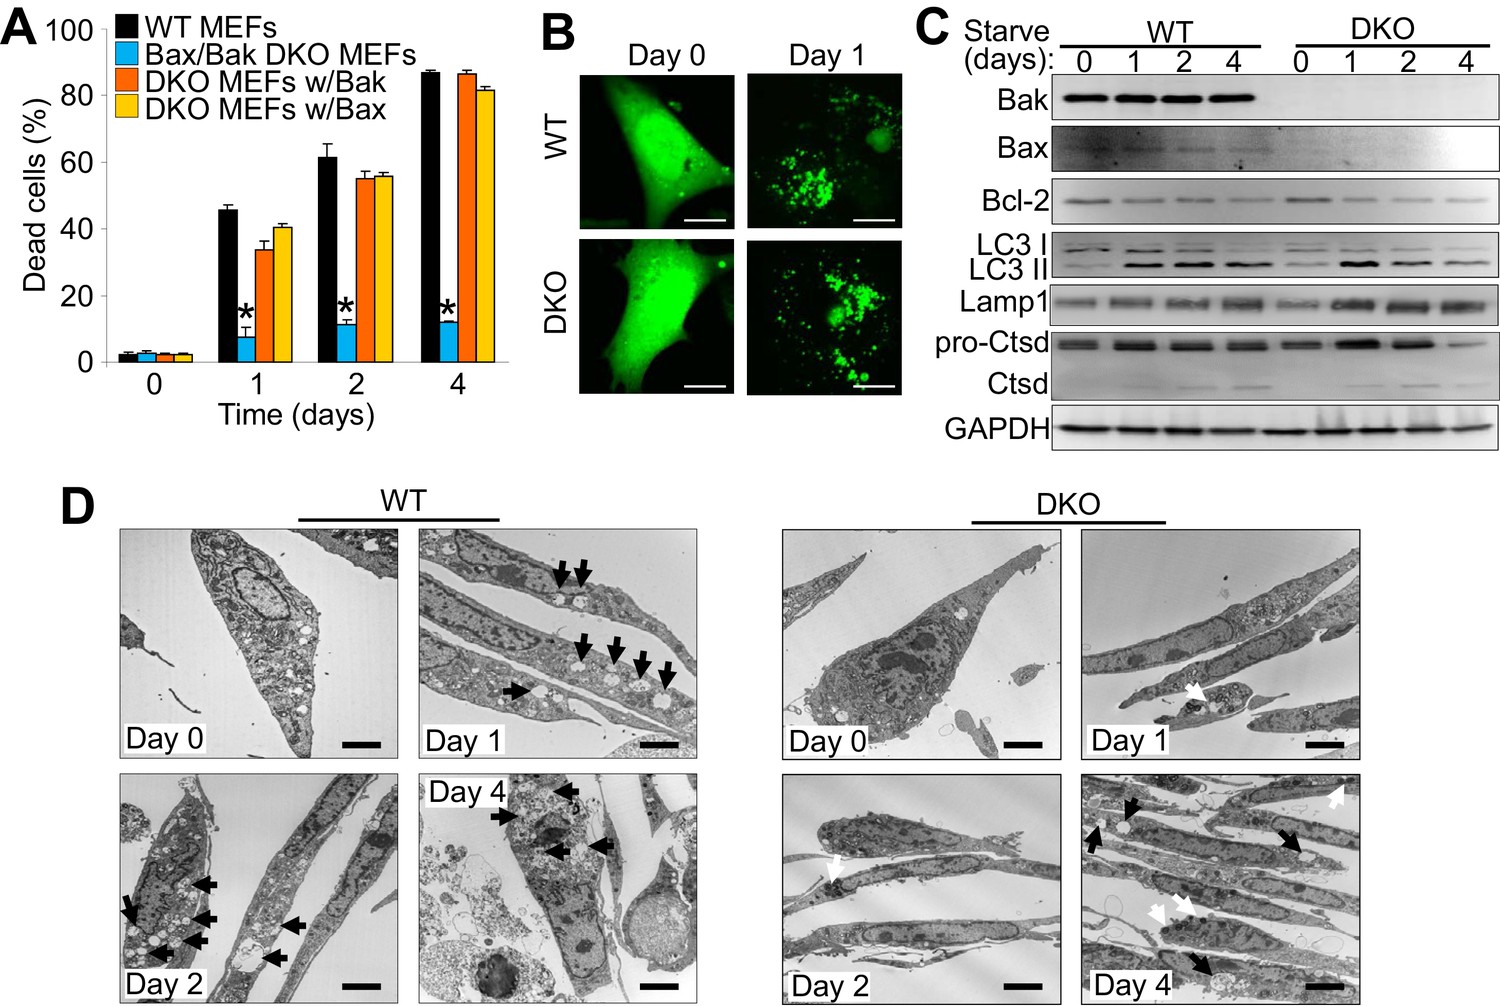
The expression of Bax or Bak are required for autophagic cell death.
(A) Wild type (WT) mouse embryonic fibroblasts (MEFs), Bax/Bak1 double knockout (DKO) MEFs, and DKO MEFs stably expressing Bax or Bak1 were subjected to serum starvation for the indicated time points and cell death was measured by loss of membrane integrity. (B) Confocal images of WT and DKO MEFs that were infected with an LC3-GFP (green fluorescence) adenovirus and were untreated (0) or subjected to serum starvation for 1 day. The figure shows punctate LC3 at 1 day in both types of MEFs. Scale bars = 5 μm. (C) Western blot analysis of Bax, Bak, Bcl-2, LC3, Lamp1, Cathepsin D (Ctsd), and GAPDH (control) in WT and DKO MEFs during serum starvation for the indicated time points in days. (D) Transmission electron microscopic (EM) images (10,000x) of WT and DKO MEFs at baseline or serum starved up to 4 days. Black arrows highlight autophagic-like vacuoles and lysosomes. White Arrows show punctate bodies that are specific to the DKO cells with starvation. Scale bars = 2.5 μm. All assays are representative of three independent experiments. Averages are shown and error bars represent the standard error of the mean. *p<0.05 vs 0 time point. Statistical significance was determined by students t-test.
-
Figure 1—source data 1
Raw western gel images for Figure 1C.
- https://doi.org/10.7554/eLife.30543.004
Figure 1—figure supplement 1
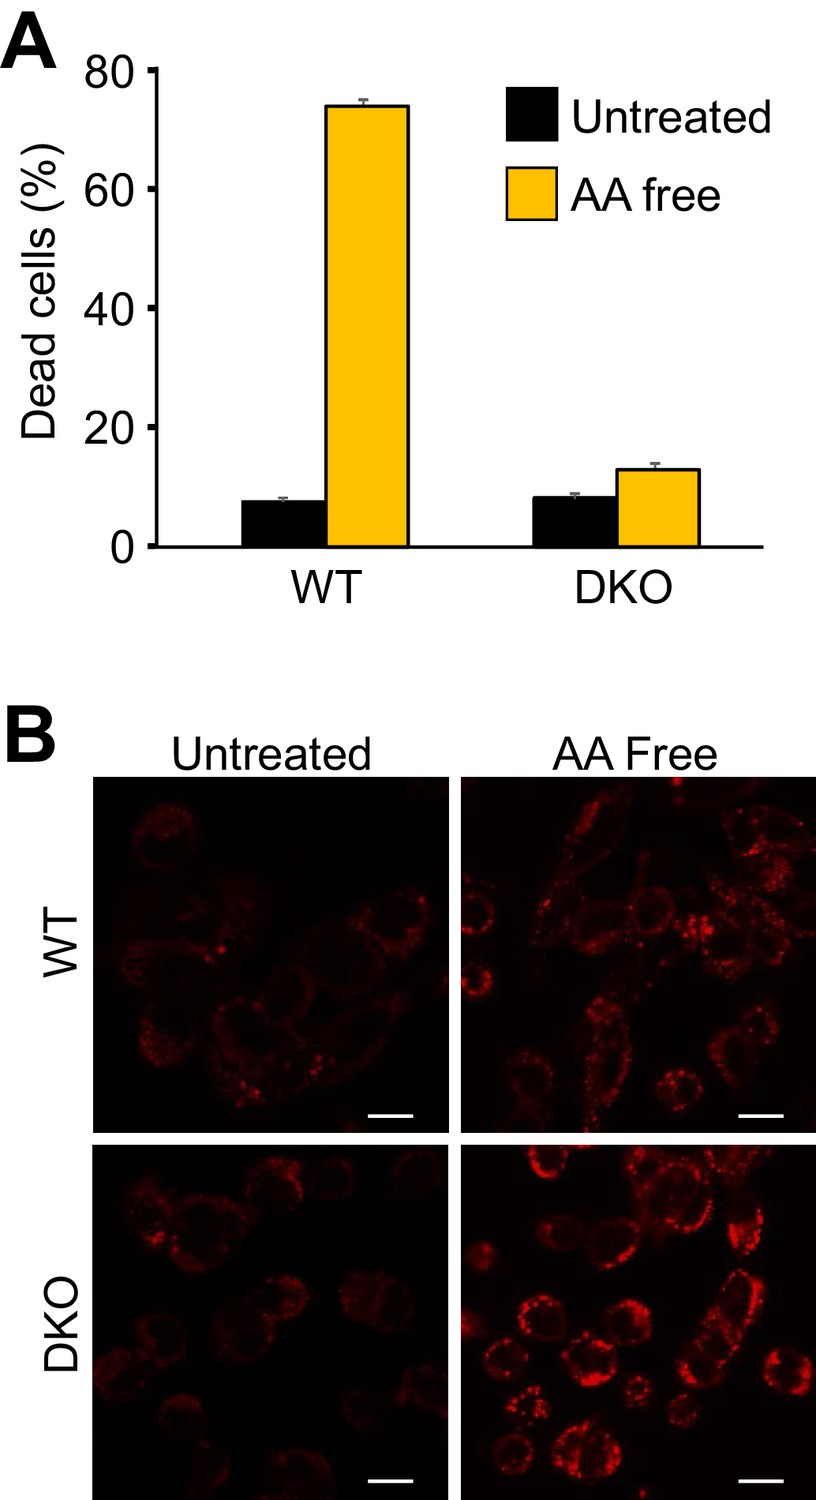
The Expression of Bax or Bak are required for autophagic cell death induced by amino acid deprivation.
(A) WT and DKO MEFs were subjected to amino acid-free media for 4 days and cell death was measured by loss of membrane integrity. (B) Confocal images of LysoTracker red fluorescence in amino acid-starved WT and DKO MEFs for 0 (untreated) and 2 days. Scale bars = 5 μm. Similar results were observed across three independent experiments in all panels.
Figure 2 with 1 supplement
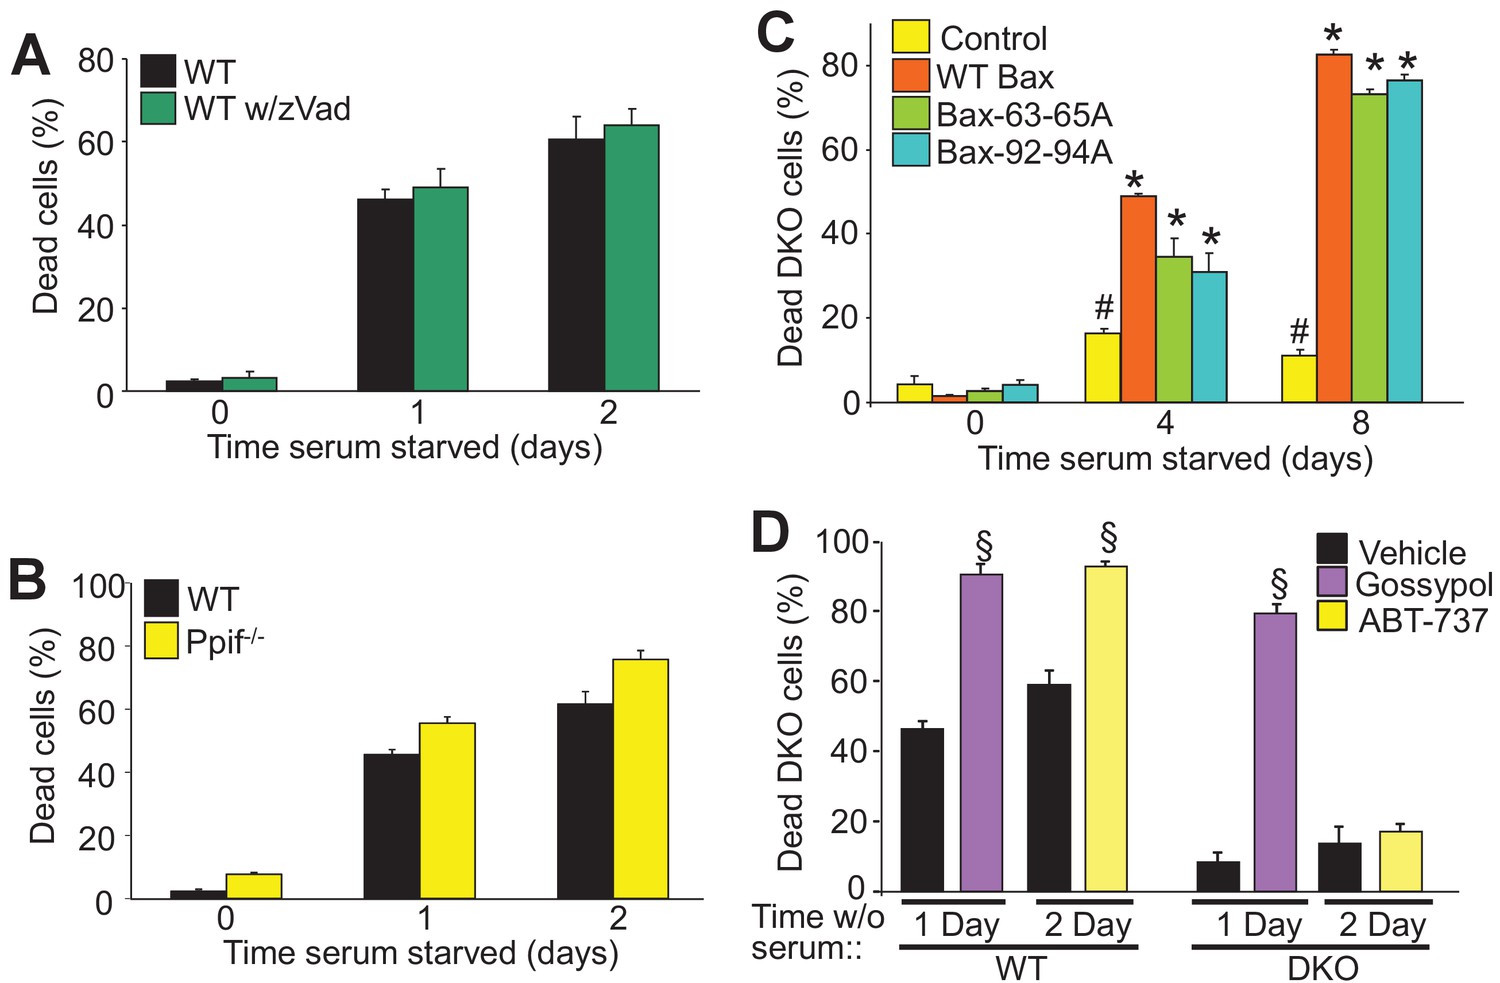
Autophagy can culminate in a unique form of cell death.
(A) WT MEFs treated with or without a pan caspase inhibitor (zVad) and subjected to serum starvation for 1 or 2 days. Cell death was measured by plasma membrane rupture. (B) WT and Ppif null MEFs were subjected to serum starvation and cell death was assessed as in ‘A’. (C) WT MEFs and DKO MEFs stably expressing oligomeric dead mutants of Bax (Bax63-65A or Bax 92-94A) or WT Bax were subjected to serum starvation and cell death was measured by loss of plasma membrane integrity for the days shown. (D) WT and DKO MEFs were treated with or without BH3-mimtics (ABT-737 or Gossypol) and were subjected to serum starvation. Cell death was assessed as in ‘A’. All assays are an average three independent experiments. The error bars represent the standard error of the mean. #p<0.05 vs WT Bax. *p<0.05 vs 0 time point. §p<0.05 vs vehicle. Statistical significance was determined by students t-test.
Figure 2—figure supplement 1
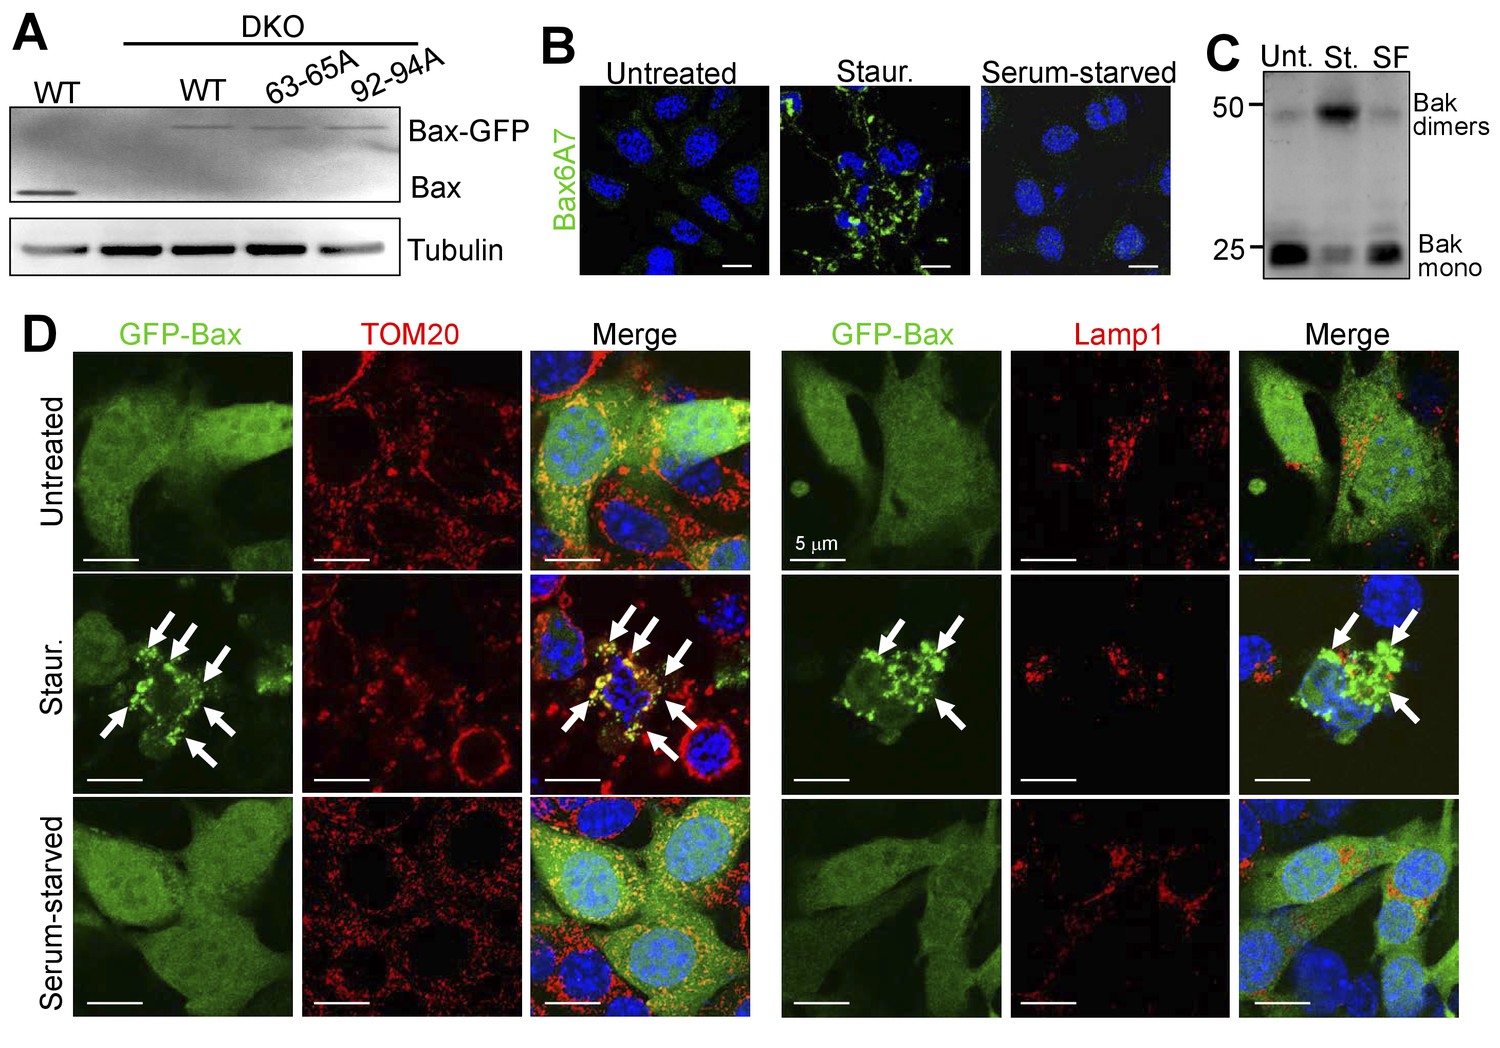
Bax/Bak activation, oligomerization, and translocation does not occur during autophagic cell death.
(A) Western blots for Bax and α-tubulin on cell lysates from WT, DKO and DKO MEFs stably reconstituted with WT and the indicated mutant versions of GFP-Bax. (B) Confocal images of WT MEFs labeled with an activation-specific Bax antibody (Bax6A7) (green) and DAPI (blue nuclear stain). WT MEFs were treated with 200 nM staurosporine (Staur.) and 20 μM zVAD for 24 hr as an apoptotic control. Serum starvation was for 48 hr or MEFs were left untreated prior to fixation. Scale bars = 5 μm. (C) Western blot for Bak from WT MEFs treated as in ‘B’ (Staurosporine (St.) and Serum Free (SF)). Cell lysates were collected in non-reducing conditions and the protein lysates were incubated in NativePage sample buffer to maintain Bak oligomers. (D) Confocal images of DKO MEFs reconstituted with GFP-Bax that were subjected to the same treatments as in ‘B’ and then labeled with either TOM20 (red) to visualize mitochondria or Lamp-1 (red) to visualize lysosomes. Scale bars = 5 μm. Similar results were observed across three independent experiments in all panels.
-
Figure 2—figure supplement 1—source data 1
Raw western gel images for Figure 2—figure supplement 1A and C.
- https://doi.org/10.7554/eLife.30543.007
Figure 3
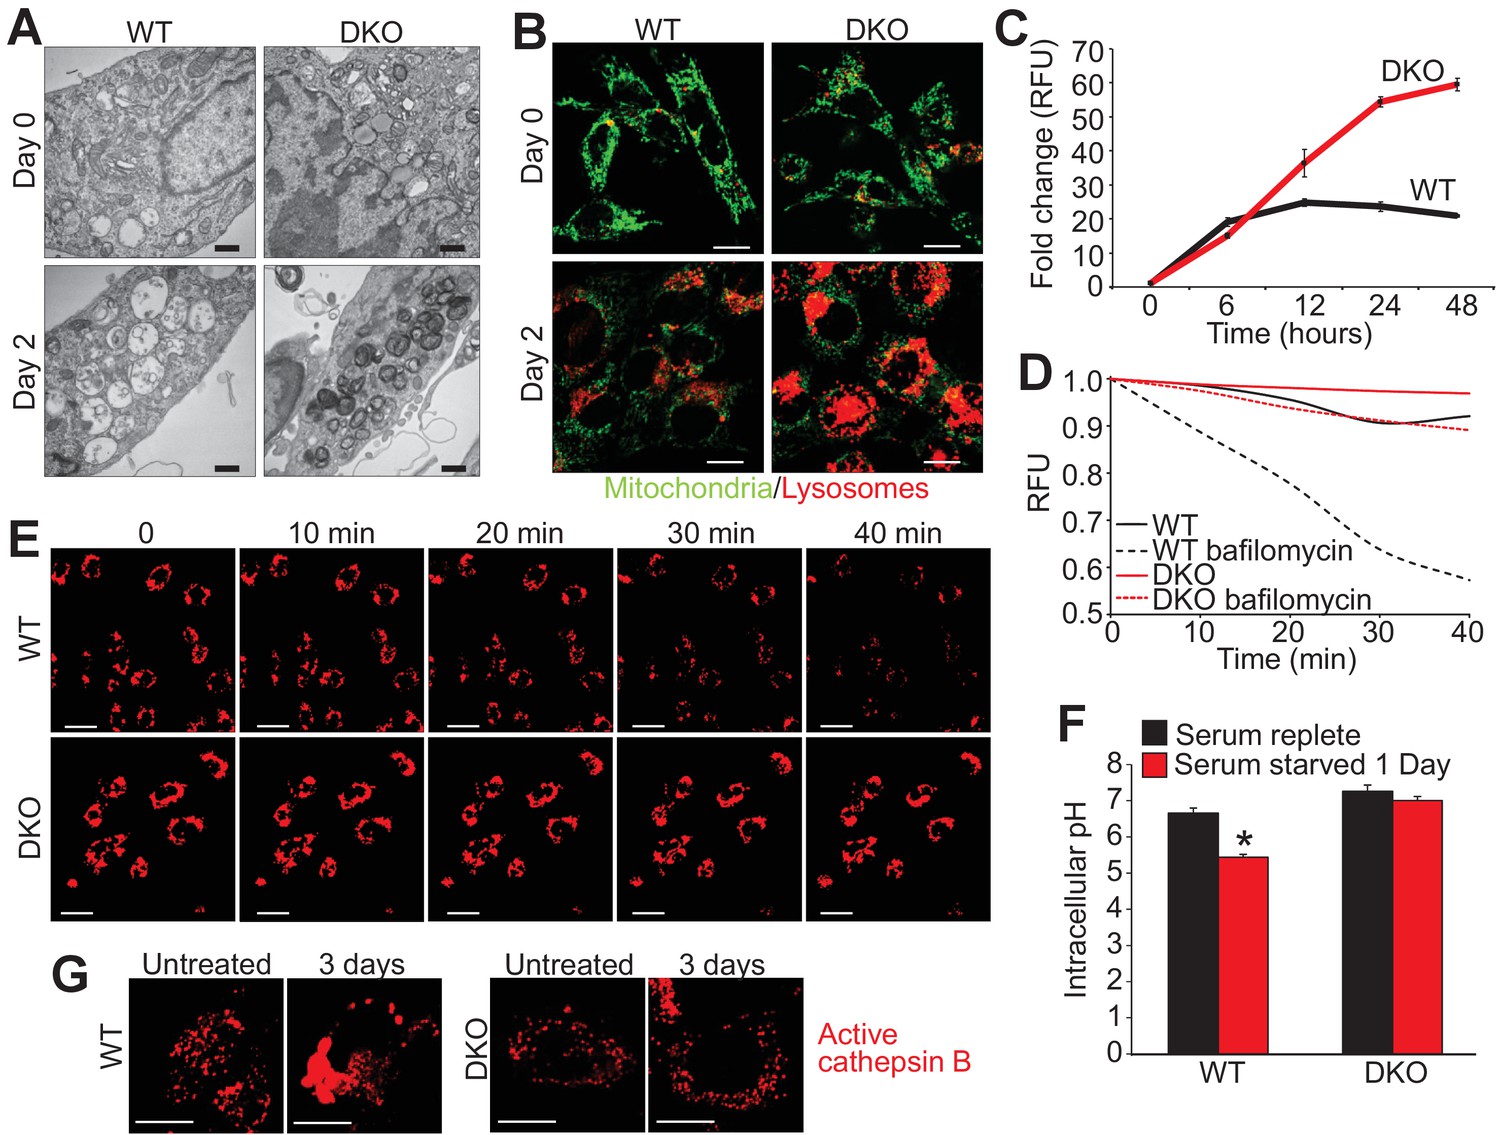
Loss of Bax and Bak1 maintains lysosomal integrity.
(A) Transmission EM images (30,000x) of WT and DKO MEFs subjected to serum starvation for the specified time points. Autolysosomes and translucent vesicles are noticeable in the serum-starved WT MEFs but not in the DKO MEFs. Scale bars = 1 μm. (B) Confocal images of WT and DKO MEFs subjected to serum starvation for the indicated times and labeled with Rhodamine 123 (green) to measure mitochondrial membrane potential and LysoTracker red (red) to label lysosomes. Scale bars = 5 μm. (C) Time course of LysoTracker red fluorescence intensity in serum starved WT vs. DKO MEFs for the indicated time points. (D) Representative trace for LysoTracker red fluorescence in WT and DKO MEFs serum-starved for 12 hr and treated with or without bafilomycin A1. Fluorescent intensity was continually measured for 40 min following the bafilomycin A1 addition. (E) Confocal images of WT and DKO MEFs treated the same as in panel ‘D’. Scale bars = 10 μm. (F) Graph of cytosolic pH in WT and DKO MEFs in control serum-replete conditions (black) or serum-starved (red) conditions. (G) Confocal images of active cathepsin B (red) in WT and DKO MEFs in control or serum-starved state. Scale bars = 5 μm. All assays are an average, or are representative of three independent experiments. The error bars represent the standard error of the mean. *p<0.05 vs 0 serum-replete. Statistical significance was determined by student's t-test.
Figure 4
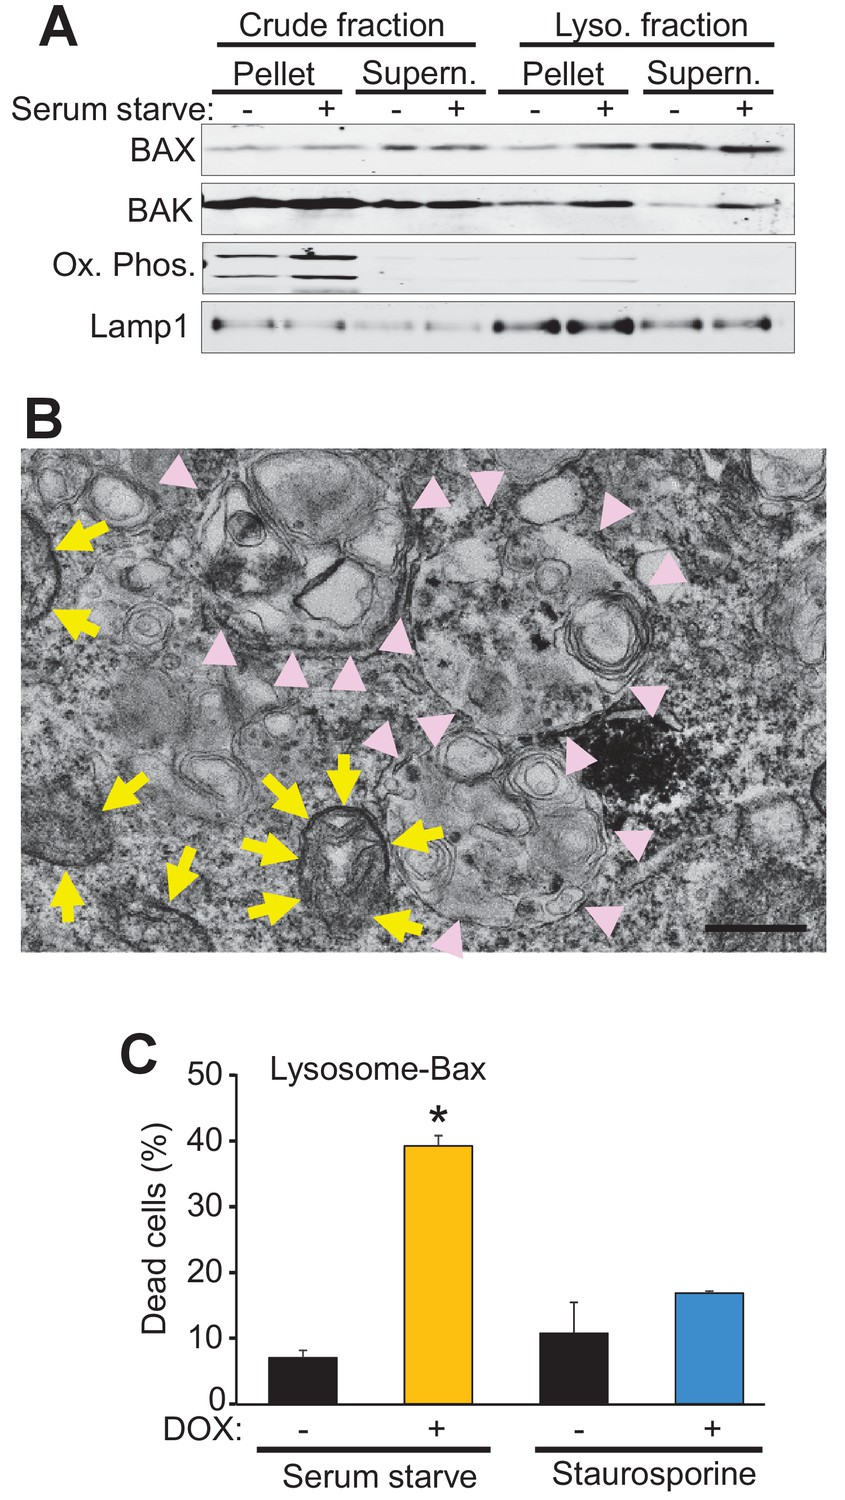
Bax and Bak localize to lysosomes and targeting Bax to lysosomes restores autophagic cell death in DKO MEFs.
(A) Western blot analysis of the indicated protein fractions from starved and control WT MEFs for Bax, Bak, Lamp1 and the oxidative phosphorylation mitochondrial proteins UQCRC2 (upper band) and MTCO1 (lower band). (B) Transmission EM image of DKO MEFs treated with an adenovirus for mini SOG-Bax. The yellow arrows show electron dense mini-SOG-Bax within the mitochondrial membranes while the pink arrow heads show electron dense regions within the autolysosomes and lysosomes. Scale bar = 1 μm. (C) DKO MEFs infected with a Dox-inducible adenovirus for Bax containing the lysosomal targeting sequence of Lamp1 on its C-terminus. The infected cells were then treated with or without Dox to induce expression and then subjected to serum starvation to induce autophagic cell death, or treated with 200 nM staurosporine to induce apoptotic cell death. Cell death was determined by plasma membrane rupture. All assays are an average or are representative of three independent experiments. The error bars represent the standard error of the mean. *p<0.05 vs no Dox with students t-test.
-
Figure 4—source data 1
Raw western gel images for Figure 4A.
- https://doi.org/10.7554/eLife.30543.010
Figure 5
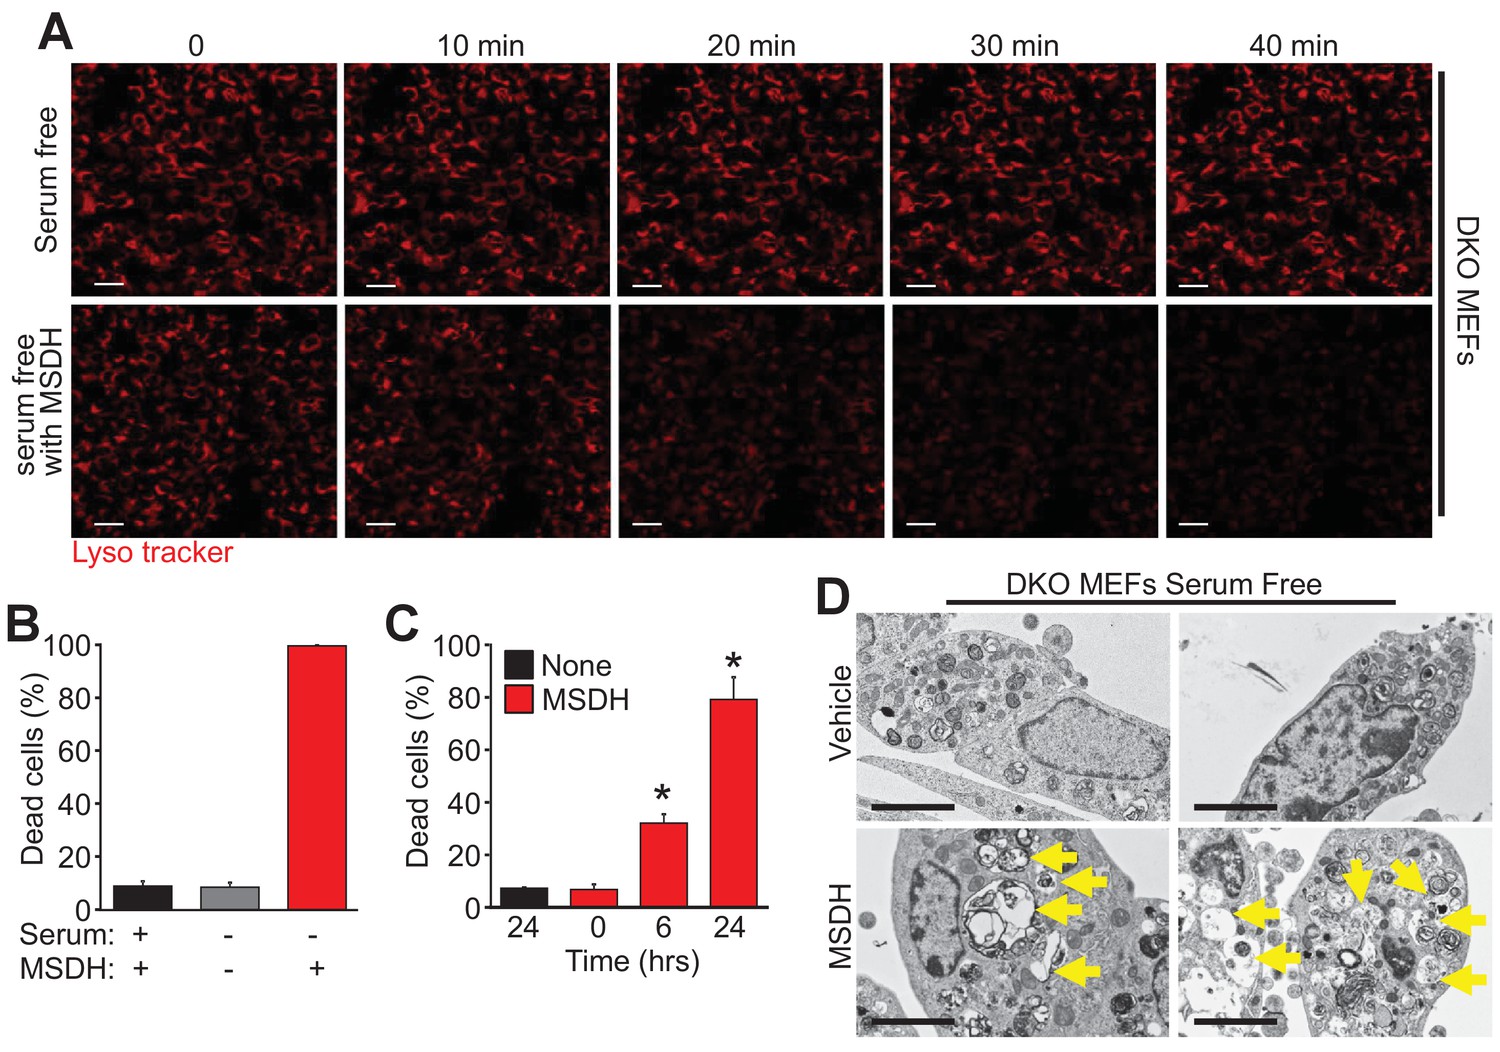
The lysosomotropic detergent MSDH restores autophagic death in Bax/Bak1 DKO MEFs.
(A) A time course of confocal images of DKO MEFs that were serum starved for 24 hr and then loaded with LysoTracker red, treated with or without 30 µM MSDH for the indicated times. Scale bars = 10 μm. (B) DKO MEFs with 24 hr serum starvation or control were treated with 30 µM MSDH and cell death was measured by loss of plasma membrane integrity 12 hr later. (C) Time course of serum-starved DKO MEFs treated with or without 30 µM MSDH for the indicated times. Cell death was measured as in panel ‘B’. (D) Transmission EM images (magnification = 30,000 x) of 24 hr serum-starved DKO MEFs treated with or without 30 µM MSDH for 4 hr. Scale bars = 5 μm. All assays are an average or are representative of three independent experiments. The error bars represent the standard error of the mean. *p<0.05 vs untreated or time 0 with students t-test.
Tables
Key resources table
| Reagent type (species) or resource | Designation | Source or reference | Identifiers | Additional information |
|---|---|---|---|---|
| gene (Mus Musculus) | Bak1 | N/A | ID: 12018 | N/A |
| gene (Mus Musculus) | Bax | N/A | ID: 12028 | N/A |
| cell line (Mus Musculus) | Wild Type SV40 Mouse Embryonic Fibroblasts; WT MEFs | PMID: 11326099 | N/A | N/A |
| cell line (Mus Musculus) | Bax Bak1 double knockout SV40Mouse Embryonic Fibroblasts; DKO MEFs | PMID: 11326099 | N/A | N/A |
| cell line (Mus Musculus) | DKO MEFs stably reconstitutied with wild type Bax; DKO-WT-Bax | PMID: 21255726 | N/A | N/A |
| cell line (Mus Musculus) | DKO MEFs stably reconstitutied with 92-94A mutant Bax; DKO-92-94A-Bax | PMID: 21255726 | N/A | N/A |
| cell line (Mus Musculus) | DKO MEFs stably reconstitutied with 63-65A mutant Bax; DKO-63-65A-Bax | PMID: 21255726 | N/A | N/A |
| antibody | Bax6A7 | Thermo Fisher Scinentific | MA5-14003 | 1 to 100 |
| antibody | TOM20 | Santa Cruz Biotechnology | sc-11415 | 1 to 100 |
| antibody | Lamp-1 | DSHB-University of Iowa | 1D4B | 1 to 200 and 1 to 1000 |
| antibody | Bax | Santa Cruz Biotechnologies | sc-493 | 1 to 300 |
| antibody | Bak | Millipore | 06–536 | 1 to 1000 |
| antibody | LC3I/II | Abcam | ab58610 | 1 to 500 |
| antibody | Bcl-2 | Santa Cruz Biotechnologies | sc-7382 | 1 to 300 |
| antibody | Lamp1 | Abcam | ab24170 | 1 to 500 |
| antibody | Cathepsin D | Novus | AF1029 | 1 to 800 |
| antibody | GAPDH | Fitzgerald | 10R-G109A | 1 to 25,000 |
| antibody | Total OXPHOS Rodent WB Antibody Cocktail | Abcam | ab110413 | 1 to 10,000 |
| antibody | αTubulin | Santa Cruz Biotechnologies | sc-8035 | 1 to 250 |
| recombinant DNA reagent | Lysosomal targeted Bax; Lyso-Bax | Bio Basic | N/A | special order |
| recombinant DNA reagent | MiniSOG-Bax | Bio Basic | N/A | special order |
| sequence-based reagent | N/A | N/A | N/A | N/A |
| peptide, recombinant protein | N/A | N/A | N/A | N/A |
| commercial assay or kit | Lysosome Isolation Kit | Sigma | LYSISO1 Sigma | N/A |
| commercial assay or kit | intracellular pH detection kit | Invitrogen | P35379 | N/A |
| commercial assay or kit | Muse Count and Viability assay | EMD Millipore | MCH100102 | N/A |
| chemical compound, drug | ABT-737 | Selleck Chemicals | S1002 | 20 μM |
| chemical compound, drug | Gossypol | Tocris | 1964 | 10 μM |
| chemical compound, drug | caspase inhibitor zVAD-fmk | Promega | G7232 | 20 μM |
| chemical compound, drug | (S)-O-methyl-serine dodecylamide hydrochloride; MSDH | Avanti Polar Lipids | 850546 | 30 μM |
| chemical compound, drug | staurosporine | Sigma-Aldrich | S6942 | 200 nM |
| chemical compound, drug | LysoTracker Red DND-99 | ThermoFisher Scientific | L7528 | 50 nM |
| chemical compound, drug | Rhodamine-123 | ThermoFisher Scientific | R-302 | 25 μM |
| chemical compound, drug | pHrodo Red AM Intracellular pH Indicator | ThermoFisher Scientific | P35372 | N/A |
| chemical compound, drug | Protease inhibitor cocktail | ThermoFisher Scientific | 88666 | N/A |
| software, algorithm | Excel 2013 | Microsoft Office | N/A | N/A |
| software, algorithm | Power Point 2013 | Microsoft Office | N/A | N/A |
Additional files
-
Transparent reporting form
- https://doi.org/10.7554/eLife.30543.012
Download links
A two-part list of links to download the article, or parts of the article, in various formats.
Downloads (link to download the article as PDF)
Open citations (links to open the citations from this article in various online reference manager services)
Cite this article (links to download the citations from this article in formats compatible with various reference manager tools)
Autophagic cell death is dependent on lysosomal membrane permeability through Bax and Bak
eLife 6:e30543.
https://doi.org/10.7554/eLife.30543


