Cytokinesis in vertebrate cells initiates by contraction of an equatorial actomyosin network composed of randomly oriented filaments
- Institute of Molecular Biotechnology of the Austrian Academy of Sciences, Vienna Biocenter, Austria
- Marine Biological Laboratory, United States
- Institute of Science and Technology Austria, Austria
Figures
Figure 1 with 2 supplements
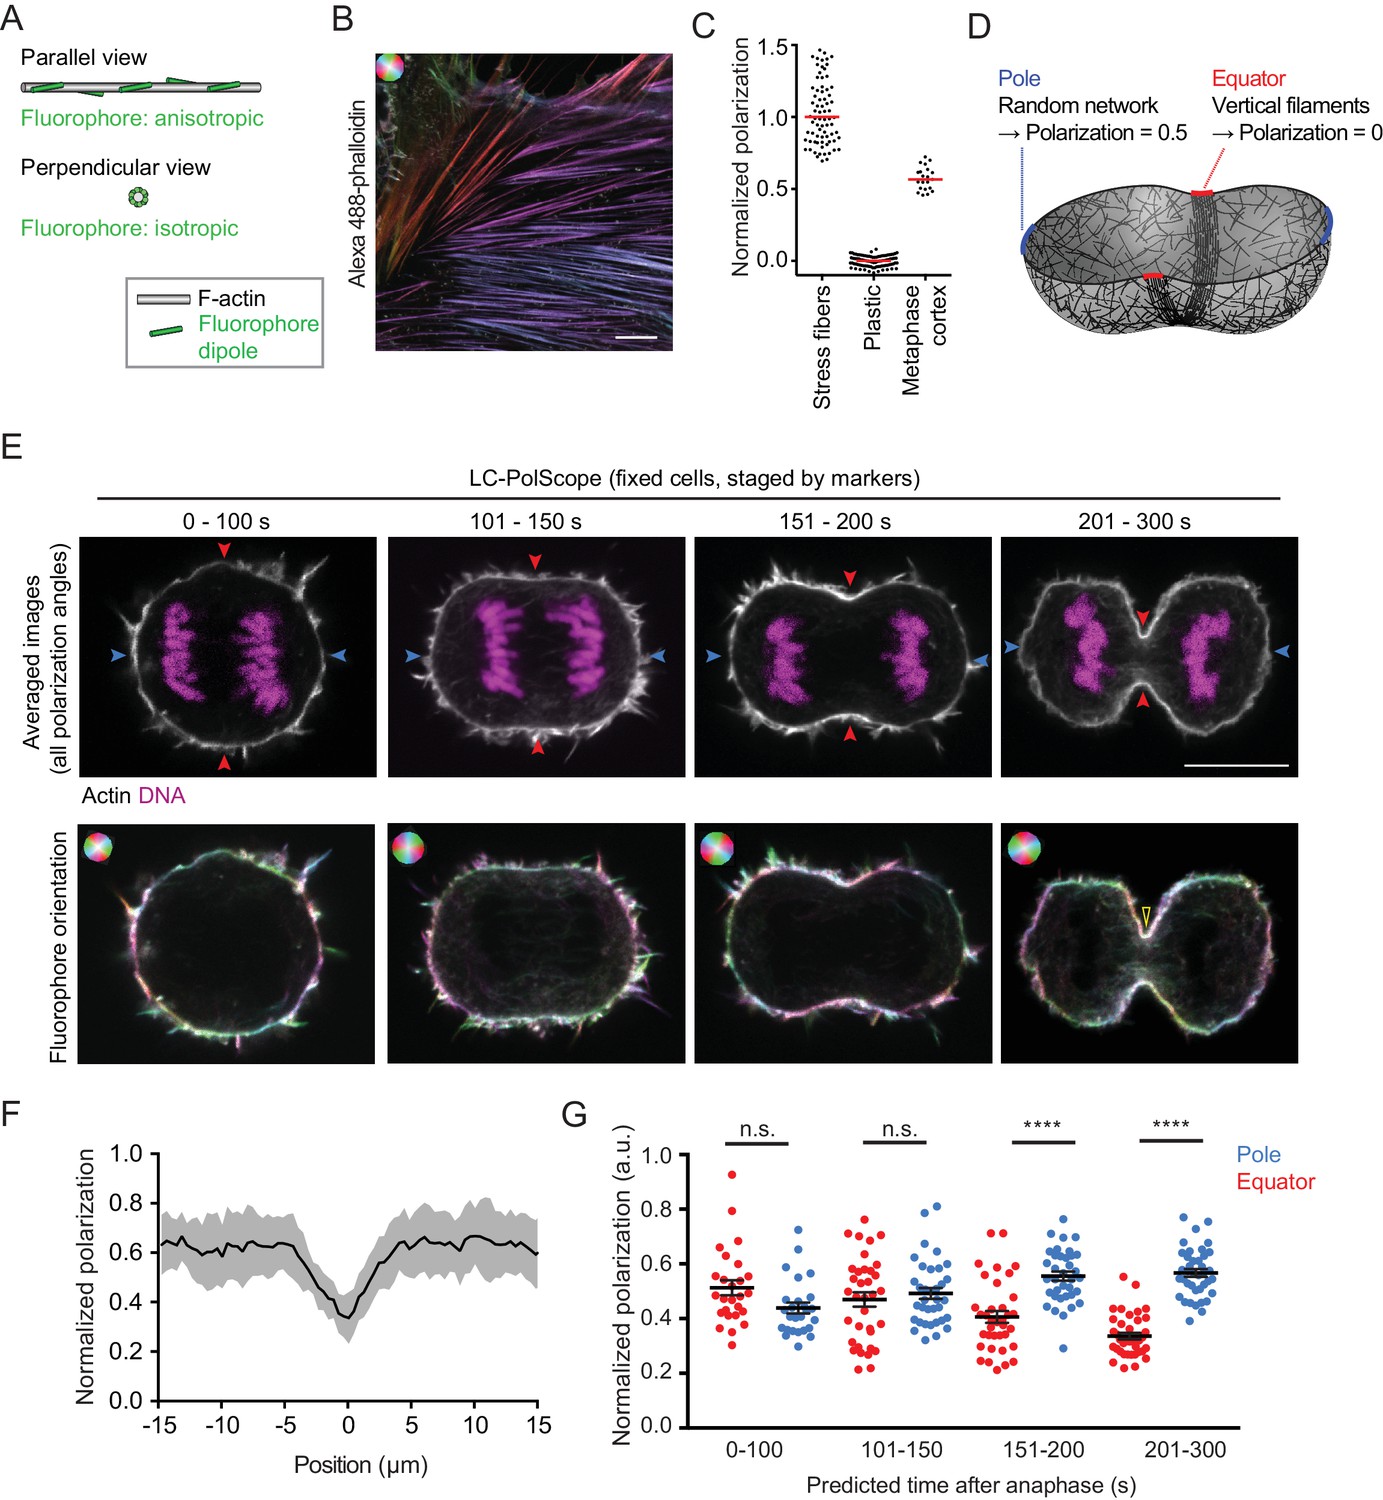
Cleavage furrow ingression initiates by contraction of a randomly oriented actin filament network, which subsequently gradually aligns at the cell equator.
(A) Schematics of actin filament (grey) and fluorescent dipole orientation (green) relative to the optical section of the microscope. Upper panel shows actin filament parallel to the focal plane of the microscope, lower panel shows an actin filament that is perpendicularly oriented to the focal plane of the microscope. On perpendicularly oriented actin filaments, fluorescent dipoles are oriented point symmetrically in every direction and the ensemble of molecules therefore does not yield a fluorescence anisotropy signal. (B) Fluorescence polarization microscopy of stress fibers in fixed interphase hTERT-RPE-1 cells labeled with Alexa Fluor 488-phalloidin using the LC-PolScope. Color saturation indicates degree of fluorophore alignment (anisotropy), hue indicates mean orientation of fluorescence dipoles as shown in upper left corner. (C) Quantification of polarization normalized to calibration samples: stress fibers as in (B) and fluorescent plastic with random fluorescence dipole orientation. Dots indicate individual measurements, bars indicate median. (D) Geometry and normalized polarization predicted by canonical purse-string model of cytokinesis at the equator (red) or cell poles (blue). (E) Images of Alexa Fluor 488-phalloidin-stained hTERT-RPE-1 cells at representative stages during cytokinesis. Blue and red arrows indicate polar and equatorial positions of quantification regions, respectively (upper panel). Lower panel shows the orientation map of the fluorescent dipole as calculated by the different orientations. Color saturation indicates degree of fluorophore alignment (anisotropy), hue indicates mean orientation of fluorescence dipoles as shown in upper left corner. Yellow arrowhead indicates edge of cleavage furrow. (F) Lateral distribution of polarization factor measured along the cell cortex in central sections of late furrow ingression-stage cells, aligned for the cleavage furrow edge as in (E). Line indicates median, shaded area indicates s.d. of 22 cells. (G) Quantification of normalized polarization as indicated in (E). Dots indicate individual cells (n = 136, mean + s.e.m. of both measurements at opposing cortical cell regions; ****p<0.0001 by Kolmogorov-Smirnov test). Scale bars = 10 µm.
Figure 1—figure supplement 1
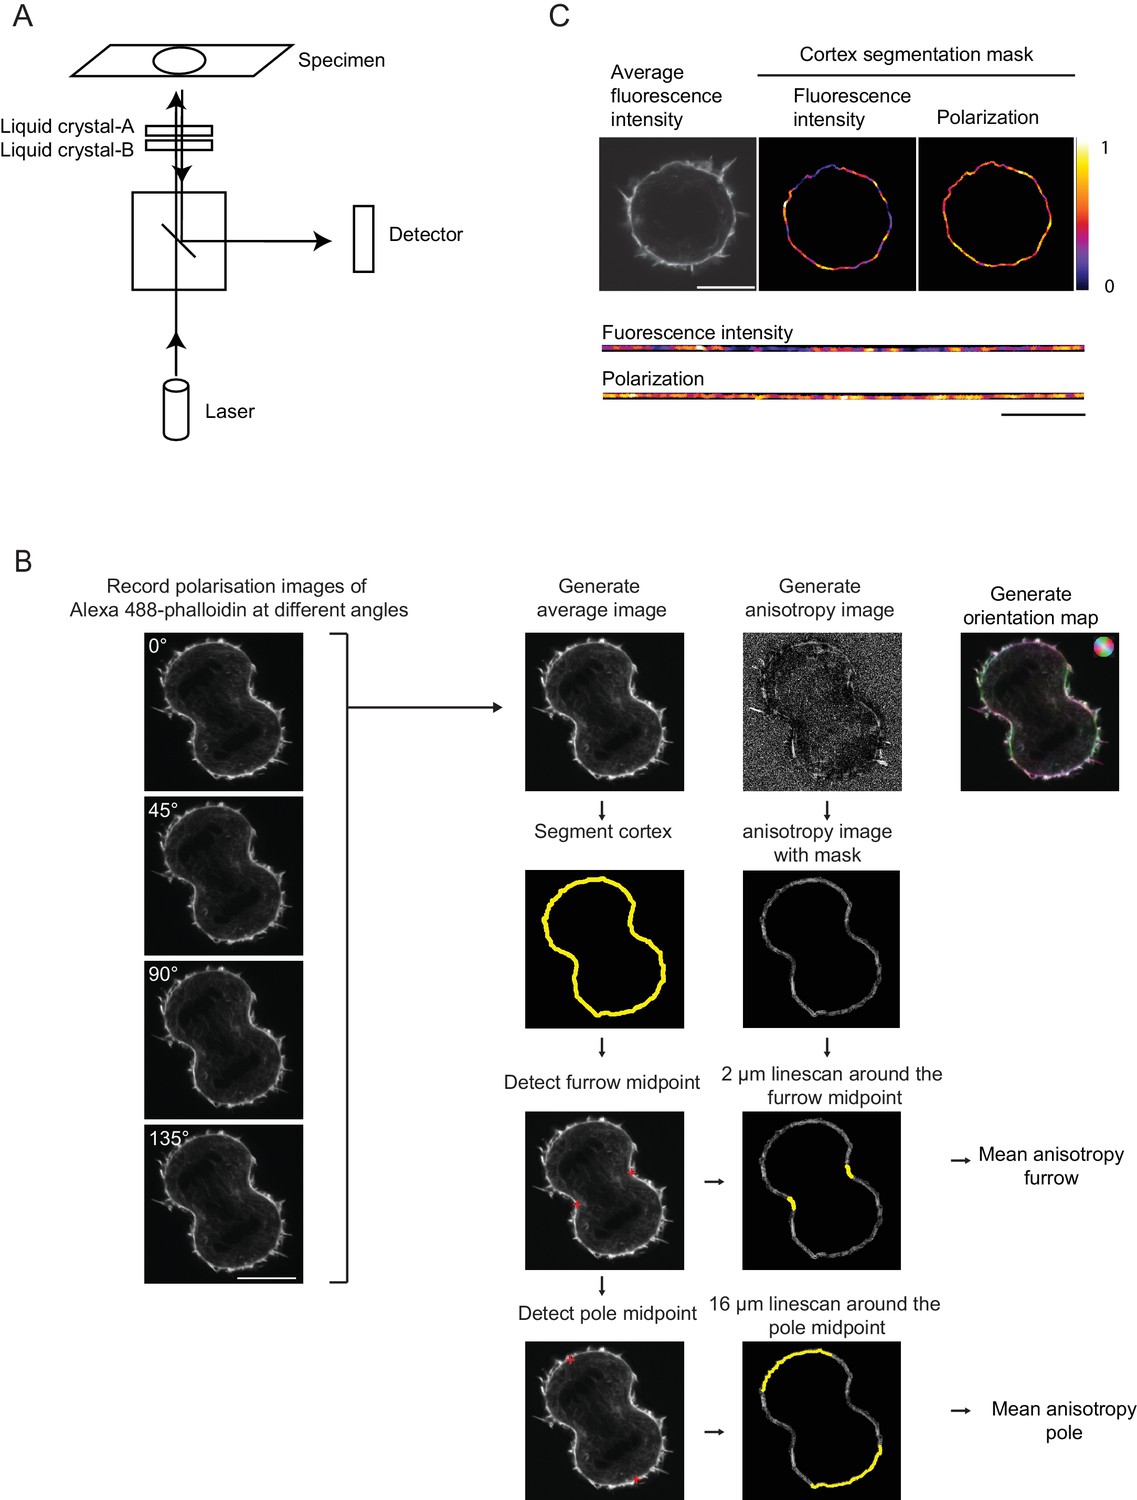
LC-PolScope fluorescence polarization microscopy and analysis pipeline.
(A) Confocal LC-PolScope employs liquid crystal-based universal compensator for modifying the linear polarization state of the excitation laser. This setup allows exciting the fluorophores in the sample with polarized laser light in four different angles. Schematic of the beam path of LSM780, the position of the liquid crystal is indicated. (B) Acquisition and analysis pipeline of LC-PolScope data. Four images were sequentially recorded whereby the linearly polarized excitation laser light was reoriented into four different angles as indicated. These images enable to calculate an ‘average image’ of the fluorophore localization and an ‘anisotropy image’ that contains information about the net fluorophore orientation in each pixel. These information can be visualized in a merged image, in which the brightness indicates overall fluorescence intensity, color saturation indicates the degree of fluorophore alignment (anisotropy), and hue indicates mean orientation of fluorescence dipoles as shown in upper left corner. The cell cortex was then segmented based on the ‘average image’ and the furrow midpoints and pole midpoints were determined. The cortex segmentation was then transferred to the ‘anisotropy image’ and analysis regions along the cortex were determined based on the furrow midpoints and the pole midpoints, respectively. Only these indicated sub-region of the entire segmentation mask (yellow regions overlaying ‘anisotropy image’) were used for quantification. (C) Distribution of average fluorescence intensity and normalized polarization factor along the contour of the segmented cell cortex of an early anaphase cell (same cell as shown for 0–100 s in Figure 1E). Upper panels indicate original images and segmented cortex regions, lower panels indicate the straightened cortex contours from the same images. Scale bar = 10 µm.
Figure 1—figure supplement 2
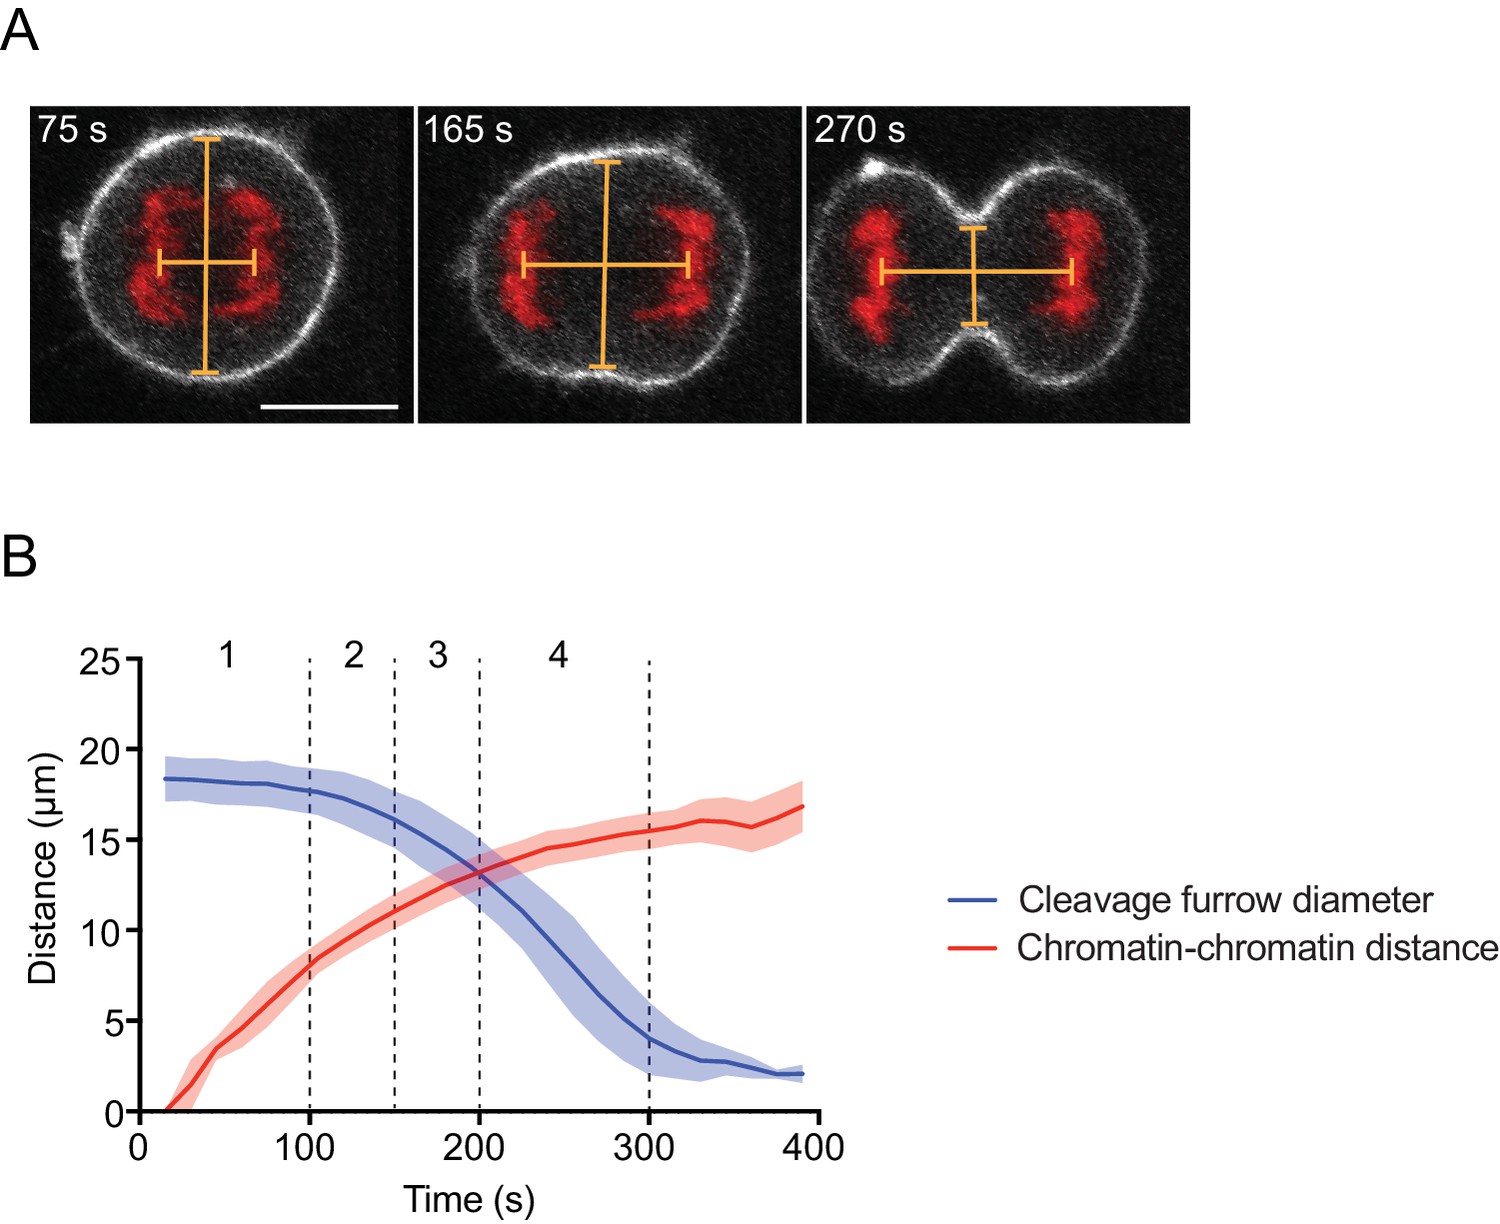
Regression model to determine cytokinesis timing in fixed cells.
(A) Cytokinesis staging by measurement of the distance between center points of segregating chromosome masses and cleavage furrow diameter. Lines indicate measured distances. Live hTERT-RPE-1 cells stably expressing H2B-mRFP and stained with SiR-actin were recorded as time-lapse movies, (B) quantified and binned into four bins. Line indicates mean and shaded area indicates s.d. of n = 14 cells. Scale bar = 10 µm.
Figure 2 with 3 supplements
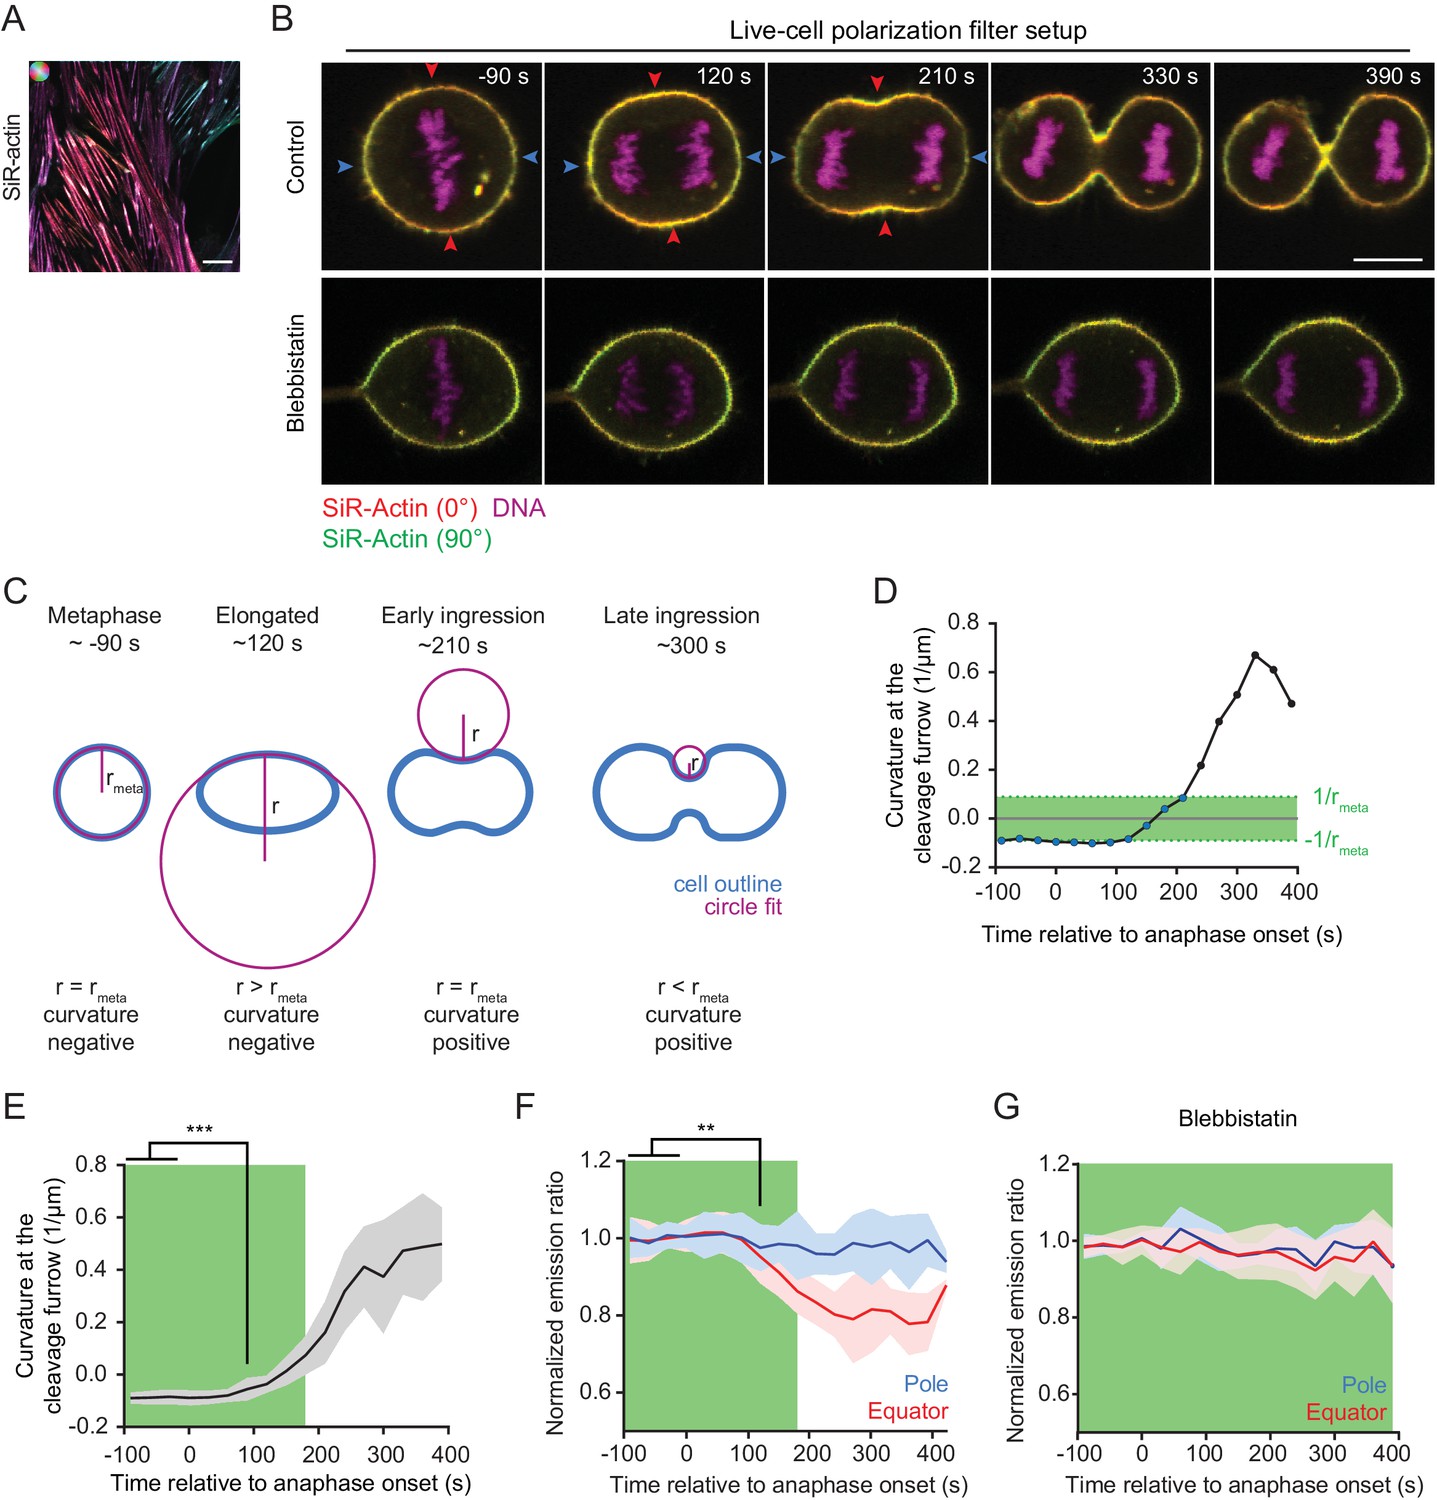
Quantification of actin reorganization by live-cell confocal polarization microscopy.
(A) Fluorescence polarization microscopy of stress fibers in live interphase hTERT-RPE-1 cells labeled with SiR-actin using the LC-PolScope. Color saturation indicates degree of fluorophore alignment (anisotropy), hue indicates mean orientation of fluorescence dipoles as shown in upper left corner. (B) Fluorescence polarization microscopy of live hTERT-RPE-1 cells stably expressing H2B-mRFP (magenta), stained with SiR-actin (overlay of red and green) at representative stages during cytokinesis. Images were acquired with horizontal (red) and vertical (green) linear polarizers in the emission beam path. Untreated cells (upper panel) and cells treated with 50 µm para-nitroblebbistatin (lower panel) are shown. (C) Schematic drawing of the circular fit procedure during cell division. Circles (magenta) were fitted to the center of the equator (blue). (D) Curvature of the equatorial cell cortex in a representative cell. Dots indicate individual time points. Time = 0 s at anaphase onset. (E) Quantification of equatorial cortex curvature in 18 dividing cells. Line indicates mean, gray area s.d.. The first time point with significantly changed curvature was detected at 90 s after anaphase onset by two-tailed t-test; ***p<0.001. (F) Quantification of SiR-actin normalized emission ratio in the 18 dividing cells used for the analysis in (E) (line indicates mean, blue and red areas s.d. **p<0.01 by two-tailed t-test (G) Quantification of SiR-actin normalized emission ratio in dividing cells treated with 50 µm para-nitroblebbistatin. Time = 0 s at anaphase onset (lines indicate median, shaded areas indicate s.d.; equatorial measurement: n = 15 cells, polar: n = 11 cells). (D-G) The green area indicates time points where the absolute value of cortical curvature was equal or below that of the metaphase cell. Only these time points were used for further interpretation of fluorescence anisotropy measurements, to avoid potential artifacts by geometry effects. Scale bars = 10 µm.
Figure 2—figure supplement 1

Polarization microscopy with linear polarizers in the emission beam path.
(A) Confocal fluorescence polarization microscope setup used for live-cell imaging. A linearly polarized excitation laser that was aligned with the X-axis of the optical table, and two perpendicularly oriented polarization filters, horizontal (H) and vertical (V) relative to the optical table, respectively, were used. (B) Cleavage furrow ingression measured in hTERT-RPE-1 cells expressing MyrPalm-mEGFP to visualize the plasma membrane (in absence of SiR-actin), line indicates mean, shaded area indicates s.d. of 8 cells. Anaphase onset = 0 s. (C) Cleavage furrow ingression measured in hTERT-RPE-1 cells stained with SiR-actin, line indicates mean, shaded area indicates s.d. of 18 cells. Anaphase onset = 0 s. (D–F) Analysis of geometry effect caused by linear polarized excitation light (see Materials and methods) on the ratio image. (D) Confocal image of a live metaphase hTERT-RPE-1 cell stained with SiR-actin, stably expressing H2B-mRFP. Yellow dashed line indicates line scan measurement region and arrow indicates measurement direction. (E) Quantification of (D), ratio between horizontal (H) and vertical (V) linear emission polarization filter was calculated for each pixel and plotted against the respective tangential angle. Because fluorescent dipoles are excited with linear polarized laser light, the ratio between horizontal and vertical emission channels of a randomly oriented network (as a metaphase cell cortex) depends on the angle relative to the excitation light. This effect can be described by a squared sine regression model (indicated by red curve). (F) Each pixel of the ratio image of the metaphase cortex was divided by the respective value derived from evaluating the regression model developed in (E) using the tangential angle for a given pixel as input parameter. (G) Schematic showing cortex thickness measurement assay. Membrane marker (green), actin marker (magenta), and measurement region (grey line). (H) Representative images of live hTERT-RPE-1 metaphase cell stably expressing MyrPalm-EGFP, actin was stained with SiR-actin. Solid yellow line indicates measurement area. (I) Quantification of (H) by fitting Gaussian functions to the line scans of each color channel as shown in (H), drawn in the direction from the cell interior to the extracellular space. The displacement between the Gaussian maximum positions was used to calculate the half-width of cortical thickness. (J) Quantification of cortex thickness based on the displacement of MyrPalm-EGFP and SiR-actin as shown in (H, I), for metaphase, anaphase and interphase cells. Each dot represents a single cell (metaphase: n = 48, anaphase: n = 50, interphase: n = 71), line indicates median. (**p<0.026 by Mann-Whitney test). Scale bar for (D) is 10 µm and for (H) is 2 µm.
Figure 2—figure supplement 2
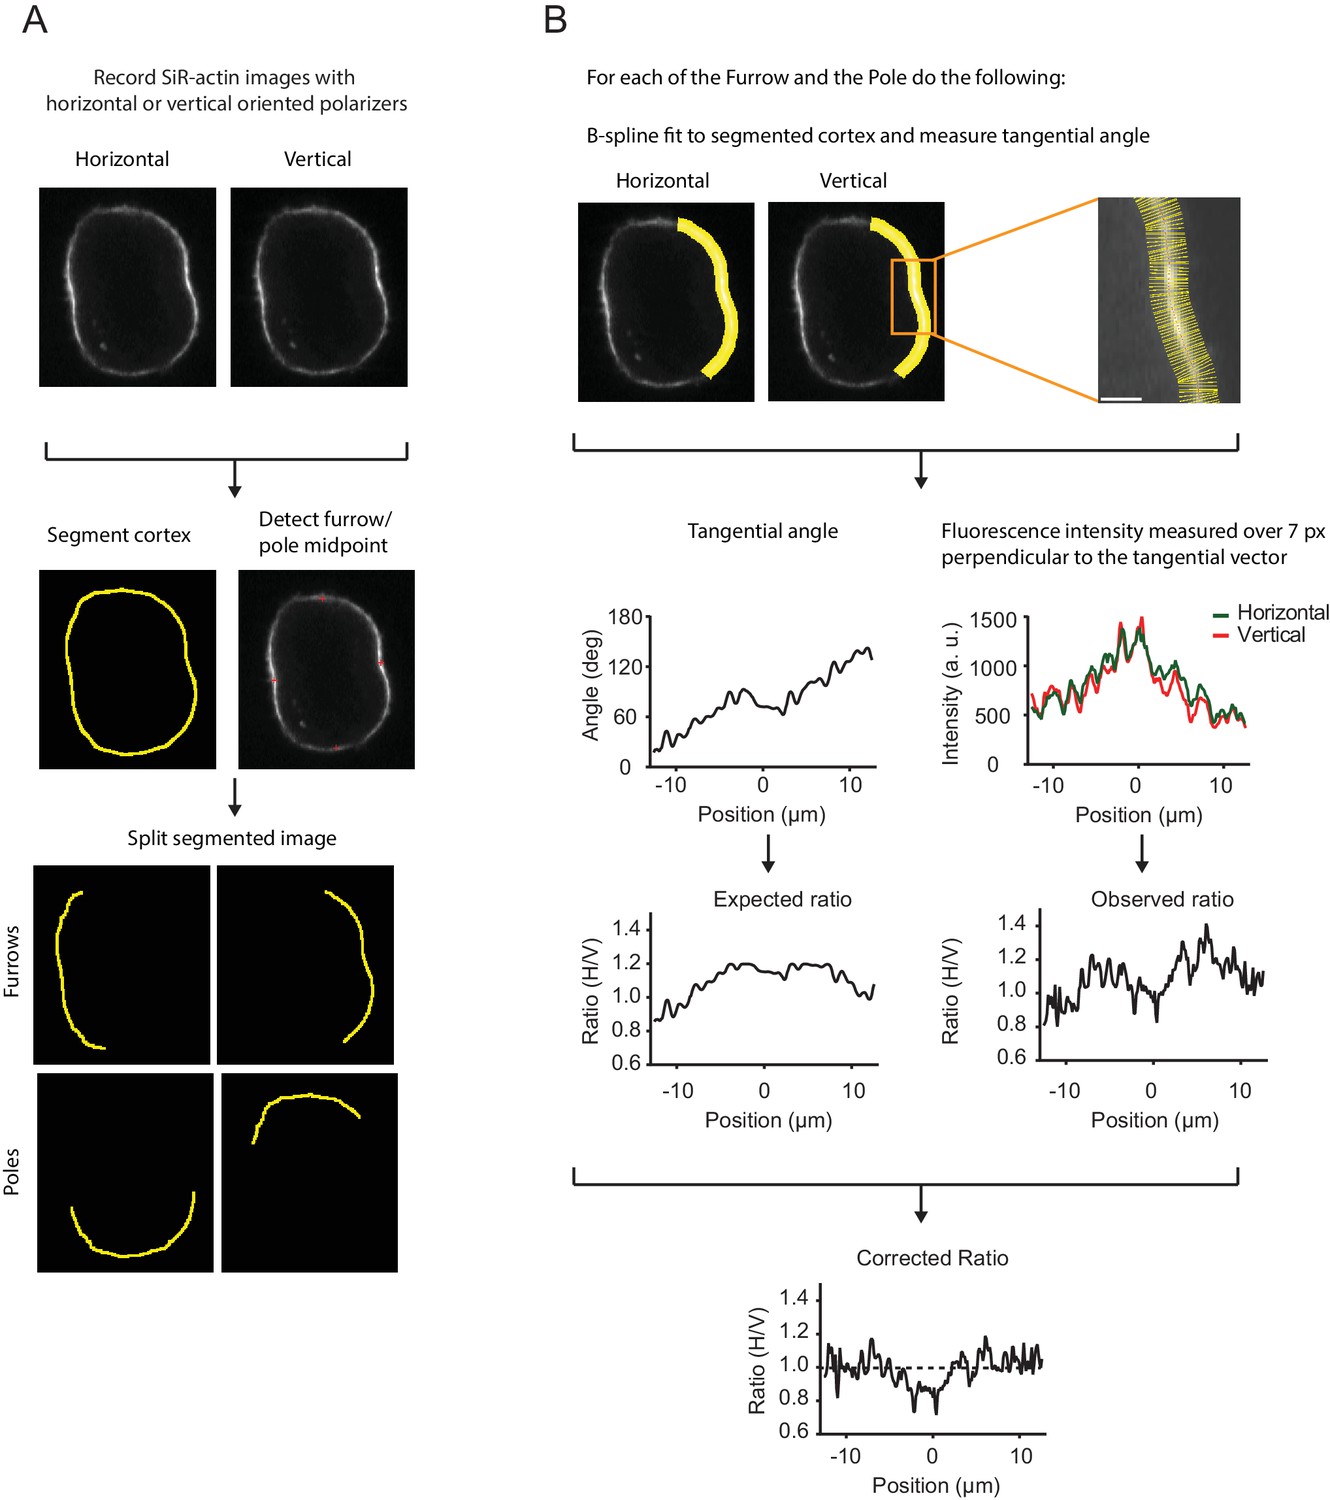
Analysis pipeline of live-cell polarization microscopy.
(A) Analysis pipeline for a representative live hTERT-RPE-1 cell stained with SiR-actin recorded with the confocal fluorescence polarization microscope setup. Cells were recorded with horizontal and vertical polarization emission filters. The cell cortex was segmented and furrow and pole midpoints were determined to generate separate measurement regions of each point. (B) To correct for the geometry effects caused by polarized excitation light, the pixel orientation of every pixel along the segmented contour was measured. Pixel orientation along the cortex was inferred by fitting a B-spline to the segmented contour. We then averaged a seven-pixel region perpendicular to the central pixel to capture both channel with a single mask. Yellow rods mark the averaged area, a seven-pixel region perpendicular to the tangential vector of the central pixel of the spline using the segmented cortex as the central pixel (red dot). The angle for each pixel was used to evaluate the squared sine regression model as described in Figure 2—figure supplement 1D–F. The regression model was developed for each cell independently and based on multiple pre-anaphase frames. Evaluation of the regression model using actual pixel orientation as input parameters resulted in the expected fluorescence ratio and is shown together with the actual fluorescence ratio measured for each pixel. The observed ratio for every pixel for every furrow/pole measurement region was divided by the expected ratio resulting in the corrected ratio. Dashed line indicates ratio of 1 indicating an isotropic dipole orientation and a random oriented network. Scale bars = 10 µm (A) and 2 µm (B).
Figure 2—figure supplement 3

Cortex organization in para-nitroblebbistatin-treated anaphase cells and lateral distribution of actin and myosin in untreated cells.
(A) Diameter at equatorial position measured in hTERT-RPE-1 cells expressing H2B-mRFP
and stained with SiR-actin, in presence of 50 µM para-nitroblebbistatin, an inhibitor of myosin II. Line indicates mean, shaded area indicates s.d. of 10 cells. Anaphase onset = 0 s. (B, C) Quantification of SiR-actin fluorescence at cell poles and equator as illustrated for untreated and para-nitroblebbistatin treated cell in Figure 2B. Anaphase onset = 0 s (D) Confocal image of live hTERT-RPE-1 cell expressing non-muscle myosin IIc-EGFP (MLC-12B-EGFP), stained with SiR-actin. Dashed line indicates measurement region for line profiles, arrowhead indicates cell equator position. (E) Quantification of lateral distribution of MLC-12B-EGFP and actin filaments at late furrow ingression stage as in (D); lines represent mean fluorescence in cortical line profiles centred to the cell equator (position = 0 μm), shaded areas represent s.d.; n = 37 cells. Scale bars = 10 µm.
Figure 3 with 1 supplement
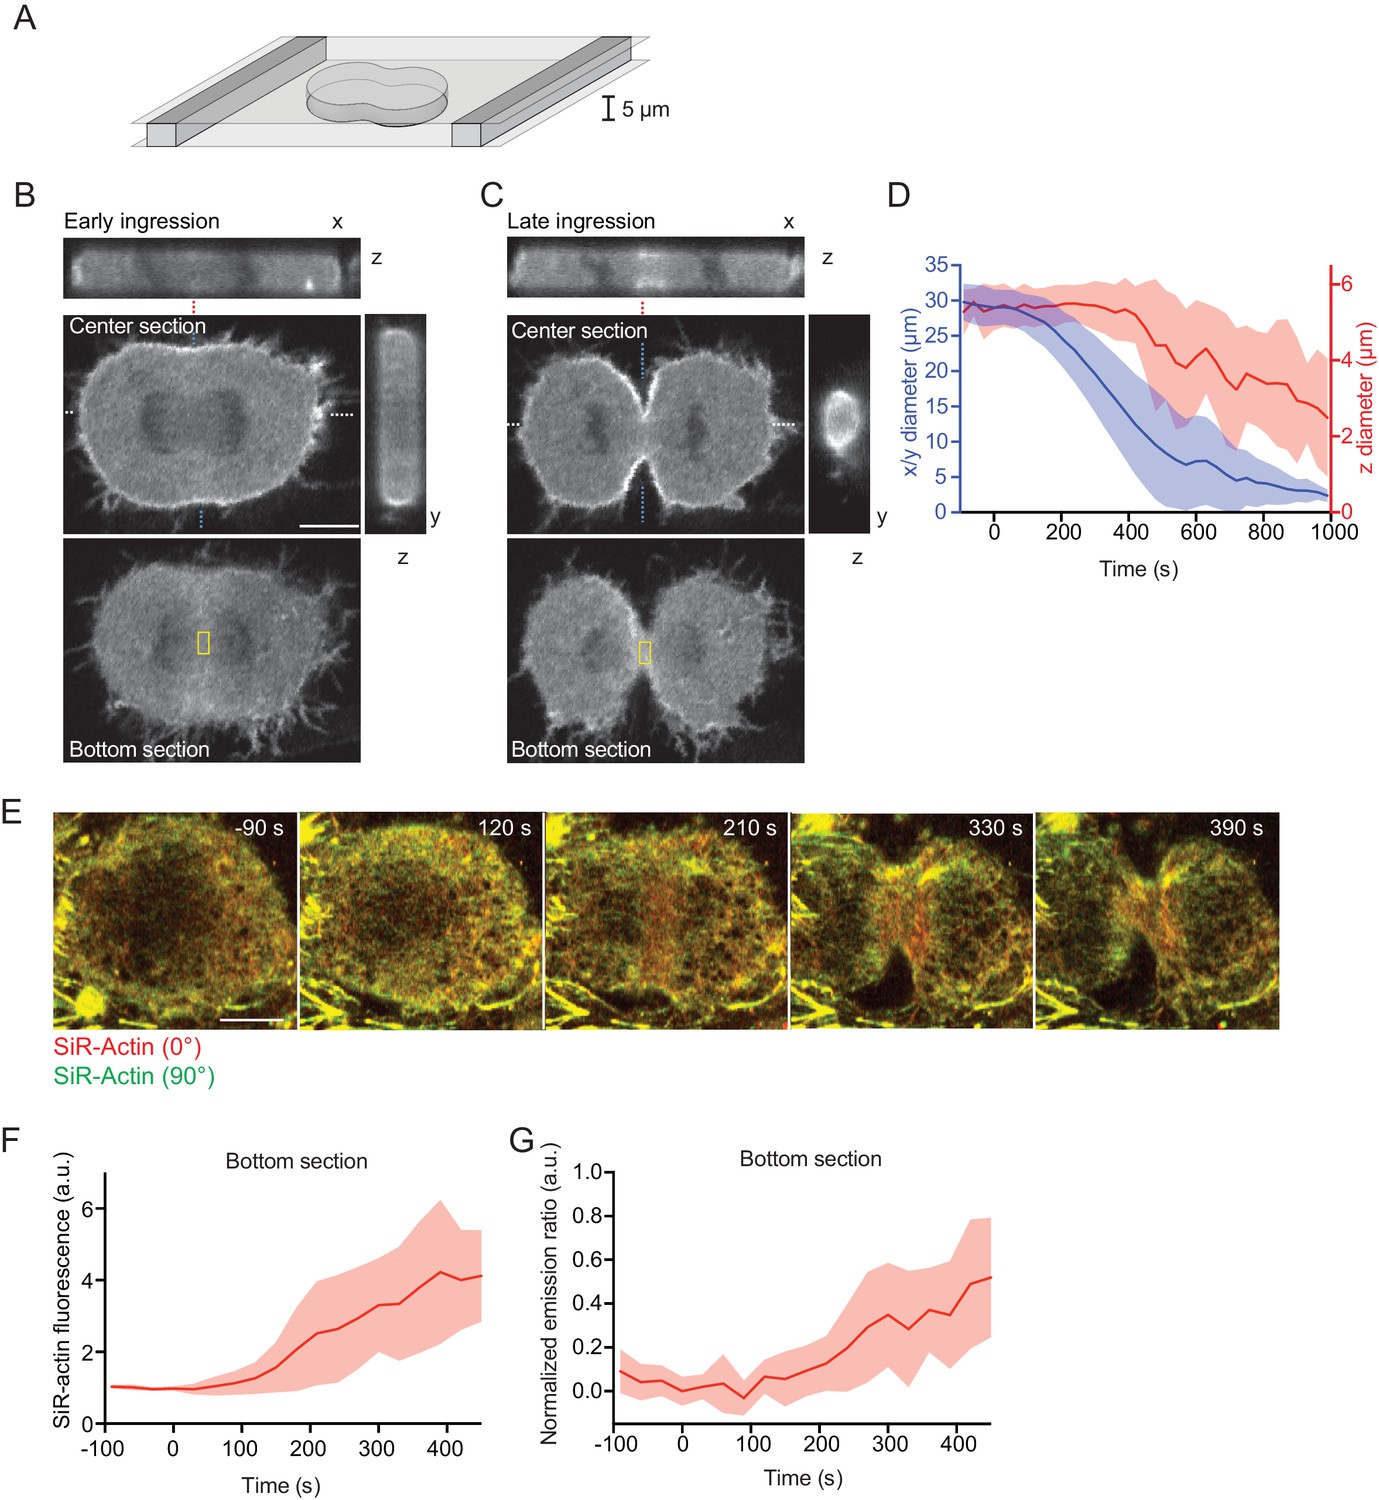
Equatorial actin filaments align on planar surfaces of confined cells.
(A) Schematics of cell confinement chamber used to enforce flat geometry of top- and bottom cell cortex during cytokinesis. (B, C) Confocal 3-D images of live hTERT-RPE-1 cells stably expressing LifeAct-mCherry at (B) early or (C) late furrow ingression stages. The x/z and y/z sections are at positions as indicated by blue or white dashed lines, respectively. Dashed red lines indicate measurement region for furrow ingression along z. Yellow boxes indicate measurement regions for (F, G). (D) Quantification of cleavage furrow ingression in confined cells as in (A–C) along x/y and z directions. Lines indicate median, shaded areas s.d. of n = 14 cells. (E) Fluorescence polarization microscopy of the bottom section of live hTERT-RPE-1 cell stably expressing H2B-mRFP, stained with SiR-actin under confinement. Images were acquired with horizontal (red) and vertical (green) linear polarizers in the emission beam path. (F) Quantification of SiR-actin fluorescence intensity at the cell equator at the bottom surface of confined cells. (G) Quantification of SiR-actin normalized emission ratio at the cell equator at the bottom surface of confined cells. Lines indicate median, shaded areas s.d. of n = 10 cells. Scale bars = 10 µm.
Figure 3—figure supplement 1
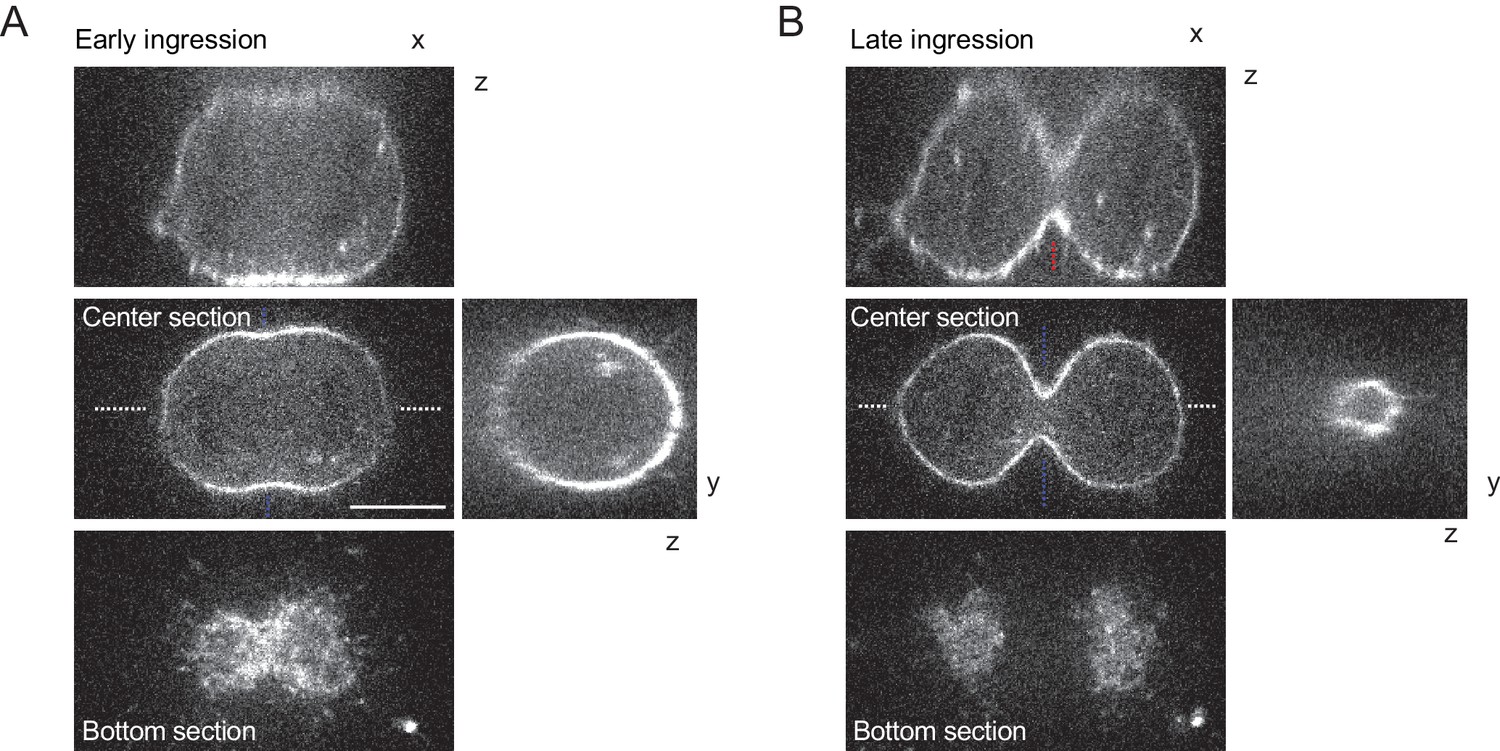
3D-imaging of cleavage furrow ingression in unconfined cells.
(A, B) Confocal 3-D images of live hTERT-RPE-1 cells stained with SiR-actin at early (A) and late (B) furrow ingression stages. The x/z and y/z sections are at positions as indicated by blue or white dashed lines, respectively. Dashed red lines indicate measurement region for furrow ingression along z. Scale bar = 10 µm.
Figure 4 with 1 supplement
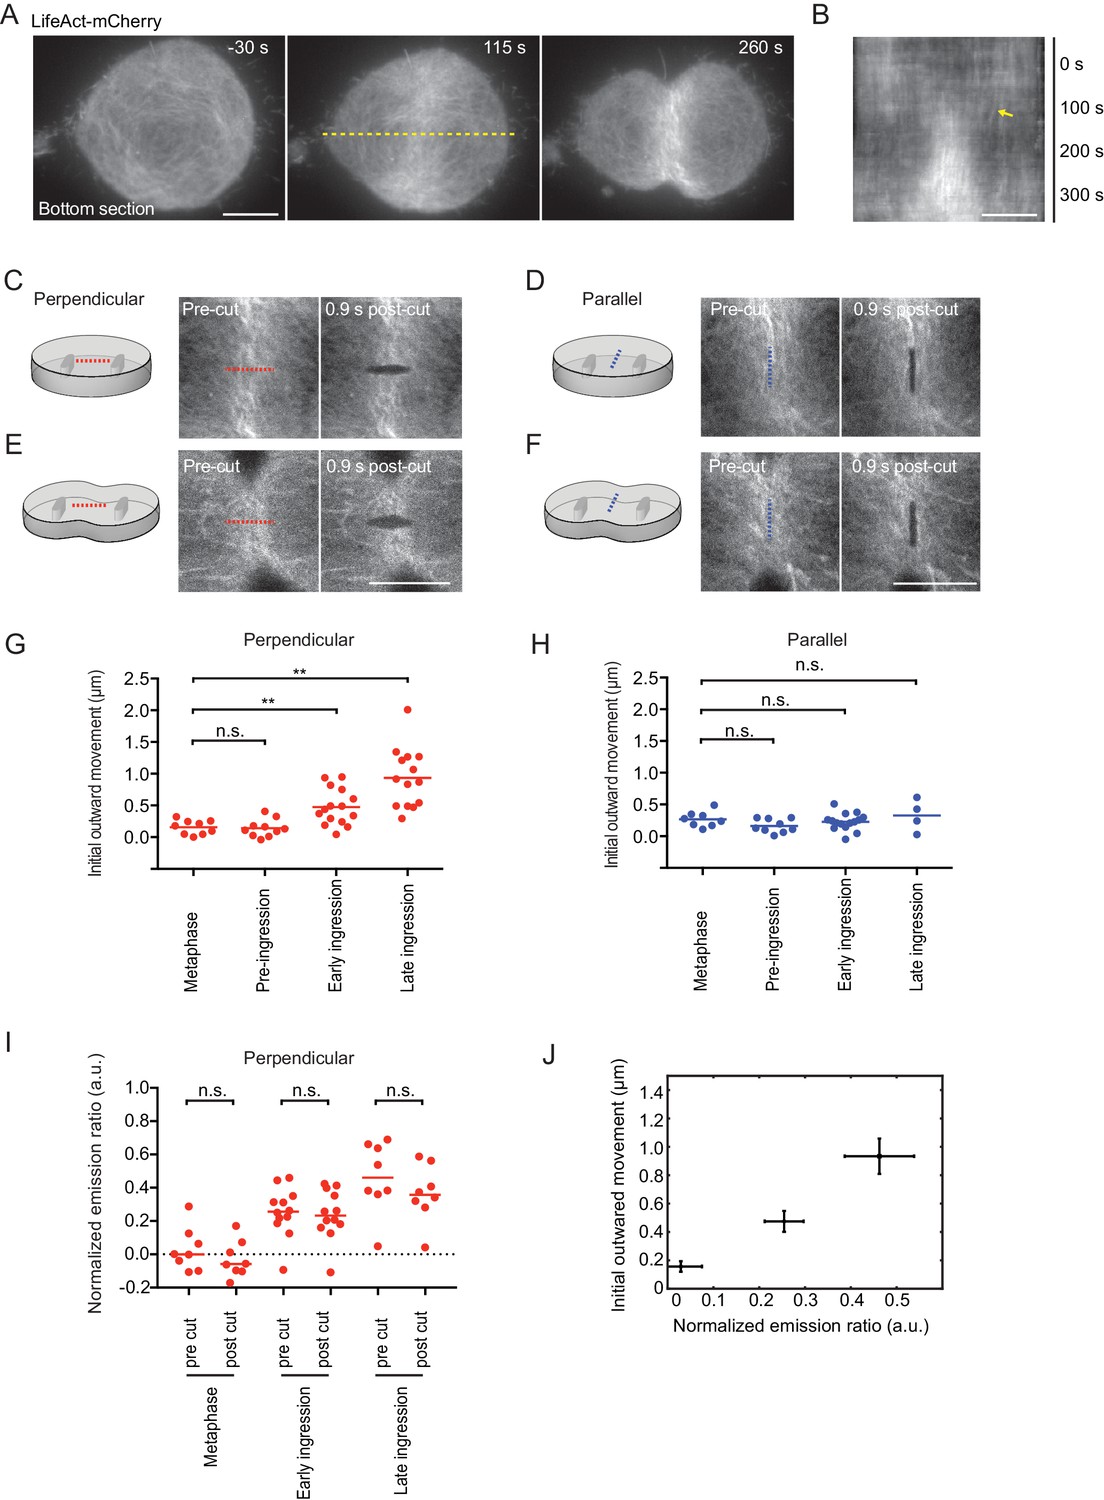
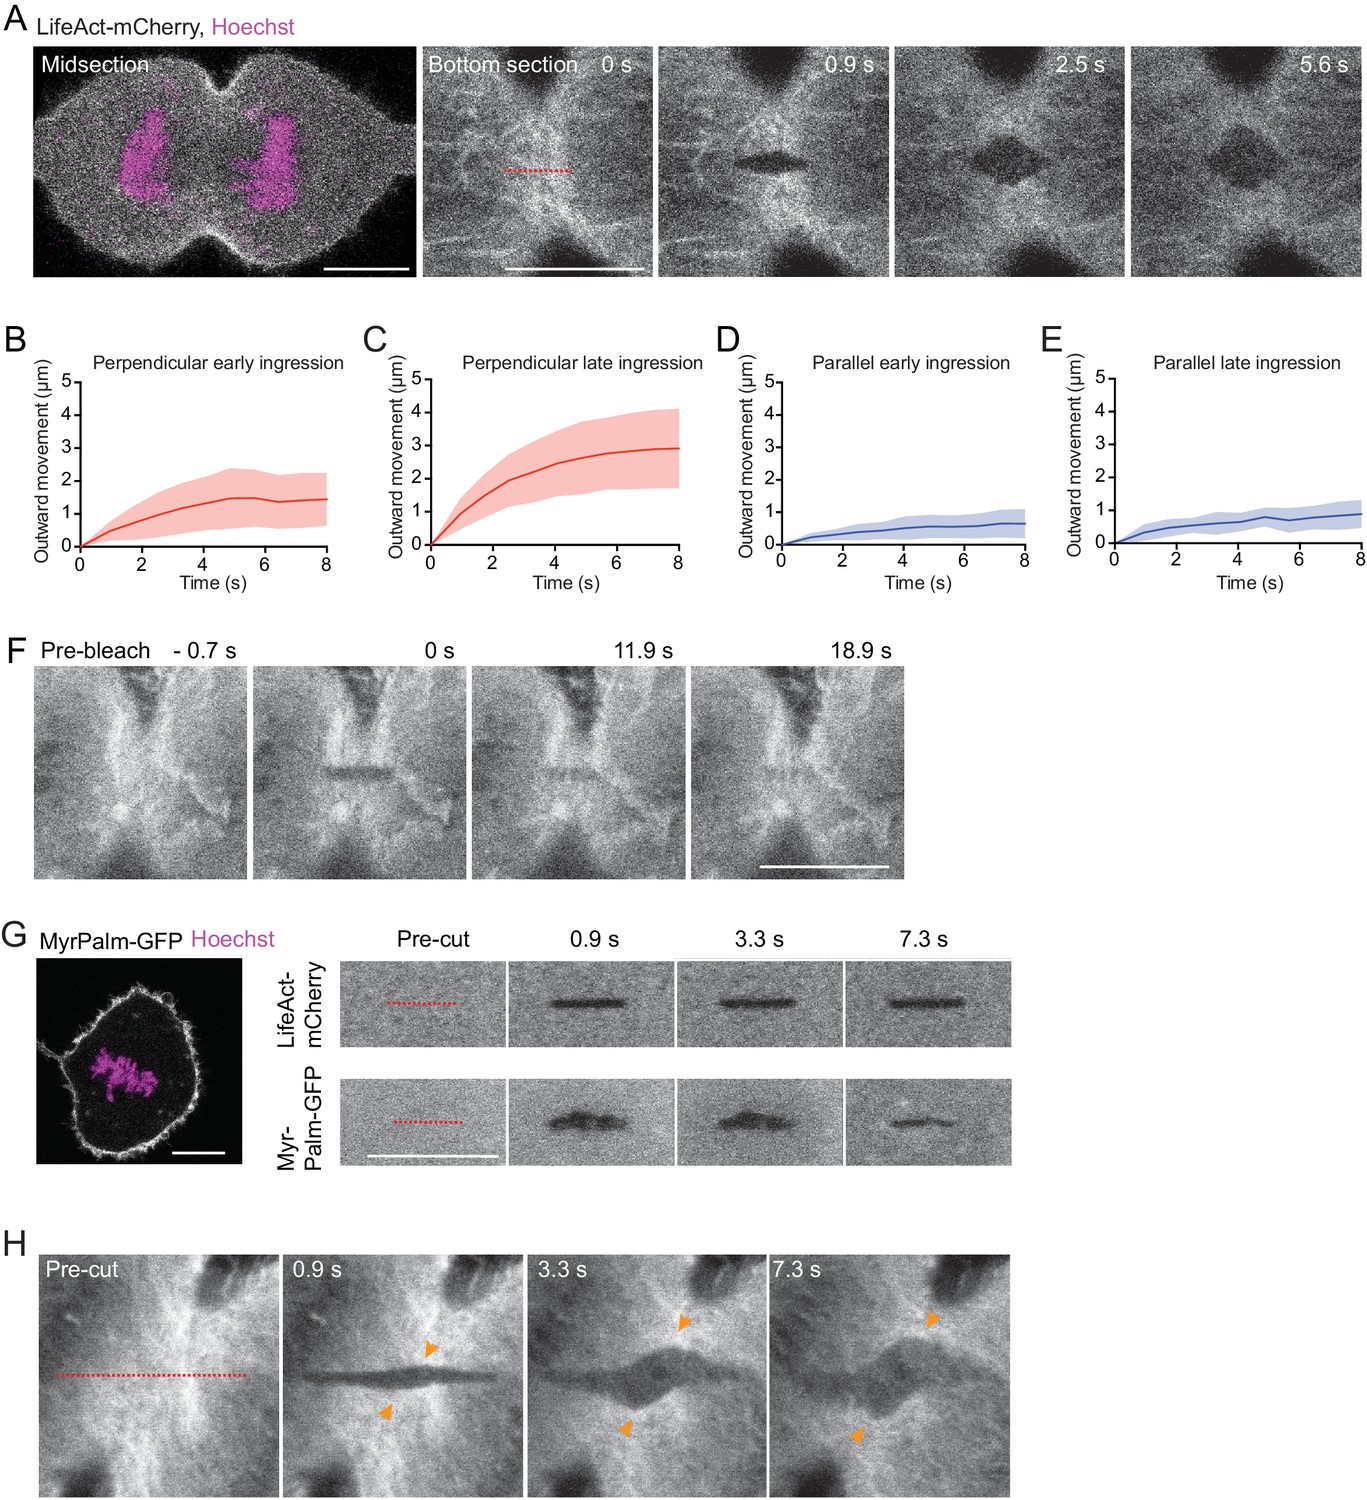
Laser microsurgery reveals cortical tension orientation during cytokinesis.
(A) Total internal reflection fluorescence (TIRF) microscopy of hTERT-RPE-1 under confinement stably expressing LifeAct-mCherry. Representative images of n = 11 cells. Time = 0 s at anaphase onset, as determined in phase contrast images of the same cell. Dashed yellow line indicates position of kymograph shown in (B), whereby yellow arrow indicates onset of lateral cortex displacement toward equator. (C-F) Laser microsurgery in live hTERT-RPE-1 cells grown in confinement microchambers, at different stages and orientations as illustrated in the schematics. Cells stably expressing LifeAct-mCherry were cut at their bottom actin cortex along a 5 μm linear path using a pulsed 915 nm laser as indicated by the dashed lines. Red indicates cutting perpendicular to the cell equator circumference, blue indicates parallel cutting orientation. (G) Quantification of cortex tension based on the initial cortical outward movement within 0.9 s after laser cutting perpendicular to the cell equator, for different mitotic stages as indicated. Dots represent individual cells, bars indicate median (metaphase: n = 9, pre-ingression: n = 10, early ingression: n = 15, late ingression: n = 14). (H) Cortical tension quantification for laser cutting parallel to the cell equator (metaphase: n = 8, pre-ingression: n = 9, early ingression: n = 15, late ingression: n = 4). (I) Laser microsurgery as in (C-F), but combined with fluorescence polarization microscopy. Dots represent mean normalized emission ratio values in individual cells measured adjacent to the cutting region before and after laser cutting (metaphase: n = 8, early-ingression: n = 12, late ingression: n = 8; **p<0.0021, n.s. >0.05 by MannWhitney-U test). (J) The increase in initial outward movement in perpendicular cutting experiments (G) correlates with an increase in normalized emission ratio (I). Dots represent mean, bars represent s.e.m. (normalized emission ratio, metaphase = 8, early ingression = 12, late ingression = 8; Initial outward movement, metaphase = 9, early ingression = 15, late ingression = 14). Scale bars = 10 µm.
Figure 4—figure supplement 1
Analysis of laser cutting experiments.
(A) Laser cutting of an hTERT-RPE-1 cell stably expressing LifeAct-mCherry (grey) stained with Hoechst (magenta), cultured in a confinement chamber. Dashed line indicates site of cutting with a pulsed 915 nm laser, which was performed at bottom sections. (B–D) Quantification of cortical outward movement after laser cutting perpendicular (B, C) and parallel (D, E) to cell equator for cytokinesis stages as indicated. Lines indicate mean and shaded areas indicate s.d. Early ingression perpendicular: n = 15, late ingression perpendicular: n = 14, early ingression parallel: n = 15, late ingression parallel: n = 4. (F) Photobleaching with a 488 nm excitation laser on actin-EGFP in an anaphase hTERT-RPE1 cell shows homogeneous recovery in the bleached area without lateral cortical displacement. n = 12 cells. (G) Laser cutting of a metaphase hTERT-RPE-1 cell expressing LifeAct-mCherry and Myr-Palm-GFP. Left shows overview image at a central optical section. Right shows laser microsurgery at the bottom surface, indicating that both actin cortex and plasma membrane are cut. n = 8. (H) Laser cutting as in (A), but with a longer cutting path (dashed red line) oriented at approximately 45° relative to the cleavage furrow. n = 11 cells, of which 10 showed diagonal cortex displacement. Scale bars, 10 µm.
Figure 5
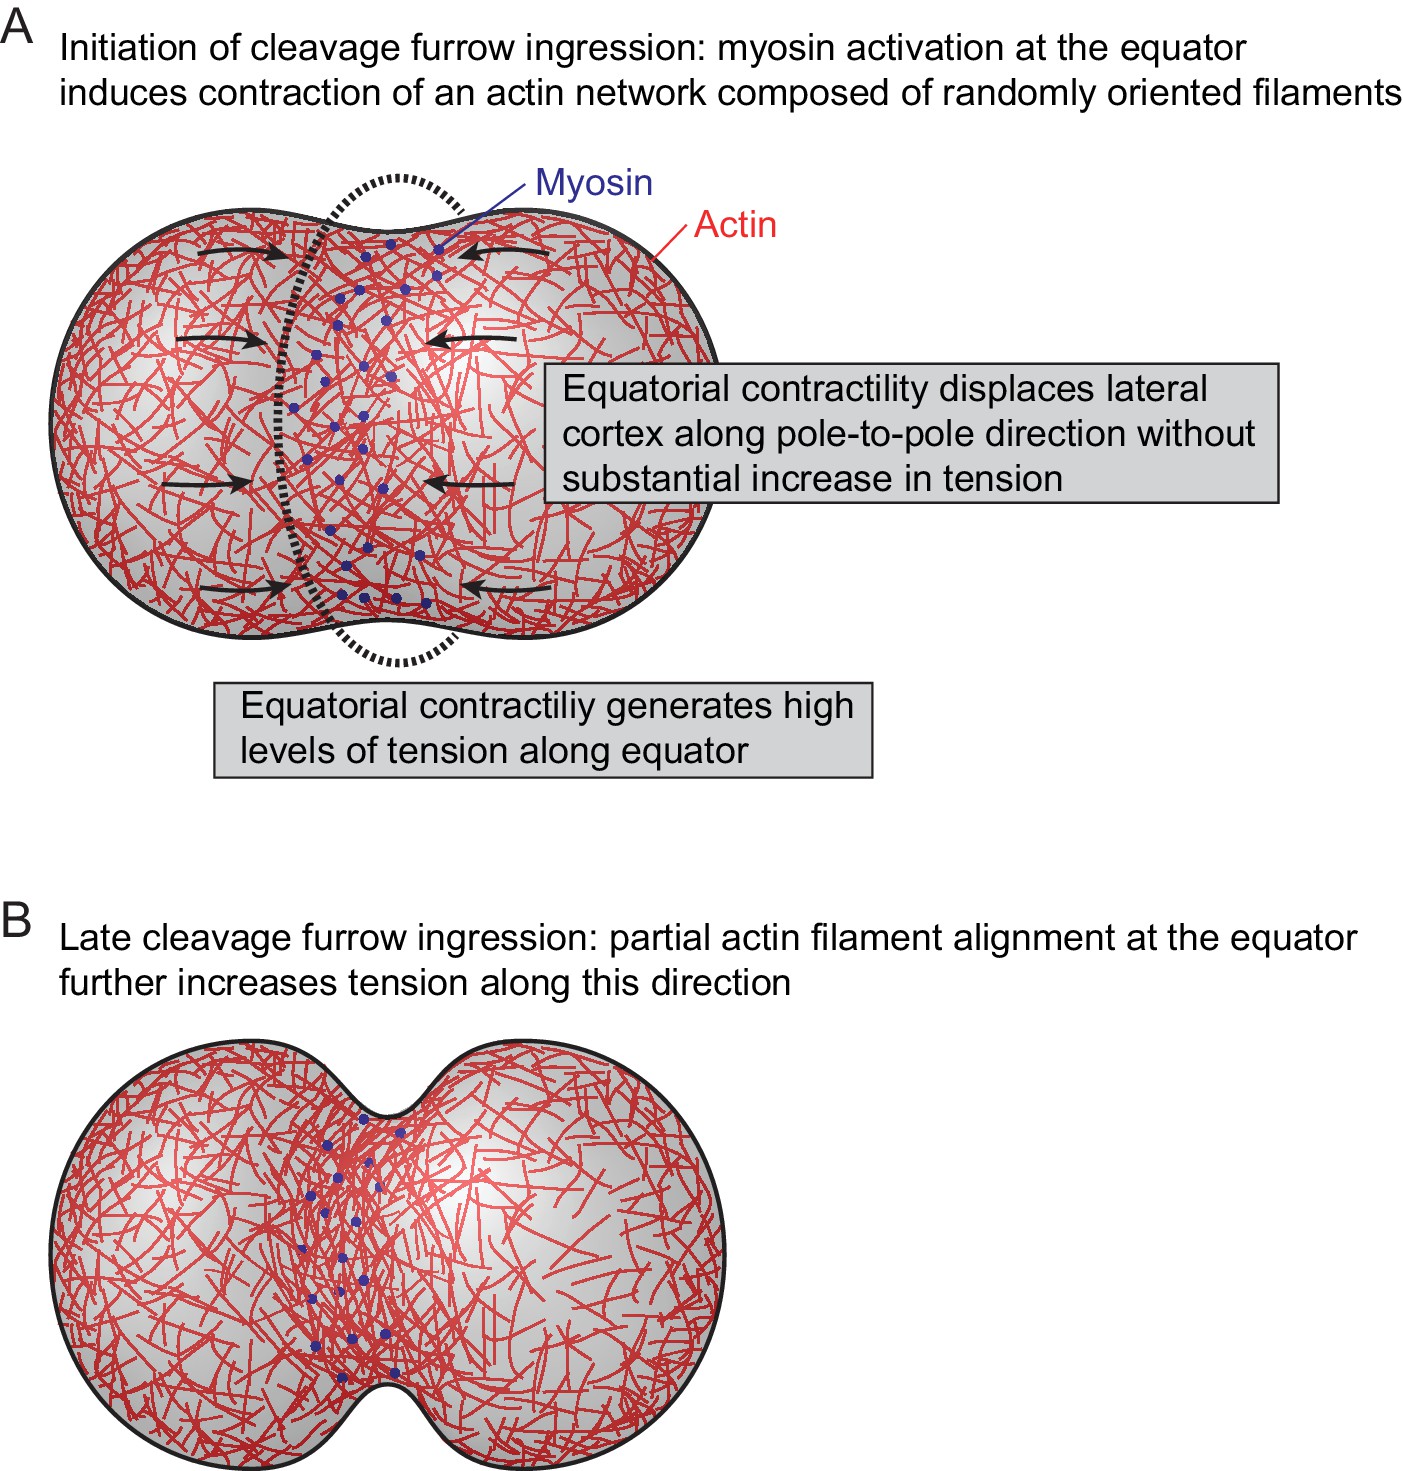
Model for actomyosin network reorganization during cytokinesis of vertebrate cells.
For details see main text.
Author response image 1
Videos
Video 1
TIRF microscopy of hTERT-RPE-1 expressing LifeAct-mCherry under confinement stably.
Time = 0 s at anaphase onset, as determined in phase contrast images of the same cell. Video shows same cell as Figure 4A,B.
Additional files
-
Source code 1
- https://doi.org/10.7554/eLife.30867.015
-
Transparent reporting form
- https://doi.org/10.7554/eLife.30867.016
Download links
A two-part list of links to download the article, or parts of the article, in various formats.
Downloads (link to download the article as PDF)
Open citations (links to open the citations from this article in various online reference manager services)
Cite this article (links to download the citations from this article in formats compatible with various reference manager tools)
Cytokinesis in vertebrate cells initiates by contraction of an equatorial actomyosin network composed of randomly oriented filaments
eLife 6:e30867.
https://doi.org/10.7554/eLife.30867


