Long-term antigen exposure irreversibly modifies metabolic requirements for T cell function
- Université Libre de Bruxelles, Belgium
- Institut de Recherche Expérimentale et Clinique, Université Catholique de Louvain, Belgium
- Institute of Molecular Biology and Medicine, Université Libre de Bruxelles, Belgium
Figures
Figure 1
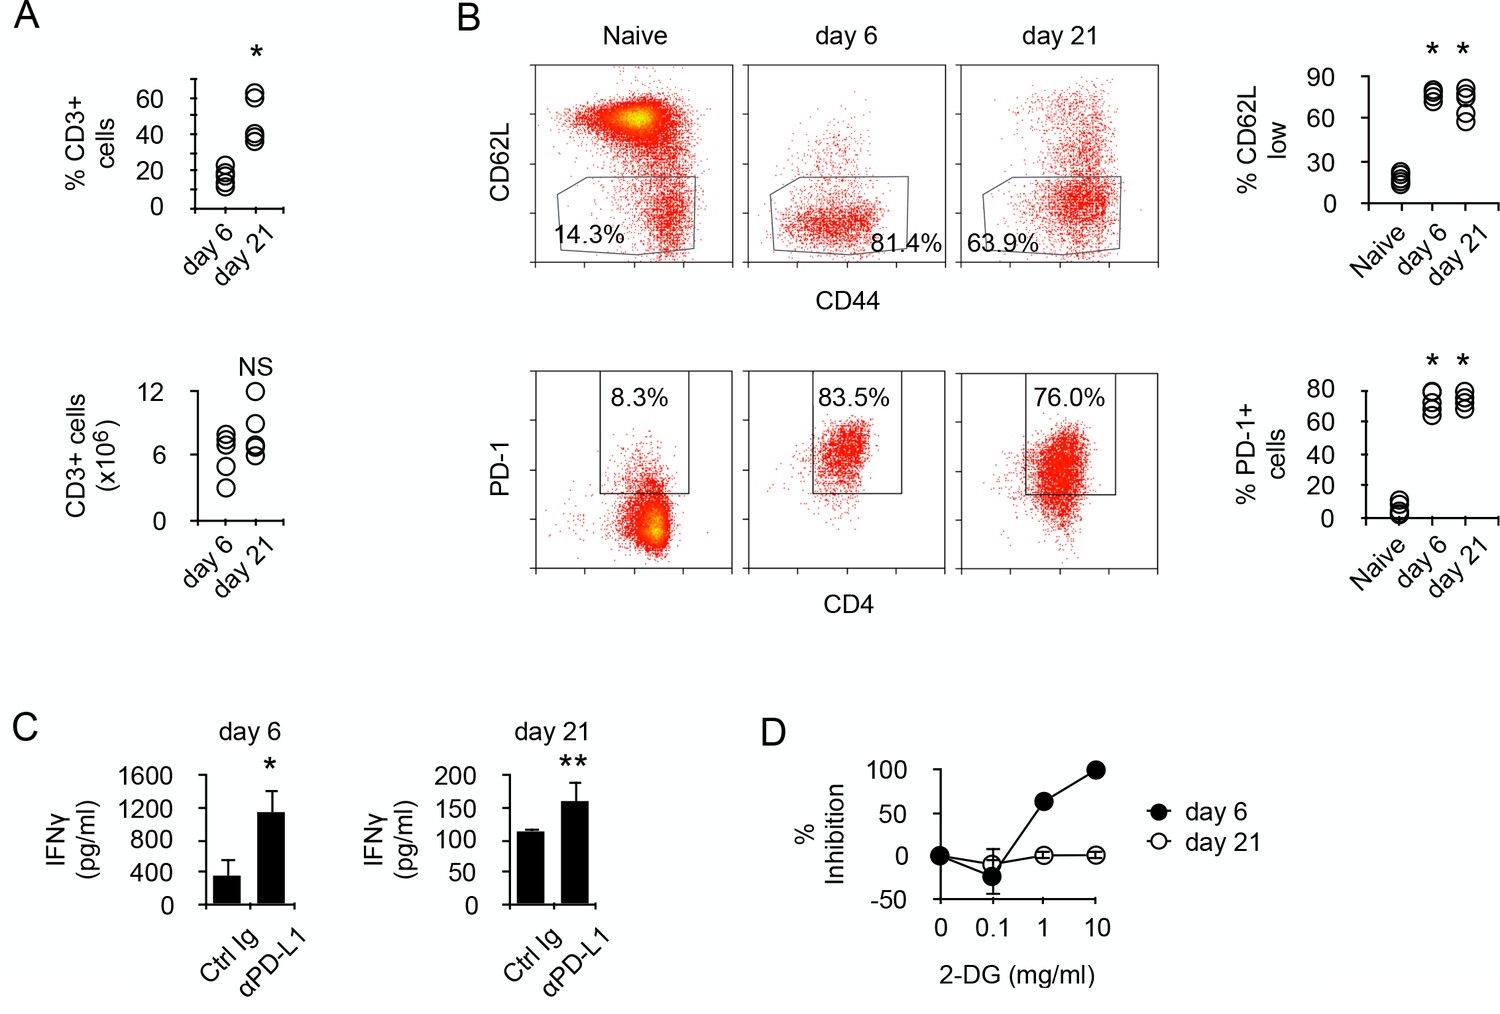
Prolonged chronic alloantigen stimulation alters functional metabolic requirements in alloreactive CD4 +T cells.
(A) Frequencies and numbers of CD3+ T cells in the spleen of non-irradiated B6 (H-2b) Rag2-/- Il2rg-/- recipients 6 and 21 days after reconstitution with purified BALB/c (H-2d) CD4+ T cells. Represented data are means ± SEM. Data presented are representative of two independent experiments with 4–5 mice in each experimental group. *indicates p=0.0079 by the Mann-Whitney test. NS indicates non-significant. (B) Phenotype of chronic alloreactive CD4+ T cells. Spleen CD3+ cells from mice as described in (A) were analyzed for their expression of CD44, CD62L and PD-1 by flow cytometry. Represented data are means ± SEM. Data presented are representative of two independent experiments with 4–5 mice in each experimental group. *indicates p=0.0079 (compared to naive) by the Mann-Whitney test. (C) IFNγ production by alloreactive CD4+ T cells purified from mice as described in (A) and stimulated by irradiated B6 splenocytes in the presence of control or neutralizing anti-PD-L1 antibodies. Represented data are means ± SEM of five replicates and are representative of 2 independent experiments. * indicates p=0.0079 and ** indicate p<0.0286 by the Mann-Whitney test. (D) Inhibition (%) of IFNγ production by alloreactive CD4+ T cells purified and stimulated as in (C) with different doses of 2-Deoxy-D-glucose (2-DG). Represented data are means ± SEM of five replicates and are representative of 2 independent experiments.
Figure 2
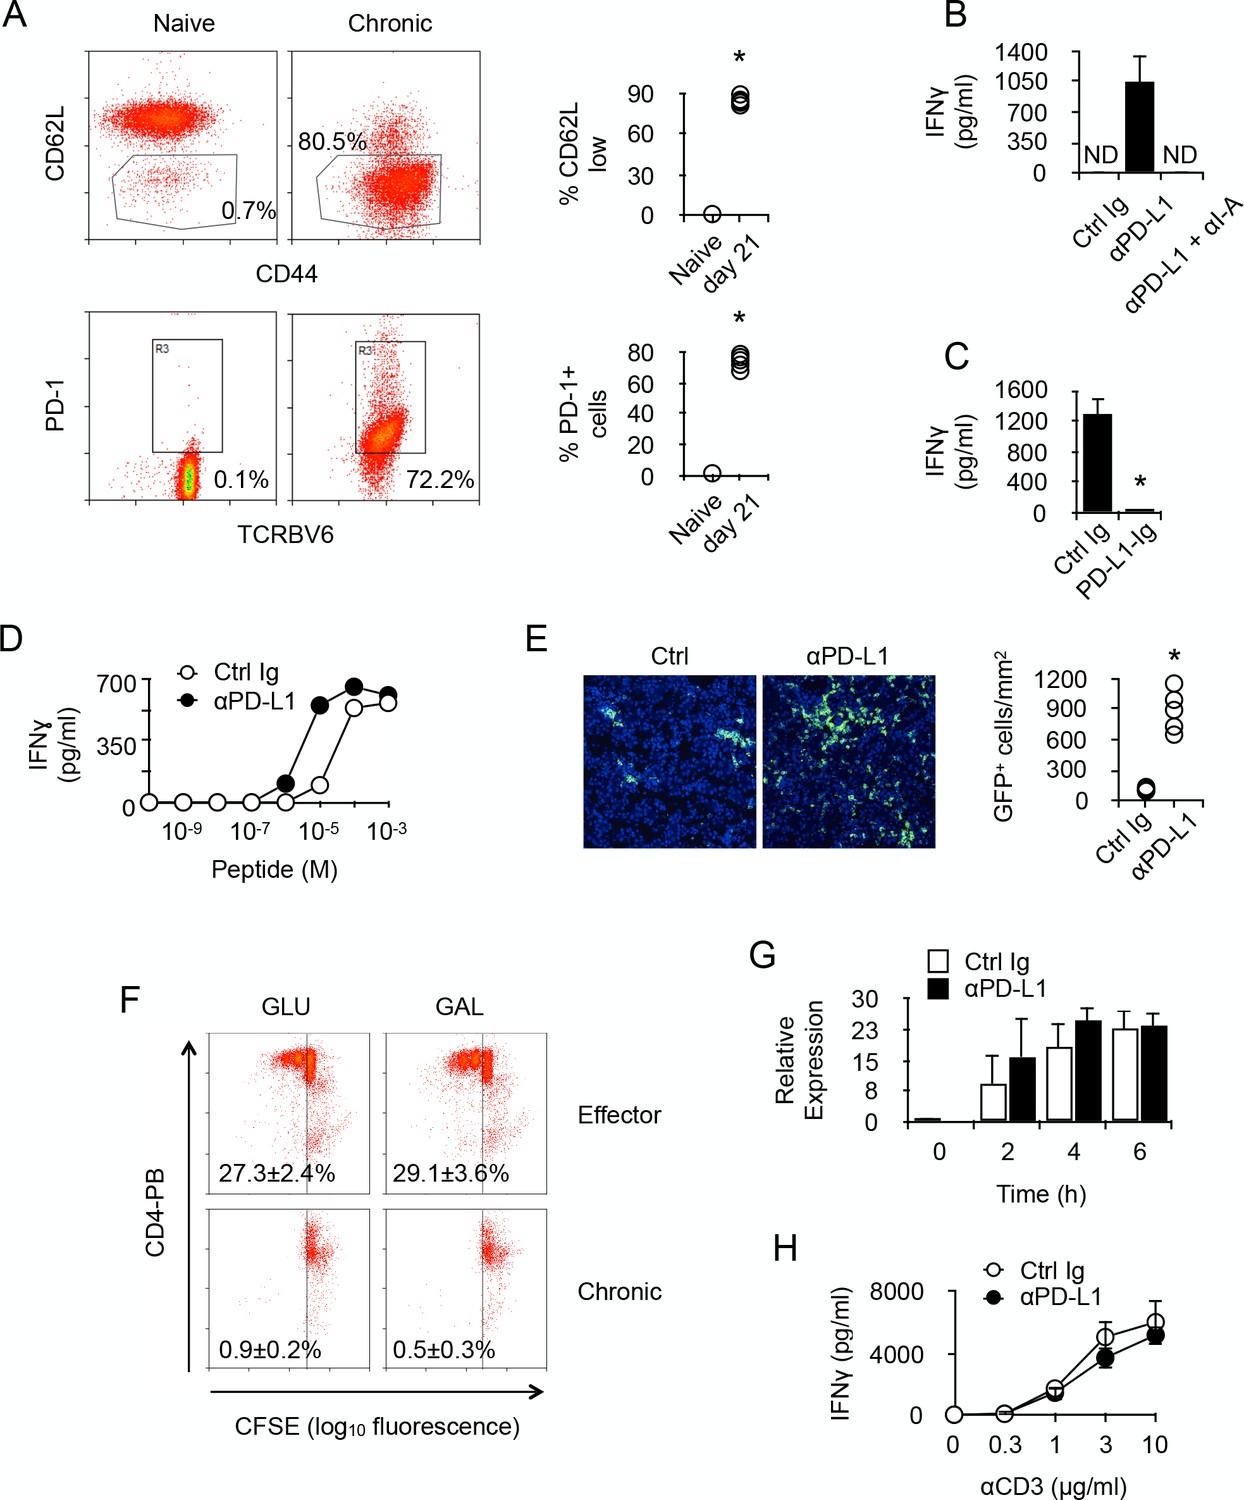
PD-1 controls the activity of chronic anti-male CD4 +T cells.
(A) Phenotype of chronic anti-male CD4+ T cells. Spleen CD3+ cells from normal Marilyn mice (naive) or from non-irradiated B6 male (H-2b) Rag2-/- Il2rg-/- recipients 21 days after reconstitution with purified Marylin CD4+ TCRBV6+ T cells (chronic), were analyzed for their expression of CD44, CD62L and PD-1 by flow cytometry. Represented data are means ± SEM. Data presented are representative of two independent experiments with 4–5 mice in each experimental group. * indicates p=0.0079 (compared to naive) by the Mann-Whitney test. (B) IFNγ production in the culture supernatant of spleen cells isolated from non-irradiated male B6 (H-2b) Rag2-/- Il2rg-/- recipients 21 days after reconstitution with purified Marylin CD4+ TCRBV6+ T cells. Control, anti-PD-L1 and/or anti-I-A/I-E neutralizing antibodies were added to the cultures. Represented data are means ± SEM of five replicates. Data presented are representative of three independent experiments. ND indicates below detection limits. (C) IFNγ production by CD4+ T cells purified from non-irradiated B6 male (H-2b) Rag2-/- Il2rg-/- recipients 21 days after reconstitution with purified Marylin CD4+ TCRBV6+ T cells. Cells were stimulated with anti-CD3/CD28 antibodies in the presence of immobilized Ctrl Ig or PD-L1-Ig fusion proteins. Represented data are means ± SEM of five replicates. Data presented are representative of three independent experiments. * indicates p=0.0079 (compared to Ctrl) by the Mann-Whitney test. (D) IFNγ production by CD4+ T cells purified as in C and stimulated with male peptide-loaded B6 Cd3-/- bone marrow-derived dendritic cells in the presence of Ctrl or anti-PD-L1 neutralizing antibodies. Represented data are means ± SEM of three replicates. Data presented are representative of two independent experiments. (E) Cell counts of GFP+ T cells infiltrating the liver of non-irradiated male B6 (H-2b) Rag2-/- Il2rg-/- recipients 21 days after reconstitution with purified Marylin GFP+ CD4+ TCRBV6+ T cells and that received i.p. Ctrl or anti-PD-L1 neutralizing antibodies. * indicates p=0.0079 (compared to Ctrl antibody group) by the Mann-Whitney test. Represented data are means ± SEM. Data presented are representative of two independent experiments with 4–5 mice in each experimental group. (F) In vitro proliferation is assessed by fluorescent decay in CFSE-stained chronic or effector T cells after anti-CD3/CD28 stimulation. (G) IFNγ mRNA relative expression by anti-CD3/CD28-stimulated CD4+ T cells purified from non-irradiated B6 male (H-2b) Rag2-/- Il2rg-/- recipients 21 days after reconstitution with purified Marylin CD4+ TCRBV6+ T cells. Purified T cells were stimulated in the presence of anti-PD-L1 or control antibodies for 2, 4 and 6 hr. No significant difference was found between the two conditions. (H) IFNγ production by anti-CD3/CD28-stimulated CD4+ T cells purified from non-irradiated B6 male (H-2b) Rag2-/- Il2rg-/- recipients 21 days after reconstitution with purified Marylin CD4+ TCRBV6+ T cells. Purified T cells were stimulated in the presence of anti-PD-L1 or control antibodies. No significant difference was found between the two conditions.
Figure 3
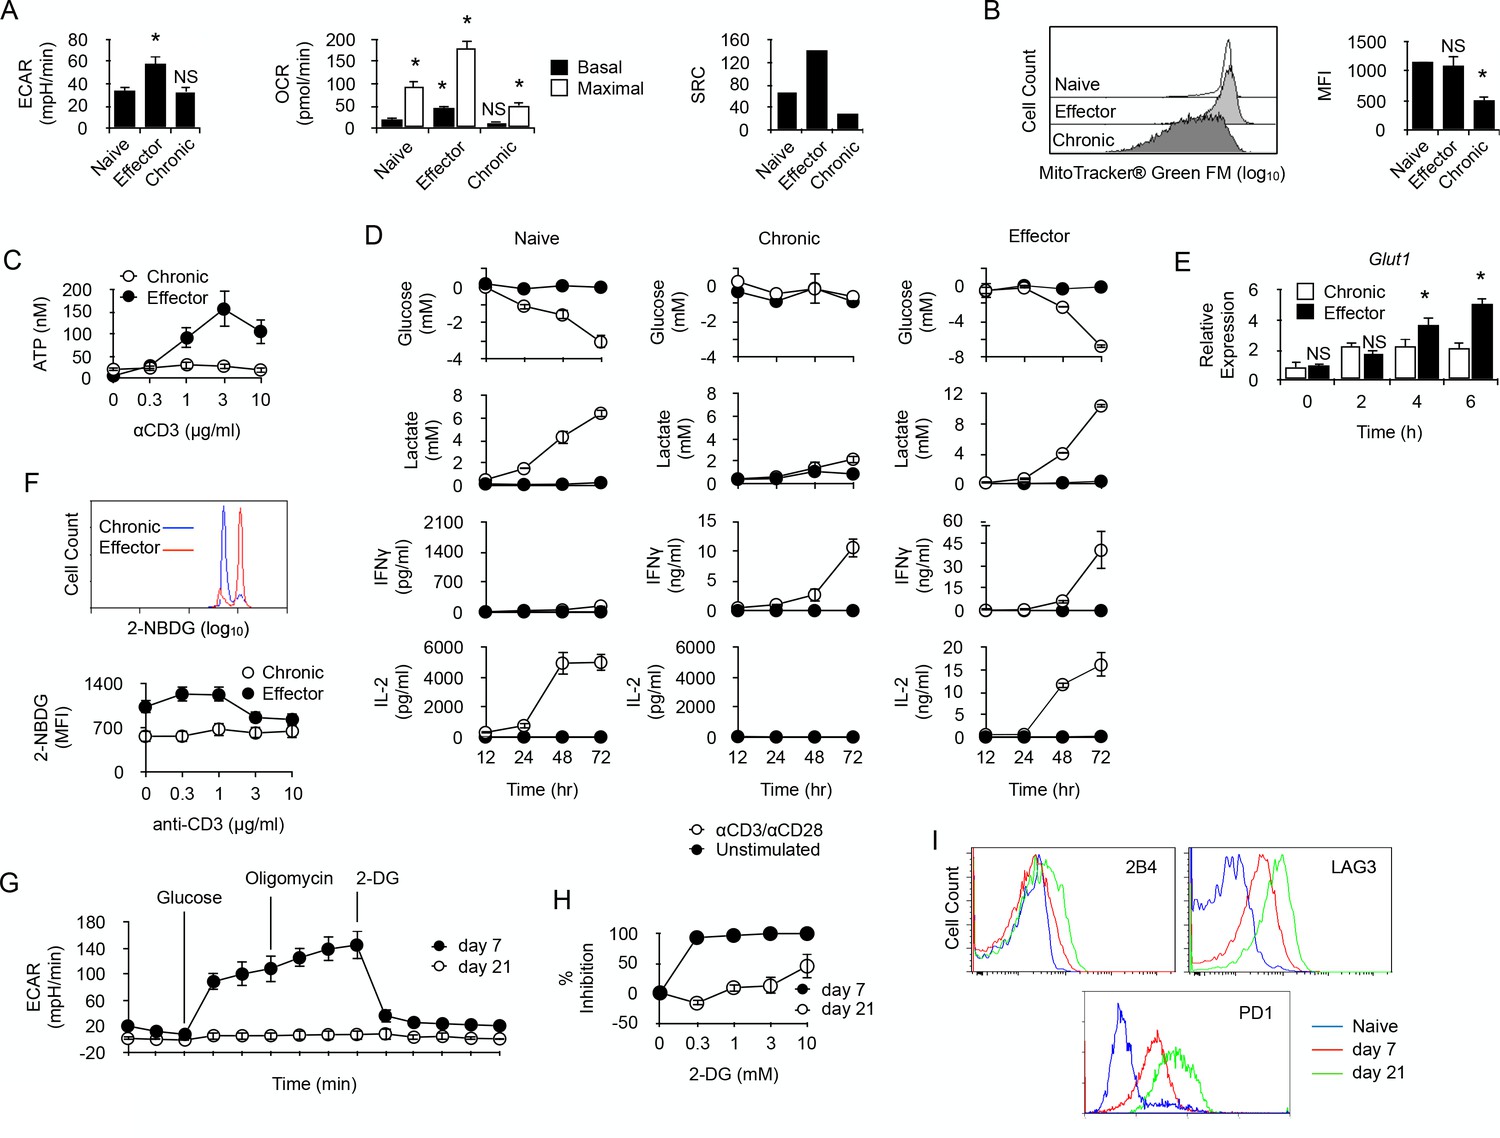
Long-term chronic anti-male CD4+T cells exhibit a low metabolism and are unable to shift their metabolism to produce IFNγ after activation.
(A) Basal ECAR (left) and basal and maximal OCR (right) of naive, effector or chronic CD4+ T cells. Data (means ± SEM of five replicated cultures) are representative of two independent experiments. * indicates p=0.0079 by the Mann-Whitney test. (B) Mitochondria mass of effector or chronic CD4+ T cells labeled with MitoTracker Green FM. Means ± SEM of MFI from T cells isolated from 4 mice per group is shown. Data are representative of two independent experiments. * indicates p=0.0079 by the Mann-Whitney test. NS is non-significant. (C) ATP in effector or chronic CD4+ T cells before and after anti-CD3/CD28 antibody stimulation. Data (means ± SEM of five replicated cultures) are representative of two independent experiments. (D) Purified naive, effector or chronic CD4+ T cells were stimulated with anti-CD3/CD28 antibodies or left unstimulated. After 12, 24, 48 and 72 hr, culture supernatants were harvested and glucose, lactate, IL-2 and IFNγ concentrations were determined as described in Material and methods. Data (means ± SEM from five replicated cultures) are representative of two independent experiments. (E) GLUT1 mRNA expression was assessed by quantitative PCR in effector and chronic CD4+ T cells after activation with PMA/ionomycin. Data (mean ± SEM) are from 4 to 5 mice per group and are representative of two independent experiments. * indicates p=0.0079 by the Mann-Whitney test. (F) Flow cytometry analysis of effector or chronically stimulated (chronic) CD4+ T cells labeled with 2-NBDG ex vivo (higher panel) or following anti-CD3/CD-28 antibody stimulation (lower panel). Means ± SEM of MFI from five animals per group and are representative of three independent experiments. (G) Mitostress assay on chronic CD4+ T cells isolated 7 or 21 days isolated from non-irradiated B6 male (H-2b) Rag2-/- Il2rg-/- recipients 21 days after reconstitution with purified Marylin CD4+ TCRBV6+ T cells. Data are representative of two independent experiments. (H) 2-DG-mediated inhibition of IFNγ production by anti-CD3/CD28-stimulated chronic CD4+ T cells. Data (mean ±SEM) were calculated from five replicated cultures and are representative of two independent experiments. (I) Ex vivo expression of inhibitory receptors 2B4, LAG3 and PD-1 by naive Marilyn CD4+ T cells or chronic CD4+ T cells purified from non-irradiated B6 male (H-2b) Rag2-/- Il2rg-/- recipients 7 or 21 days after reconstitution with purified Marylin CD4+ TCRBV6+ T cells. Data are representative of two independent experiments.
Figure 4
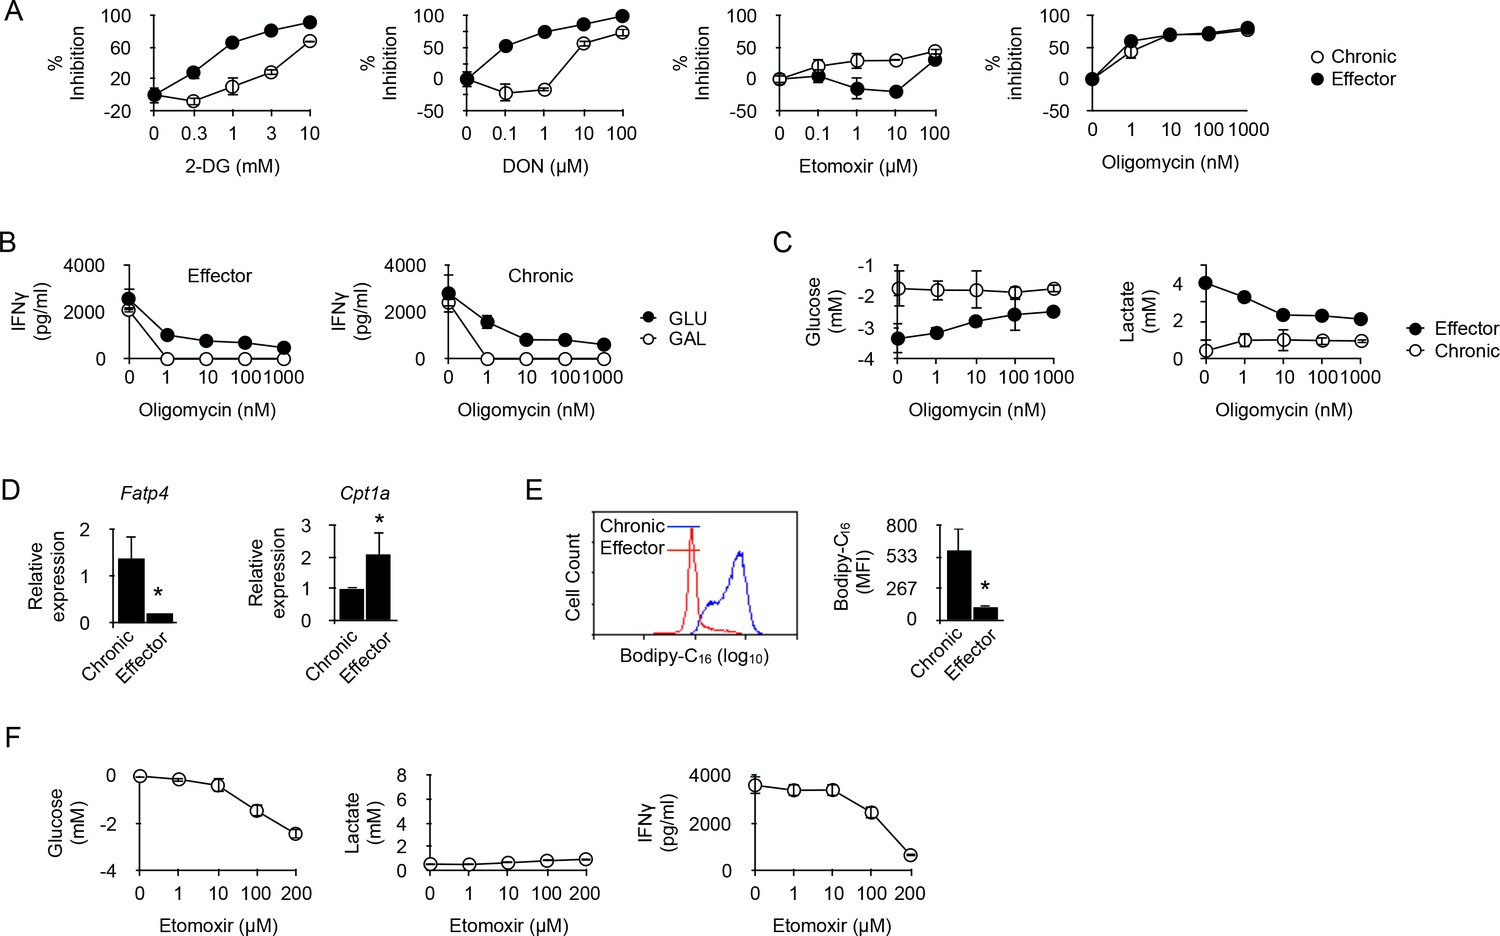
Fatty acid oxidation supports the energy demand required for IFNγ production in long-term chronic CD4+ T cells.
(A) Effector or chronic CD4+ T cells were stimulated with anti-CD3/CD28 antibodies with or without 2-DG, DON, Etomoxir or oligomycin. After 48 hr, culture supernatants were harvested and IFNγ concentrations were determined by ELISA. Percent inhibition were calculated as described in Materials and methods. Data (mean ± SEM) were calculated from five replicated cultures and are representative of three independent experiments. (B) IFNγ production by effector (left) and chronic (right) T cells stimulated with anti-CD3/CD28 antibodies for 48 hr in medium containing glucose or galactose, in the presence of oligomycin. Data (mean ± SEM) were calculated from five replicated cultures and are representative of three independent experiments. (C) Glucose consumption (left) and lactate production (right) in cultures of effector or chronic T cells stimulated with anti-CD3/CD28 antibodies for 48 hr in the presence of oligomycin. Data (mean ± SEM) were calculated from five replicated cultures and are representative of three independent experiments. (D) Ex vivo relative expression of FATP4 and CPT1a mRNA in chronic or effector T cells. Data (mean ± SEM) were calculated from five mice per group and are representative of two independent experiments. * indicates p=0.0079 by the Mann-Whitney test. (E) Bodipy-C16 uptake by chronic or effector T cells. Data (mean ± SEM) were calculated from five replicated cultures and are representative of two independent experiments. * indicates p=0.0079 by the Mann-Whitney test. (F) Glucose consumption (left panel), lactate (middle panel) and IFNγ production (right panel) by chronic CD4+ T cells stimulated for 48 hr by anti-CD3/CD28 antibodies in the presence of FAO inhibitor Etomoxir. Data were calculated from five replicated cultures and are representative of two independent experiments.
Figure 5

PD-1 is not required for the induction and maintenance of the metabolic profile developed by chronic CD4+ T cells.
(A) IFNγ production in cultures of whole spleen cells isolated from male Rag2-/- Il2rg-/- B6 recipents adoptively transferred with anti-male Pdcd1+/+ or Pdcd1-/- Rag2-/- Marilyn T cells for 21 days. Anti-I-A/I-E antibodies were added as indicated. Data (mean ± SEM of five replicated cultures) are representative of three independent experiments. * indicates p=0.0079 (compared to Pdcd1+/+) by the Mann-Whitney test. NS indicates non-significant. (B) Basal ECAR of chronic Pdcd1+/+ or Pdcd1-/- CD4+ T cells and effector CD4+ T cells. Data (mean ± SEM of five replicated cultures) are representative of two independent experiments. * indicates p=0.0079 and NS indicates non-significant by the Mann-Whitney test. (C) Basal and maximal OCR of chronic Pdcd1+/+ or Pdcd1-/- CD4+ T cells and effector CD4+ T cells. (left panel). Maximal/basal OCR ratios (right panel). Data (mean ± SEM of five replicated cultures) are representative of two independent experiments. * indicates p=0.0079 by the Mann-Whitney test. (D) Chronic Pdcd1+/+ or Pdcd1-/- CD4 +T cells or effector CD4+ T cells were stimulated with anti-CD3/CD28 antibodies. After 48 hr, culture supernatants were harvested and lactate, IL-2 and IFNγ concentrations were determined as described in Material and methods. Data (mean ± SEM from five replicated cultures) are representative of three independent experiments. (E) Chronic Pdcd1+/+ or Pdcd1-/- CD4+ T cells or effector CD4+ T cells were stimulated with anti-CD3/CD28 antibodies in the presence of 2-DG, DON, Etomoxir or oligomycin. After 48 hr, culture supernatants were harvested and IFNγ concentrations were determined by ELISA. Percent inhibition was calculated as described in Materials and methods. Data (mean ± SEM) were calculated from five replicated cultures and are representative of three independent experiments. (F) Ex vivo relative expression of FATP4 and CPT1a mRNA in Pdcd1+/+ or Pdcd1-/- chronic T cells. Data (mean ± SEM) were calculated from five replicated cultures and are representative of three independent experiments. * indicates p=0.0079. (G) Bodipy-C16 uptake by in Pdcd1+/+ or Pdcd1-/- chronic T cells. Data are representative of two independent experiments.
Figure 6

By limiting T cell metabolism, PD-1 prevents activation-dependent mitochondrial ROS production and cell death.
(A) Flow cytometry analysis of chronic Pdcd1+/+ or Pdcd1-/- CD4+ T cells for intra-mitochondrial ROS production. Ex vivo spleen cells were labeled with MitoSOX Red and analyzed by flow cytometry. Gating was carried out on TCRBV6+ CD4+ cells as indicated. Mean ± SEM of percentage of positive cells from TCRBV6+ CD4+ T cells isolated from 5 mice is shown. Data are representative of two independent experiments. * indicates p=0.0079. (B) Flow cytometry analysis of chronic Pdcd1+/+ or Pdcd1-/- CD4+ T cells for their mitochondrial membrane potential. Ex vivo spleen cells were labeled with MitoTracker Red CMXRos and analyzed by flow cytometry. Analysis was gated on TCRBV6+ CD4+ cells as in (A). Mean ± SEM of MFI from TCRBV6+ CD4+ T cells isolated from 5 mice per group is shown. Data are representative of two independent experiments. * indicates p=0.0079 by the Mann-Whitney test. (C) Cell viability of purified chronic Pdcd1+/+ or Pdcd1-/- CD4+ T cells after anti-CD3/CD28 stimulation for 24 hr culture with or without NAC. Mean ± SEM of percentage of viable cells (DyeFL-negative) in TCRBV6+ CD4+ T cells isolated from 5 mice per group is shown. Data are representative of two independent experiments. * indicates p=0.0079 by the Mann-Whitney test. NS indicates non-significant. (D) Frequencies (%) of anti-male CD4+ TCRBV6+ T cells in the spleen of lymphopenic male recipients. Cells were analyzed 7 and 28 days after adoptive transfer. Mean ± SEM of percentage of TCRBV6+ CD4+ T cells isolated from 6 mice per group is shown. Data are representative of two independent experiments. * indicates p=0.0079 by the Mann-Whitney test. NS indicates non-significant.
Figure 7
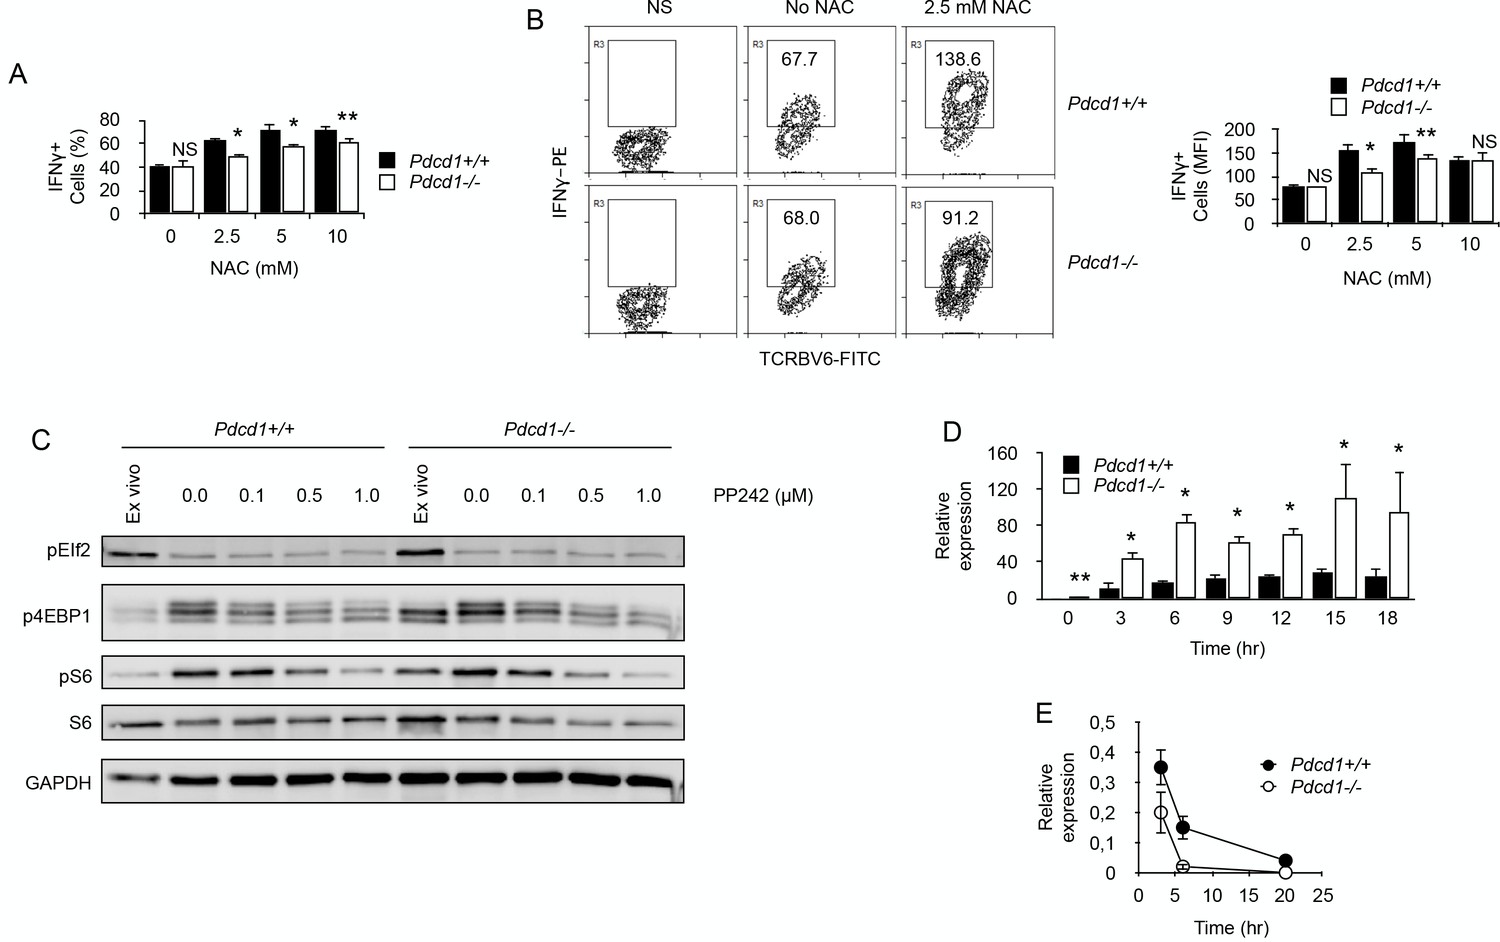
By limiting ROS production, PD-1 maintains functional fitness in chronically stimulated CD4+ T cells.
(A) Frequencies (%) of IFNγ-producing cells among purified chronic Pdcd1+/+ or Pdcd1-/- CD4+ T cells stimulated with anti-CD3/CD28 antibodies for 24 hr with or without NAC. After adding Brefeldin for the last 4 hr, cells were labelled for intracellular IFNγ. Mean ± SEM from T cells isolated from 5 mice per group is shown. Data are representative of two independent experiments. * and ** indicate p=0.0079 and p=0.0286, respectively, by the Mann-Whitney test. NS indicates non-significant. (B) Relative IFNγ production among purified chronic Pdcd1+/+ or Pdcd1-/- CD4+ T cells stimulated with anti-CD3/CD28 antibodies for 24 hr with or without NAC as in D. After adding Brefeldin for the last 4 hr, cells were labelled for intracellular IFNγ. Mean of MFI ± SEM from T cells isolated from 5 mice per group is shown. Data are representative of two independent experiments. * and ** indicate p=0.0079 and p=0.0286, respectively, by the Mann-Whitney test. NS indicates non-significant. (C) Western blotting analysis of mTORC1-dependent control of protein translation. Phosphorylation status of mTORC1 targets S6 protein and 4EBP1 was analysed in chronic Pdcd1+/+ or Pdcd1-/- CD4+ T cells ex vivo or after stimulation with anti-CD3/CD28 antibodies for 48 hr with or without mTOR inhibitor PP242. Analysis of EIf2 phosphorylation was used as a specificity control. Data are representative of three independent experiments. (D) Relative expression of IFNγ mRNA in chronic Pdcd1+/+ or Pdcd1-/- CD4+ T cells stimulated by anti-CD3/CD28 antibodies for the indicated periods of time. Data (mean ± SD) are representative of two independent experiments including 4 mice per group. * and ** indicate p=0.0079 and p=0.0286, respectively. (E) Analysis of IFNγ mRNA decay in chronic Pdcd1+/+ or Pdcd1-/- CD4+ T cells stimulated by anti-CD3/CD28 antibodies. Data (mean ± SD) are one experiment including 4 mice per group.
Figure 8

Different outcome from PD-1-mediated regulation of T cell metabolism in early or late chronic antigen stimulation.
In chronic T cells responsible for early GVHD, PD-1-mediated inhibition of T cell metabolism promotes mitochondrial dysfunction and cell death. In T cells responsible for late GVHD, failure to engage glycolysis after PD-1 blockade stimulates OXPHOS. This leads to overload of the electron transport chain (ETC), ROS production, mRNA decay and cell death.
Tables
Table 1
Proteins down-regulated in chronic T cells.
https://doi.org/10.7554/eLife.30938.005| Pathway | Gene symbol | Protein name | Fold | P value |
|---|---|---|---|---|
| Glycolysis | Pfkp | Phosphofructokinase | 0.76 | 0.0320 |
| Gapdh | Glyceraldehyde-3-phosphate dehydrogenase | 0.68 | 0.0150 | |
| Pgk1 | Phosphoglycerate kinase 1 | 0.62 | 0.0020 | |
| Pkm | Pyruvate kinase | 0.64 | 0.0090 | |
| Non-oxidative Pentose Phosphate | Taldo1 | Transaldolase 1 | 0.68 | 0.0030 |
| Tkt | Transketolase | 0.52 | 0.0140 | |
| Citric Acid Cycle | Got2 | Glutamatic-oxaloacetic transaminase 2, mitochondrial | 0.58 | 0.0030 |
| Aco2 | Aconitase 2, mitochondrial | 0.54 | 0.0200 | |
| Mdh2 | Malate dehydrogenase 2,NAD (mitochondrial) | 0.36 | 0.0010 | |
| Fatty Acid β-oxidation | Acad1 | Acyl-Coenzyme A dehydrogenase | 0.63 | 0.0090 |
| Hadha | Hydroxyacyl-Coenzyme A dehydrogenase/ 3-ketoacyl-Coenzyme A thiolase/enoyl-Coenzyme A hydratase (trifunctional protein), alpha subunit | 0.47 | 0.0110 | |
| Respiratory Chain | Uqcrc1 | Ubiquinol-cytochrome c reductase core protein 1 | 0.80 | 0.0130 |
| Atp5h | ATP synthase, H + transporting, mitochondrial F0 complex, subunit D | 0.64 | 0.0460 | |
| Glutaminolysis | Tgm1 | Transglutaminase 1, K polypeptide | 0.40 | 0.0040 |
| Protection against oxydative stress | Prdx2 | Peroxiredoxin 2 | 0.67 | 0.0310 |
| Txn1 | Thioredoxin 1 | 0.52 | 0.0100 | |
| Prdx1 | Peroxiredoxin 1 | 0.43 | 0.0004 | |
| Park7 | Parkinson disease (autosomal recessive, early onset) 7 | 0.42 | 0.0030 |
Additional files
-
Supplementary file 1
2D-gel identification of proteins differentially expressed by naive or chronic T cells.
- https://doi.org/10.7554/eLife.30938.011
-
Supplementary file 2
Two-dimensional gel electrophoresis of proteins from purified naive and chronic CD4 T cells.
The figure presents examples of protein separation obtained in this study.
- https://doi.org/10.7554/eLife.30938.012
-
Transparent reporting form
- https://doi.org/10.7554/eLife.30938.013
Download links
A two-part list of links to download the article, or parts of the article, in various formats.
Downloads (link to download the article as PDF)
Open citations (links to open the citations from this article in various online reference manager services)
Cite this article (links to download the citations from this article in formats compatible with various reference manager tools)
Long-term antigen exposure irreversibly modifies metabolic requirements for T cell function
eLife 7:e30938.
https://doi.org/10.7554/eLife.30938


