Myeloid cell recruitment versus local proliferation differentiates susceptibility from resistance to filarial infection
- University of Edinburgh, United Kingdom
- Manchester Academic Health Science Centre, University of Manchester, United Kingdom
- University Hospital Regensburg, Germany
Figures
Figure 1 with 1 supplement
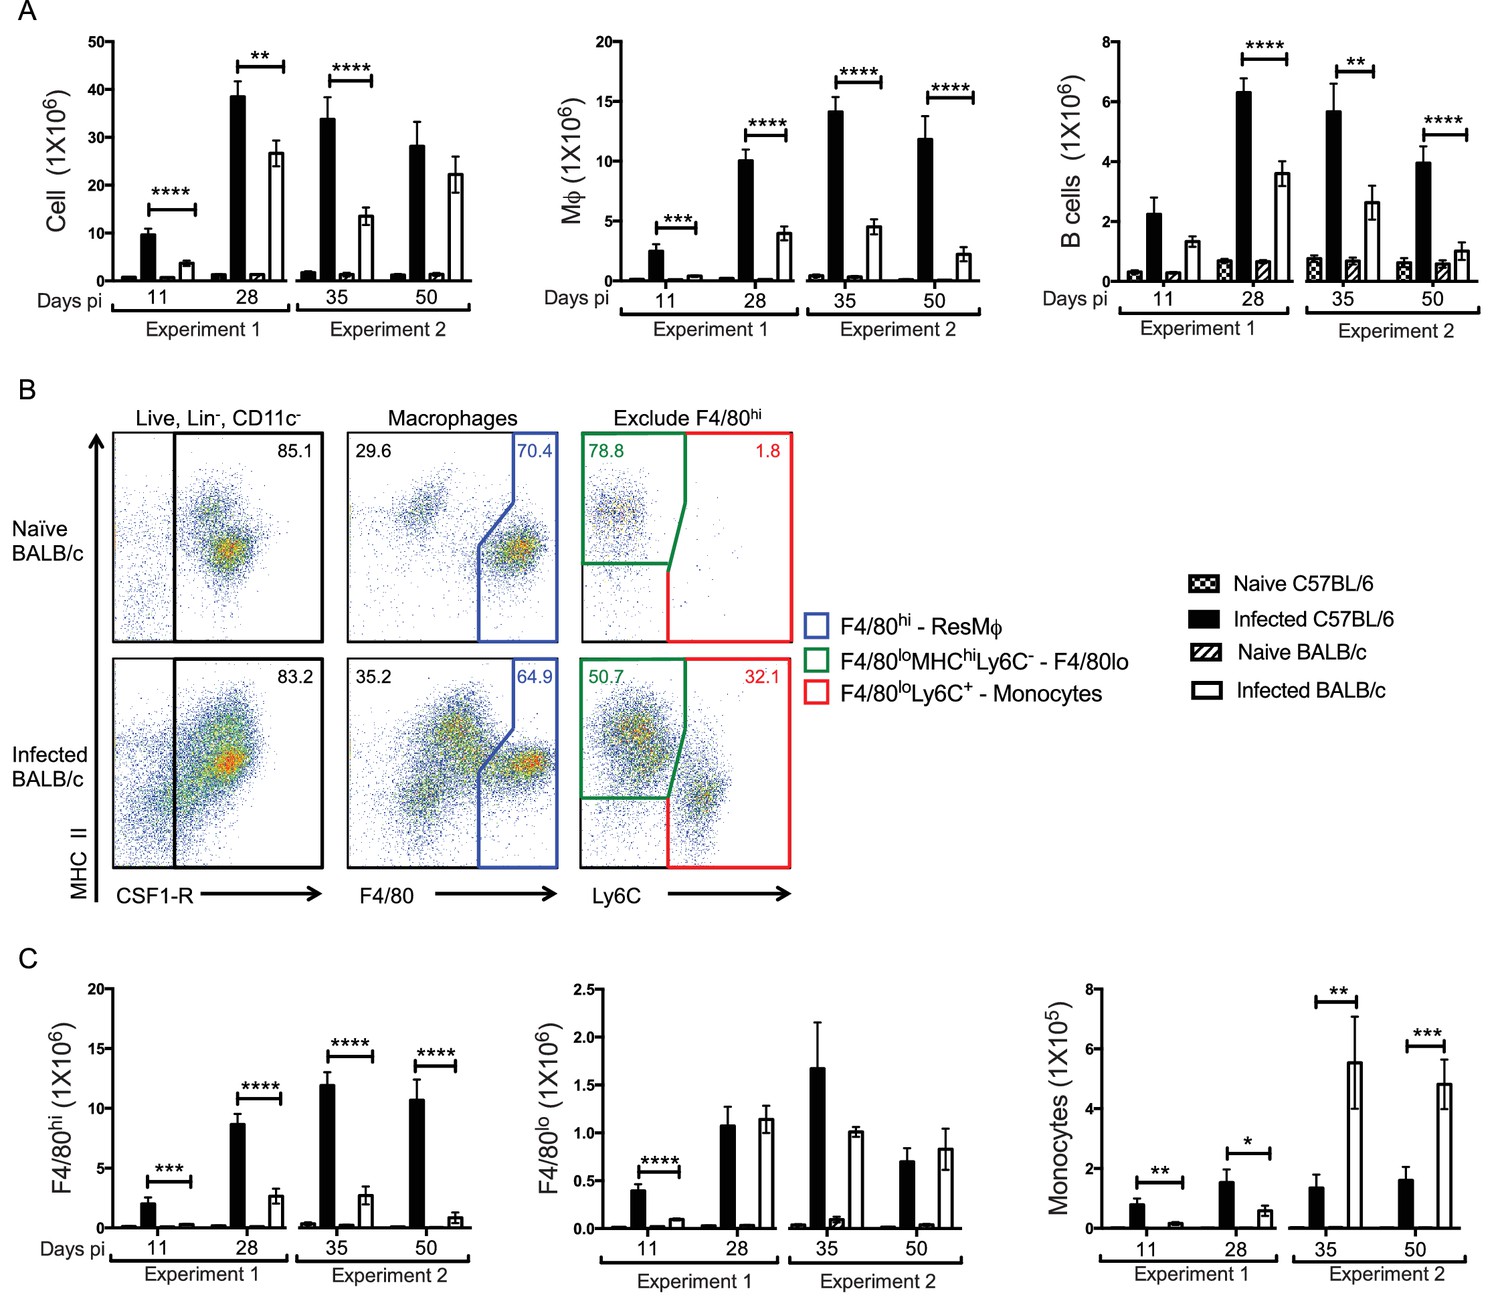
Enhanced F4/80hi MΦ and B cell numbers are associated with resistance.
(A) Difference in total exudate cell, MΦ and B cell number between naïve and L. sigmodontis infected C57BL/6 and BALB/c mice at day 11, 28, 35 and 50 pi. MΦ were identified as live, Lin- (CD19, Ly6G, SiglecF, TCRβ) CSF1R+ CD11c-. (B) Representative plots from naïve and infected BALB/c mice at d35 pi, demonstrating the gating strategy used to identify and divide the MΦ population based on expression of F4/80, MHC and Ly6C. (C) Number of F4/80hi, F4/80lo and monocytes isolated from pleural cavity of mice in (A). Presented are the data from two separate time course experiments (day 11 and 28 and day 35 and 50), each of which is representative of three independent experiments with 6 mice/group/time point. *p<0.05, **p<0.01, ***p<0.0001, ****p<0.00001 as determined by a 2-way ANOVA comparing infected C57BL/6 with infected BALB/c mice at each time point. Error bars represent the mean ± SEM.
Figure 1—figure supplement 1

Breakdown of cell populations in the pleural exudate.
The pleural exudate cells were isolated from naïve and infected BALB/c or C57BL/6 mice at day 11, 28, 35 and 50 pi with L. sigmodontis. Prior to flow cytometry staining the cell number was calculated using a Nexcelom cell counter. (A) Cell number was then back-calculate based on the percentage of total cells positive for the aqua live-dead stain. (B) B cells were identified as Lin+ (CD19.Ly6G,SigLecF,TCRβ) MHC II +, Side Scatter Area (SSC-A) small. (C) T cells (Lin+, MHC II-, SSC-Asmall). Granulocytes were gated Lin+, MHC II-, SSC-Alarge (D) Eosinophils were identified as Lin+,MHC II-, SSC-Alarge, F4/80+ (E) Neutrophils were identified as Lin+, MHC II-, SCC-Alarge, F4/80-, CD11b+.(F) MΦ were identified as live, Lin- (CD19, Ly6G, SiglecF, TCRβ) CSF1R+ CD11c-. Total cells, Macrophages, and B cells are the same as Figure 1 and shown here for comparison. Presented are the data from two separate time course experiments (day 11 and 28 and day 35 and 50), each of which is representative of three independent experiments with 6 mice/group/time point. *p<0.05, **p<0.01, ***p<0.0001, ****p<0.00001 as determined by a 2-way ANOVA comparing infected C57BL/6 with infected BALB/c mice at each time point. Error bars represent the mean ± SEM.
Figure 2 with 2 supplements
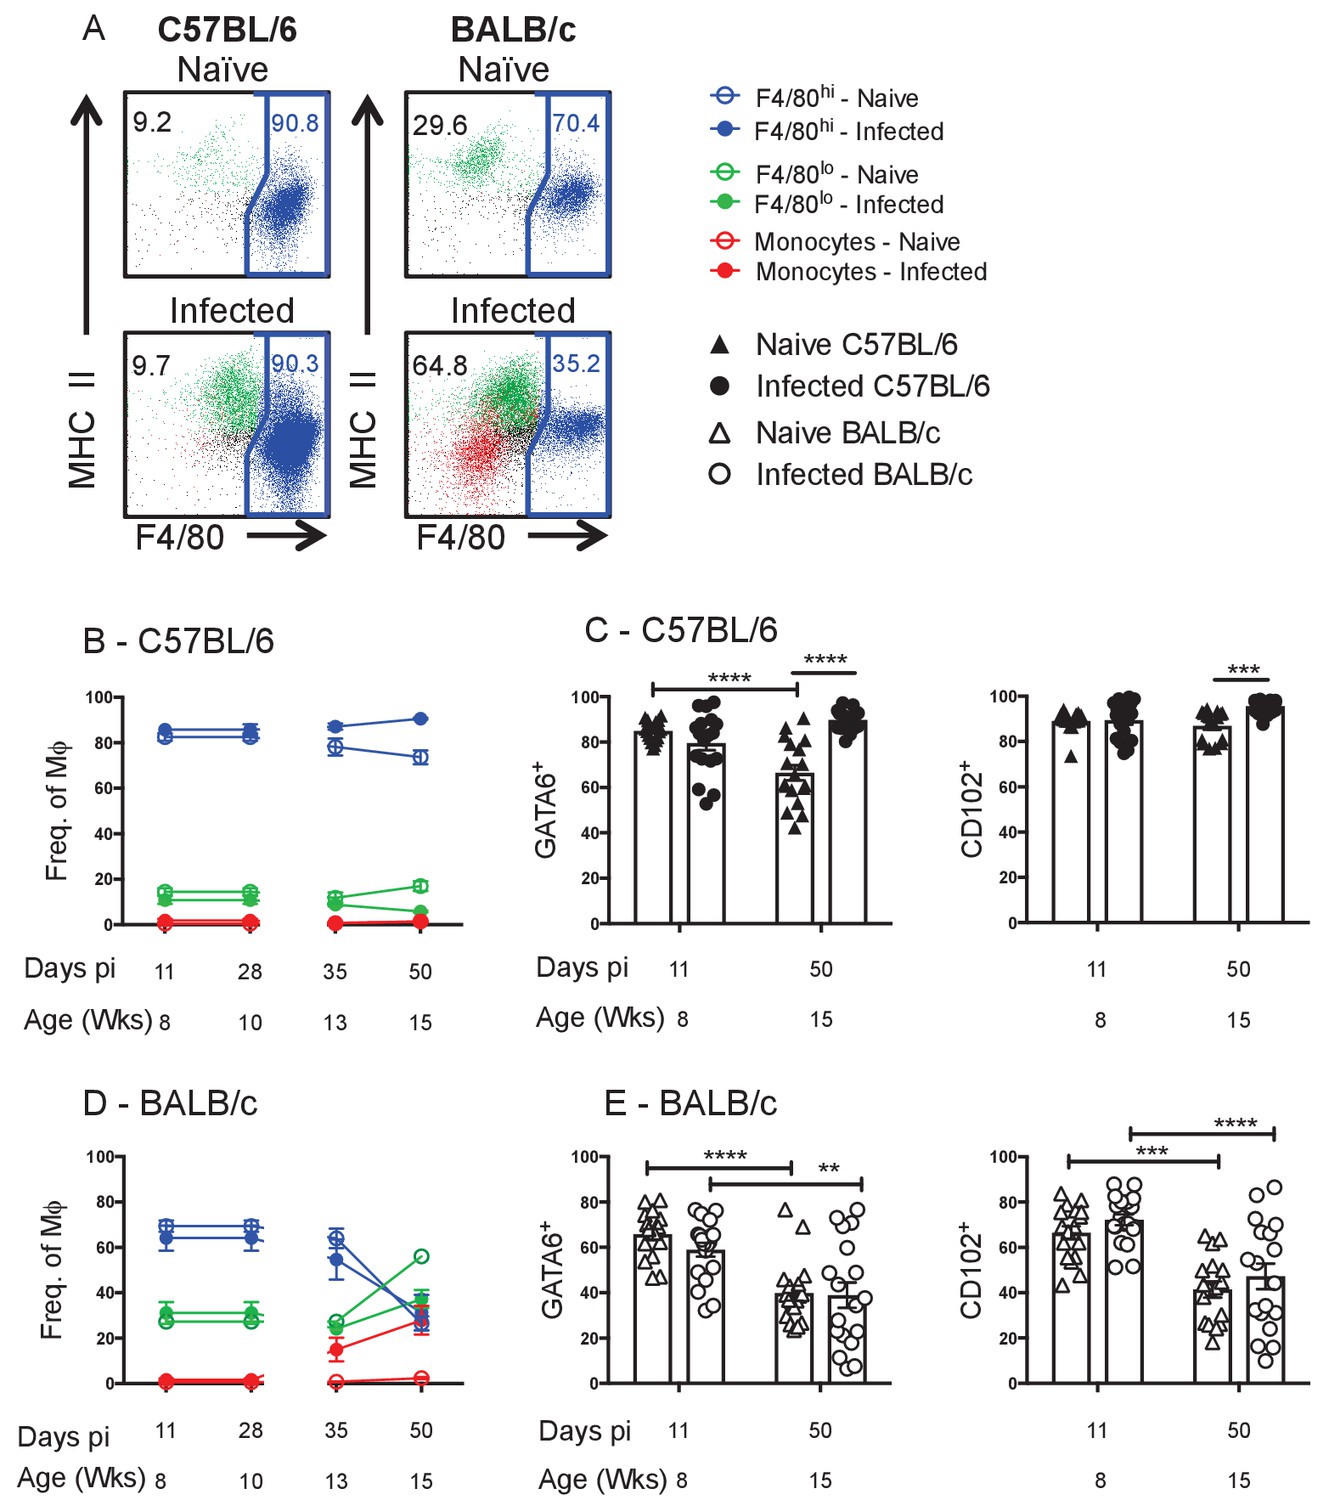
Residency is maintained in resistant C57BL/6 mice and lost in susceptible BALB/c mice.
(A) Representative FACS plots of MΦ subpopulations from the pleural cavity of naïve and d35 pi C57BL/6 or BALB/c mice. Blue: F4/80hi, Green: F4/80lo, Red: monocytes. Percentage of F4/80hi, F4/80lo and monocytes contributing to the MΦ compartment as a whole in (B) C57BL/6 and (D) BALB/c mice. MΦ expression of GATA6 and CD102 in naïve and L. sigmodontis infected (C) C57BL/6 and (E) BALB/c mice. (A, B, D) Presented are the data from two separate time course experiments (day 11 and 28 and day 35 and 50), each of which is representative of three independent experiments with 6 mice/group/time point. (C and E) Presented are the pooled data from three independent experiments. **p<0.01, ***p<0.0001, ****p<0.00001 as determined by a 2-way ANOVA on each time point. Error bars represent the mean ± SEM.
Figure 2—figure supplement 1

GATA6 and CD102 expression on pleural myeloid cells.
Pleural exudate cells were isolated from the pleural cavity of naïve and L. sigmodontis infected C57BL/6 or BALB/c mice at day 11 and day 50 pi. Differential expression of F4/80, MHC II and Ly6C resulted in the division of the macrophage population Lin- (CD19+,Ly6G+,SigF+,TCRβ) CSF-1R+, into resMΦ, F4/80lo and monocyte populations. Representative FACS plots demonstrating expression of GATA6 and CD102 by F4/80hi, F4/80lo and monocyte populations from naïve and infected (A) C57BL/6 and (B) BALB/c mice at day 11 and 50 pi (C) percentage of resMΦ expressing GATA6 and CD102 at day 11 and day 50 pi in (C) C57BL/6 and (D) BALB/c mice. Presented are the data from two separate time course experiments (day 11 or day 50), each of which is representative of three independent experiments with 6 mice/group/time point. **p<0.01, ***p<0.0001, ****p<0.00001 as determined by a 2-way ANOVA on each time point. Error bars represent the mean ± SEM.
Figure 2—figure supplement 2
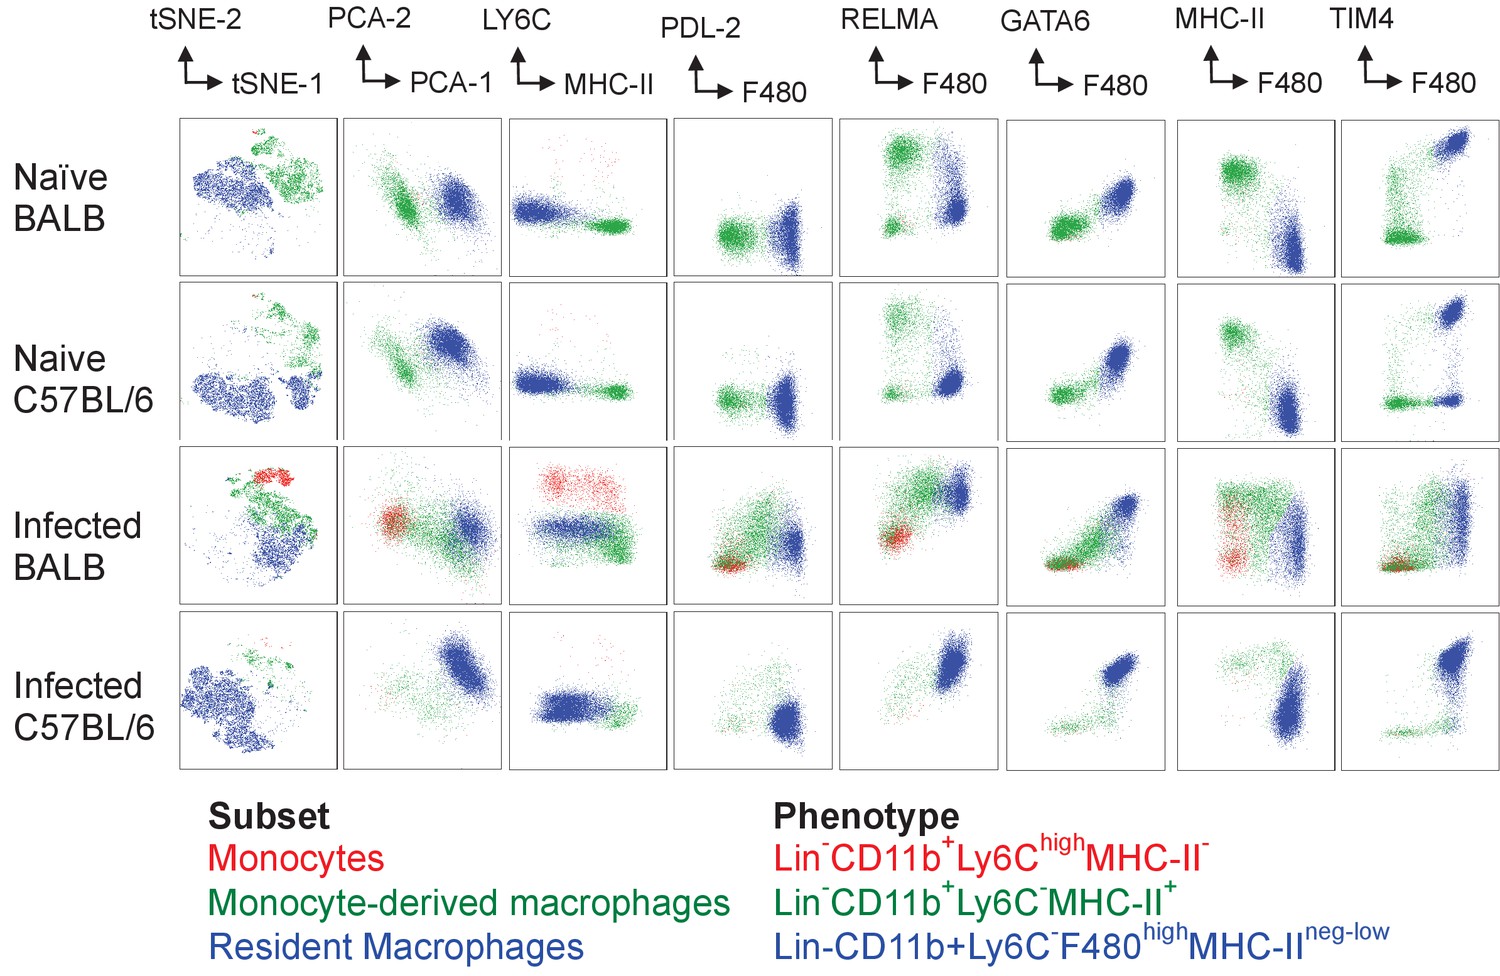
Phenotyping of pleural cavity myeloid cells illustrates differences between BALB/c and C57BL/6 macrophage populations during L. sigmodontis infection.
BALB/c and C57BL/6 mice were infected with 25 L. sigmodontis L3 larvae. Pleural cavity cells were isolated from naïve (upper panels) and day 35 infected (lower panels) mice and analysed by flow cytometry. Live, singlets, lineage negative (Siglec-F, CD19, TCR-β, Ly6G) CD11b + cells were concatenated from 5 individual mice per group.
Figure 3 with 2 supplements
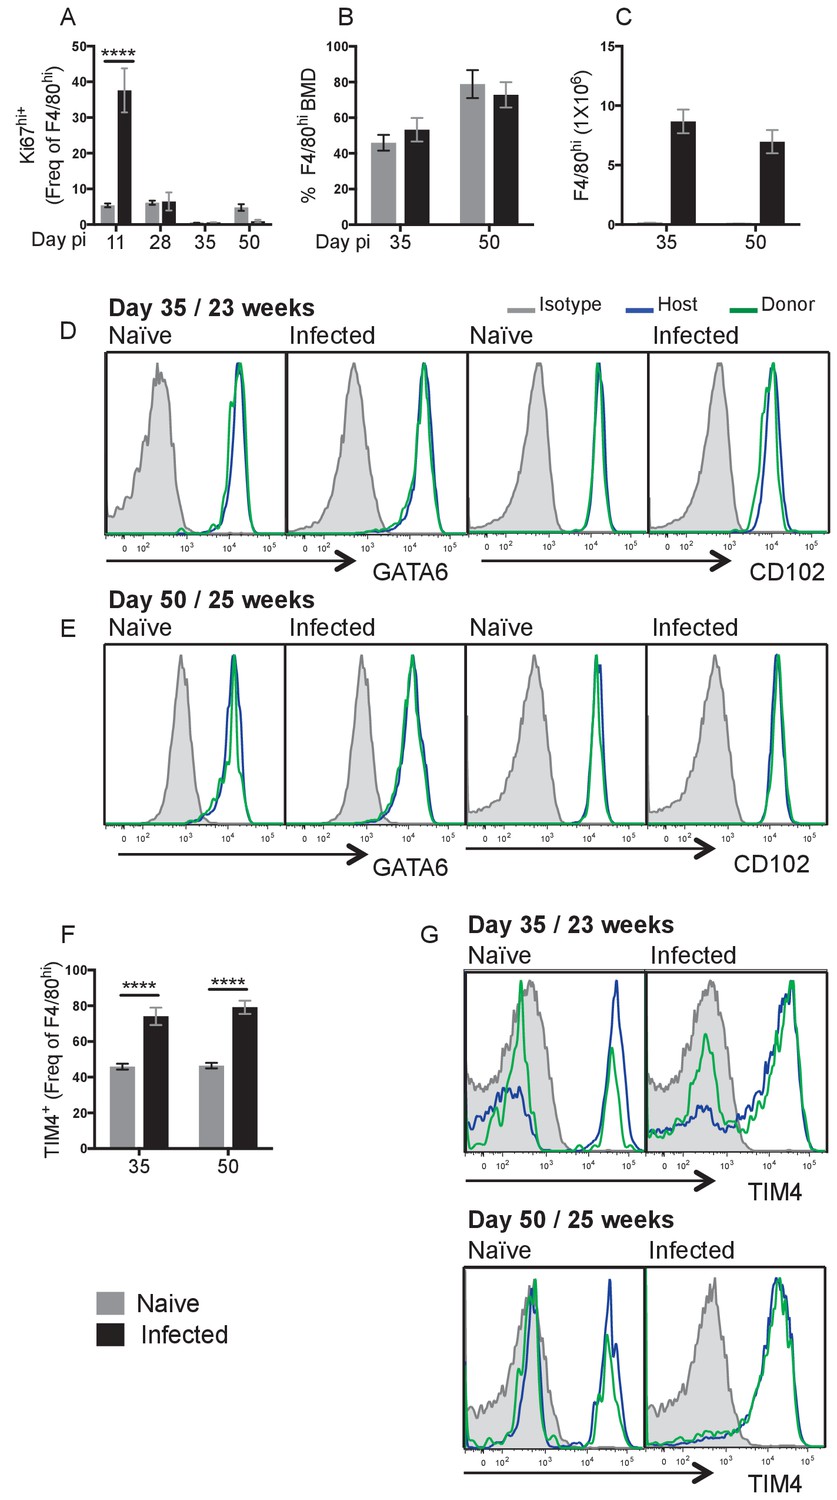
Local proliferation accounts for enhanced F4/80hi cell number in resistant C57BL/6 mice.
(A) Expression of high levels of Ki67 by pleural F4/80hi MΦ from naïve (grey bars) or infected (black bars) C57BL/6 mice at d11, d28, d35 and d50 pi. (B) Percentage of Bone Marrow Derived (BMD) cells contributing to F4/80hi population at d35 and d50 pi in naïve and L. sigmodontis infected partial bone marrow chimeric C57BL/6 mice. (C) F4/80hi cell number at d35 and d50 pi from animals in (B). (D and E) Expression of GATA6 and CD102 by host/donor derived F4/80hi MΦ at d35 and d50 pi (F) expression of TIM4 by F4/80hi MΦ at d35 and d50 pi in naïve and L. sigmodontis infected partial bone marrow chimeric C57BL/6 mice (G) Expression of TIM4 at d35 and d50 pi. Data in (A) is the representative of 3 experiments with 6 mice per group, data in (B–D) are representative of two independent experiments with 10 mice/group/time point. ***p<0.0001 as determined by a 2-way ANOVA on each time point. Error bars represent the mean ± SEM.
Figure 3—figure supplement 1

Absence of Ccr2 does not affect F4/80hi MΦ accumulation at day 28 pi.
(A) Expression of high levels of Ki67 by F4/80hi MΦ from naïve and infected C57BL/6 and BALB/c mice at day 11 pi. Presented are the pooled data from three independent experiments with 6 mice/group/time point. **p<0.01, ***p<0.0001, ****p<0.00001 as determined by a 2-way ANOVA on each time point. Error bars represent the mean ± SEM. Number of (B) Macrophages (C) F4/80hi, F4/80lo and monocytes isolated from the pleural cavity of wild type (WT) C57BL/6 or Ccr2-/- mice at day 28 pi with L. sigmodontis..
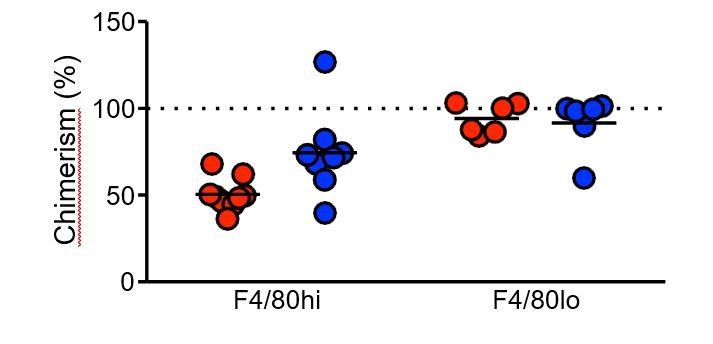
Figure 3—figure supplement 2

Schematic of experimental procedure used to generate partial-bone marrow chimeric mice on the C57BL/6 background.
(B) Calculation of the degree of bone marrow derived macrophage contribution to the pleural F4/80hi population in partial bone marrow chimeric C57BL/6 mice. Expression of (C) CD102 (D) GATA6 and (E) TIM4 by host and donor derived F4/80hi macrophages at day 35 and 50 pi with L. sigmodontis..
Figure 4 with 1 supplement
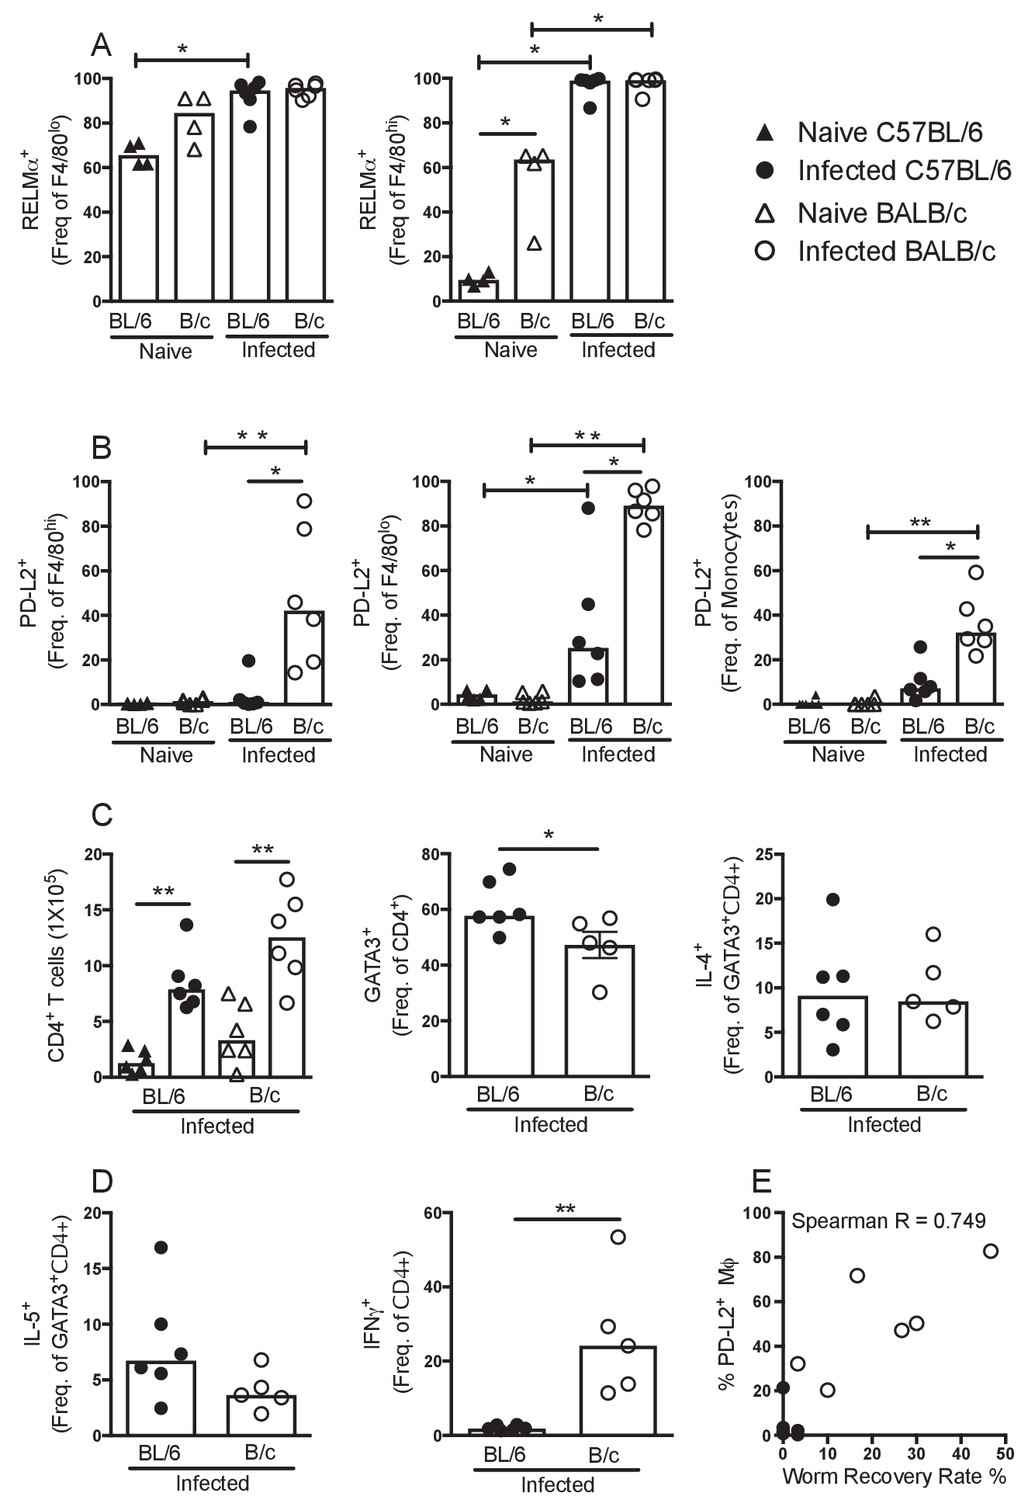
PD-L2+ MΦ are associated with susceptibility.
Expression of (A) RELMα or (B) PD-L2 by F4/80hi, F4/80lo and/or monocyte populations isolated from naïve and L. sigmodontis infected C57BL/6 and BALB/c mice at day 50 pi. (C) The number of CD4+ T cells and percentage of CD4+ T cells expressing GATA3, IL-4, (D) IL-5 and IFNγ within the pleural cavity (PC) of mice in (A). (E) Correlation between percentage of PD-L2 positive MΦ and worm recovery rate. Data in (A,C,D) are representative of three independent experiments with 6 mice/group, data in (B) is representative of two independent experiments. *p<0.05, **p<0.01 (Non-parametric Kruskal-Wallis test preformed followed by Mann–Whitney for pairwise comparison). Bars represent the median.
Figure 4—figure supplement 1

Monocyte depletion does not alter the accumulation of PD-L2+ MΦ.
(A) Numbers of PD-L2+ MΦ isolated from the pleural cavity of infected BALB/c mice at day 35 pi after administration of either rat IgG or α-CCR2 from day 31–34 pi. Data are pooled from three independent experiments with 5, 10 and 6 mice/group.
Figure 5
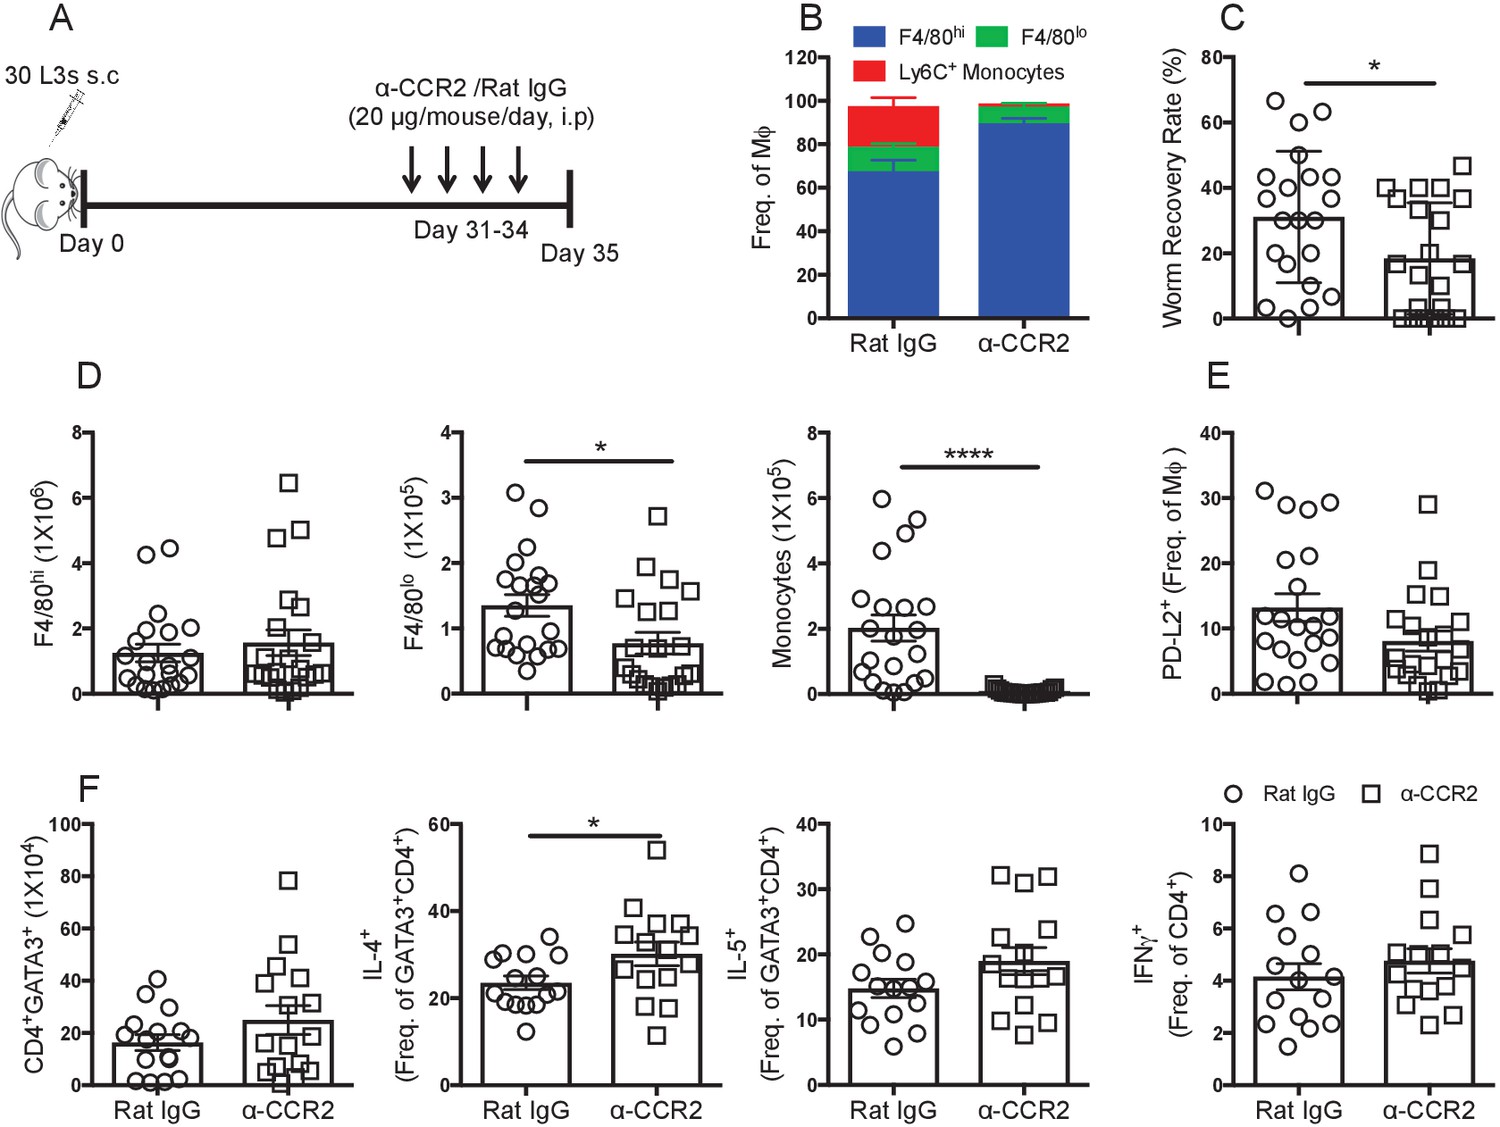
Recently recruited MΦ are detrimental to worm killing.
(A) Experimental scheme. (B) Contribution of F4/80hi, F4/80lo and monocytes to the MΦ compartment of L. sigmodontis infected BALB/c mice after treatment with either Rat IgG (circles) or anti-CCR2 (squares). (C) Worm recovery rate at day 35 pi following 4 days of either control rat IgG or α-CCR2 administration i.p. in susceptible BALB/c mice. (D) Pleural F4/80hi, F4/80lo, monocyte numbers. (E) Percentage of MΦ expressing PD-L2. (F) Total number of pleural cavity GATA3+CD4+ T cells, percentage GATA3+CD4+ expressing IL-4 or IL-5 and IFNγ expression by CD4+ cells. (C and D) *p≤0.05, ****p≤0.0001, as determined by an ANOVA using combined data from three experiments with 5, 10 and 6 mice/group (F) *p≤0.05 determined by an ANOVA using data combined from two experiments with 10 and 6 mice/group (p<0.05, Tukey’s HSD).
Author response image 1
Additional files
-
Supplementary file 1
Schematic of propsed MΦ dynamics.
(A) Post birth, prenatally derived F4/80hi resMΦ constitute 80% of the MΦ compartment, by 18–23 weeks of age 50% of the resMΦ compartment has been replenished by bmMΦ which assume residency markers GATA6 and CD102. The degree of bmMΦ contributing to the resMΦ population continues to increase with age, reflective of enhanced proliferative survival of the more recent donor derived resMΦ and eventual death of host derived F4/80hi resMΦ. (B) Upon infection, IL-4 drives proliferation of F4/80hi resMΦ, 50% of which has been derived from bmMΦ by 23 weeks of age, causing expansion of the resMΦ population to 27-fold greater than that of naïve controls. By day 50 pi, the degree of bmMΦ contributing to the resMΦ population has increased further, likely reflecting enhanced proliferative survival of the more recent donor derived resMΦ and eventual death of host derived F4/80hi resMΦ
- https://doi.org/10.7554/eLife.30947.013
-
Transparent reporting form
- https://doi.org/10.7554/eLife.30947.014
Download links
A two-part list of links to download the article, or parts of the article, in various formats.
Downloads (link to download the article as PDF)
Open citations (links to open the citations from this article in various online reference manager services)
Cite this article (links to download the citations from this article in formats compatible with various reference manager tools)
Myeloid cell recruitment versus local proliferation differentiates susceptibility from resistance to filarial infection
eLife 7:e30947.
https://doi.org/10.7554/eLife.30947


