Human subthalamic nucleus activity during non-motor decision making
- National Institute of Neurological Disorders and Stroke, United States
Figures
Figure 1 with 1 supplement
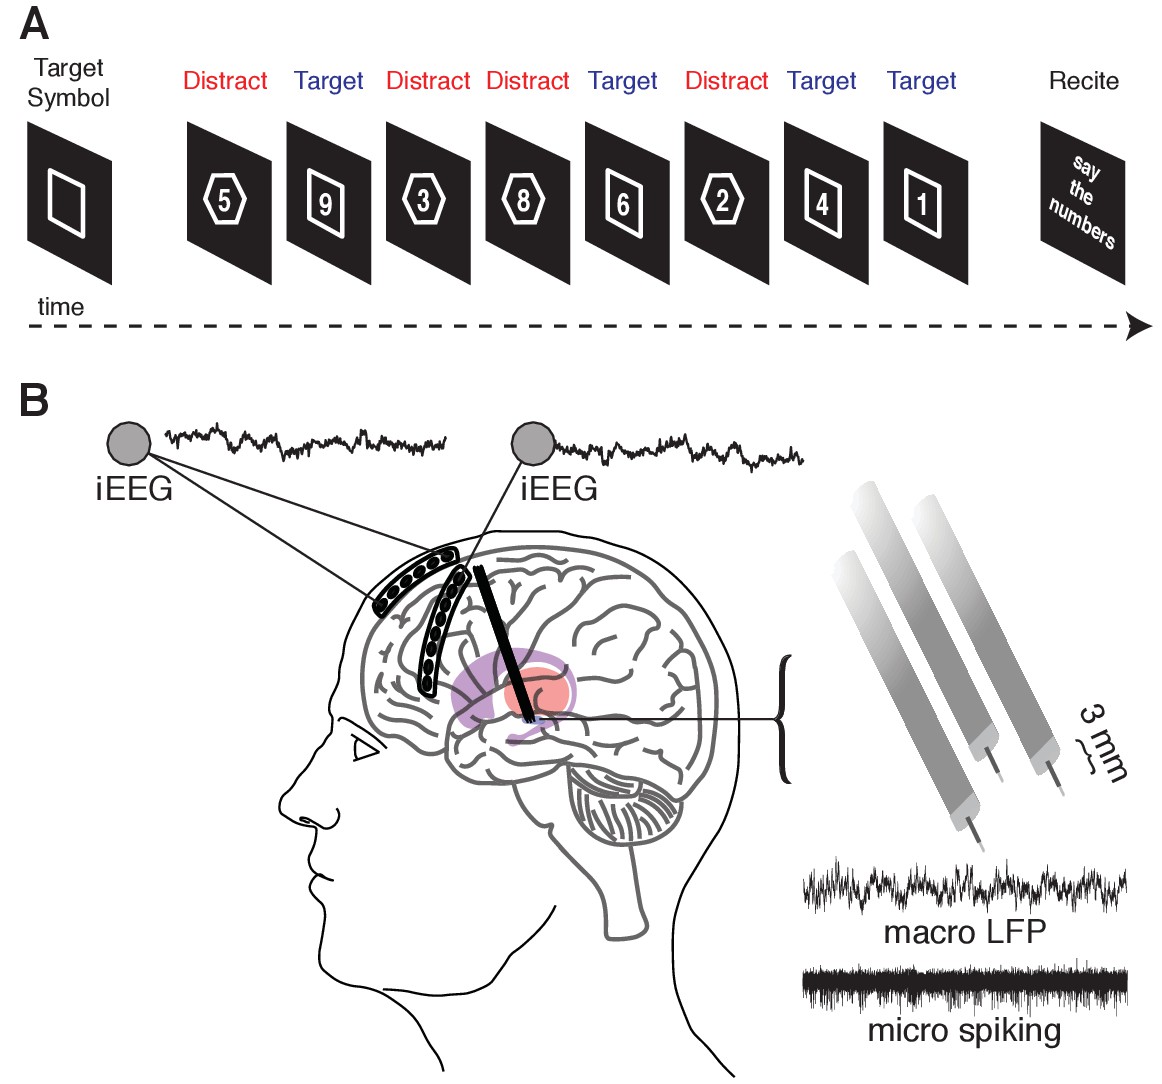
Memory task during recordings captured from the human STN and cortex.
(A) A target shape (square or octagon) appears on the screen to indicate the target shape for the upcoming block. The participant then pushes a button to begin the block. Eight numbers then appear sequentially, each within either a square or an octagon. The participant is instructed to remember only the numbers appearing within the target shape (target trials) and ignore the remaining numbers (distractor trials). At the end of the block, the participant verbalizes the four target numbers. (B) Six- and eight-contact electrode strips are placed over the anterior and lateral PFC, respectively, to capture intracranial EEG activity during the task. Simultaneously, three macro/microelectrode pairs capture LFP (macro) and action potential spiking activity (micro) from the STN. A 5 s sample recording is shown for each.
Figure 1—figure supplement 1
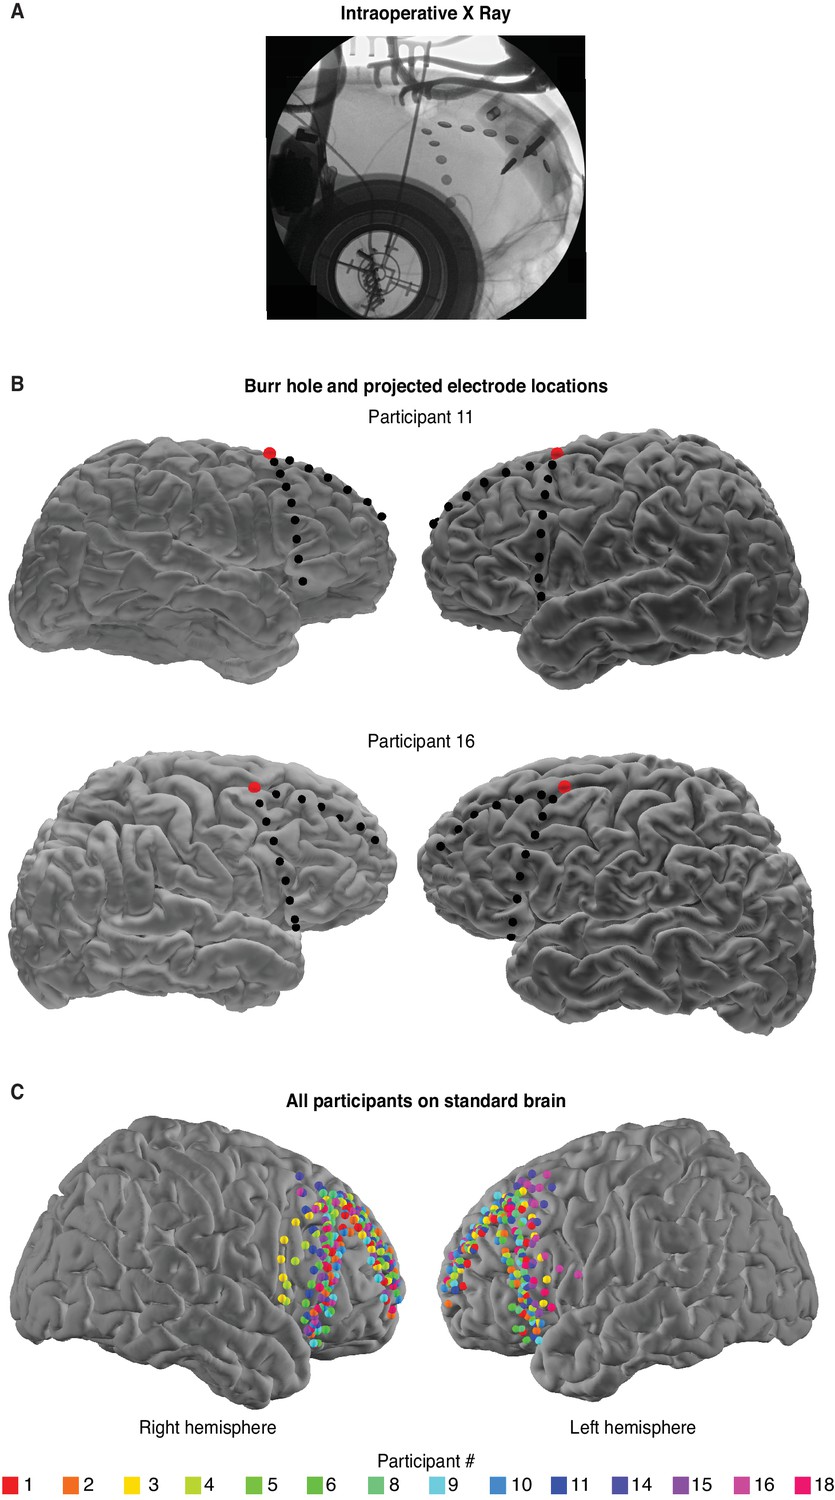
iEEG electrode locations.
(A) Intraoperative X-ray for one participant shows the location of the anterior and lateral PFC electrodes relative to the burr hole. (B) Reconstructed brain surface for two participants. The burr hole location, identified by coregistering the pre-operative MRI with the postoperative CT, is indicated by the red dot. Estimated iEEG electrode locations for the anterior and lateral PFC are indicated by black dots. (C) Projected location of the iEEG electrodes for 14 of the 18 of the participants plotted on a standard brain. Electrode projection estimates were unavailable for four of the participants.
Figure 2 with 1 supplement
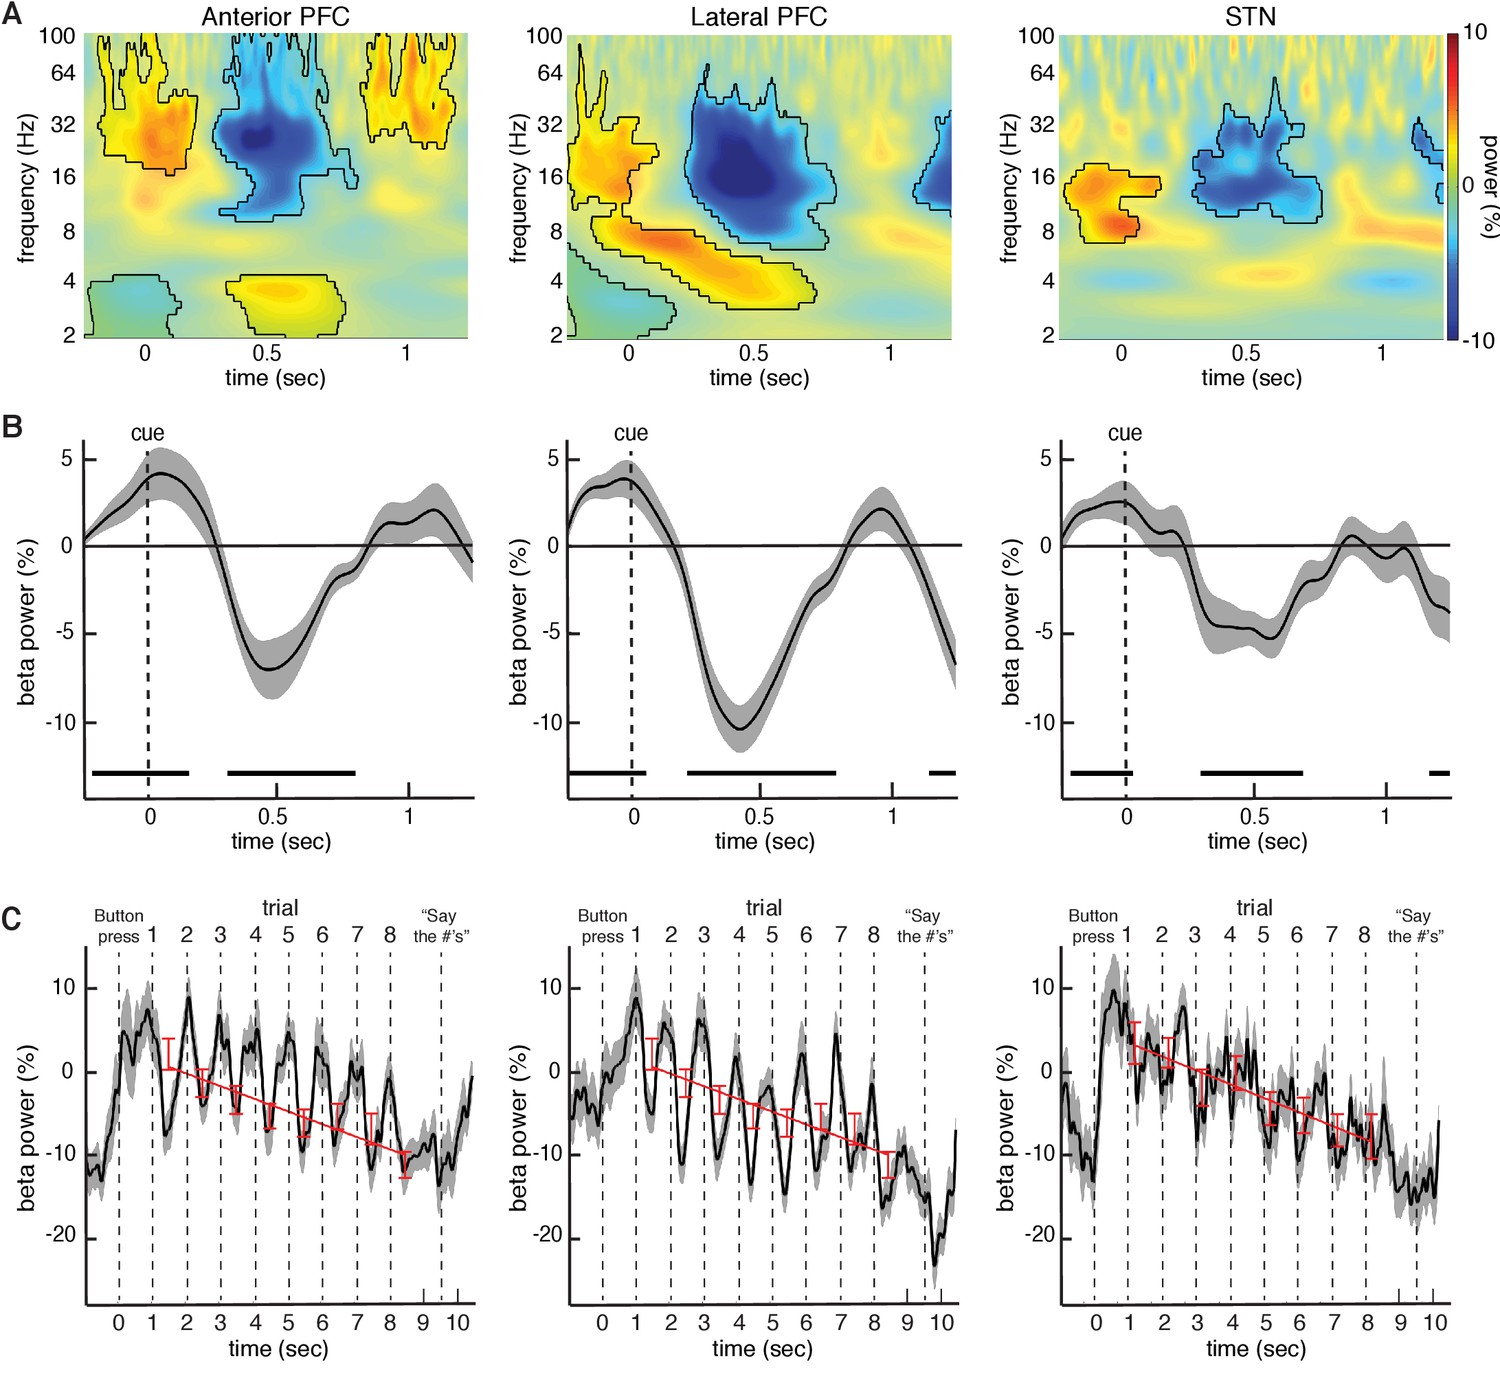
Changes in beta power during the task relative to baseline.
(A) Normalized oscillatory power averaged across all anterior PFC electrodes (left), all lateral PFC electrodes (middle), and all STN LFP macroelectrodes (right), averaged across all trials (target and distractor trials combined; numbers are presented at t = 0; mask indicates time frequency regions exhibiting significant differences from baseline at p < 0.05, corrected for multiple comparisons, permutation test). All three recording sites showed a decrease in beta (15–30 Hz) power during the task. (B) Same as (A), but averaged across the entire beta band. Time points exhibiting a significant change from baseline (p < 0.05, corrected for multiple comparisons, permutation test) are denoted by black horizontal bar. (C) Progressive changes in beta power across all eight trials within a block averaged across all blocks. As in (A), the data were averaged over all anterior PFC electrodes (left), lateral PFC electrodes (middle), and STN macroelectrodes (right). Stimuli were presented at t = 1, t = 2, t = 3, etc. Red bars: Average beta power at every trial within a block. Best fit line from a linear regression of beta power against trial number is shown. In all three brain regions, there was a significant overall decrease in beta power over time during each block of 8 trials (, repeated-measures ANOVA).
Figure 2—figure supplement 1
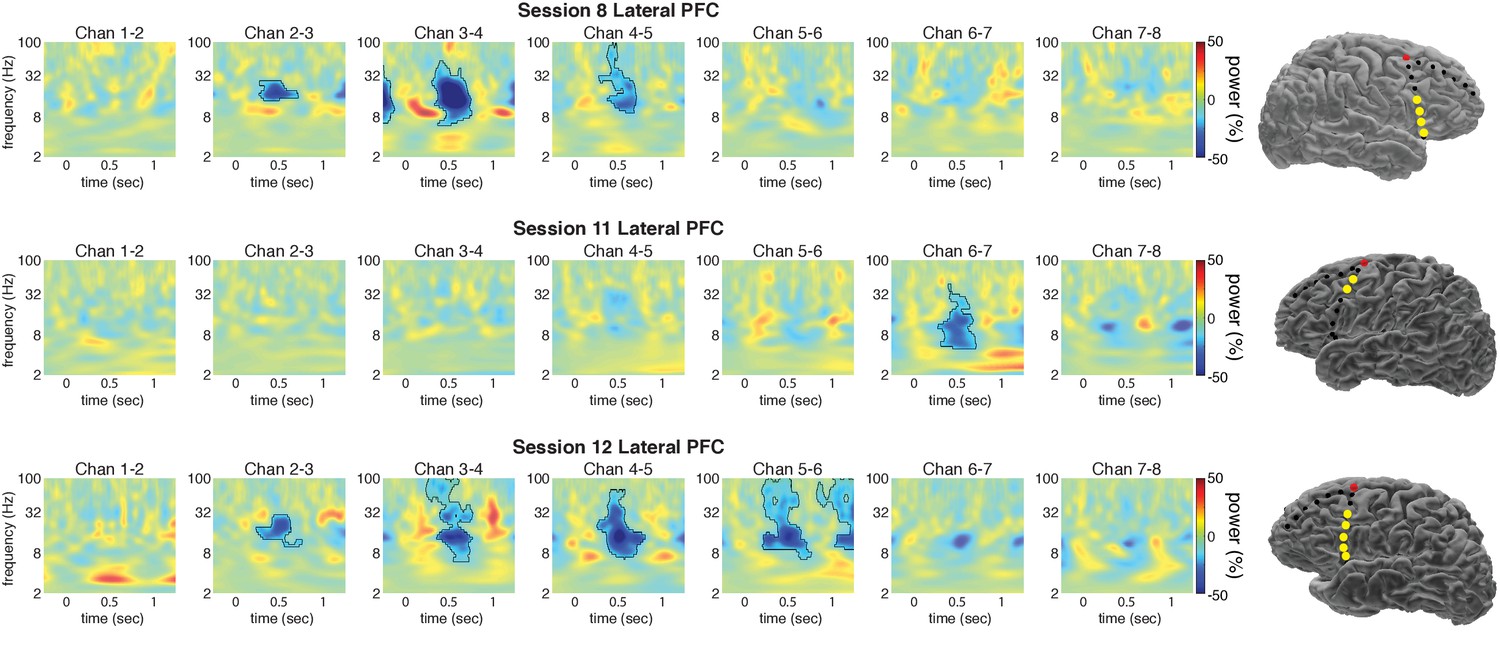
Changes in power during the task relative to baseline for all lateral PFC electrodes in three participants.
Changes in power during the task relative to baseline for all lateral PFC electrodes in three participants. For each bipolar electrode recording in these participant, cue-locked power averaged across all trials (target and distractor trials combined) is shown (numbers are presented at t = 0; mask indicates time frequency regions exhibiting significant differences from baseline at p < 0.05, corrected for multiple comparisons, permutation test). Only some of the bipolar contacts in each of these strips showed significant decreases in beta power during the task. The reconstructed brain surface for these participants are also shown, with the significant contacts indicated by gold circle.
Figure 3 with 4 supplements
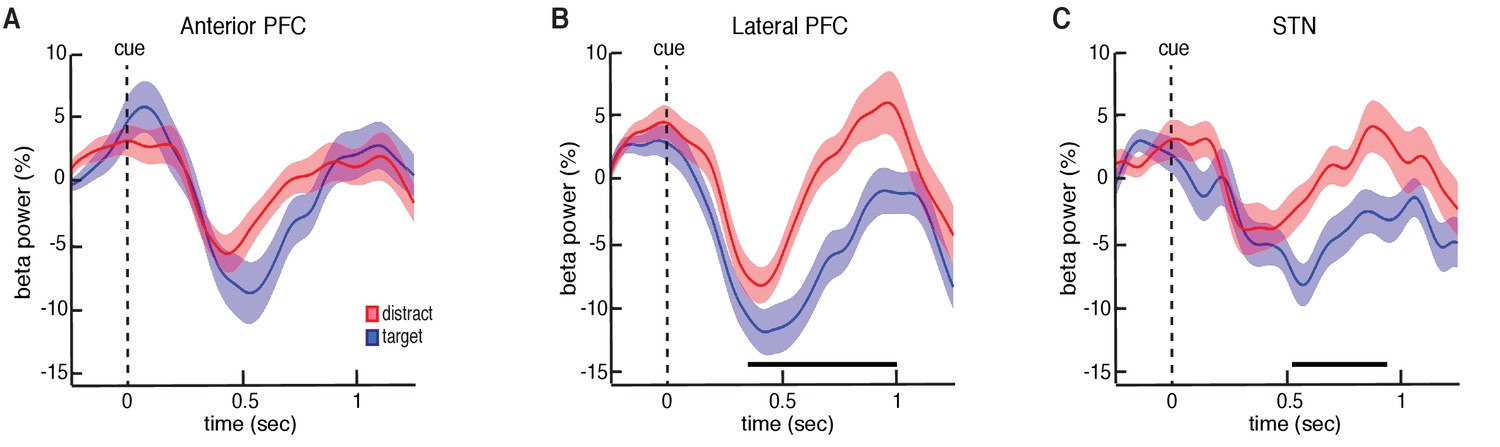
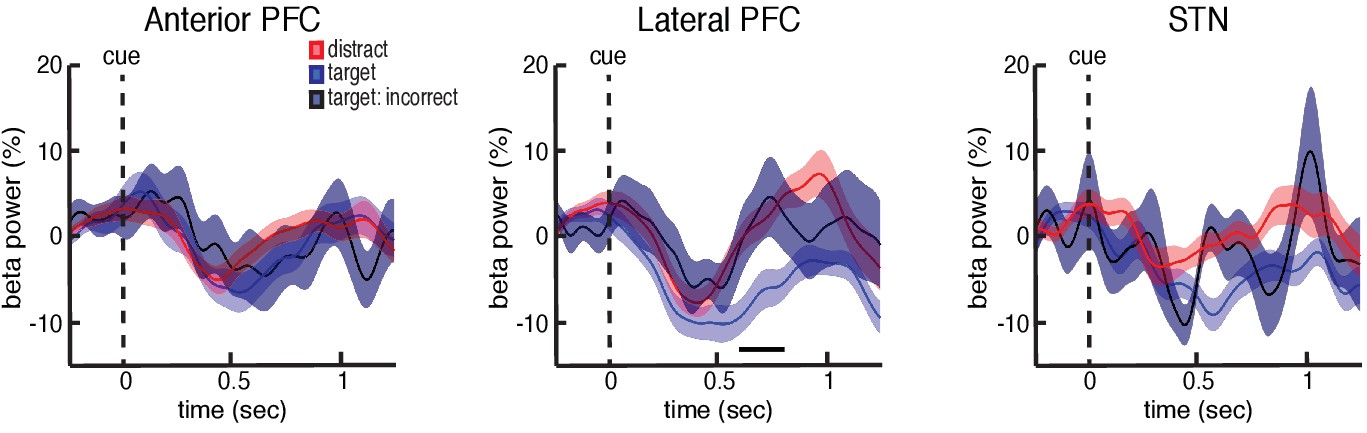
Trial type related differences in beta power.
(A) Cue-aligned time evolving beta power changes averaged over all anterior PFC electrodes during the target and distractor conditions. (B) Same as (A) but for the lateral PFC. (C) Same as (A) but for the STN. Time points exhibiting a significant difference (p < 0.05, corrected for multiple comparisons, permutation test) are denoted by black horizontal bar. Both the lateral PFC and the STN showed significantly higher beta band power during the distractor condition.
Figure 3—figure supplement 1
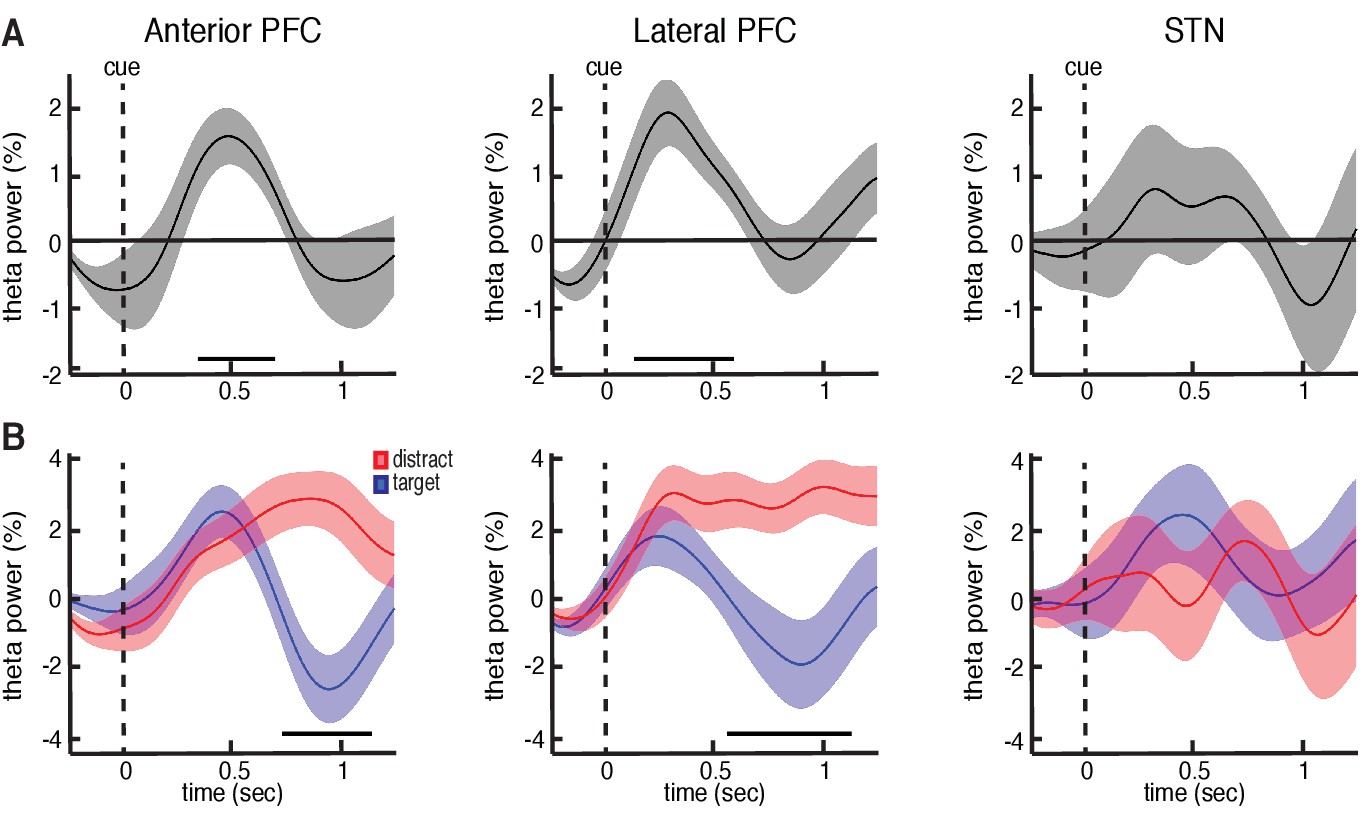
Changes in theta power during the task relative to baseline.
(A) Cue-aligned time evolving theta power changes averaged across all anterior PFC electrodes (left), all lateral PFC electrodes (middle), and all STN LFP macroelectrodes (right), averaged across all trials (target and distractor trials combined; numbers are presented at t = 0). Time points exhibiting a significant change from baseline (p < 0.05, corrected for multiple comparisons, permutation test) are denoted by black horizontal bar. (B) Same as (A) but averaged separately for the target and distractor trial conditions. Time points exhibiting a significant difference (p < 0.05, corrected for multiple comparisons, permutation test) are denoted by black horizontal bar. The cortical recordings showed a significant increase in theta (2–8 Hz) power during the task, and this increase was higher during the distractor trials.
Figure 3—figure supplement 2
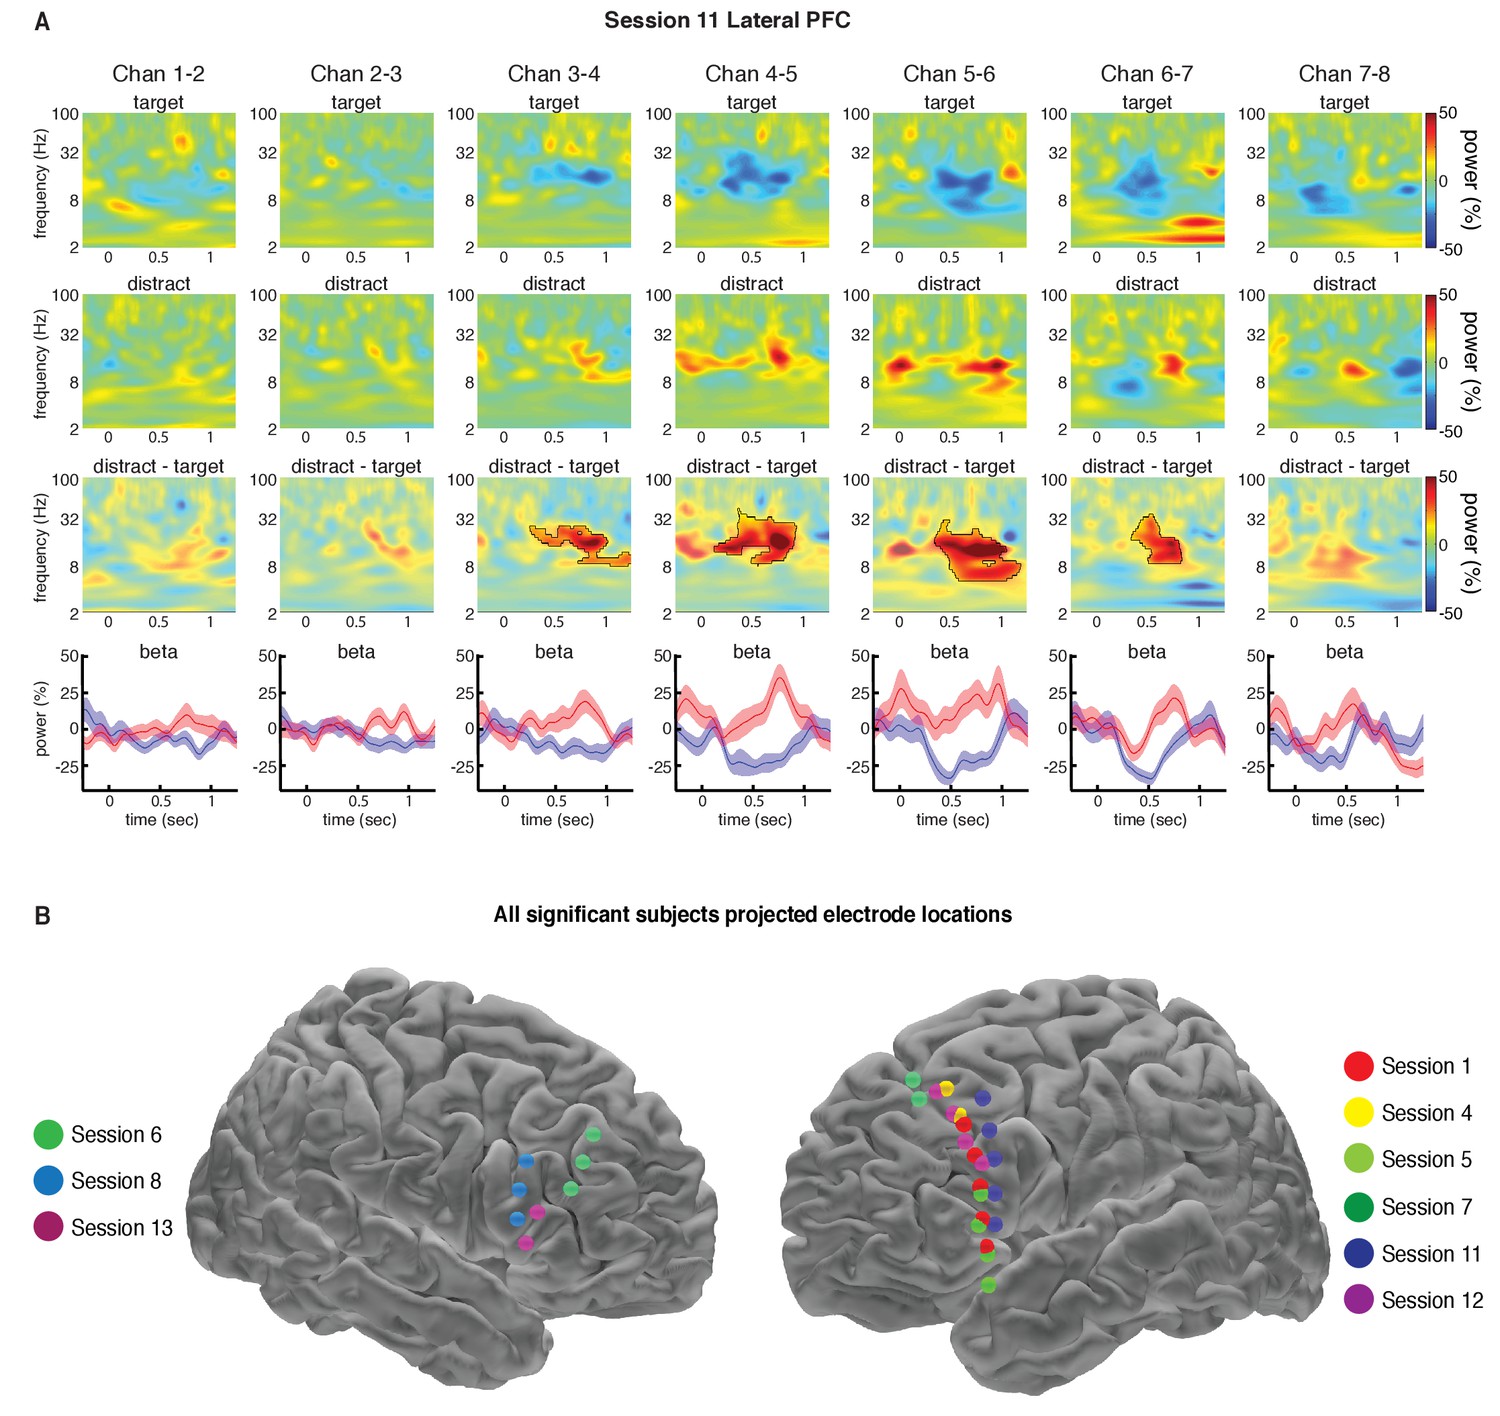
Within-session analysis of trial type related differences in beta power.
]Within-session analysis of trial type related differences in beta power. (A) Changes in power during target and distractor trials for all lateral PFC electrodes in one participant. For each bipolar electrode recording in this participant, cue-locked power averaged across all target trials (first row) and all distractor trials (second row) is shown. The third row contains the average difference between the two trial types (mask indicates p < 0.05, corrected for multiple comparisons, permutation test). The fourth row contains the time evolving beta power changes during the task. Four of the seven bipolar recordings from the lateral PFC showed significantly higher beta power during the distractor trials in this participant. (B) Projected location of the iEEG electrodes (plotted on a standard brain) for 9 of the 13 of the sessions that showed a trial type related difference in beta power. Electrode projection estimates were unavailable for four of the sessions. Trial type related differences in beta power across time within a block.
Figure 3—figure supplement 3
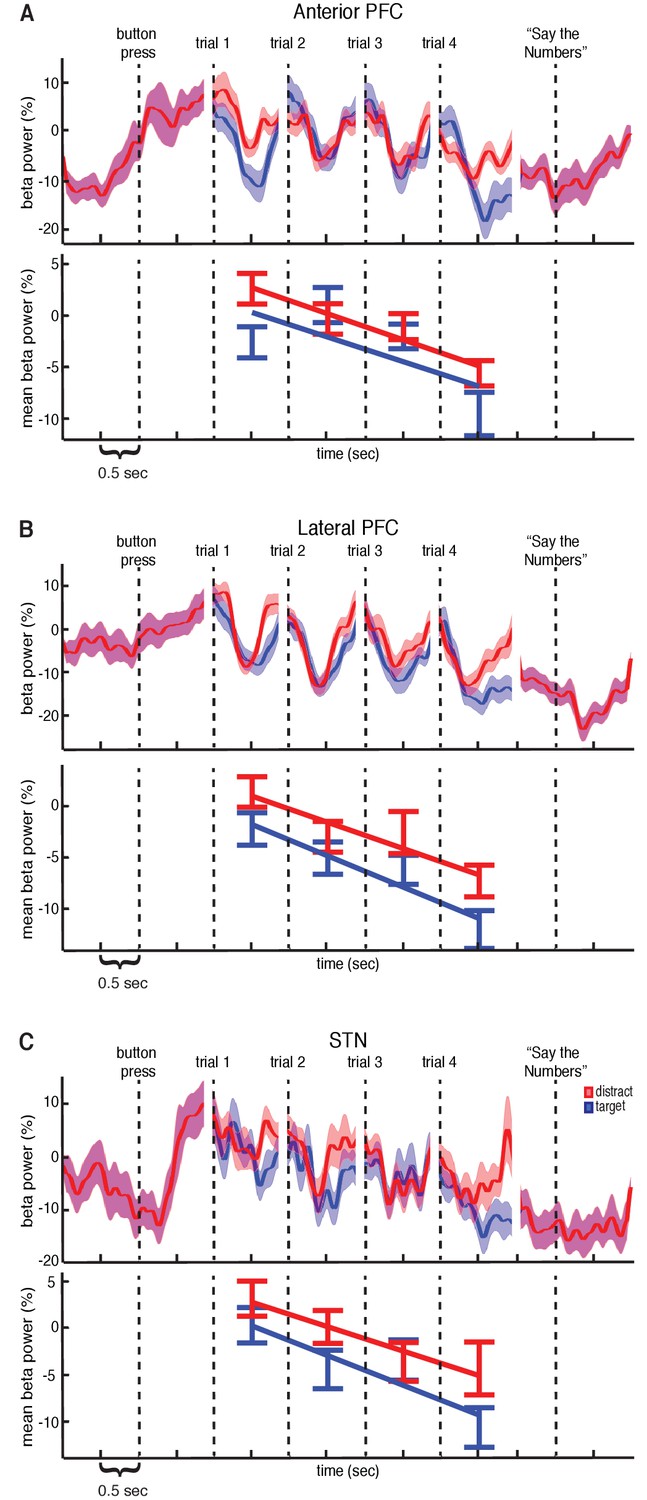
Trial type related differences in beta power across time within a block.
(A) Top: Beta power changes averaged over all anterior PFC electrodes. Stimuli were presented at t = 1, t = 2, t = 3, and t = 4. The first, second, third, and fourth target trials are plotted at the same time as the first, second, third, and fourth distractor trials for ease of comparison. Bottom: Average anterior PFC beta power at every trial within a block. Best fit line from a linear regression of beta power against trial number is shown. (B) Same as (A) but for the lateral PFC. (C) Same as (A) but for the STN. In the lateral PFC and the STN, beta power was significantly higher during the distractor trials and there was an overall decrease in beta power over time (p < 0.05, repeated-measures ANOVA). However, neither brain region showed an interaction between trial type and trial number.
Figure 3—figure supplement 4
Error-related differences in beta power.
Cue-aligned time evolving beta power changes averaged over all anterior PFC electrodes (left), all lateral PFC electrodes (middle), and all STN LFP macroelectrodes (right) during the trials in which the target number being displayed was not encoded. Only sessions that had five or more of these error trials were included in this analysis. The average for the correct target and the correct distractor trials for these sessions are also plotted for comparison. Time points exhibiting a significant difference between the correct target trial and the incorrect target trials (p < 0.05, corrected for multiple comparisons, permutation test) are denoted by black horizontal bar. In the lateral prefrontal cortex, the beta power decrease was significantly greater in the correct target trials.
Figure 4 with 1 supplement

Differences in lateral PFC-STN coherence between target and distractor trials.
Cue-aligned time evolving normalized coherence between the STN and the lateral PFC for the target (A) and distractor (B) conditions. (C) Normalized coherence difference between the distractor and target conditions (mask indicates time frequency regions exhibiting significant differences at p < 0.05, corrected for multiple comparisons, permutation test). (D) Cue-aligned time evolving beta coherence changes plotted separately for the target and distractor conditions. Time points exhibiting a significant difference (p < 0.05, corrected for multiple comparisons, permutation test) are denoted by black horizontal bar.
Figure 4—figure supplement 1
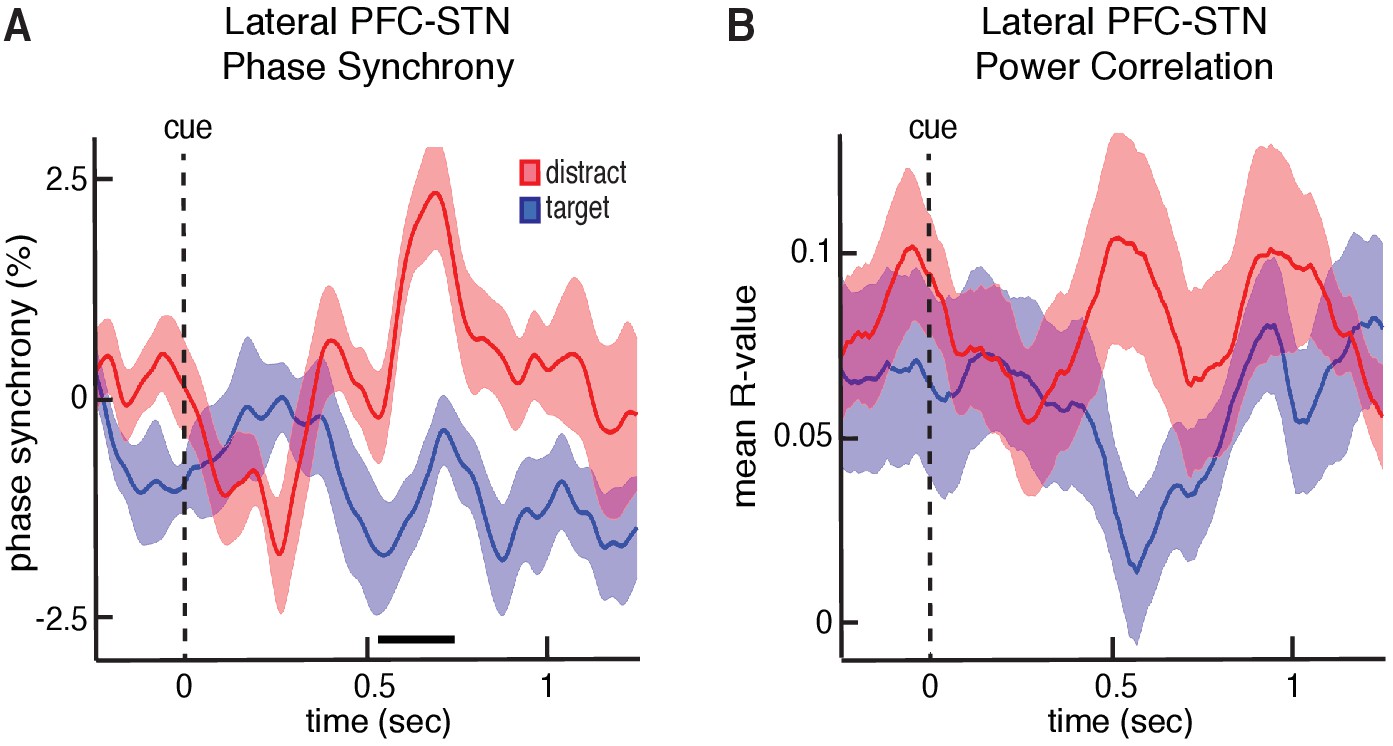
Trial-type-related differences in phase synchrony and power correlations Trial-type-related differences in phase synchrony and power correlations.
(A) Same data as Figure 4D but only the phase values at each time point were used to calculate the synchrony between the STN and the lateral PFC. Time points exhibiting a significant difference (p < 0.05, corrected for multiple comparisons, permutation test) are denoted by black horizontal bar. (B) Same data as Figure 4D but only the power values at each time point were used to calculate the synchrony between the STN and the lateral PFC. Power synchrony was quantified by calculating at each time point the Spearman’s correlation coefficient between the STN and the lateral PFC power across trials.
Figure 5
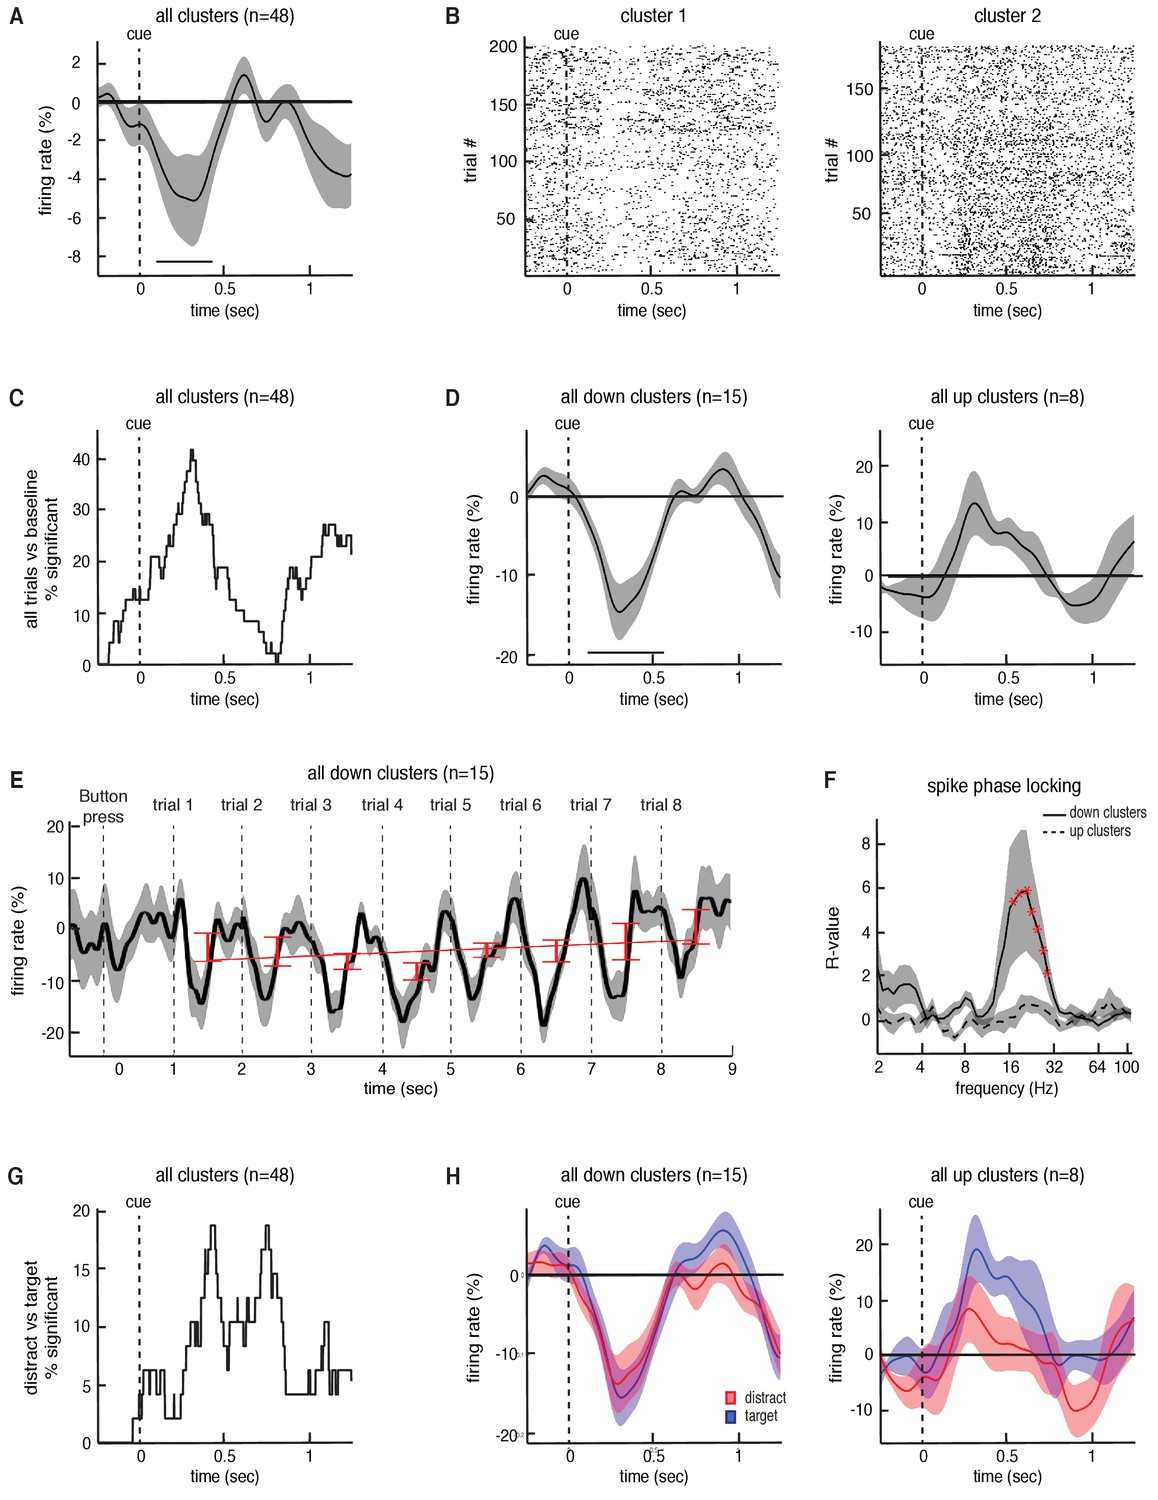
Task-related changes in spiking activity in STN neuronal clusters.
(A) Average continuous-time firing rate for all 48 STN microelectrode recordings that showed spiking activity during the task (numbers presented at t = 0). Time points exhibiting a significant change from baseline (p < 0.05, corrected for multiple comparisons, permutation test) are denoted by black horizontal bar. (B) Raster plot for two neuronal clusters exhibiting changes in spiking activity during the task. (C) The percentage of recordings at each time point that showed a significant difference in firing during the task when comparing all trials to baseline. (D) Same as A but including only the 15 clusters that showed a significant decrease in firing during the task (left) and the eight clusters that showed a significant increase in firing during the task (right). (E) Progressive changes in firing rate across all eight trials within a block averaged across all blocks. The average across all 15 downward firing clusters is plotted. (F) The interaction between STN microelectrode spiking and macroelectrode LFP phases for each frequency, averaged across all down and up clusters with simultaneous LFP macro electrode recordings. Red asterisks indicate frequencies exhibiting significant spike-phase locking values, (p < 0.05, corrected for multiple comparisons, permutation test). (G) The percentage of recordings at each time point that showed a significant difference in firing between the target and distractor trials. (H) Same as D but averaged separately for the target and distractor trial conditions.
Additional files
-
Transparent reporting form
- https://doi.org/10.7554/eLife.31007.015
Download links
A two-part list of links to download the article, or parts of the article, in various formats.
Downloads (link to download the article as PDF)
Open citations (links to open the citations from this article in various online reference manager services)
Cite this article (links to download the citations from this article in formats compatible with various reference manager tools)
Human subthalamic nucleus activity during non-motor decision making
eLife 6:e31007.
https://doi.org/10.7554/eLife.31007


