GRAM domain proteins specialize functionally distinct ER-PM contact sites in human cells
- University of California, Davis, United States
- School of Medicine, University of California, Davis, United States
- EPFL, Switzerland
Figures
Figure 1 with 5 supplements
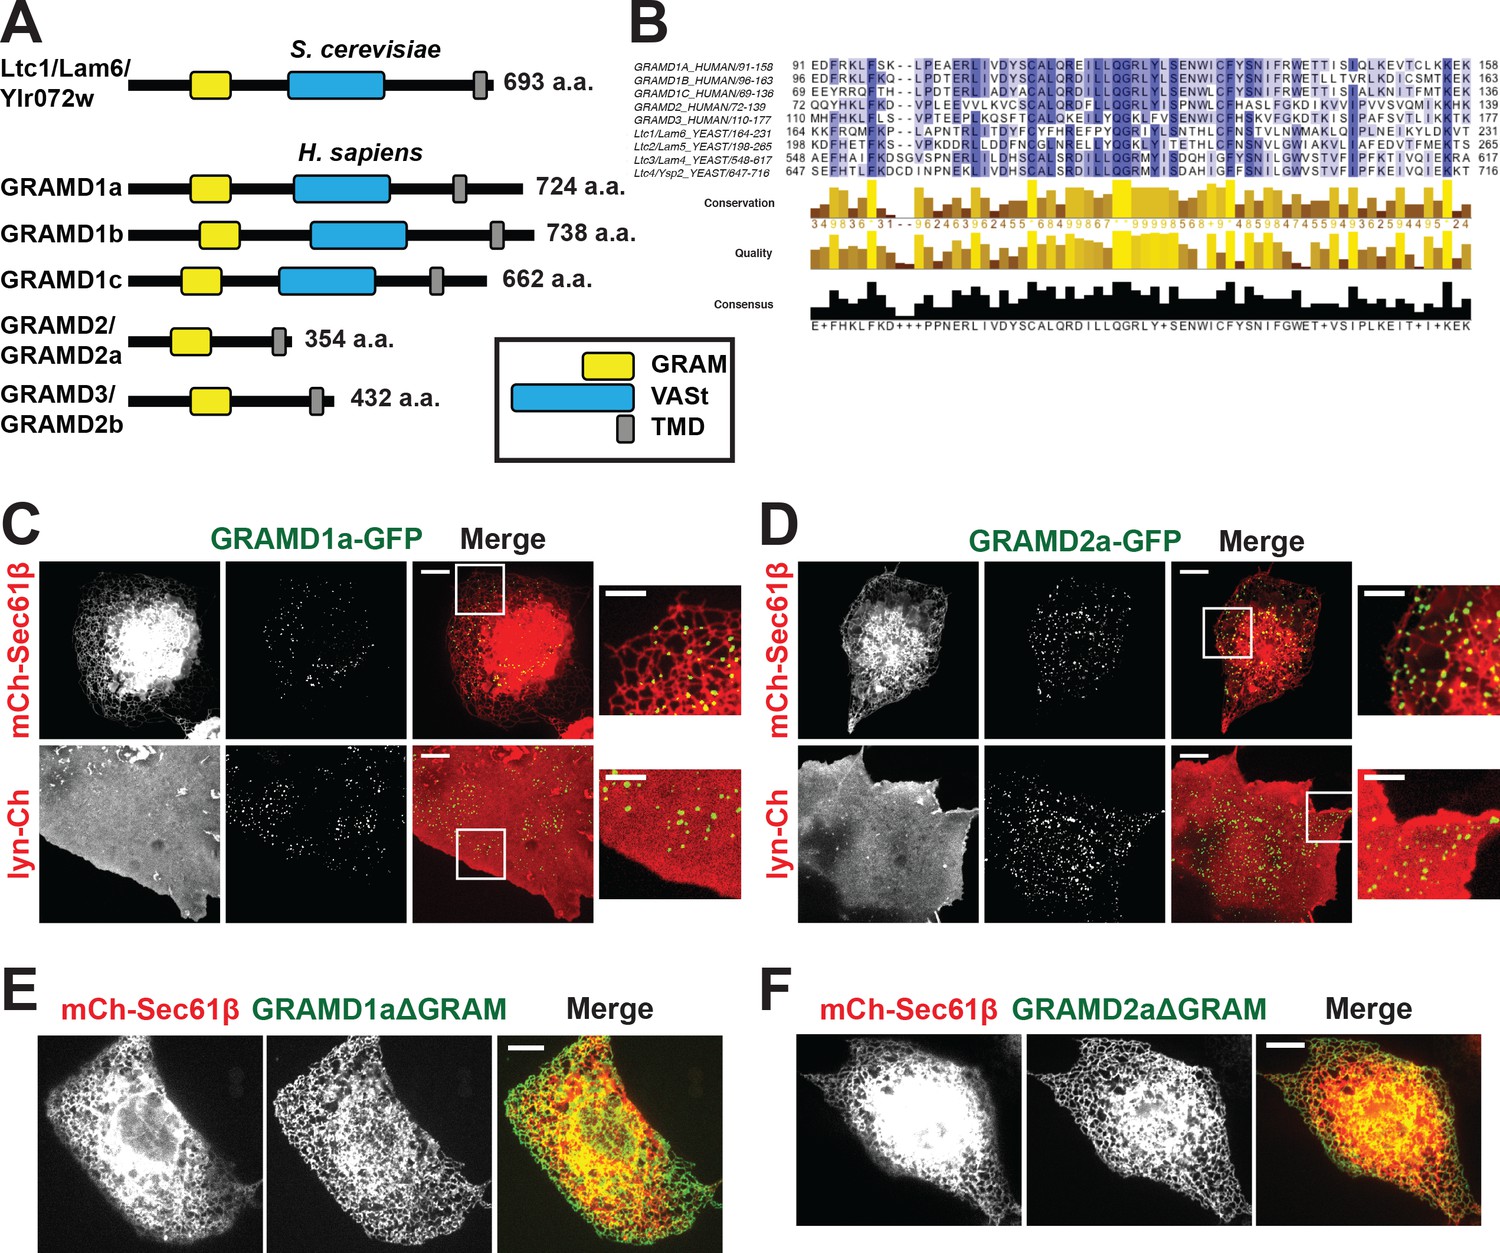
Defining a new family of human ER MCS proteins.
(A) Human proteins GRAMD1a-c and GRAMD2a and b are members of a protein family with similarity to the yeast Ltc1/Lam proteins, which all possess an unstructured N-terminus, a GRAM domain, and an ER-anchoring hydrophobic transmembrane domain. GRAMD1a-c contain an additional predicted sterol transport START-like VaST domain, similar to yeast family member Ltc1/Lam6. (B) Alignment of conserved GRAM domains from yeast and human family members. (C–D) Localization of GRAMD1a-eGFP (C) and GRAMD2a-eGFP (D) in COS7 mammalian cells relative to ER-marker mCherry-Sec61β and PM-marker lyn-mCherry. (E–F) Examination of localization of GRAMD1aΔGRAM (E) and GRAMD2aΔGRAM (F) with mCherry-Sec61β. Representative images shown from at least 17 cells that were obtained from three biological replicates. Scale bar 10 μm in full images and 5 μm in insets (the same dimensions are maintained for all subsequent figures).
Figure 1—figure supplement 1
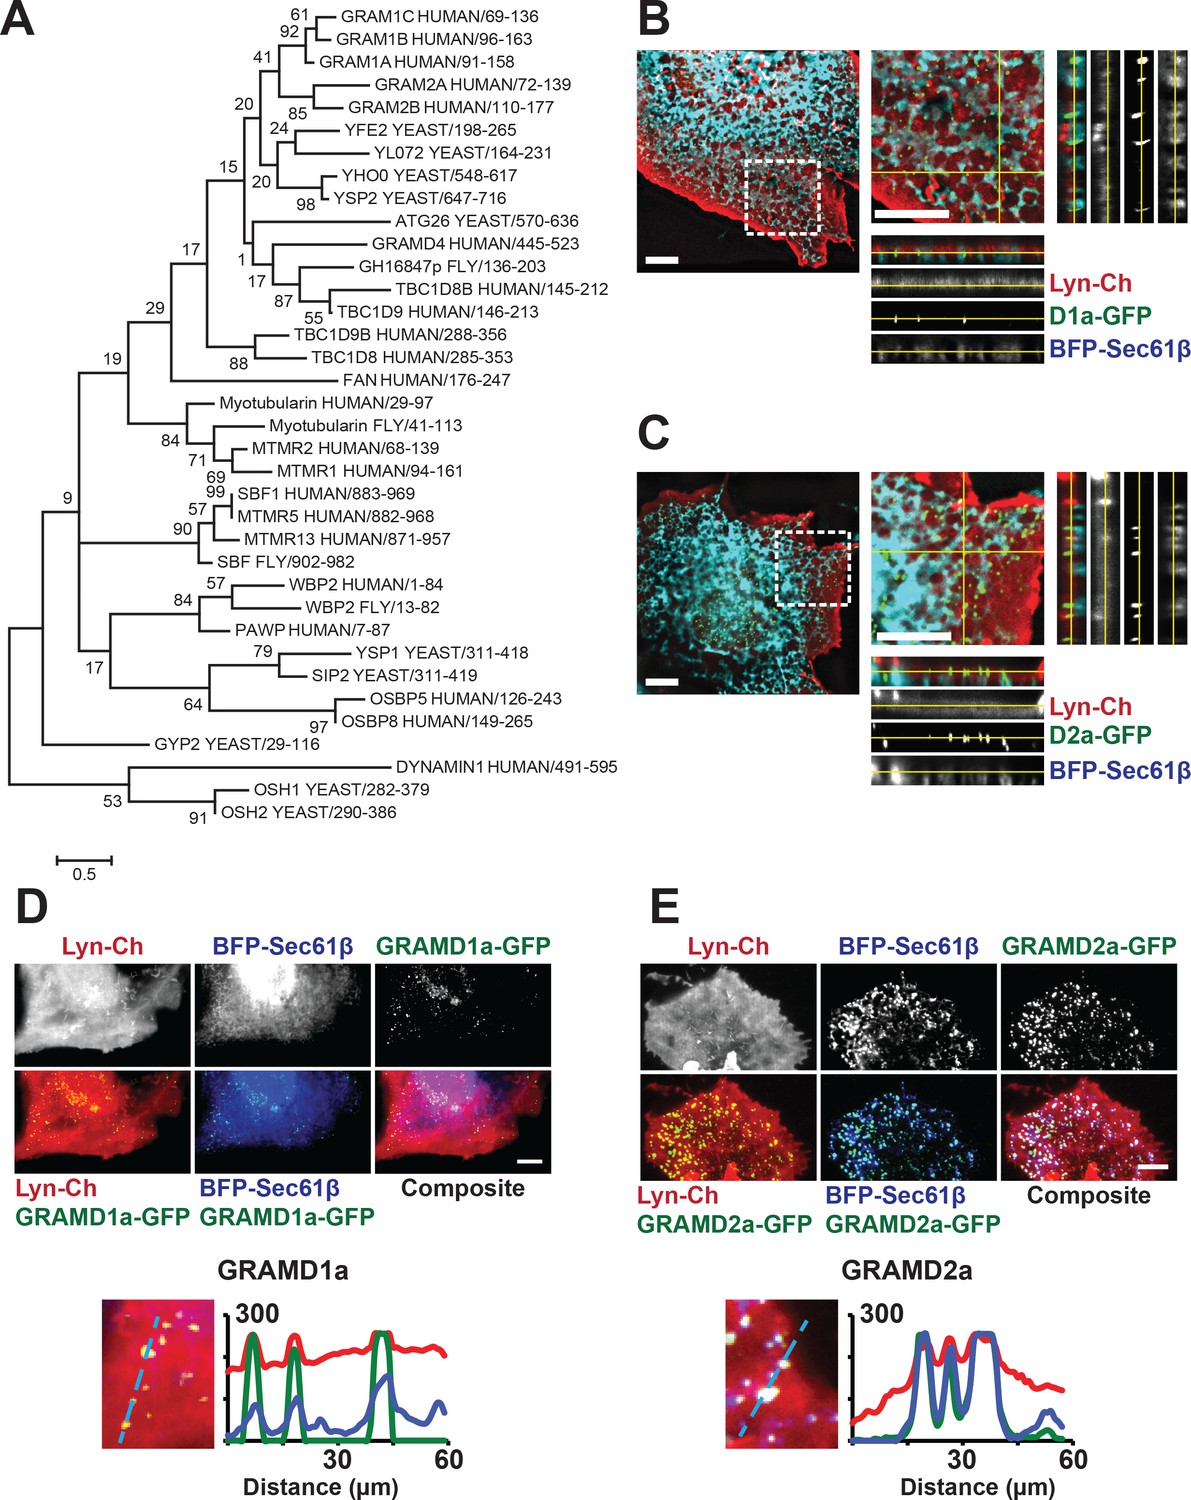
GRAMD1a and GRAMD2a localize to ER-PM contact sites.
(A) Maximum Likelihood phylogenetic tree (bootstrapped 1000 times) of proteins possessing GRAM domains and PH domains from Homo sapiens, Saccharomyces cerevisiae, and Drosophila melanogaster. Phylogenetic analysis and structure prediction programs reveal that Ltc1-4 (Lam6/5/4 and Ysp2) and GRAMD1a-c as well as GRAMD2a and GRAMD2b are orthologs of a family of proteins that is anchored by the presence of a GRAM domain. MEGA7 software was used to generate this phylogenetic tree, which reveals that the GRAMD domains from H. sapiens proteins GRAMD1a/b/c, GRAMD2a, and GRAMD2b share a common ancestor with their S. cerevisiae protein orthologs Ltc1/2/3/4 (Lam6/5/4 and Ysp2). GRAMD4 is not evolutionarily related to GRAMD1a-c, GRAMD2a, or GRAMD2b. (B–C). Orthogonal view of GRAMD1a (B) or GRAMD2a (C) reconstructed from Z-stack of Cos7 cells expressing both lyn-mCherry, and BFP-Sec61β shown in Figure 1C and D. (D–E). TIRF imaging of Cos7 cells expressing either GRAMD1a-eGFP (D) or GRAMD2a-eGFP (E), lyn-mCherry, and BFP-Sec61β. Line scans demonstrate that GRAMD1a and GRAMD2a localize to regions of cortical ER at PM contacts. Y-axis of line scans are arbitrary fluorescence units. Representative images shown from at least 12 cells that were obtained from three biological replicates.
Figure 1—video 1
GRAMD1a-eGFP with mCherry-Sec61β and lyn-mCherry Z-stack, sample images are displayed in Figure 1C
https://doi.org/10.7554/eLife.31019.004
Figure 1—video 2
GRAMD2a-eGFP with mCherry-Sec61β and lyn-mCherry Z-stack, sample images are displayed in Figure 1D
https://doi.org/10.7554/eLife.31019.005
Figure 1—video 3
3D rendering of GRAMD1a-eGFP with mCherry-Sec61β and lyn-mCherry: orthogonal view, sample images displayed in Figure 1—figure supplement 1B
https://doi.org/10.7554/eLife.31019.006
Figure 1—video 4
3D rendering of GRAMD2a-eGFP with mCherry-Sec61β and lyn-mCherry: orthogonal view, sample images displayed in Figure 1—figure supplement 1C
https://doi.org/10.7554/eLife.31019.007
Figure 2 with 1 supplement
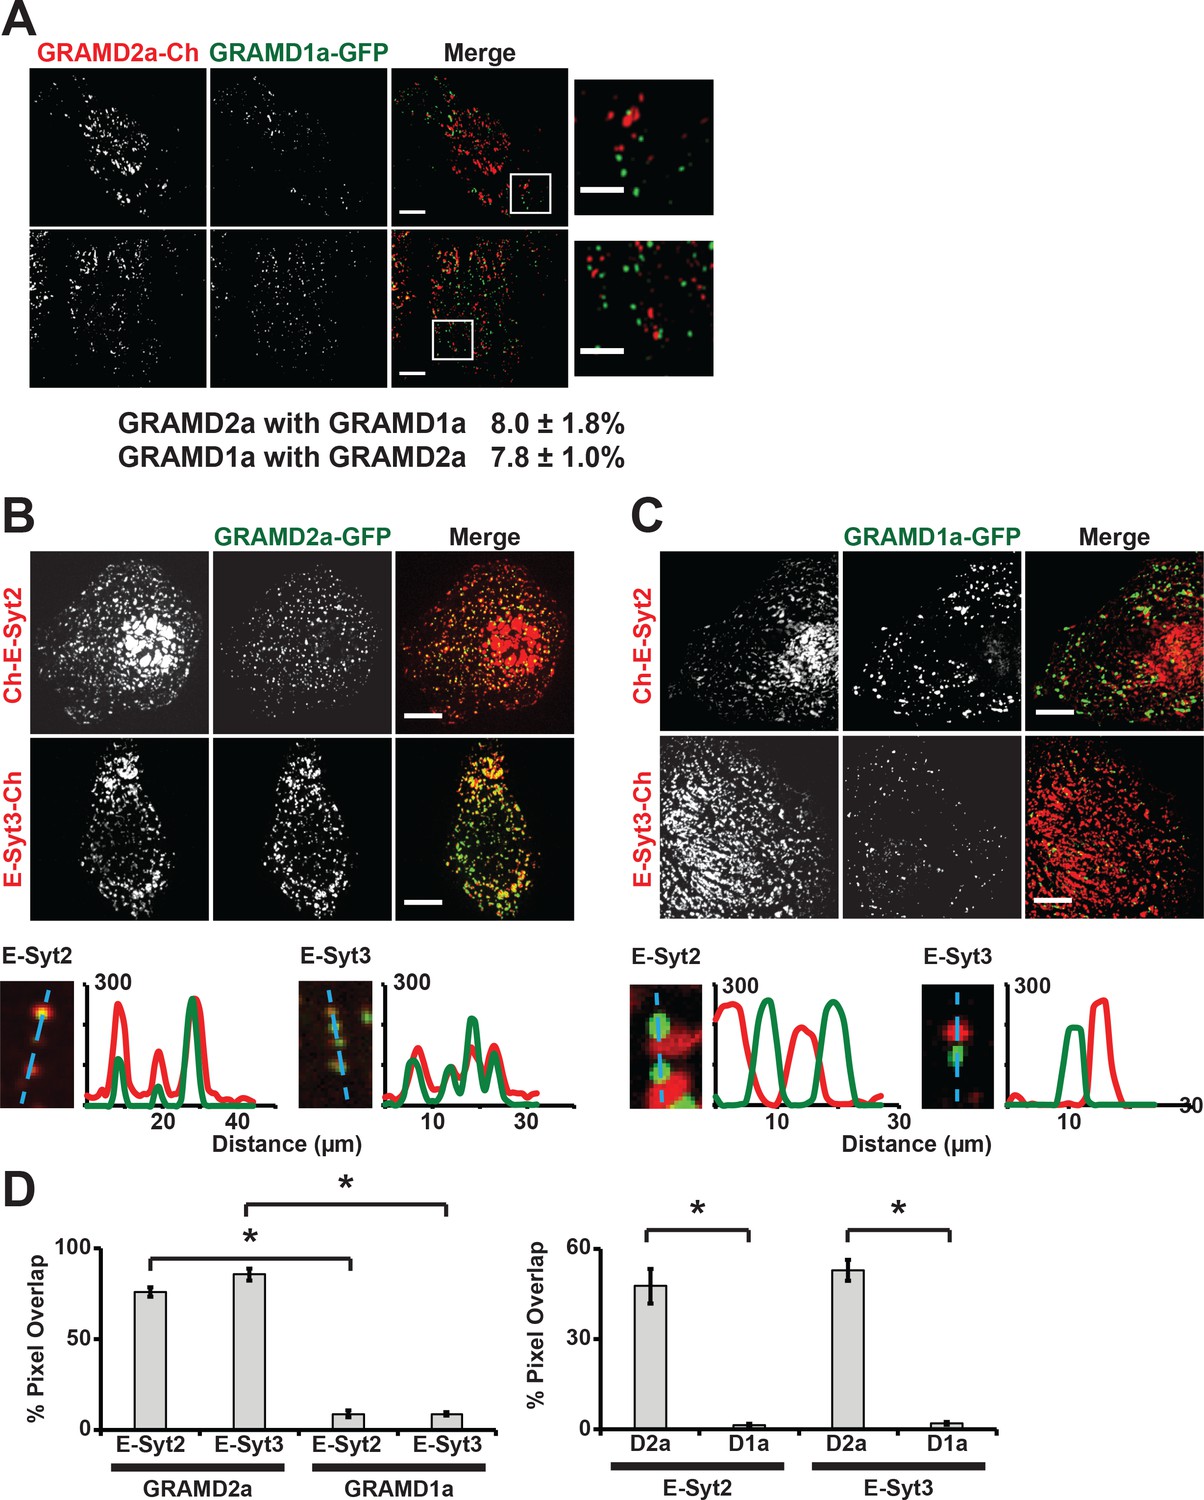
GRAMD2a and GRAMD1a mark distinct ER-PM contact sites.
(A) Analysis of the relative localization of GRAMD1a-eGFP and GRAMD2a-mCherry in Cos7 cells. Two sample cells are shown. Bottom panel is quantification of the amount of overlapping total fluorescence signal pixels from GRAMD1a-eGFP and GRAMD2a-mCherry. Representative images of two different cells, that were imaged on two different days shown. 14 cells imaged and analyzed from three biological replicates. (B–C) Localization of GRAMD2a-eGFP (B) or GRAMD1a-eGFP (D) relative to mCherry-labeled ER-PM tethers E-Syt2 or E-Syt3 in Cos7 cells. Bottom panels are line scan analysis of individual GRAMD2a-eGFP (B) or GRAMD1a-eGFP (C) foci. Y-axis of line scans are arbitrary fluorescence units. (D) Quantification of co-localization of GRAMD2a or GRAMD1a with E-Syt2 and E-Syt3 as % of total fluorescence pixels of GRAMD1a or GRAMD2a (top panel) or ESyt2 or ESyt3 (bottom panel). Standard Error shown, *p<10−2 from two-tailed t-test. Specifically, GRAMD2a with E-Syt2 compared to GRAMD1a with E-Syt2, p=8.97 × 10⁻¹²; GRAMD2a with E-Syt3 compared to GRAMD1a with E-Syt3, p=3.40 × 10⁻¹⁷; E-Syt2 with GRAMD2a compared to E-Syt2 with GRAMD1a, p=9.56 × 10⁻⁷; E-Syt3 with GRAMD2a compared to E-Syt3 with GRAMD1a, p=3.14 × 10⁻¹³. Representative images shown from at least 16 cells that were obtained from three biological replicates. Pixel co-localization analysis was performed on all cells.
-
Figure 2—source data 1
Figure 2D Co-localization analysis: Top table is pixel overlap of GRAMD2a and GRAMD1a with E-Syt2 and E-Syt3; standard Error shown.
Bottom table is corresponding two-tailed t-test values.
- https://doi.org/10.7554/eLife.31019.010
Figure 2—figure supplement 1
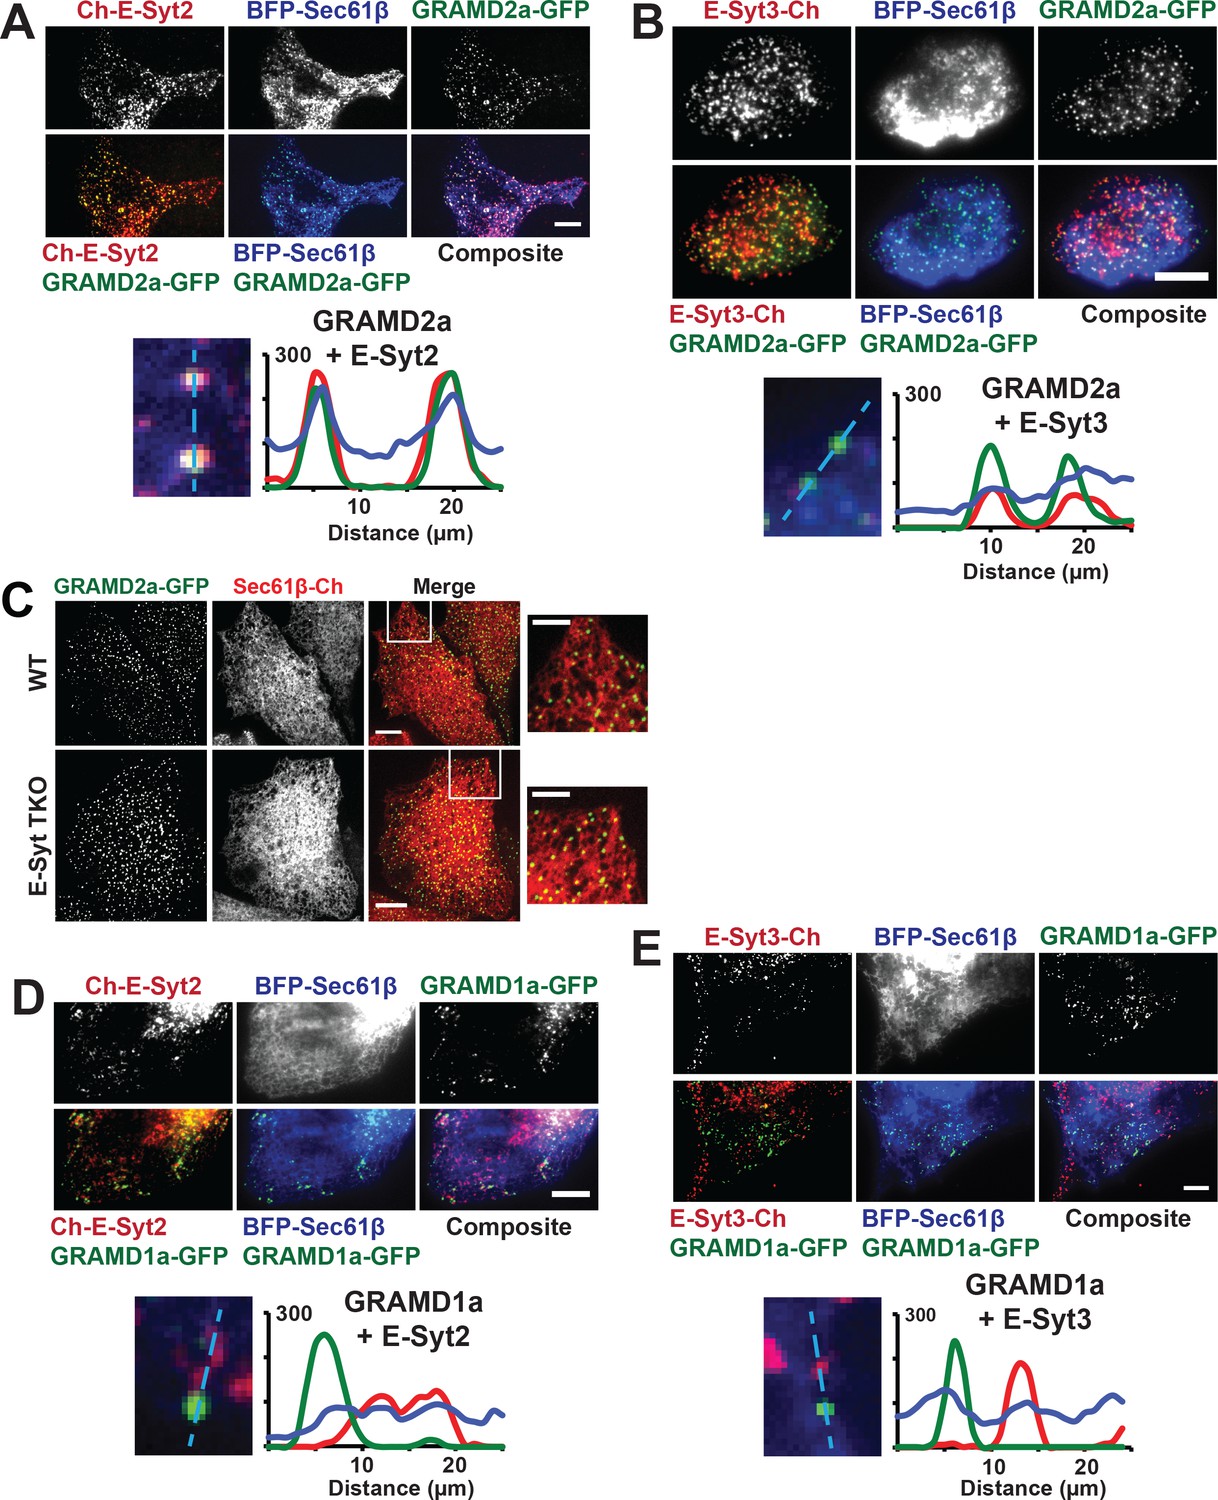
Relationship of GRAMD1a and GRAMD2a to E-Syt2/3.
(A–B) TIRF imaging of Cos7 cells expressing GRAMD2a-eGFP with mCherry-E-Syt2 (A) or mCherry-E-Syt3 (B) and BFP-Sec61β. (C) Localization of GRAMD2a-eGFP in wild type HeLa cells and HeLa E-Syt1/2/3 -/- cells (Saheki et al., 2016). (D–E). TIRF imaging of Cos7 cells expressing GRAMD1a-eGFP with mCherry-E-Syt2 (D) or E-Syt3-mCherry (E), and BFP-Sec61β. Bottom panels of A-B and D-E are line scans of fluorescence associated with GRAMD2a and GRAMD1a fluorescent foci. Y-axis of line scans are arbitrary fluorescence units. Representative images shown from at least 10 cells that were obtained from two biological replicates.
Figure 3 with 1 supplement
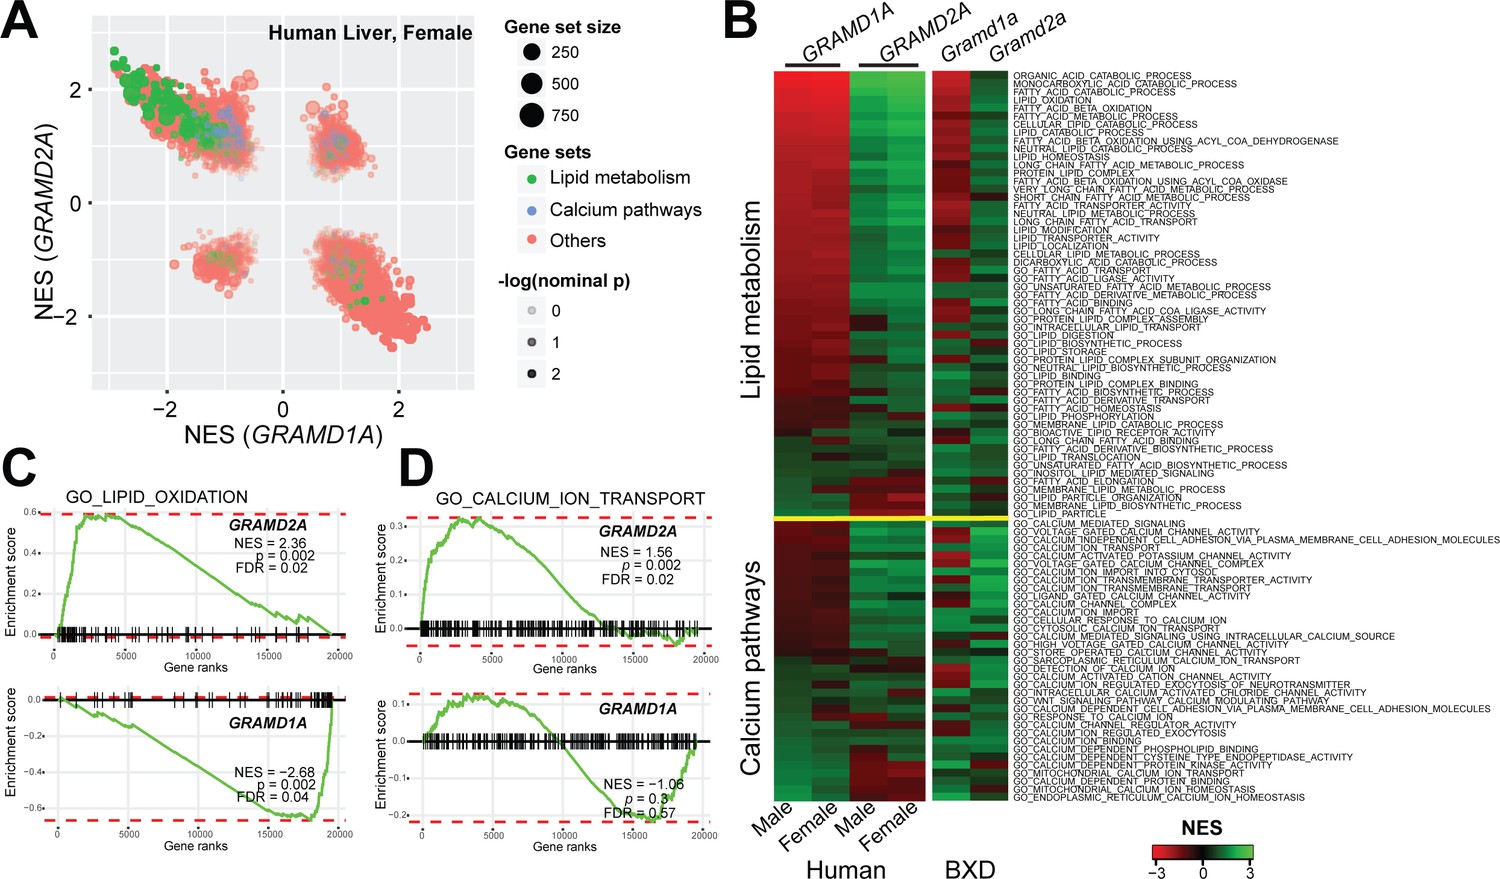
Gene set enrichment analysis of GRAMD1a and GRAMD2a indicated distinct physiological functions.
(A) Comparison of enrichment results between GRAMD1a and GRAMD2a in transcriptome data of liver samples from 193 female human individuals. Normalized enrichment score (NES) of GRAMD1a and GRAMD2a are used to compare the GO pathway enrichment of these two genes in lipid metabolism and Ca2+ signaling gene sets highlighted in green and blue, respectively. Dot size represents the number of genes, and transparency of the dot indicates the significance (-log10(nominal p value)) of the enrichment of the two transcripts for the gene set. (B) Heat-map showing the enrichment of GRAMD1a and GRAMD2a in genes involved in lipid metabolism and Ca2+ signaling in liver samples from human male and female individuals, as well as from males of the BXD mouse genetic reference population. (C–D) Enrichment plot of GRAMD1a and GRAMD2a in human liver samples from female individuals shows their distinct physiological functions in lipid metabolism (C) and Ca2+ signaling pathways (D). FDR, false discovery rate.
Figure 3—figure supplement 1
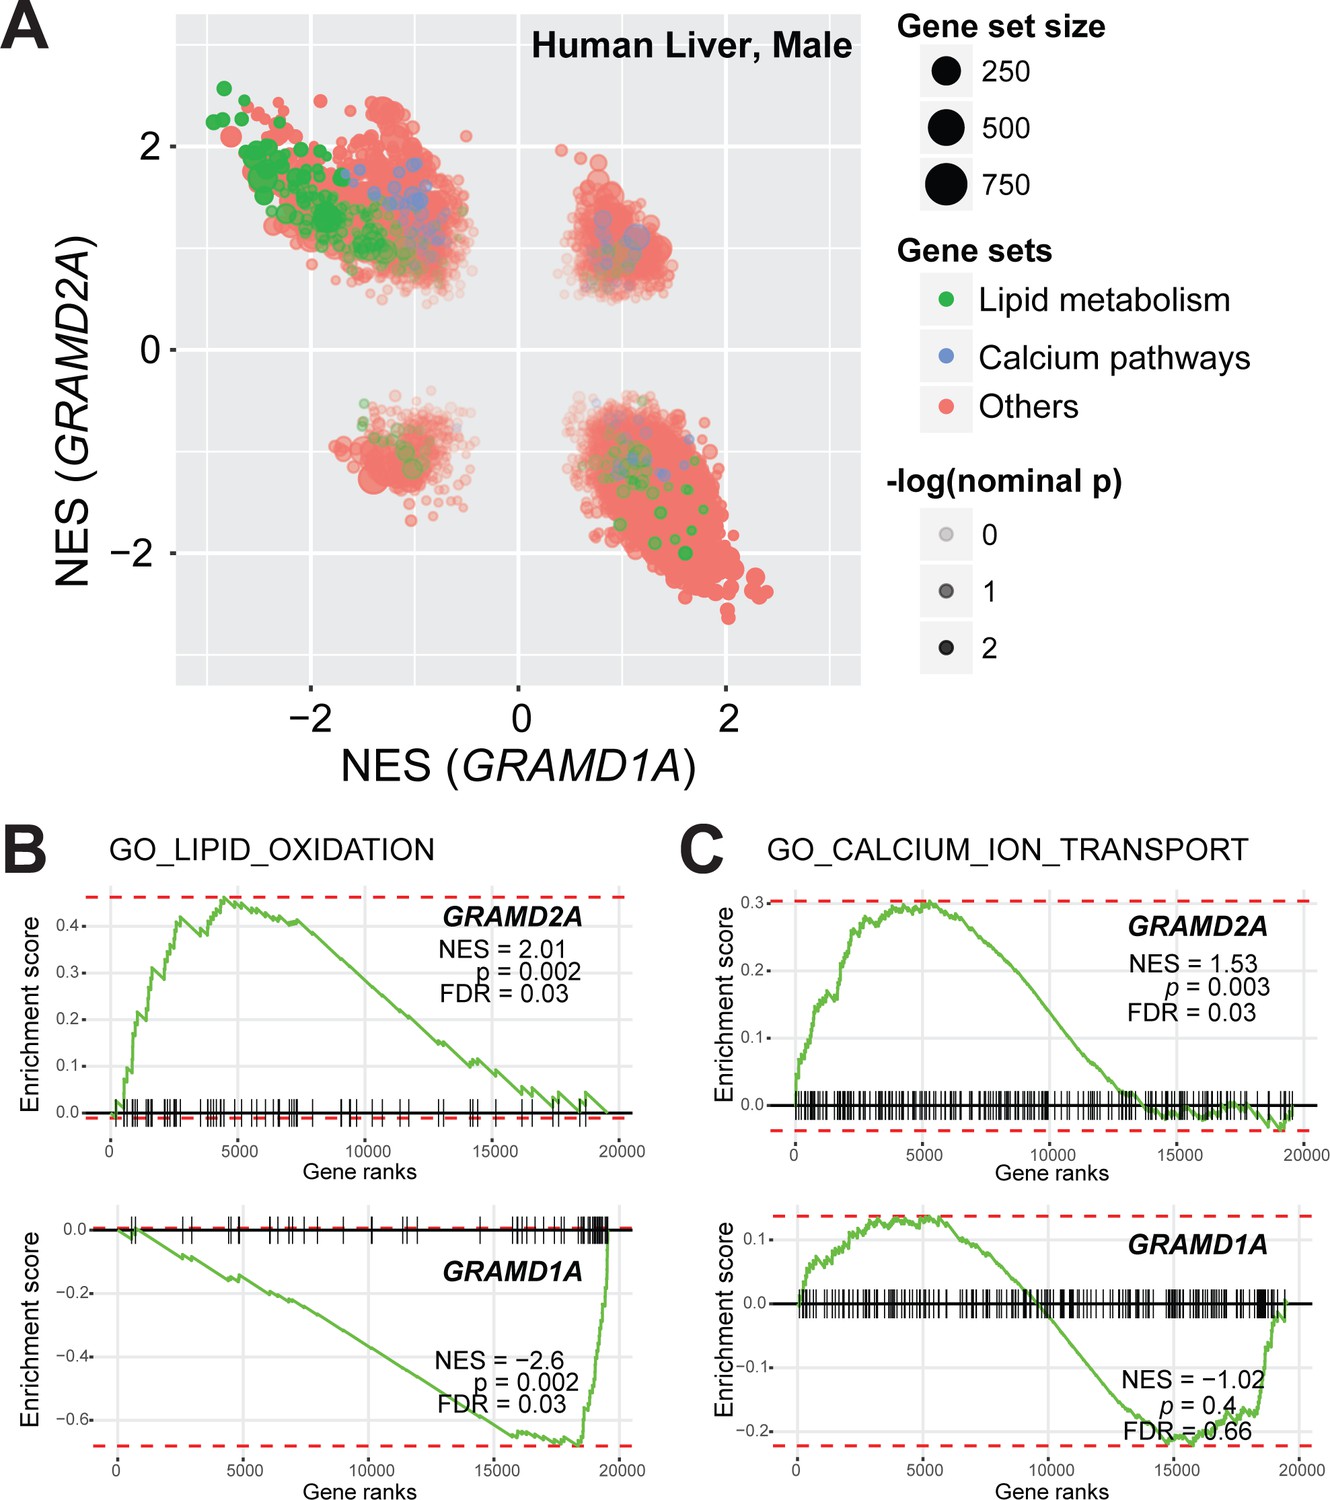
Gene set enrichment analysis of GRAMD1a and GRAMD2a in males.
(A) Comparison of enrichment results between GRAMD1a and GRAMD2a in transcriptome data of liver samples from 234 male humans. Normalized enrichment score (NES) of GRAMD1a and GRAMD2a are used to compare the GO pathway enrichment of these two genes in lipid metabolism and Ca2+ signaling gene sets highlighted in green and blue, respectively. Dot size represents the number of genes, and transparency of the dot indicates the significance (-log10(nominal p value)) of the enrichment of the two transcripts for the gene set. (C–D) Enrichment plot of GRAMD1a and GRAMD2a in human liver samples from male individuals shows their distinct physiological functions in lipid metabolism (B) and calcium signaling pathways (C). FDR, false discovery rate.
Figure 4 with 1 supplement
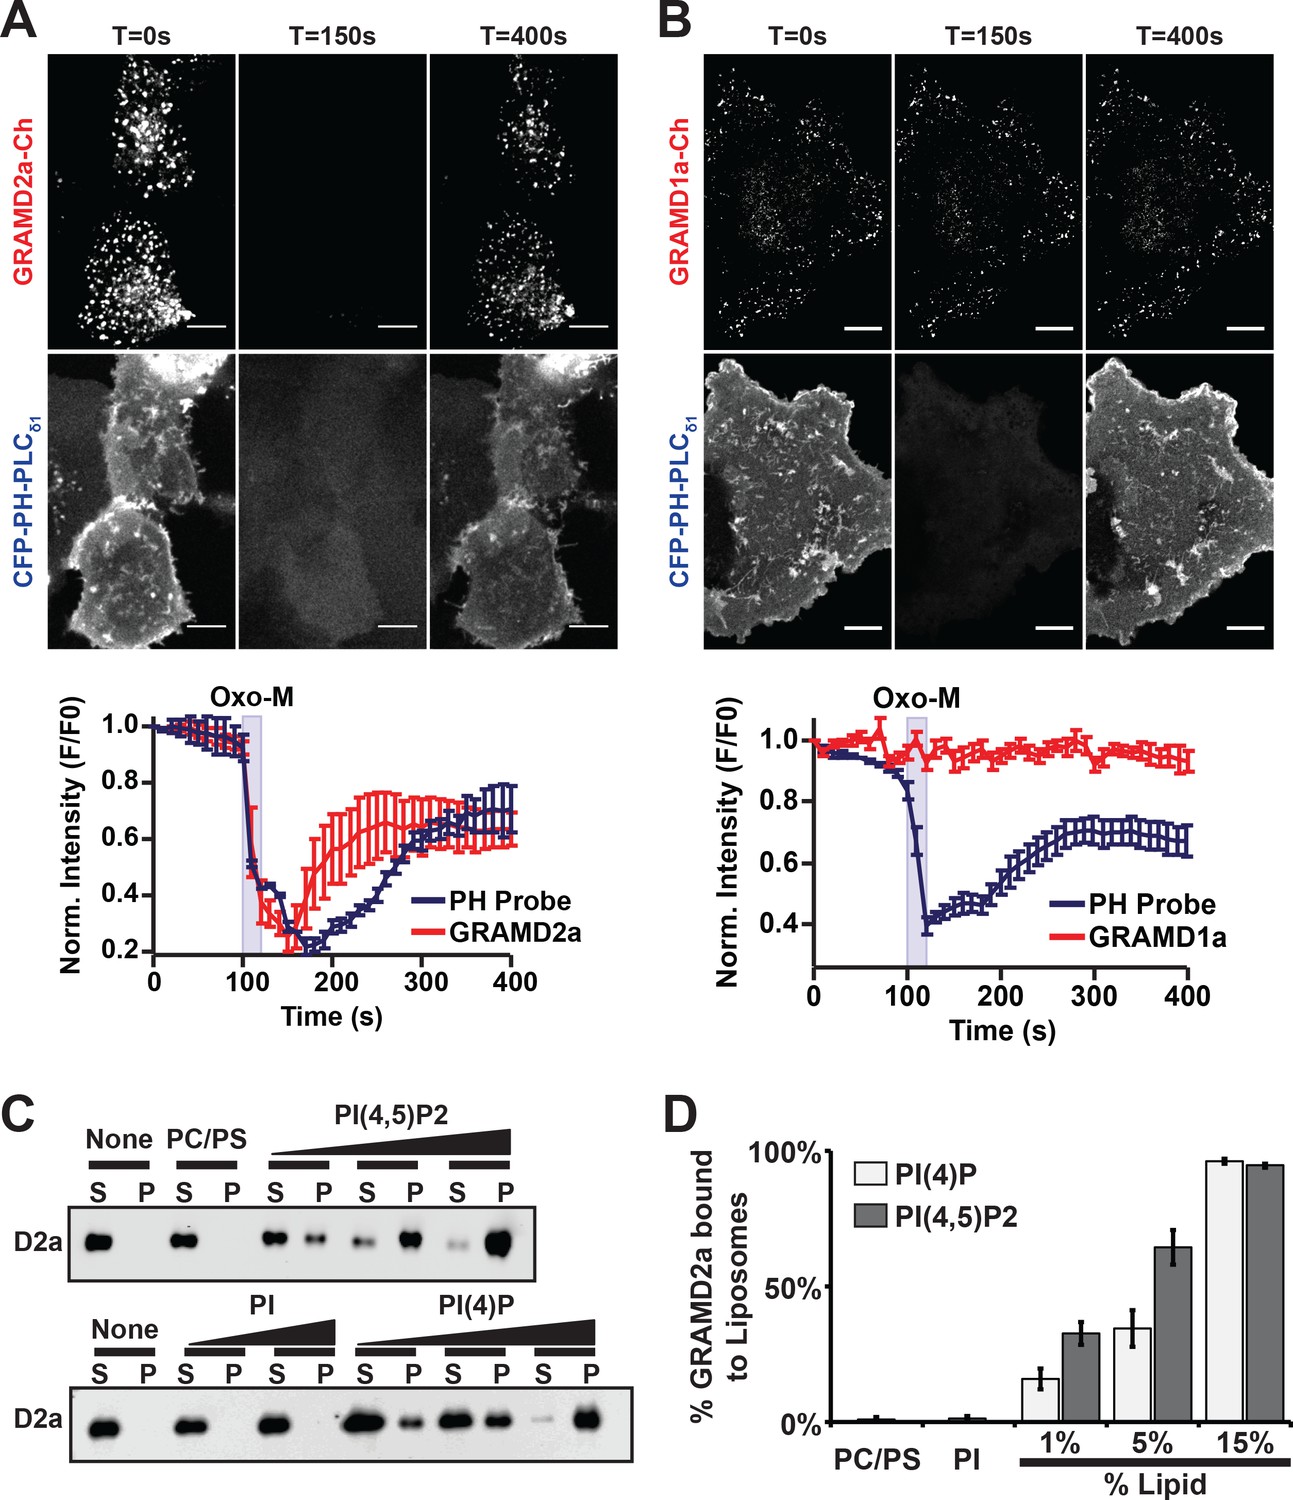
GRAMD2a is targeted to the PM via PI(4,5)P2.
(A–B) Examination of the PI(4,5)P2-dependent behavior of PM-associated GRAMD2a-eGFP (A) and GRAMD1a-eGFP (B). PM PI(4,5)P2 was reversibly depleted by 10 s addition (middle panel) and removal (left panel) of 10 μM of the muscarinic agonist oxotremorineM (OxoM) as monitored by the PI(4,5)P2 marker CFP-PH-PLCδ1. Normalized intensity of fluorescent proteins used in PI(4,5)P2 depletion experiments shown in lower panels of (A and B). Representative images shown from at least 12 cells that were obtained from two biological replicates. Fluorescence intensity dynamics were analyzed for all cells. (C) Western Blot analysis of centrifugation-based liposome binding assays with recombinant His6-GRAMD2aΔTM and liposomes of different composition. Control PM-like liposomes: 85% PC: 15% PS; PM-like liposomes with PI: 85% PC: 10% PS: 5% PI or 85% PC: 15% PI; PM-like liposomes with PI(4)P: 85% PC: 14% PS: 1% PI(4)P, 85% PC: 10% PS: 5% PI(4)P, or 85% PC: 15% PI(4)P; PM-like liposomes with PI(4,5)P2: 85% PC: 14% PS: 1% PI(4,5)P2, 85% PC: 10% PS: 5% PI(4,5)P2, or 85% PC: 15% PI(4,5)P2. S and P indicate supernatant and pellet, respectively. (D) Quantification of liposome binding experiments, n = 4 (biological replicates), Standard Error shown.
-
Figure 4—source data 1
Figure 4D Quantification of liposome binding assays with recombinant His6-GRAMD2aΔTM: liposome assays were repeated four times; standard Error shown.
- https://doi.org/10.7554/eLife.31019.015
Figure 4—figure supplement 1
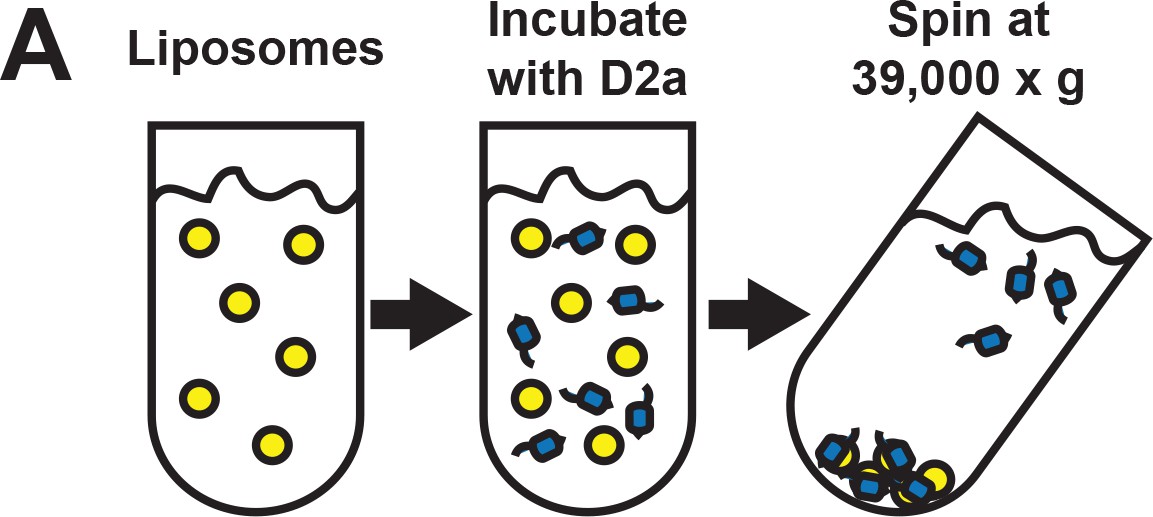
Schematic depiction of liposome binding assays.
A. Recombinant GRAMD2aΔTM was incubated with liposomes and ultracentrifugation was used to separate liposome-protein complexes from free protein.
Figure 5 with 3 supplements
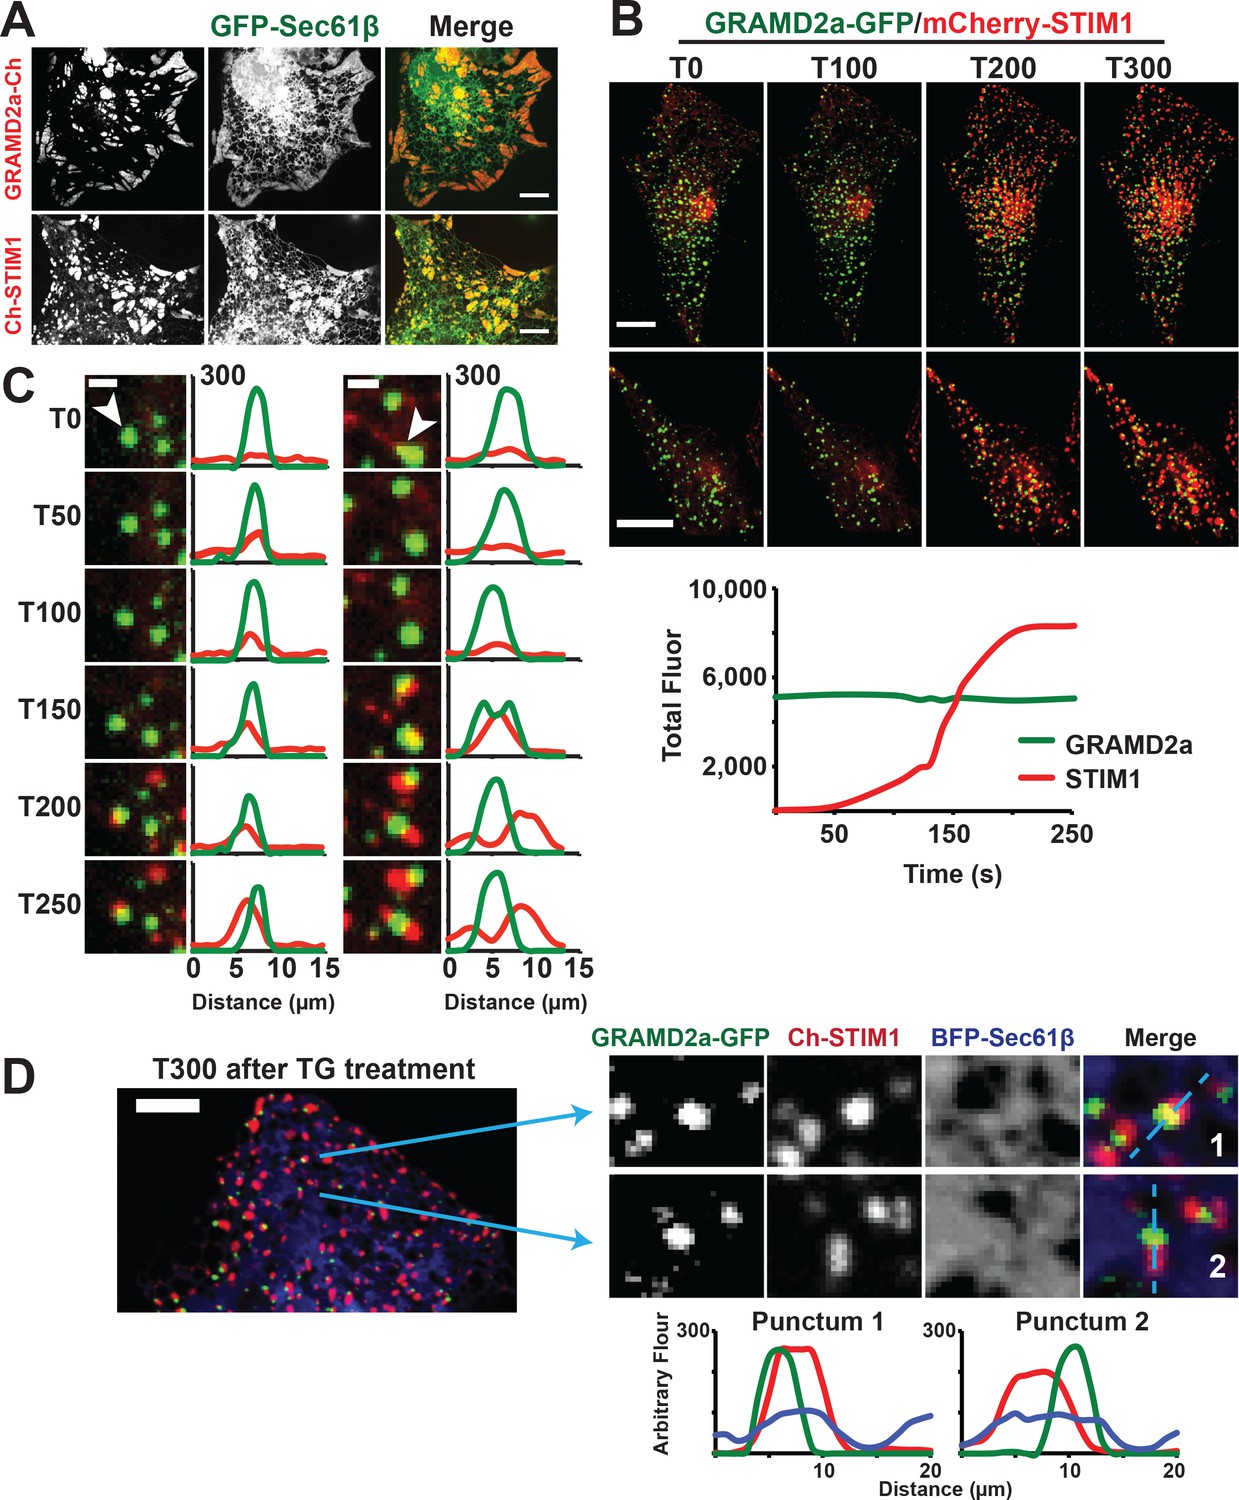
GRAMD2a pre-marks ER-PM membrane contact sites used for STIM1 recruitment during SOCE.
(A) Cortical ER as visualized with ER marker GFP-Sec61β in cells overexpressing GRAMD2a-mCherry (top panel) or mCherry-STIM1 (bottom panel). (B) Behavior of mCherry-STIM1 at resting Ca2+ and upon depletion of Ca2+ stores from the ER using SERCA inhibitor thapsigargin (TG). At T = 30 s, 1 μM TG was added. Two representative cells shown from two different experimental days. Lower panel left shows sample graph of total fluorescence of GRAMD2a-eGFP and mCherry-STIM1 throughout duration of experiment for a sample cell. (C) Zoomed-in images and line scans of individual GRAMD2a fluorescent puncta and associated fluorescence for duration of the TG treatment. Left and right panels are examples of puncta from two different cells. Y-axis of line scans are arbitrary fluorescence units. Scale bar is 2 μm. (D) Inset cropped from top cell in (B). showing COS7 cell expressing GRAMD2a-eGFP, mCherry-STIM1, and BFP-Sec61β at T300s of the TG-stimulated Ca2+ depletion. Corresponding zoomed-in images and line-scans are shown in the bottom panel. Representative images shown from at least 19 cells that were obtained from three biological replicates.
-
Figure 5—source data 1
Quantification of the percentage of co-localized total fluorescent pixels of GRAMD2a-GFP with mCherry-STIM1 or mCherry-STIM1 with GRAMD2a-GFP as a function of time after TG addition.
1 μM TG is added at T = 30 s. Standard Error shown. Analysis was performed on n = 12 cells from three independent experiments.
- https://doi.org/10.7554/eLife.31019.018
-
Figure 5—source data 2
Figure 5B representative line graph: Total pixels of GRAMD2a-eGFP and mCherry-STIM1 fluorescence during TG-treatment experiments (1 μM TG is added at T = 30 s) for sample cell.
Quantification of 12 cells shown in Figure 5—source data 1. Figure 5—figure supplement 1D Bar Graph: Top table is pixel overlap of GRAMD2a and GRAMD1a with STIM1; standard Error shown. Bottom table is corresponding two-tailed t-test values.
- https://doi.org/10.7554/eLife.31019.019
Figure 5—figure supplement 1
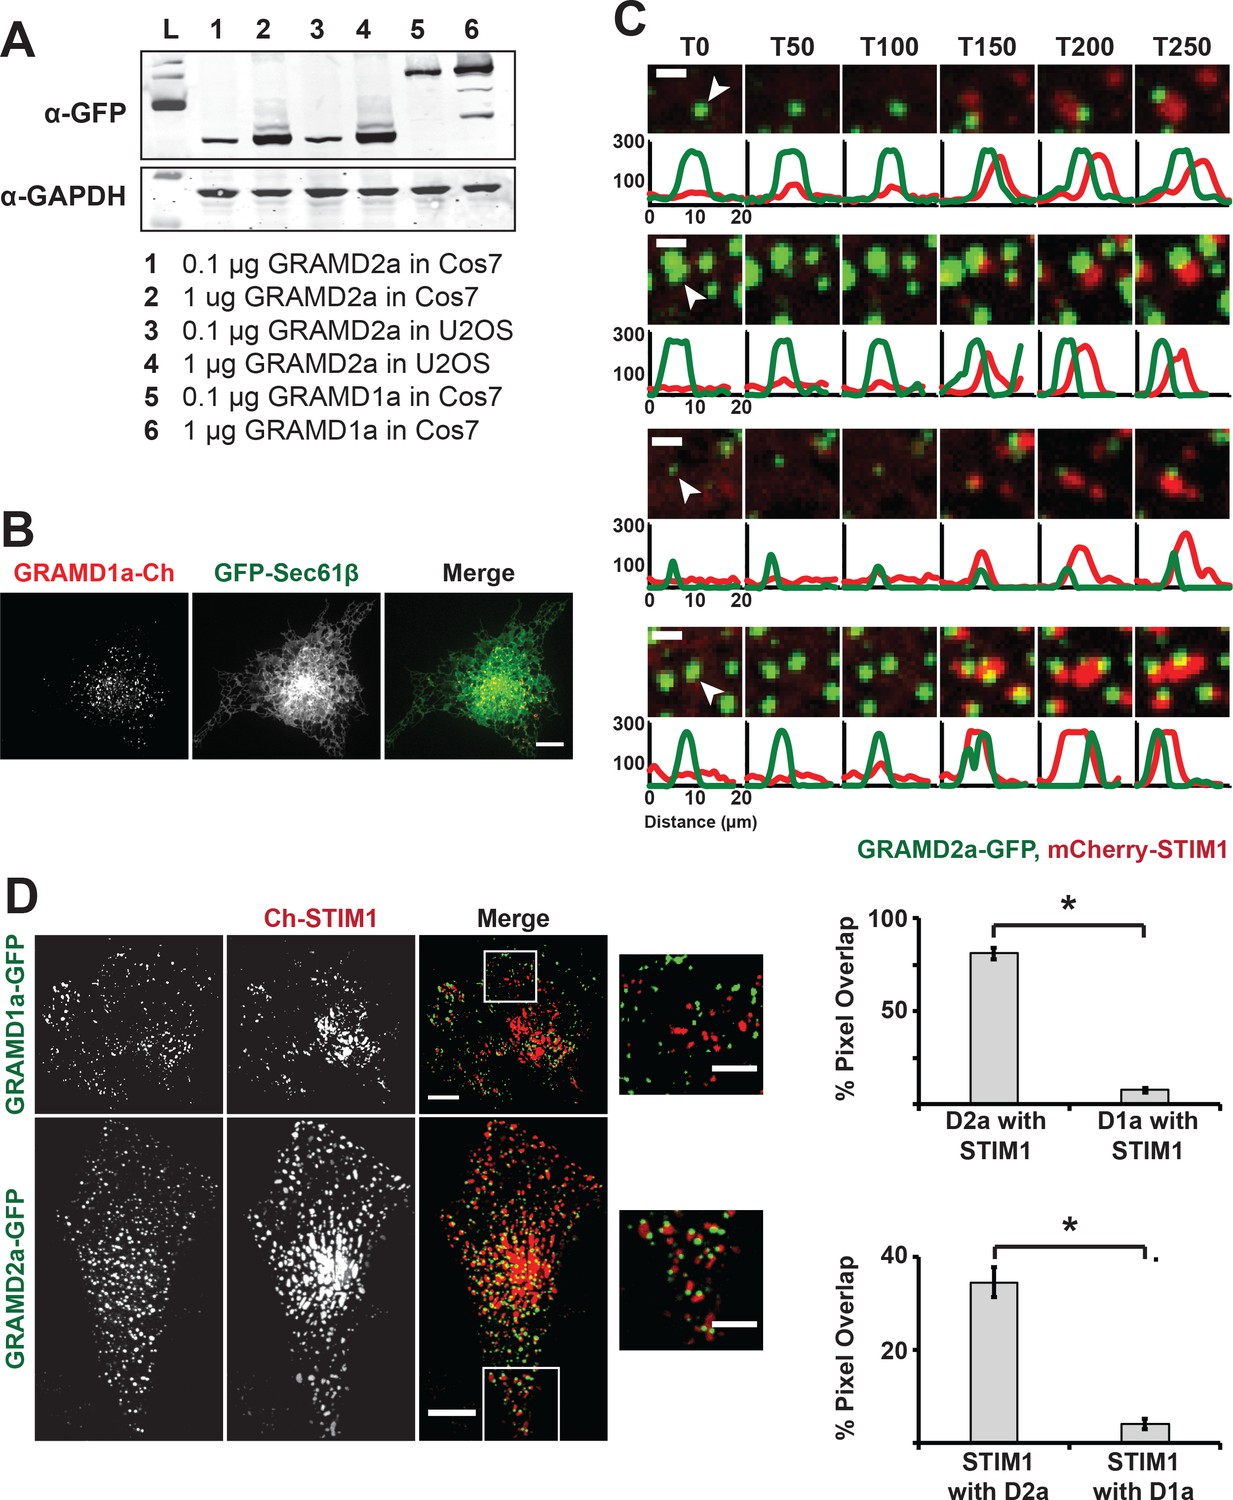
Supporting evidence for STIM1 recruitment to GRAMD2a-marked ER-PM contact sites.
(A) Western Blot analysis of GRAMD2a-eGFP and GRAMD1a-eGFP (α-GFP) in Cos7 and U2OS cells transfected with low (0.1 μg) and high (1 μg) amounts of plasmids expressing GRAMD2a-eGFP and GRAMD1a-eGFP. α-GAPDH is loading control. Three biological triplicates of western blot analysis were performed. (B) High level of expression of GRAMD1a-mCherry (1 μg of DNA per 35 mm MatTeck dish transfected) and eGFP-Sec61β. Representative images shown from 11 cells that were obtained from three biological replicates C) Four additional examples of individual GRAMD2a-eGFP puncta and associated line scans during time-lapse experiments of TG-treated Cos7 cells transfected with GRAMD2a-eGFP and mCherry-STIM1. Pucta were selected from 19 cells that were imaged on three different days. Y-axis of line scans are arbitrary fluorescence units. (D). Images of cells expressing GRAMD1a-eGFP or GRAMD2a-eGFP (duplicated from Figure 5B – top cell) at T = 300 s following TG treatment. Quantification of total signal overlap between STIM1 and either GRAMD2a or GRAMD1a after TG-induced Ca2+ depletion (right panel). Standard Error shown, *p<10−2 from two-tailed t-test. Specifically, GRAMD2a with STIM1 compared to GRAMD1a with STIM1, p=4.02 × 10⁻¹³; STIM1 with GRAMD2a compared to STIM1 with GRAMD1a, p=5.00 × 10⁻⁶. Representative images shown from at least 19 cells that were obtained from three biological replicates.
Figure 5—video 1
GRAMD2a + STIM1 during TG treatment time-lapse for top cell displayed in Figure 5B
https://doi.org/10.7554/eLife.31019.020
Figure 5—video 2
GRAMD2a + STIM1 during TG treatment time-lapse for bottom cell displayed in Figure 5B
https://doi.org/10.7554/eLife.31019.021
Figure 6 with 1 supplement
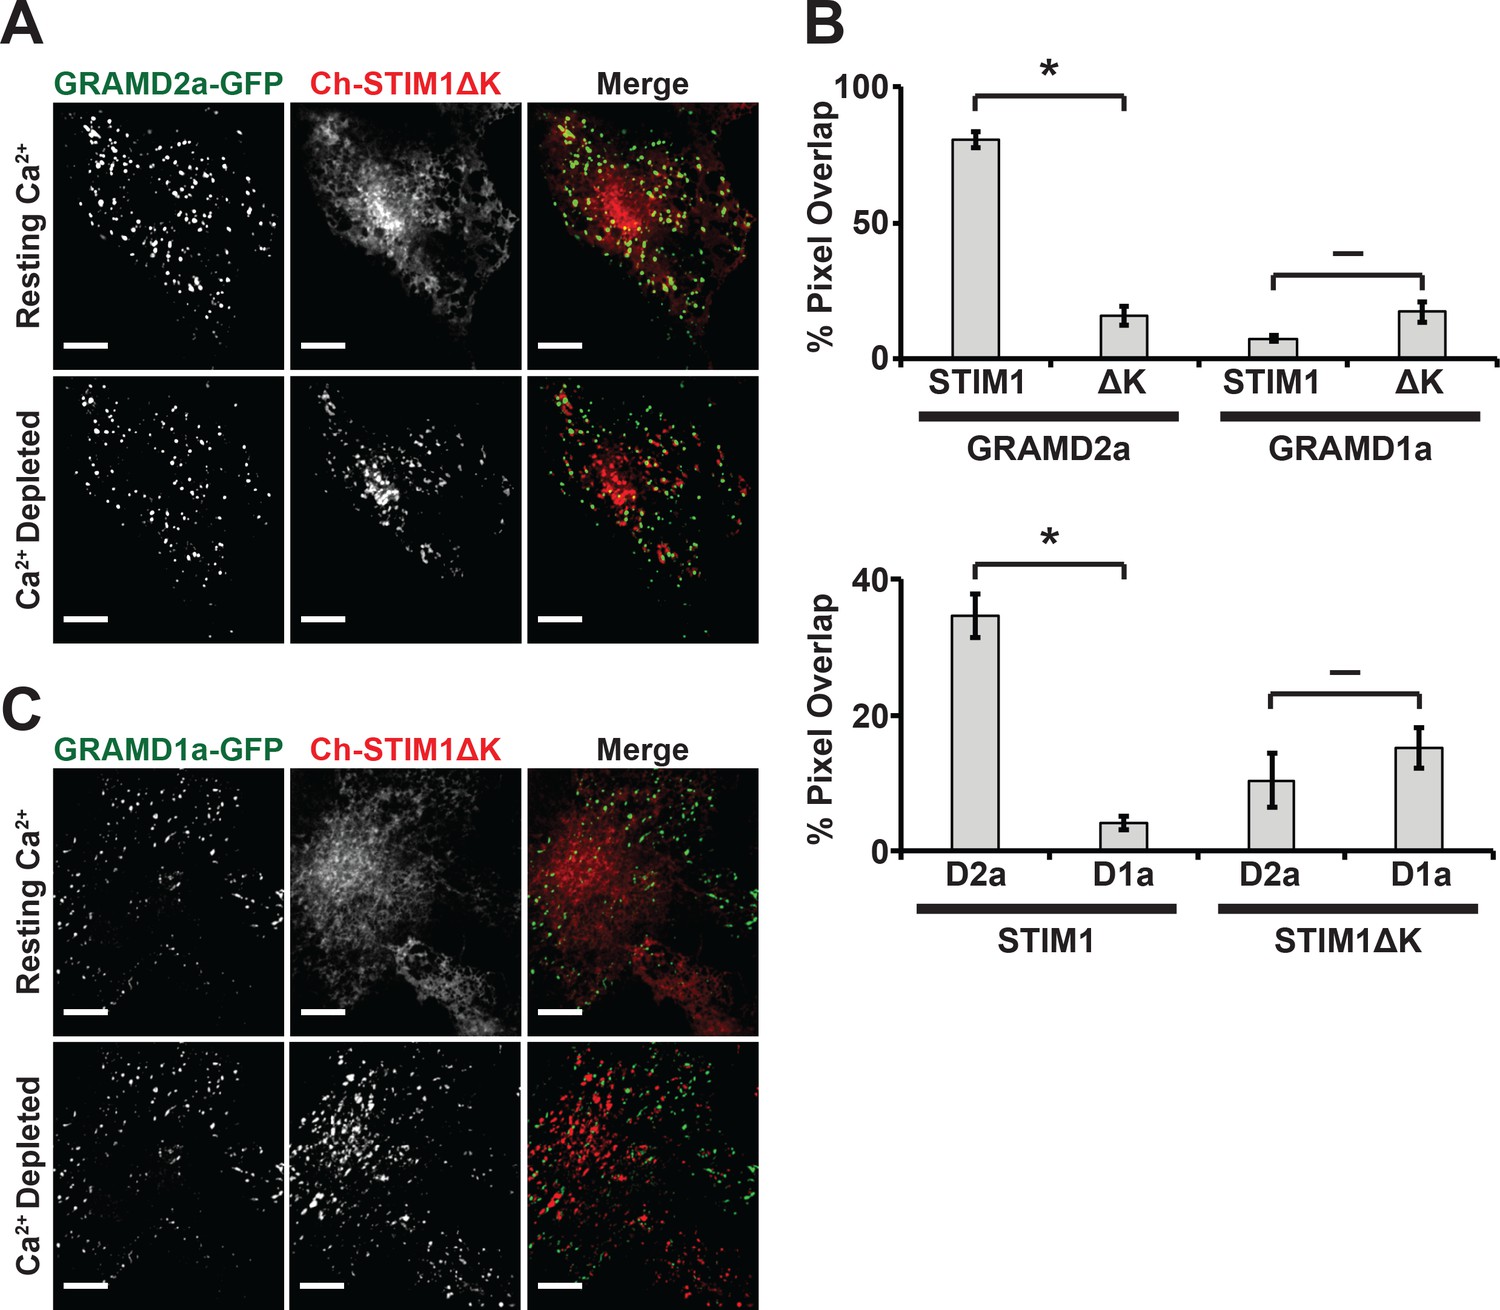
STIM1ΔK is defective for targeting to PI(4,5)P2-enriched ER-PM contact sites marked by GRAMD2a.
(A–C) Fluorescence images of Cos7 cells expressing mCherry-STIM1ΔK, a PI(4,5)P2-insensitive mutant, and either (A) GRAMD2a-eGFP or (C) GRAMD1a-eGFP before and after TG treatment along with (B) quantification of co-localization. Standard Error shown, *p<10−2 and – p>10−2 from two-tailed t-test. Specifically, GRAMD2a with STIM1 compared to GRAMD2a with STIM1ΔK, p=4.47 × 10⁻¹²; GRAMD1a with STIM1 compared to GRAMD1a with STIM1ΔK, p=2.70 × 10⁻²; STIM1 with GRAMD2a compared to STIM1 with GRAMD1a, p=5.00 × 10⁻⁶; STIM1ΔK with GRAMD2a compared to STIM1ΔK with GRAMD1a, p=3.64 × 10⁻¹. Representative images shown from at least 14 cells that were obtained from three biological replicates. Pixel co-localization analysis was performed on all cells.
-
Figure 6—source data 1
Figure 5B Bar Graph: Top table is pixel overlap of GRAMD2a and GRAMD1a with STIM1 and STIM1ΔK; standard Error shown.
Bottom table is corresponding two-tailed t-test values.
- https://doi.org/10.7554/eLife.31019.024
Figure 6—figure supplement 1
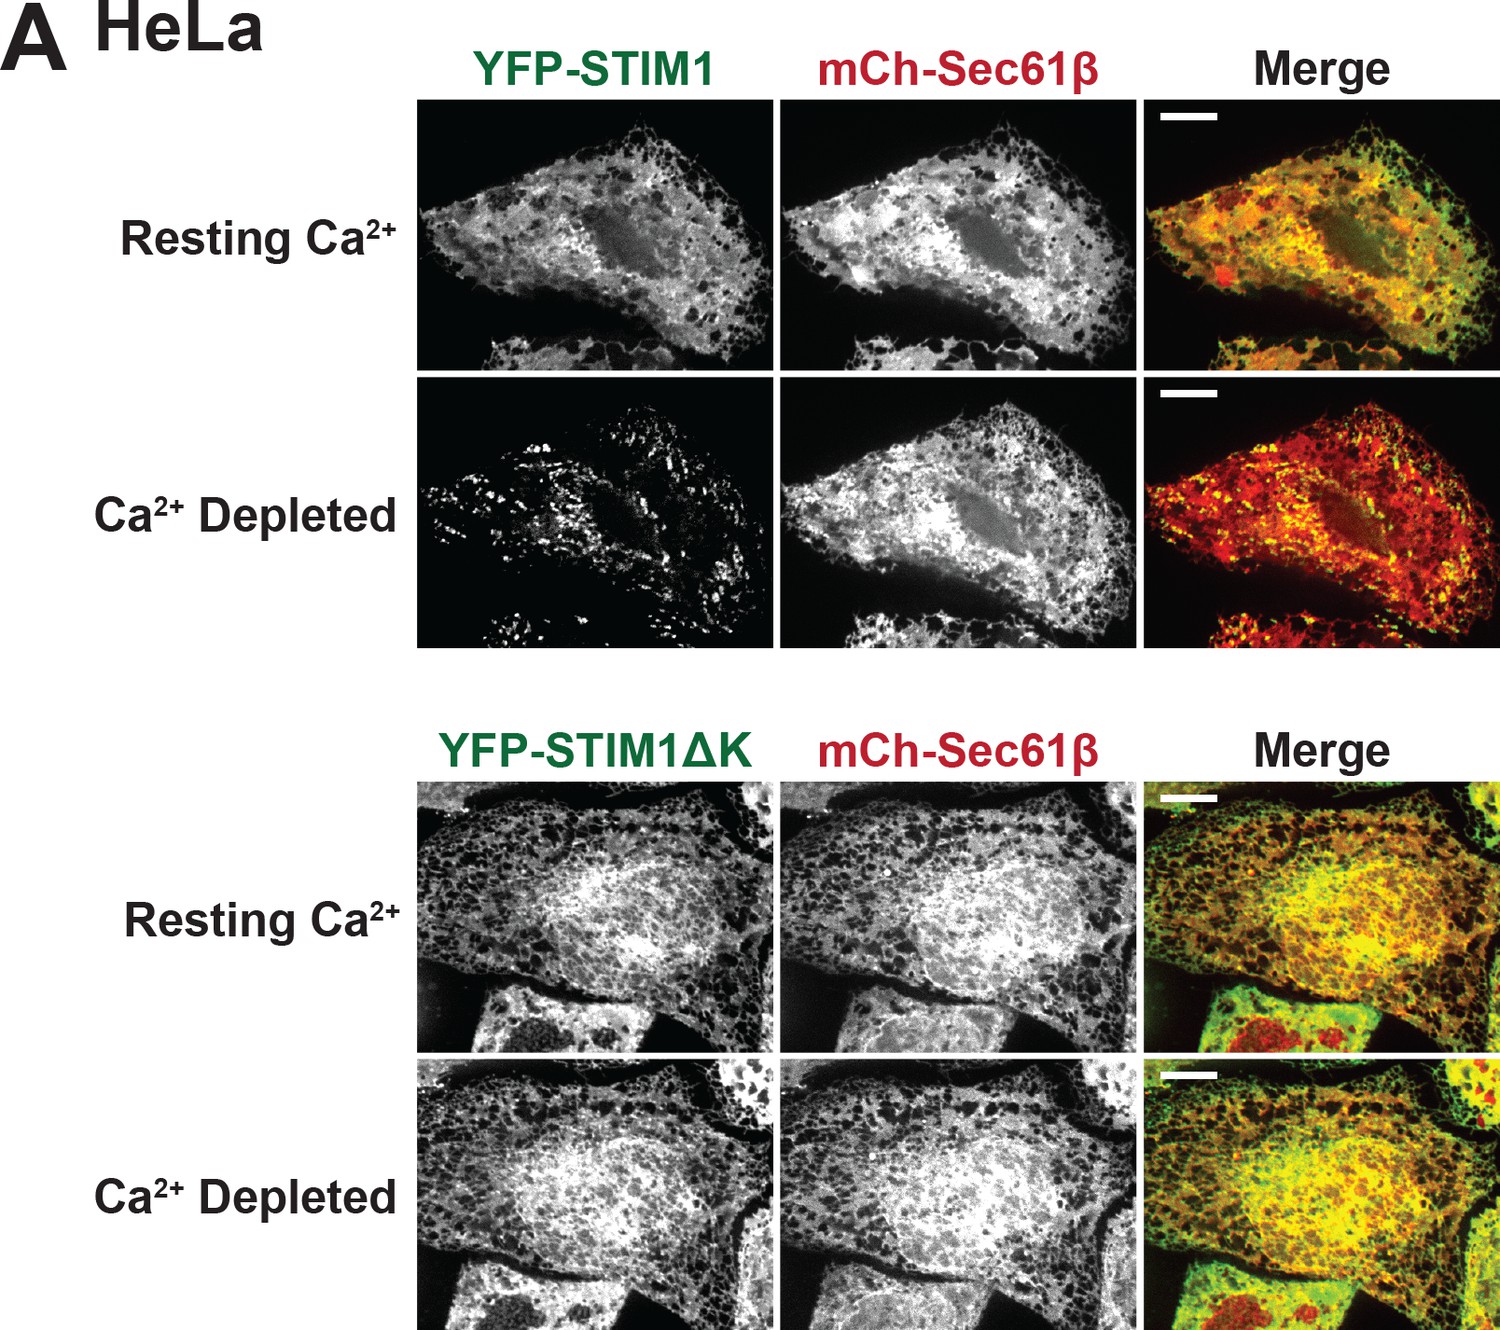
STIM1ΔK does not respond to TG in HeLa cells.
(A) HeLa cells expressing mCherry-STIM1 (top panel) and mCherry-STIM1ΔK (bottom panel) before and after TG treatment to deplete ER Ca2+.
Figure 7 with 3 supplements
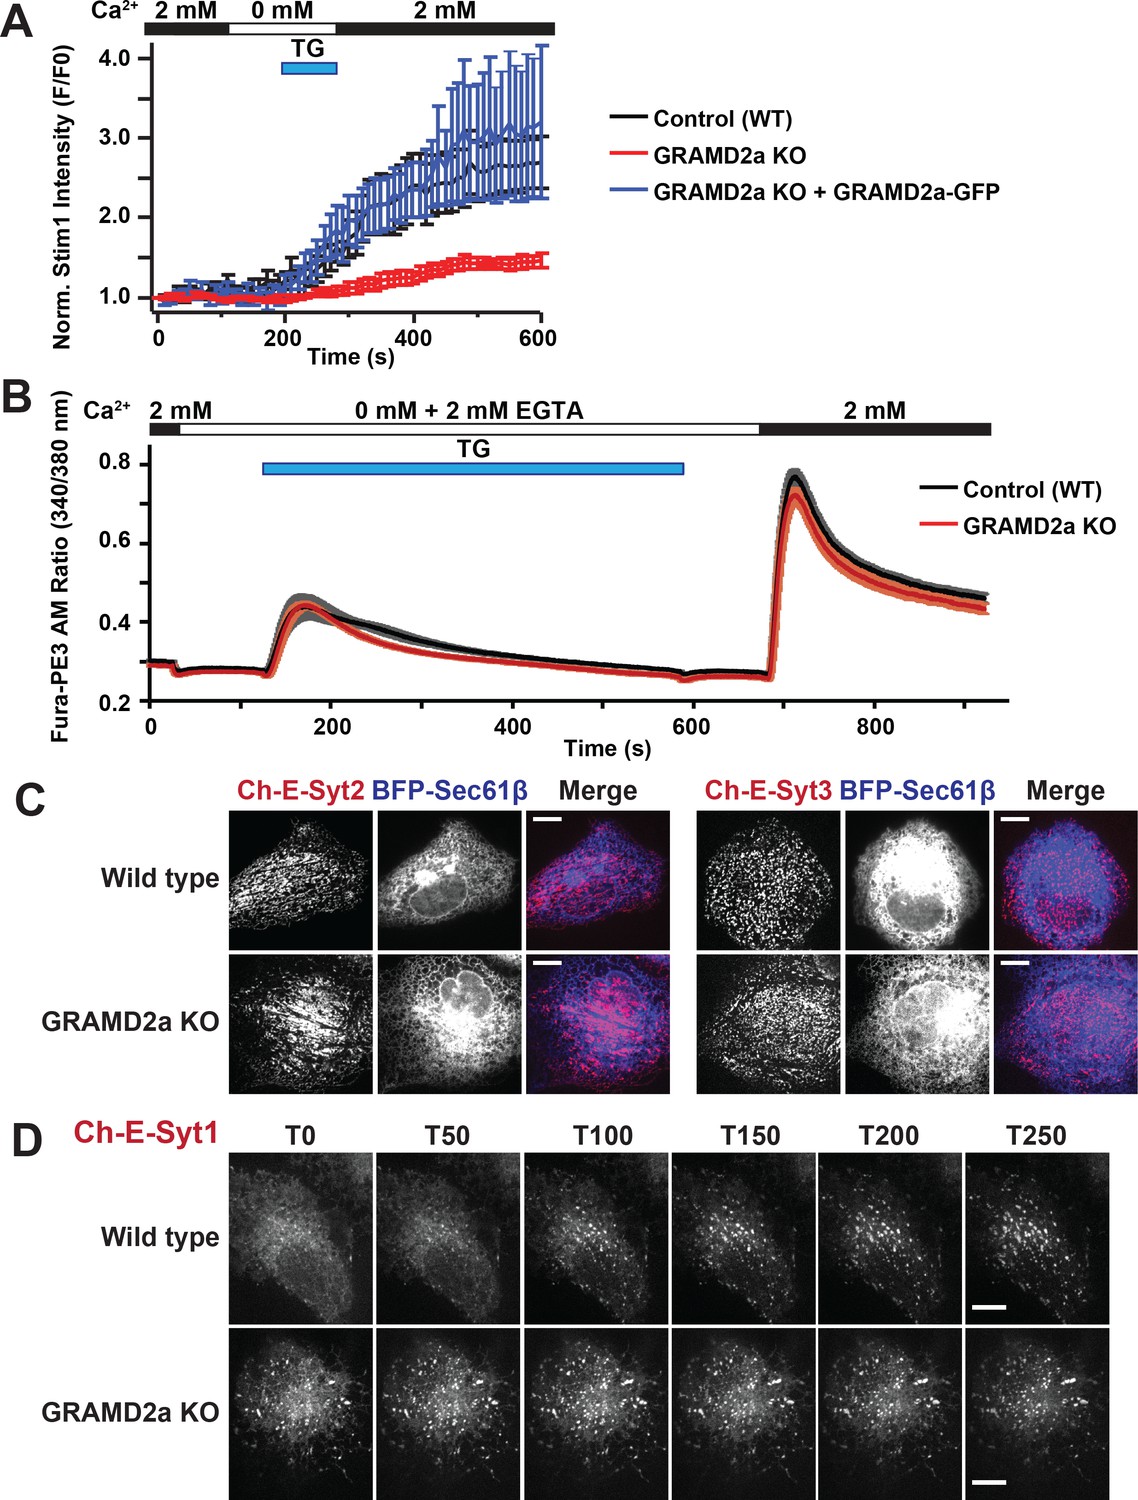
GRAMD2a organizes ER-PM domains that selectively function in calcium homeostasis.
(A) Kinetics and intensity of mCherry-STIM1 recruitment to PM before, during, and after 1 uM TG treatment in wildtype U2OS cells, GRAMD2a knock out (KO) cells, and GRAMD2a KO with GRAMD2a-eGFP transiently transfected. Standard Error is shown, p<0.05 between t = 200 and t-600. (B) Cytosolic Ca2+ measurement using ratiomentric dye, Fura-PE3 AM during a Ca2+ addback experiment with wild type U2OS cells and GRAMD2a KO cells. Cells were pre-loaded with 2.5 uM Fura-PE3 AM in 0 mM Ca2+ Ringers and ER stores were loaded in 2 mM Ca2+ Ringers for 4 min prior to recording. Fluorescence was continuously recorded as cells were incubated in the following solutions: (1) Baseline was established in 2 mM Ca2+ ringers for 40 s, (2) cells were washed with 0 mM Ca2+/2 mM EGTA Ringers for 100 s, 3) ER stores were emptied using 4 uM TG in 0 mM Ca2+/2 mM EGTA Ringers for 460 s, 4) cells were returned to with 0 mM Ca2+/2 mM EGTA Ringers for 100 s, (5) cells were washed in 2 mM Ca2+ ringers to observe SOCE across the PM. Comparison of the cytosolic Ca2+ measurements (represented as Fura-PE3 Am ratio) are shown over time. Black trace represented control or wild type U2OS cells; red trace represents GRAMD2a KO U2OS cells. Standard Error is shown, differences between wild type and GRAMD2a traces were not statistically significant as determined using student t-test. nine wild type dishes and 8 GRAMD2a KO dishes were imaged over 2 days. 20–50 cells per dish were imaged. (C) Localization of mCherry-E-Syt2 (left panel) or E-Syt3-mCherry (right panel) in wild type U2OS and GRAMD2a KO cells. (D) Behavior of mCherry-E-Syt1 at resting Ca2+ and upon TG-induced ER Ca2+ depletion. At T = 30 s, 1 μM TG was added. Top panels show mCherry-E-Syt1 dynamics in wild type U2OS cells and bottom panels show mCherry-E-Syt1 dynamics in GRAMD2a KO cells. For STIM1 and E-Syt1/2/3 experiments, fluorescence intensity dynamics were analyzed for at least 12 cells, where were imaged in biological duplicate.
Figure 7—figure supplement 1
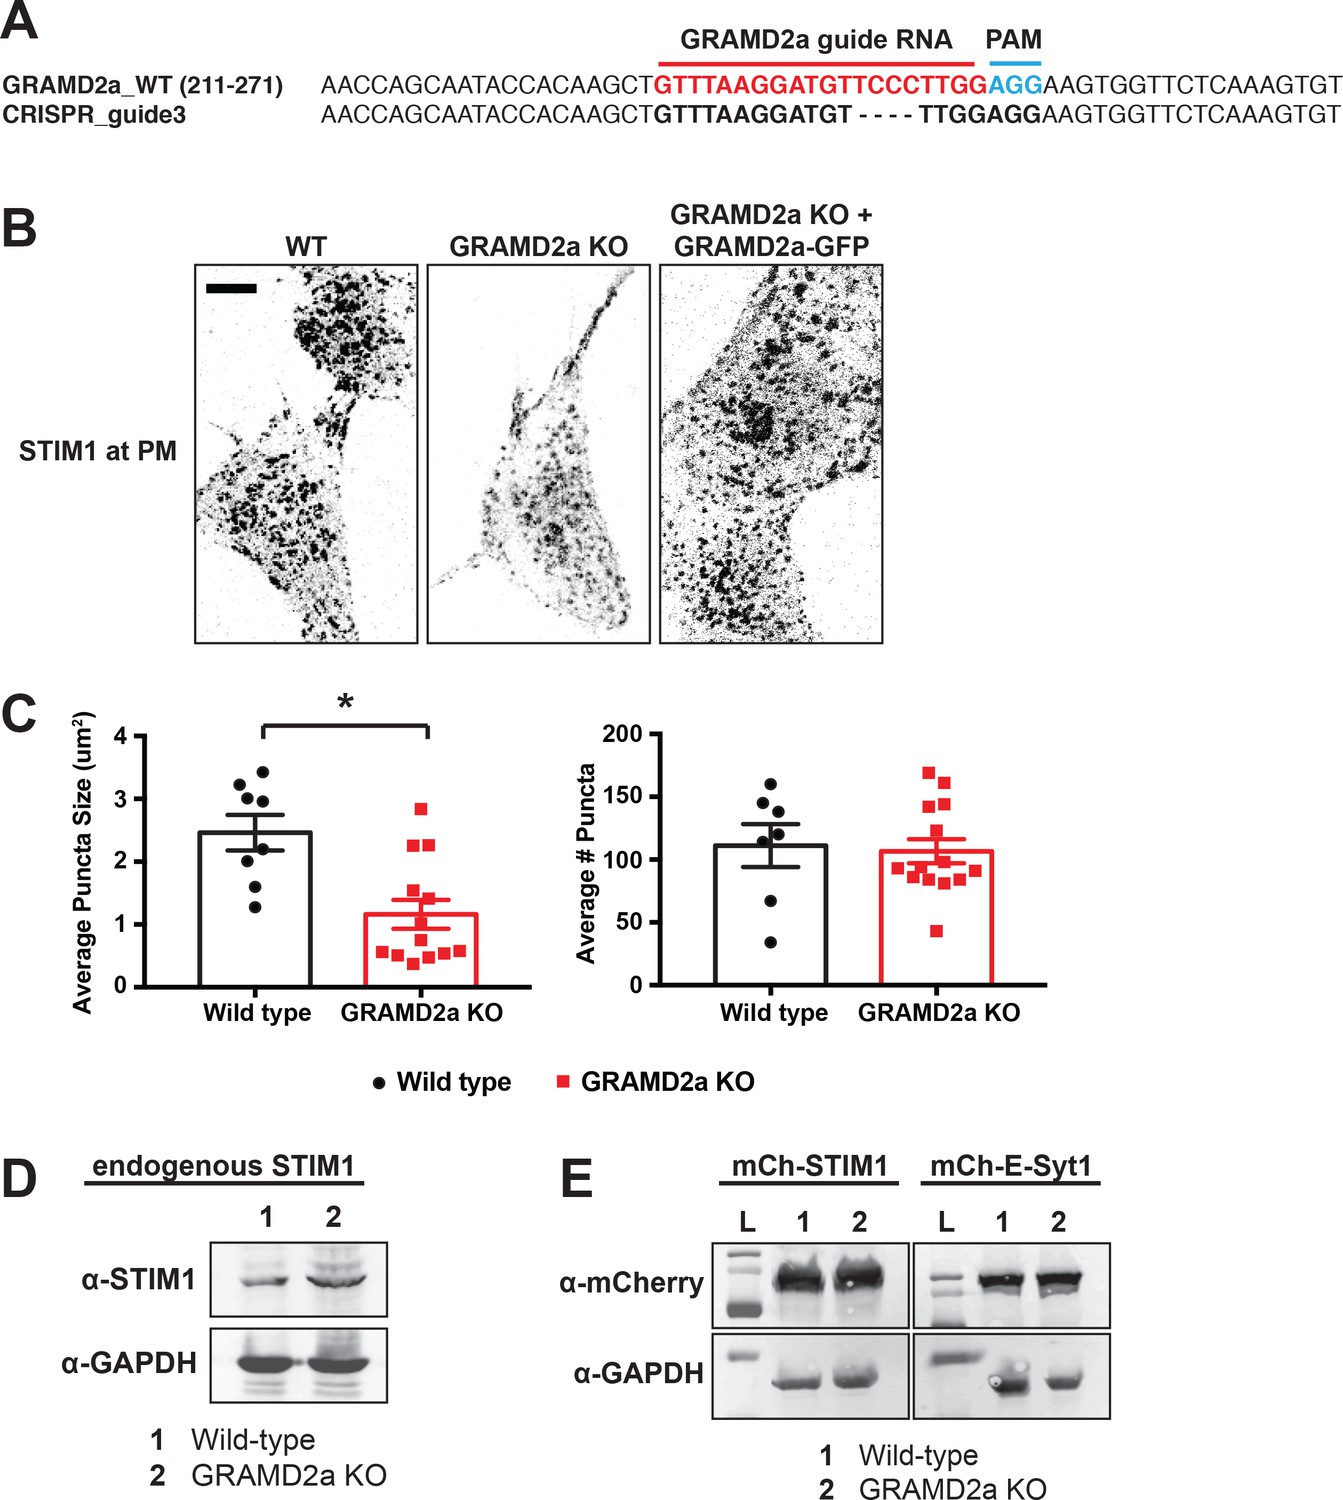
STIM1 recruitment is altered in GRAMD2a KO cells.
(A) Alignment of GRAMD2a CRISPR knock-out (KO) and wild type sequence. (B) Samples images of wildtype U2OS, GRAMD2a KO, and GRAMD2a KO with GRAMD2a-eGFP transiently transfected cells that were quantified in Figure 7A. Representative images shown from at least 12 cells that were obtained from two biological replicates. (C) Size and total number of mCherry-STIM1 puncta in wild type and GRAMD2a KO cells. Standard Error shown, *p<10−2 and from two-tailed t-test. Specifically, puncta size p=2.2 × 10⁻³. (D) Western Blot analysis of endogenous STIM1 protein levels in wild type U2OS cells and GRAMD2a KO cells. α-GAPDH is loading control. Three biological triplicates of western blot analysis were performed. (E) Western Blot analysis of mCherry-STIM1 and mCherry-E-Syt1 protein levels in wild type U2OS cells and GRAMD2a KO cells. α-GAPDH is loading control. Three biological triplicates of western blot analysis were performed. (F) TIRF imaging of BFP-Sec61β and lyn-mCherry in WT U2OS cells and GRAMD2a KO cells. Total pixels of cortical ER were divided by total area of cells, judged by total staining of lyn-mCherry, to determine % cortical ER at PM. Standard Error shown. (G) PM PI(4,5)P2 distribution was examined using YFP-PH-PLCδ1 in U2OS wild type and GRAMD2a KO cells. Sample images are in shown in left panel. Line scans are shown in middle panel. Y-axis of line scans are arbitrary fluorescence units. % intensity of YFP-PH-PLCδ1 at PM is shown in right panel. (H) Distribution of cholesterol marker mCherry-D4H in wild type U2OS and GRAMD2a KO cells. Line scans are shown in bottom panel. Y-axis of line scans are arbitrary fluorescence units. (I) Distribution of cholesterol-binding protein Cav1-GFP in wild type U2OS and GRAMD2a KO cells. Both PM (cell surface) and internal (cross-section) planes are shown. (J) mCherry-E-Syt1 distribution in three additional representative wild type U2OS cells and GRAMD2a KO cells at T = 0 (pre-TG treatment) and T = 250 (220 sec after TG treatment). (K) mCherry-E-Syt1 distribution in wild type U2OS and GRAMD2a KO cells after incubation in 20 min 2 mM EGTA Ringers to ensure chelation of all external Ca2+. Representative images shown from at least 12 cells that were obtained from two biological replicates.
Figure 7—figure supplement 2
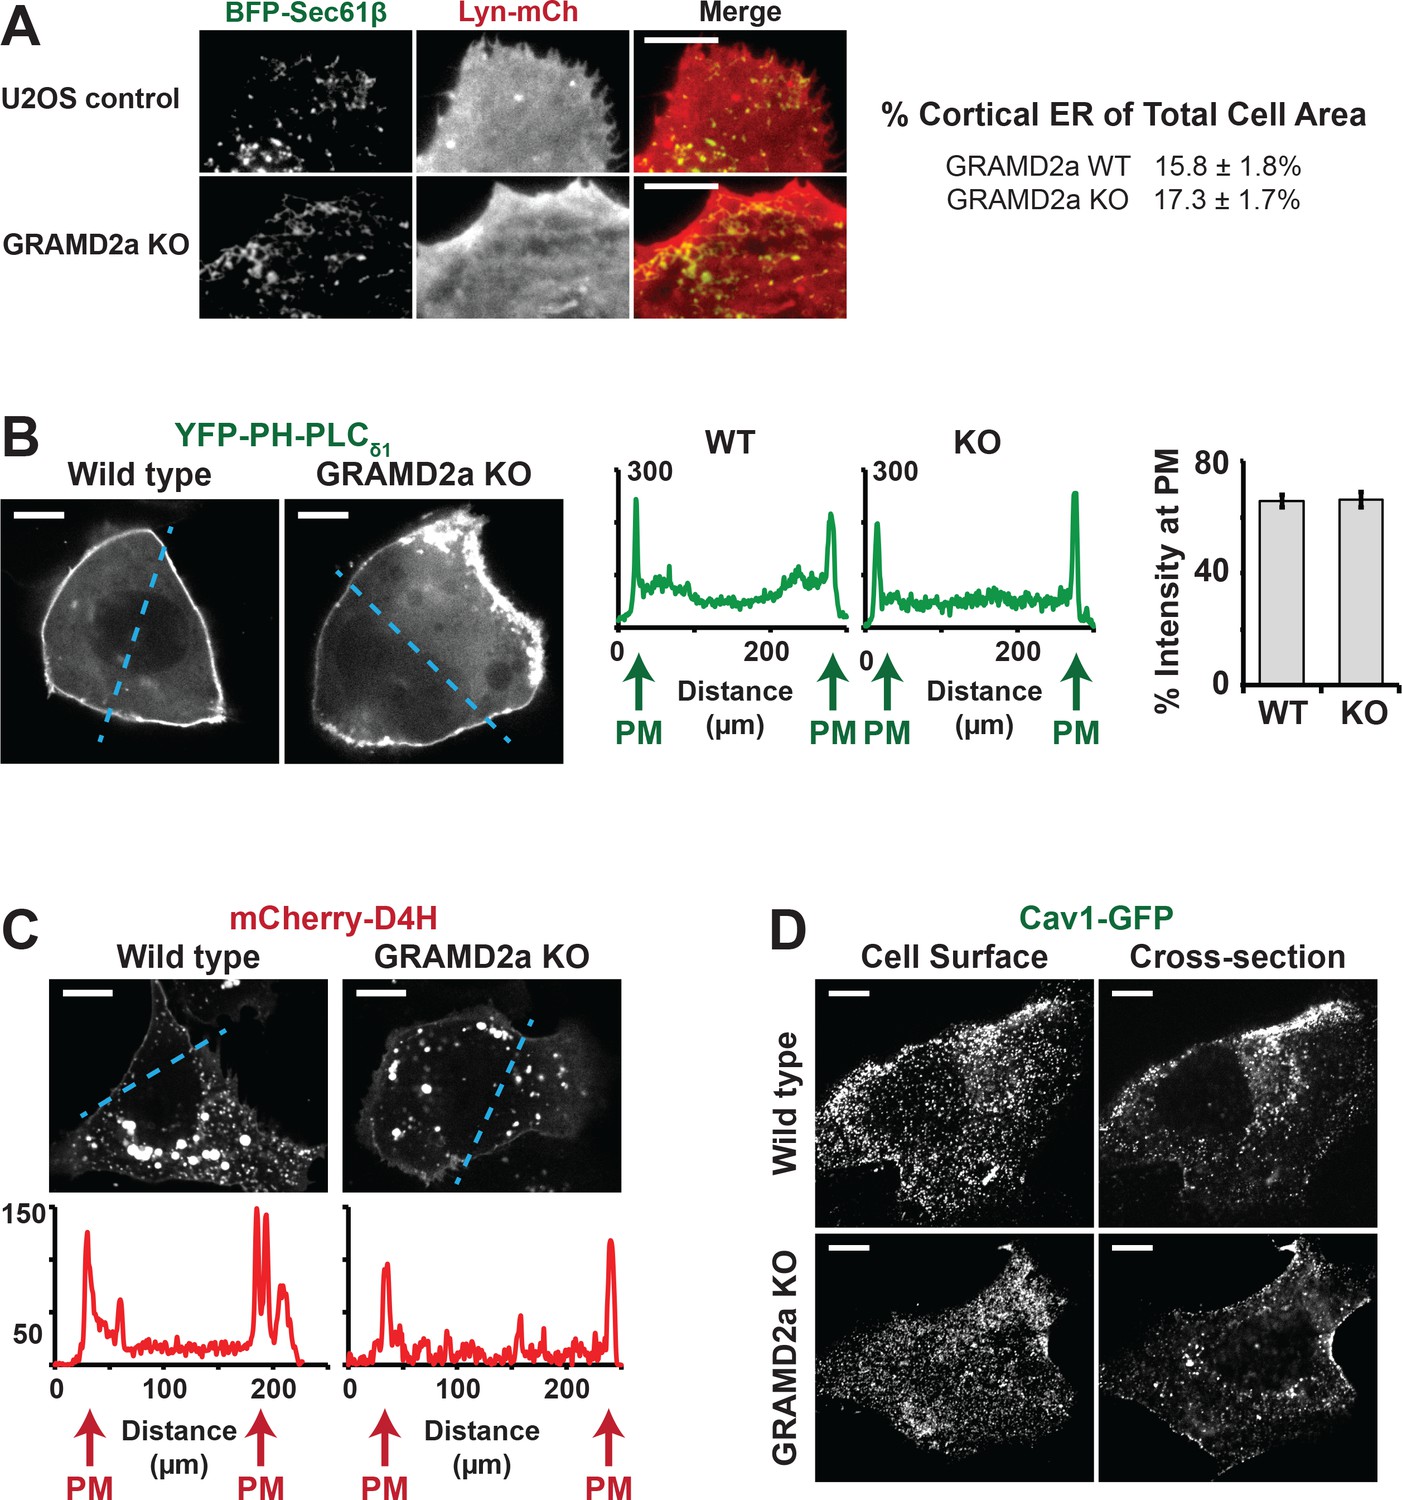
PM PI(4,5)P2, cholesterol and caveolin-1 are not apparently altered in GRAMD2a KO cells.
(A) TIRF imaging of BFP-Sec61β and lyn-mCherry in WT U2OS cells and GRAMD2a KO cells. Total pixels of cortical ER were divided by total area of cells, judged by total staining of lyn-mCherry, to determine % cortical ER at PM. Standard Error shown. (B) PM PI(4,5)P2 distribution was examined using YFP-PH- PLCδ1 in U2OS wild type and GRAMD2a KO cells. Sample images are in shown in left panel. Line scans are shown in middle panel. Y-axis of line scans are arbitrary fluorescence units. % intensity of YFP- PH-PLCδ1 at PM is shown in right panel. (C) Distribution of cholesterol marker mCherry- D4H in wild type U2OS and GRAMD2a KO cells. Line scans are shown in bottom panel. Y-axis of line scans are arbitrary fluorescence units. (D) Distribution of cholesterol- binding protein Cav1-GFP in wild type U2OS and GRAMD2a KO cells. Both PM (cell surface) and internal (cross-section) planes are shown.
Figure 7—figure supplement 3
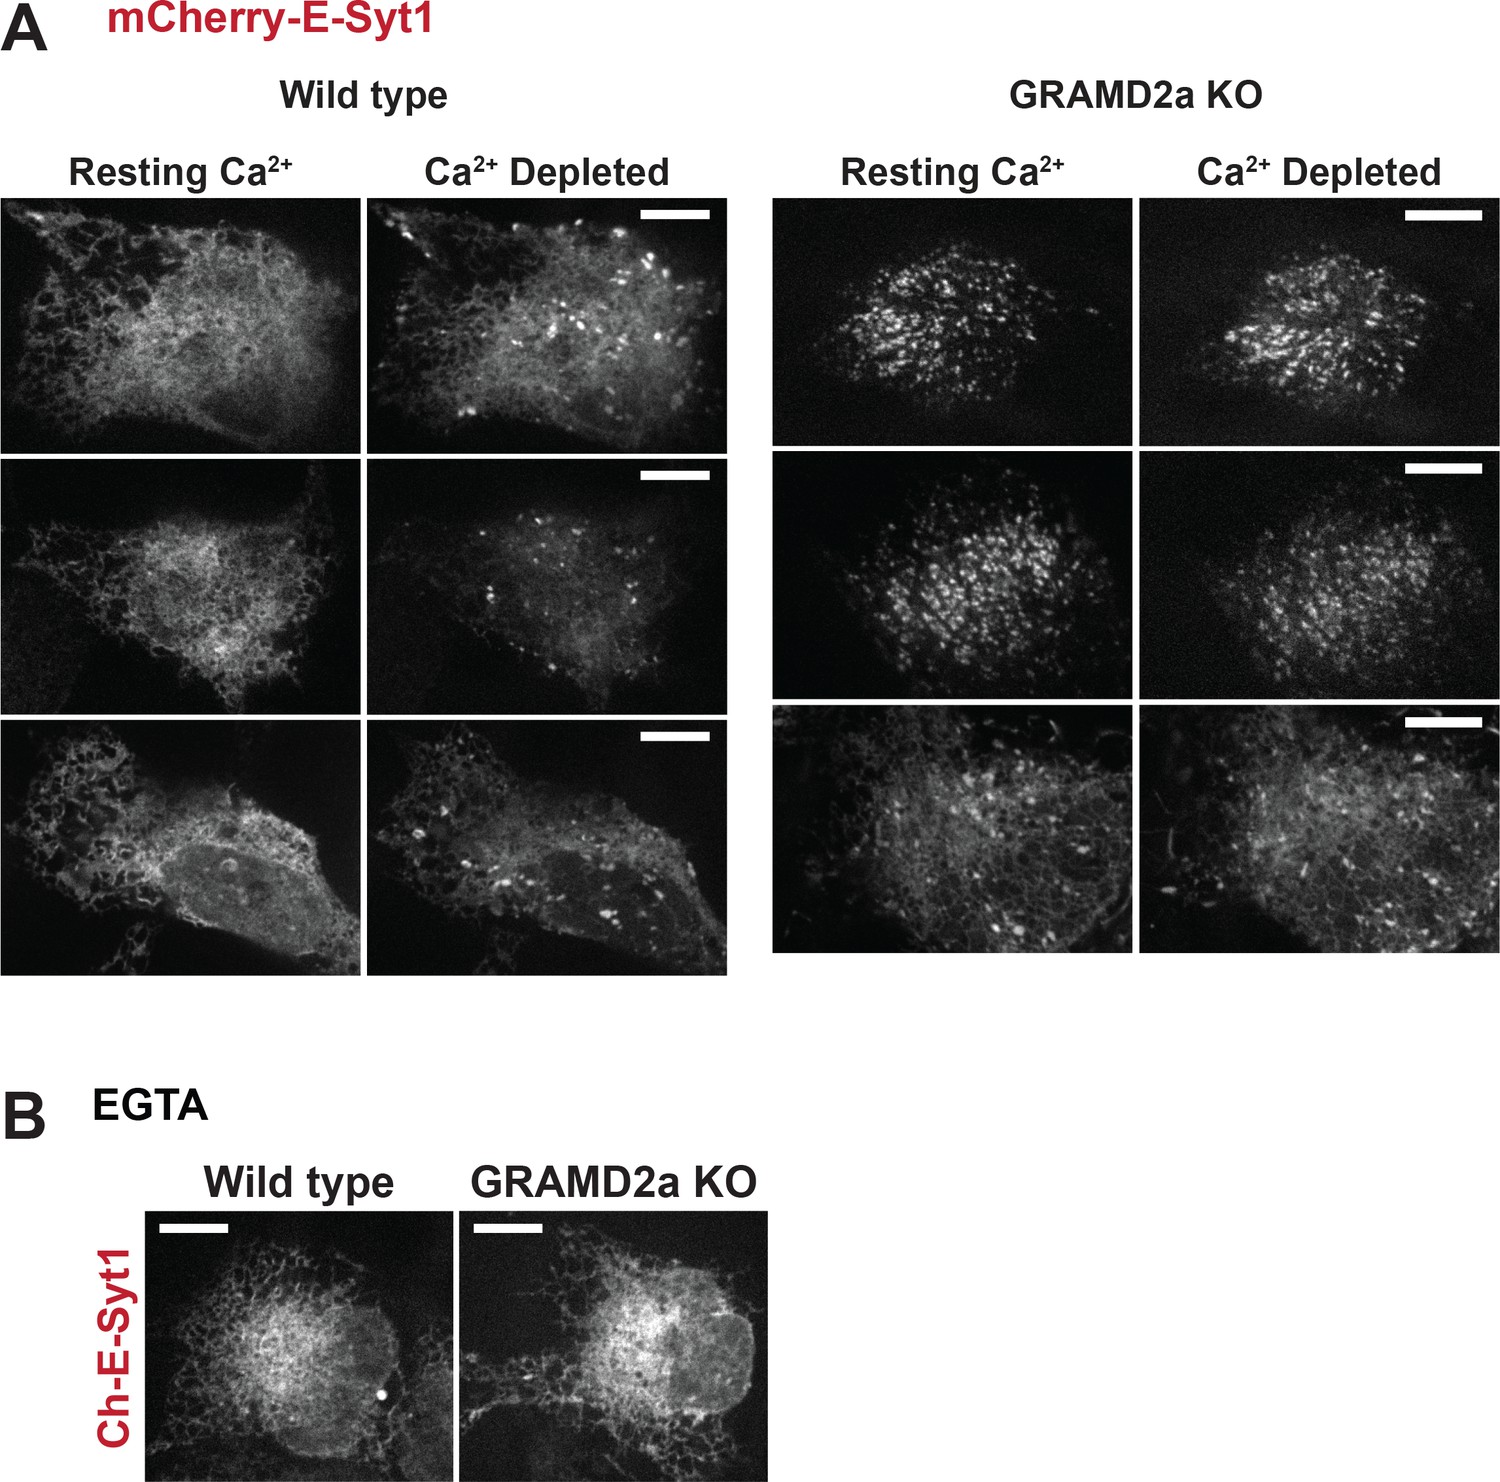
E-Syt1 localization is altered in GRAMD2a KO cells.
(A) mCherry-E- Syt1 distribution in three additional representative wild type U2OS cells and GRAMD2a KO cells at T=0 (pre-TG treatment) and T=250 (220 sec after TG treatment). (B) mCherry-E- Syt1 distribution in wild type U2OS and GRAMD2a KO cells after incubation in 20 min 2mM EGTA Ringers to ensure chelation of all external Ca2+. Representative images shown from at least 12 cells that were obtained from two biological replicates.
Figure 8 with 1 supplement
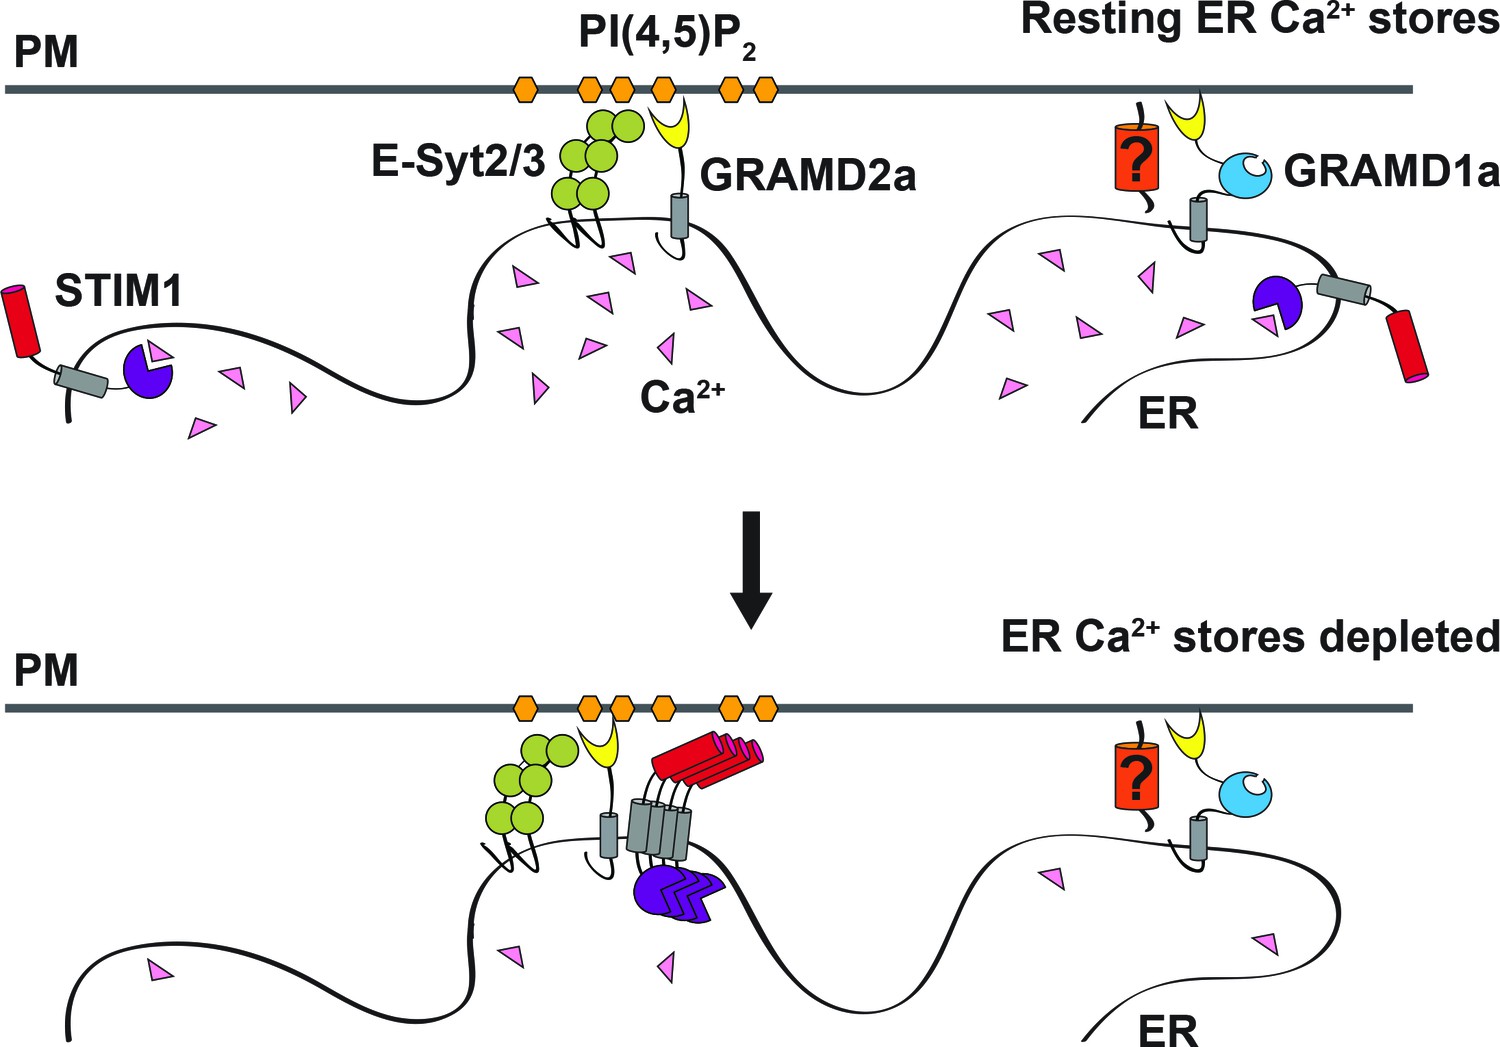
Model of GRAMD2a function.
GRAMD2a is a constitutive PI(4,5)P2-dependent ER-PM tether that localizes to a subset of E-Syt2/3 contacts. GRAMD1a marks distinct ER-PM contacts in a PI(4,5)P2-independent manner. GRAMD2a pre-marks ER-PM contacts destined for SOCE and facilitates, STIM1 recruitment during SOCE.
Figure 8—figure supplement 1
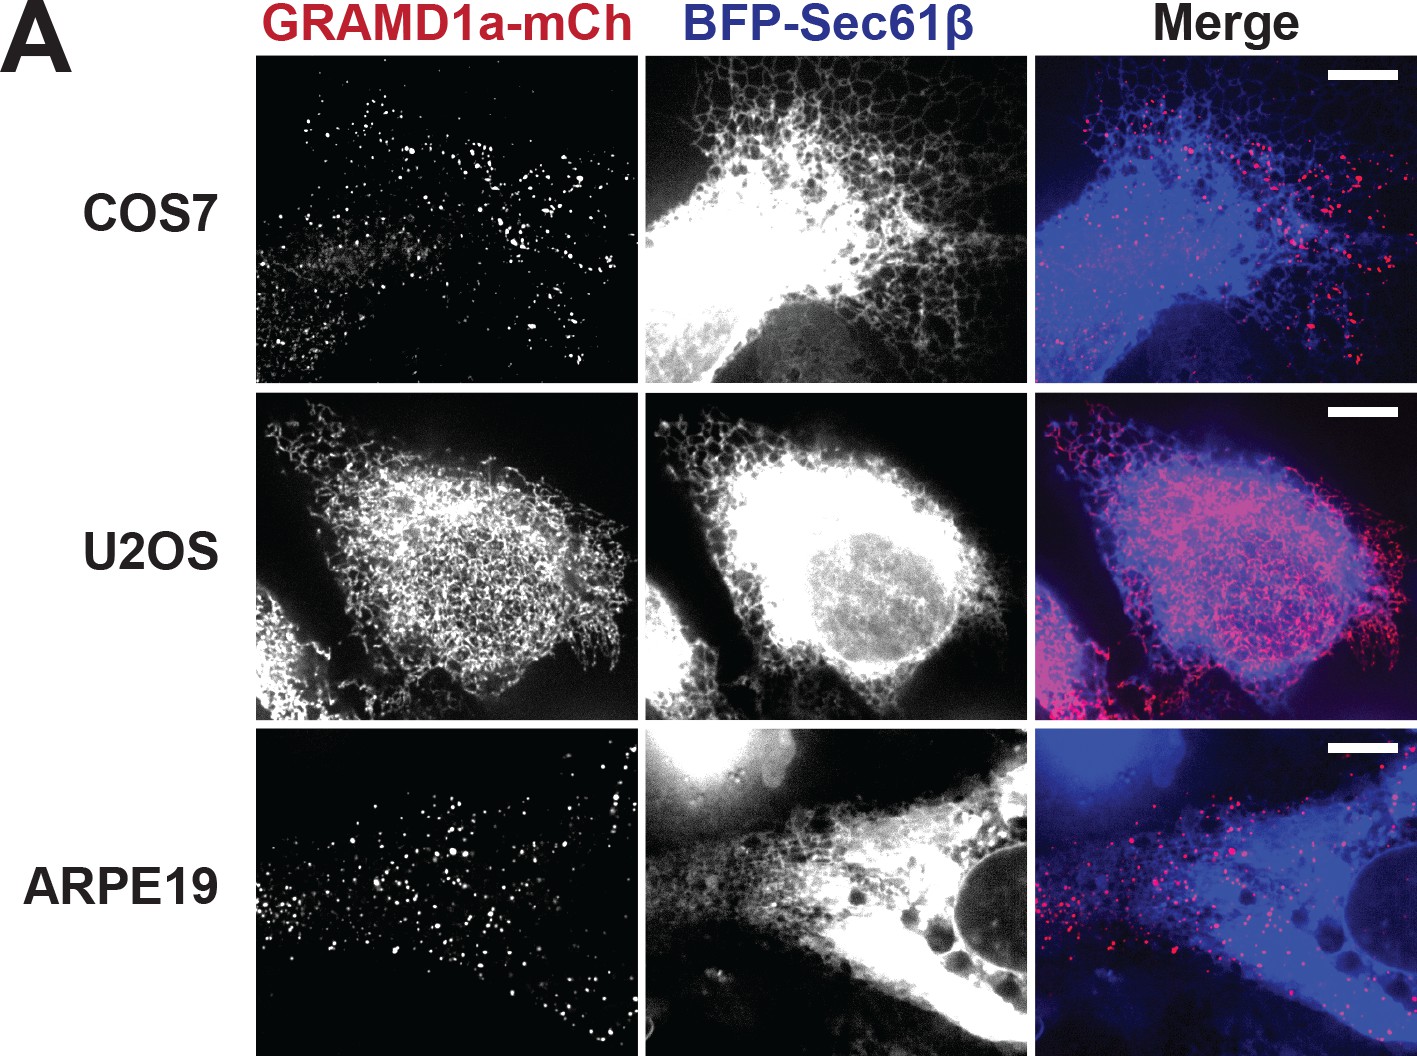
GRAMD1a localization is cell line dependent.
(A) Localization of GRAMD1a-eGFP in COS7, U2OS, and Arpe19 cells relative to ER-marker BFP-Sec61β. Representative images shown from at least 10 cells that were obtained from three biological replicates.
Tables
Key resources table
| Reagent type (species) or resource | Designation | Source or reference | Identifiers |
|---|---|---|---|
| 6s-His Tag monoclonal antibody | Western Blot antibody | ThermoFisher (His.H8) | RRID:AB_557403 |
| STIM1 monoclonal antibody | Western Blot antibody | ThermoFisher (CDN3H4) | RRID:AB_2197884 |
| GAPDH polyclonal antibody | Western Blot antibody | SigmaAldrich (G9545) | RRID:AB_796208 |
| anti-mCherry polyclonal antibody | Western Blot antibody | ThermoFisher (PA5-34974) | RRID:AB_2552323 |
| Goat anti-mouse or anti-rabbit antibodies | Western Blot antibody (DyLight 800 and DyLight 680) | ThermoFisher | |
| Oxotremorine M | Non-selective muscarinic acetylcholine receptor agonist | SigmaAldrich | |
| Thapsigargin | Non-competative SERCA inhibitor | Invitrogen/Life-technologies | |
| Fura-PE3 AM | Ratiometric cytosolic calcium indicator | Teflabs | |
| Lipofectamine2000 | Tissue culture transfection reagent | ThermoFisher | |
| Lipids | All lipids used for liposome binding assays | Avanti Lipids | |
| COS7 cells | Cercopithecus aethiops kidney cell line | G. Voeltz (U of Colorado, Boulder) | RRID:CVCL_0224 |
| U2OS cells | Human bone osteosarcoma epithelial cell line | G. Voeltz (U of Colorado, Boulder) | RRID:CVCL_0042 |
| HeLa cells | Homo sapiens cervix adenocarcinoma cell line | P. De Camilli (Yale U) | RRID:CVCL_0058 |
| ARPE19 cells | Human retinal pigment epithelial cell line | ATCC (CRL-2302) | RRID:CVCL_0145 |
| HEK293 cells | Homo sapiens embryonic kidney cell line | E. J. Dickson collection | RRID:CVCL_0045 |
| Fiji (ImageJ) software | Software used to analyse all microscopy images | ImageJ | RRID:SCR_002285 |
| ImageStudioLight | Software used to analyse all Western Blots | LI-COR BioSciences | RRID:SCR_014211 |
| Mega7 | Software used to analyse all Western Blots | MEGA Software |
Additional files
-
Transparent reporting form
- https://doi.org/10.7554/eLife.31019.031
Download links
A two-part list of links to download the article, or parts of the article, in various formats.
Downloads (link to download the article as PDF)
Open citations (links to open the citations from this article in various online reference manager services)
Cite this article (links to download the citations from this article in formats compatible with various reference manager tools)
GRAM domain proteins specialize functionally distinct ER-PM contact sites in human cells
eLife 7:e31019.
https://doi.org/10.7554/eLife.31019


