NuRD and CAF-1-mediated silencing of the D4Z4 array is modulated by DUX4-induced MBD3L proteins
- Fred Hutchinson Cancer Research Center, United States
- University of Washington, United States
- University of Rochester Medical Center, United States
- Leiden University Medical Center, Netherlands
Figures
Figure 1 with 1 supplement
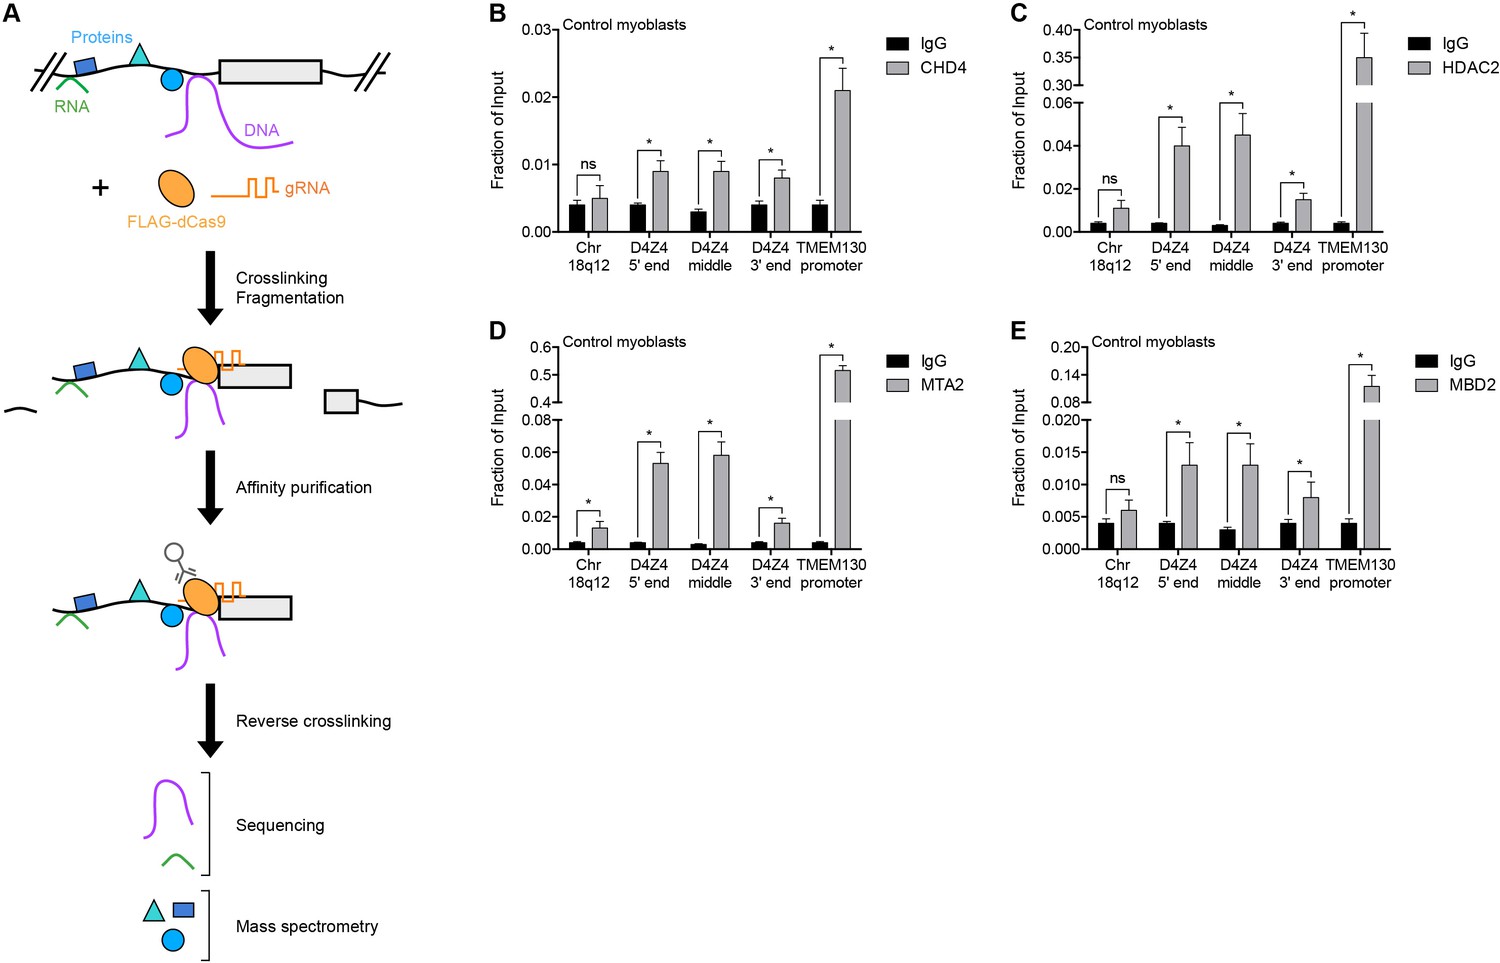
NuRD complex components bind the D4Z4 macrosatellite repeat.
(A) Schematic summary of the enChIP procedure. A 3xFLAG-dCas9-HA-2xNLS fusion protein (FLAG-dCas9) consisting of an N-terminal triple FLAG (3xFLAG) epitope tag, catalytically inactive Cas9 endonuclease (dCas9), C-terminal human influenza hemagglutinin (HA) epitope tag and tandem nuclear localization signal (2xNLS) is expressed with one or more guide RNA (gRNA) in an appropriate cell context. Cells are crosslinked, chromatin is fragmented and complexes containing FLAG-dCas9 are immunoprecipitated with an anti-FLAG antibody. After reversing the crosslinks, molecules associated with the targeted genomic region are purified and identified by downstream analyses including mass spectrometry and next-generation sequencing. Adapted from Fujita et al. (2016). (B–E) ChIP-qPCR enrichment of NuRD complex components CHD4 (B), HDAC2 (C), MTA2 (D) and MBD2 (E) along the D4Z4 repeat in MB2401 control myoblasts. The Chr18q12 amplicon contains no CpG dinucleotides and serves as a negative control site, while the TMEM130 promoter is occupied by NuRD complex components in published ENCODE datasets (ENCODE Project Consortium, 2012) and functions as a positive control locus. Error bars denote the standard deviation from the mean of three biological replicates. Statistical significance was calculated by comparing the specific pulldown to the IgG control at each site using a two-tailed, two-sample Mann-Whitney U test. *, p≤0.05; ns, not significant, p>0.05. See also Figure 1—source data 1.
-
Figure 1—source data 1
Source data for Figure 1.
This file contains the source data used to make the graphs presented in Figure 1 and Figure 1—figure supplement 1. GraphPad Prism was utilized to visually represent the quantitative data.
- https://doi.org/10.7554/eLife.31023.005
Figure 1—figure supplement 1
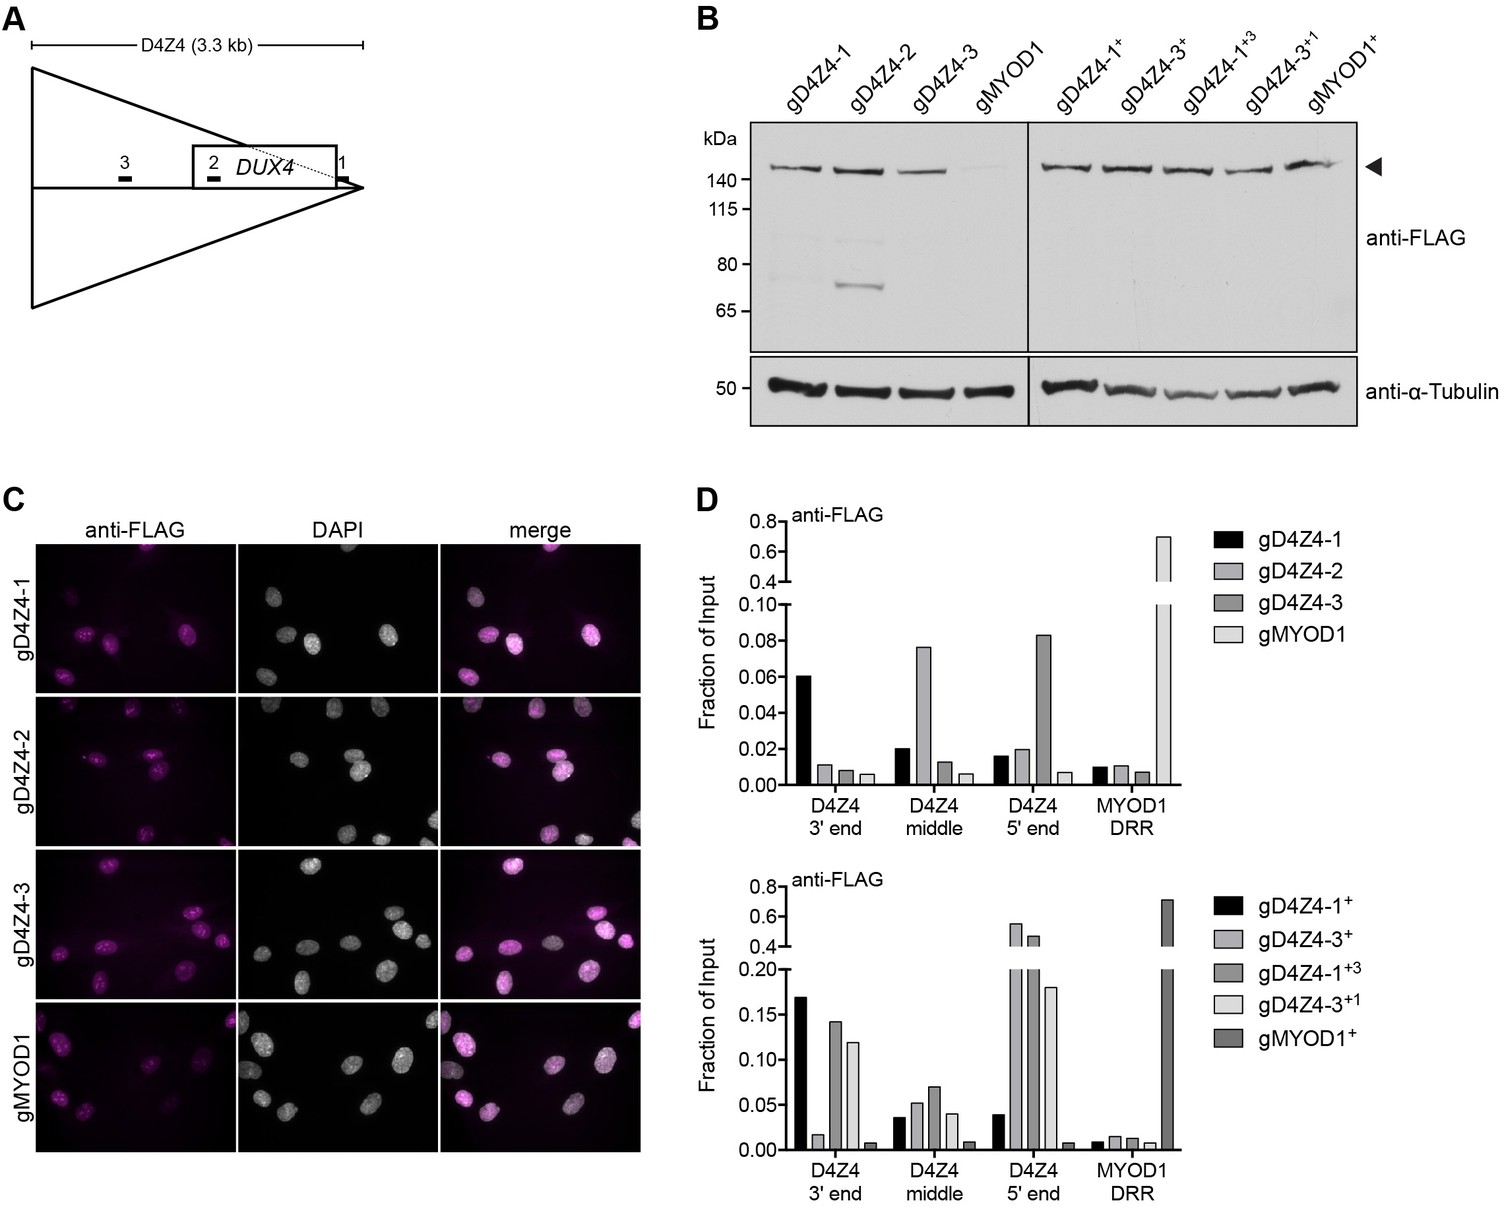
Validation of myoblast cell lines used for enChIP-MS.
(A) Diagram showing the location of the three gRNAs targeting the D4Z4 unit and their relationship to the DUX4 open-reading frame. 1, gD4Z4-1; 2, gD4Z4-2; 3, gD4Z4-3. (B–D) MB135 control myoblasts stably expressing FLAG-dCas9 together with gRNA targeting the D4Z4 repeat (gD4Z4-1, gD4Z4-2, gD4Z4-3) or the MYOD1 distal regulatory region (DRR) (gMYOD1) were examined for FLAG-dCas9 expression level by immunoblot (B), subcellular localization by immunofluorescence (C) and chromatin occupancy by enChIP-qPCR (D). A + indicates that existing cell lines were super-infected to enhance FLAG-dCas9 levels and/or to co-express two D4Z4 gRNAs. The arrowhead in (B) indicates the expected size of full-length FLAG-dCas9. See also Figure 1—source data 1.
Figure 2 with 6 supplements

The MBD2/NuRD complex represses the D4Z4 array.
(A) Schematic representation of the NuRD complex. Subunits colored darkest grey have the most lines of evidence linking them to DUX4 regulation (e.g. enChIP, siRNA and ChIP data), while more lightly colored subunits have progressively less experimental support. Adapted from Hota and Bruneau (2016). (B–J) DUX4 and DUX4 target gene expression as determined by RT-qPCR following control (CTRL), HDAC1/HDAC2 (B–D), CHD4 (E–G) or MBD2 (H–J) siRNA knockdown in MB2401 control (B,E,H), MB073 FSHD1 (C,F,I) or MB200 FSHD2 (D,G,J) myoblasts. Error bars denote the standard deviation from the mean of three biological replicates. Statistical significance was calculated by comparing the specific knockdown to the control knockdown for each gene using a two-tailed, two-sample Mann-Whitney U test. *, p≤0.05.See also Figure 2—source data 1.
-
Figure 2—source data 1
Source data for Figure 2.
This file contains the source data used to make the graphs presented in Figure 2 and Figure 2—figure supplements 1–6. GraphPad Prism was utilized to visually represent the quantitative data.
- https://doi.org/10.7554/eLife.31023.014
Figure 2—figure supplement 1
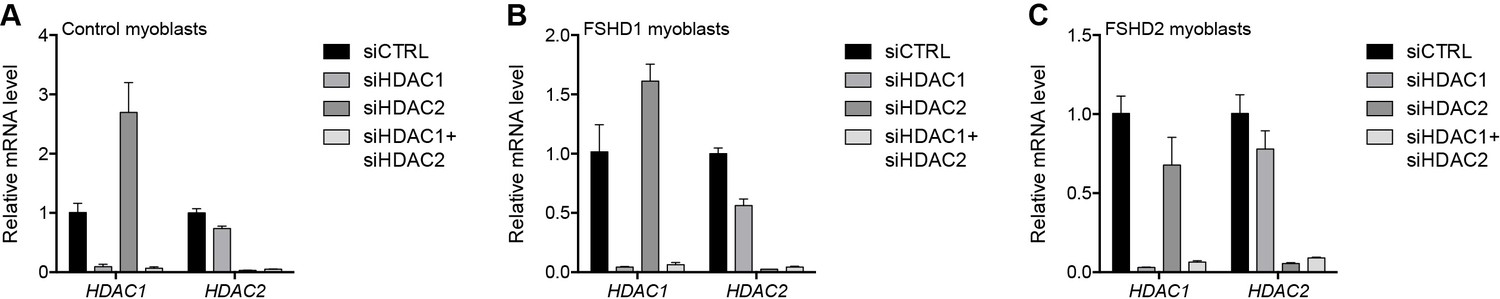
Validation of HDAC1 and HDAC2 knockdown.
(A–C) HDAC1 and HDAC2 gene expression as determined by RT-qPCR following control (CTRL), HDAC1, HDAC2 or simultaneous HDAC1/HDAC2 siRNA knockdown in MB2401 control (A), MB073 FSHD1 (B) or MB200 FSHD2 (C) myoblasts. Error bars denote the standard deviation from the mean of three biological replicates. See also Figure 2—source data 1.
Figure 2—figure supplement 2
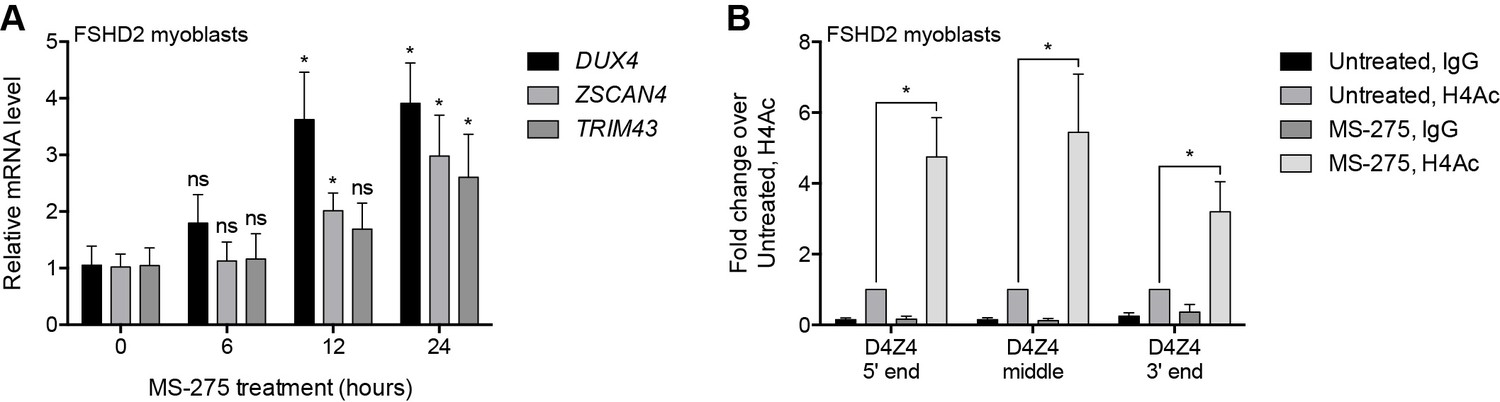
Pharmacological inhibition of HDAC1/HDAC2.
(A) DUX4 and DUX4 target gene expression as determined by RT-qPCR in MB200 FSHD2 myoblasts treated with 2.5 µM MS-275 for the indicated times. Statistical significance was calculated by comparing the mRNA level at each time point to that at 0 hr using a two-tailed, two-sample Mann-Whitney U test. (B) ChIP-qPCR enrichment of histone H4 acetylation (H4Ac) along the D4Z4 repeat in MB200 FSHD2 myoblasts treated with 2.5 µM MS-275 for 24 hr. Statistical significance was calculated by comparing the H4Ac signal in untreated versus MS-275-treated cells at each site using a one-tailed, one-sample Wilcoxon signed-rank test. *, p≤0.05; ns, not significant, p>0.05. Error bars denote the standard deviation from the mean of three (or six, for the 0 hr and 12 hr time points in (A)) biological replicates. See also Figure 2—source data 1.
Figure 2—figure supplement 3
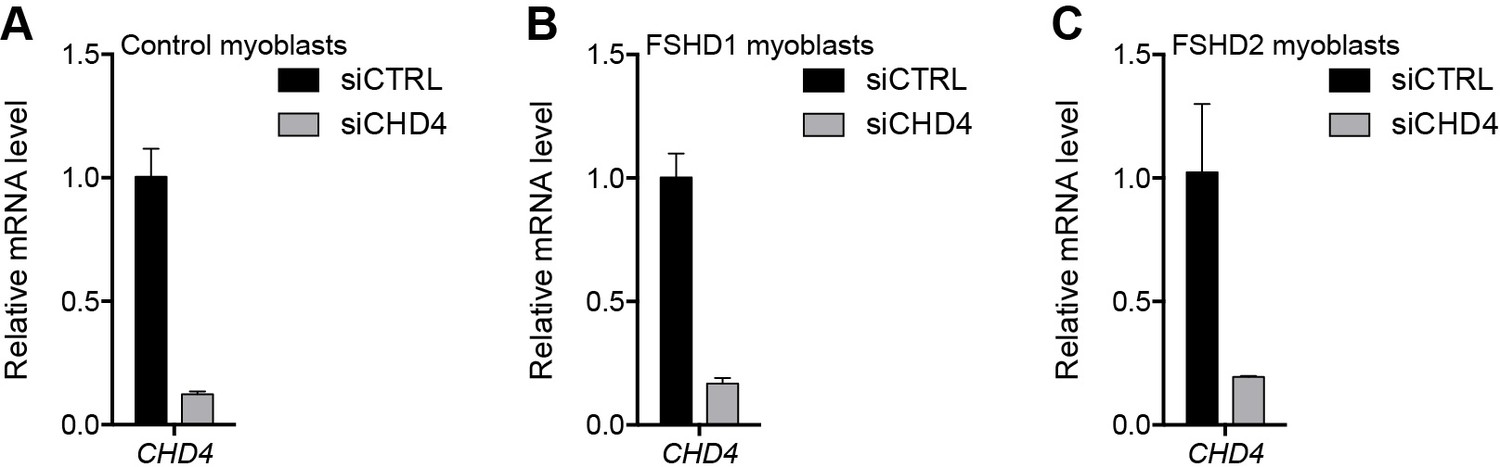
Validation of CHD4 knockdown.
(A–C) CHD4 gene expression as determined by RT-qPCR following control (CTRL) or CHD4 siRNA knockdown in MB2401 control (A), MB073 FSHD1 (B) or MB200 FSHD2 (C) myoblasts. Error bars denote the standard deviation from the mean of three biological replicates. See also Figure 2—source data 1.
Figure 2—figure supplement 4
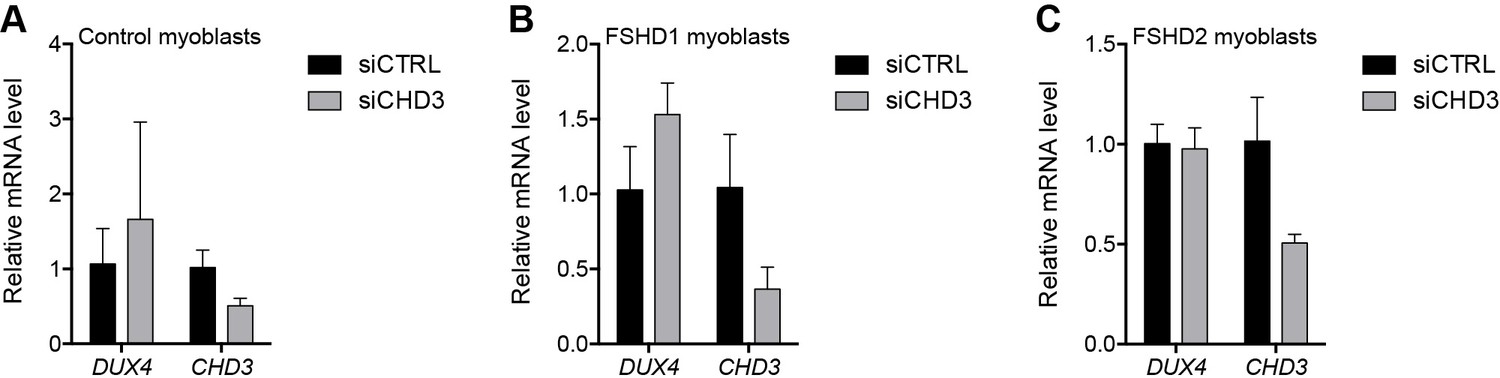
CHD3 depletion in control and FSHD myoblasts.
(A–C) DUX4 and CHD3 gene expression as determined by RT-qPCR following control (CTRL) or CHD3 siRNA knockdown in MB2401 control (A), MB073 FSHD1 (B) or MB200 FSHD2 (C) myoblasts. Error bars denote the standard deviation from the mean of three biological replicates. See also Figure 2—source data 1.
Figure 2—figure supplement 5
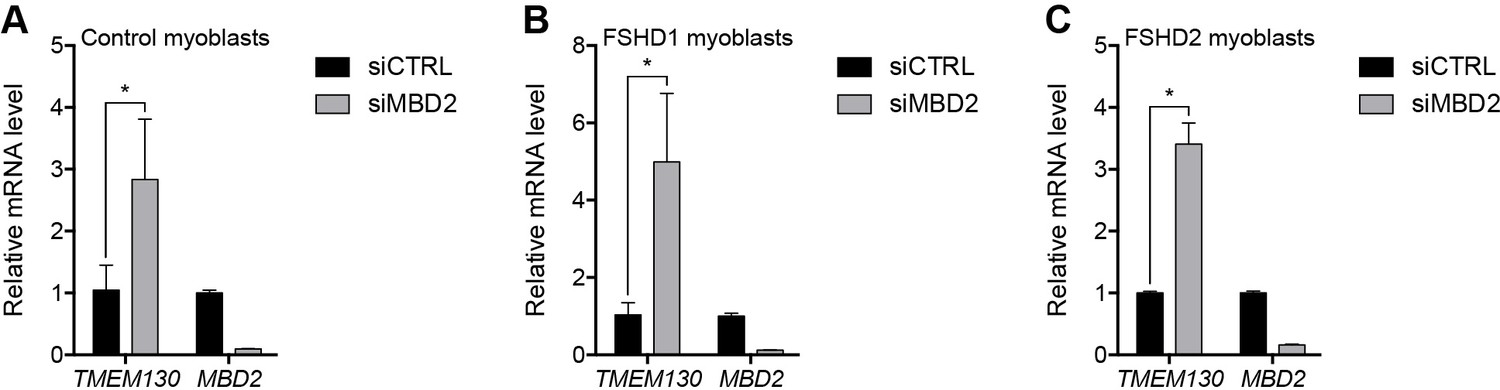
Validation of MBD2 knockdown.
(A–C) TMEM130 and MBD2 gene expression as determined by RT-qPCR following control (CTRL) or MBD2 siRNA knockdown in MB2401 control (A), MB073 FSHD1 (B) or MB200 FSHD2 (C) myoblasts. Error bars denote the standard deviation from the mean of three biological replicates. Statistical significance was calculated by comparing the specific knockdown to the control knockdown for each gene using a two-tailed, two-sample Mann-Whitney U test. *, p≤0.05. See also Figure 2—source data 1.
Figure 2—figure supplement 6
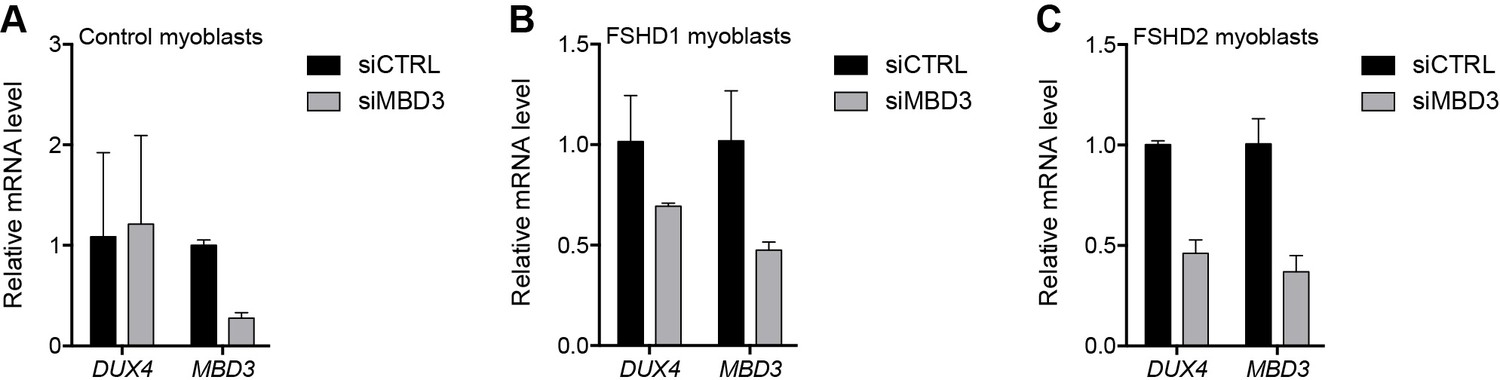
MBD3 depletion in control and FSHD myoblasts.
(A–C) DUX4 and MBD3 gene expression as determined by RT-qPCR following control (CTRL) or MBD3 siRNA knockdown in MB2401 control (A), MB073 FSHD1 (B) or MB200 FSHD2 (C) myoblasts. Error bars denote the standard deviation from the mean of three biological replicates. See also Figure 2—source data 1.
Figure 3 with 7 supplements

MBD1/CAF-1 components repress the D4Z4 array.
(A) Schematic representation of the CAF-1 complex, with shading as in Figure 2A. All subunits have one line of evidence linking them to DUX4 regulation. (B–J) DUX4 and DUX4 target gene expression as determined by RT-qPCR following control (CTRL), CHAF1A/CHAF1B (B–D), MBD1 (E–G) or CHAF1A/CHD4 (H–J) siRNA knockdown in MB2401 control (B,E,H), MB073 FSHD1 (C,F,I) or MB200 FSHD2 (D,G,J) myoblasts. Error bars denote the standard deviation from the mean of three biological replicates. See also Figure 3—source data 1.
-
Figure 3—source data 1
Source data for Figure 3.
This file contains the source data used to make the graphs presented in Figure 3 and Figure 3—figure supplements 1–7. GraphPad Prism was utilized to visually represent the quantitative data.
- https://doi.org/10.7554/eLife.31023.023
Figure 3—figure supplement 1

Validation of CHAFA1 and CHAF1B knockdown.
(A–C) CHAF1A and CHAF1B gene expression as determined by RT-qPCR following control (CTRL), CHAF1A or CHAF1B siRNA knockdown in MB2401 control (A), MB073 FSHD1 (B) or MB200 FSHD2 (C) myoblasts. Error bars denote the standard deviation from the mean of three biological replicates. See also Figure 3—source data 1.
Figure 3—figure supplement 2
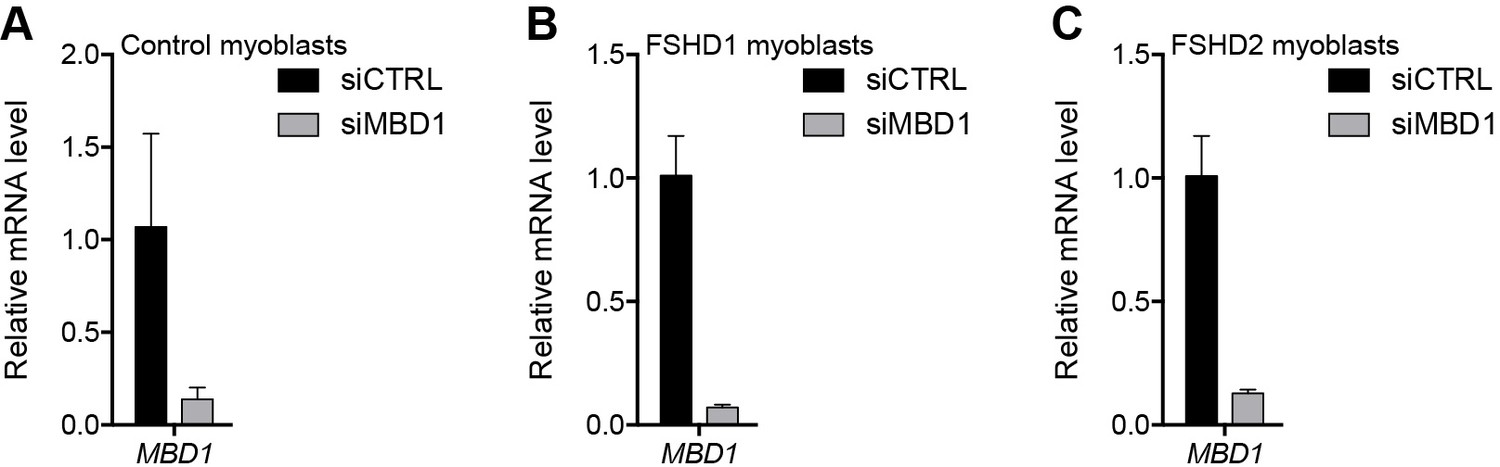
Validation of MBD1 knockdown.
(A–C) MBD1 gene expression as determined by RT-qPCR following control (CTRL) or MBD1 siRNA knockdown in MB2401 control (A), MB073 FSHD1 (B) or MB200 FSHD2 (C) myoblasts. Error bars denote the standard deviation from the mean of three biological replicates. See also Figure 3—source data 1.
Figure 3—figure supplement 3
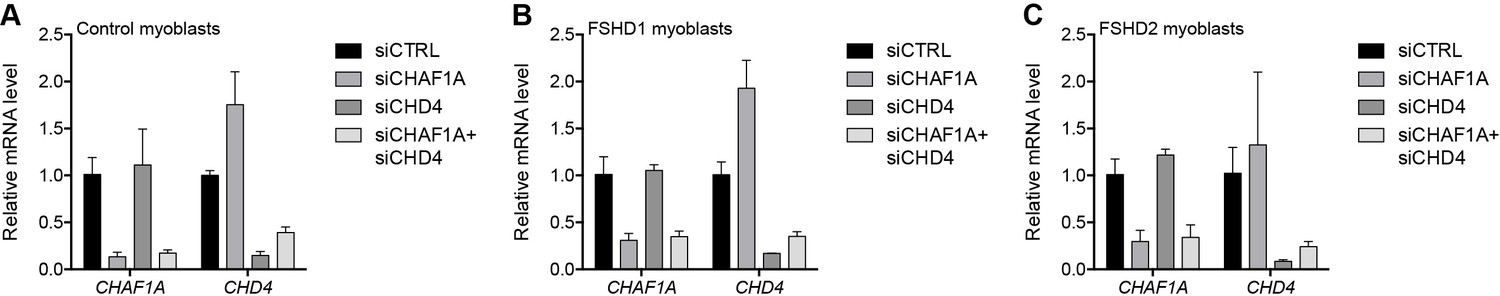
Validation of CHAFA1 and CHD4 knockdown.
(A–C) CHAF1A and CHD4 gene expression as determined by RT-qPCR following control (CTRL), CHAF1A, CHD4 or simultaneous CHAF1A/CHD4 siRNA knockdown in MB2401 control (A), MB073 FSHD1 (B) or MB200 FSHD2 (C) myoblasts. Error bars denote the standard deviation from the mean of three biological replicates. See also Figure 3—source data 1.
Figure 3—figure supplement 4
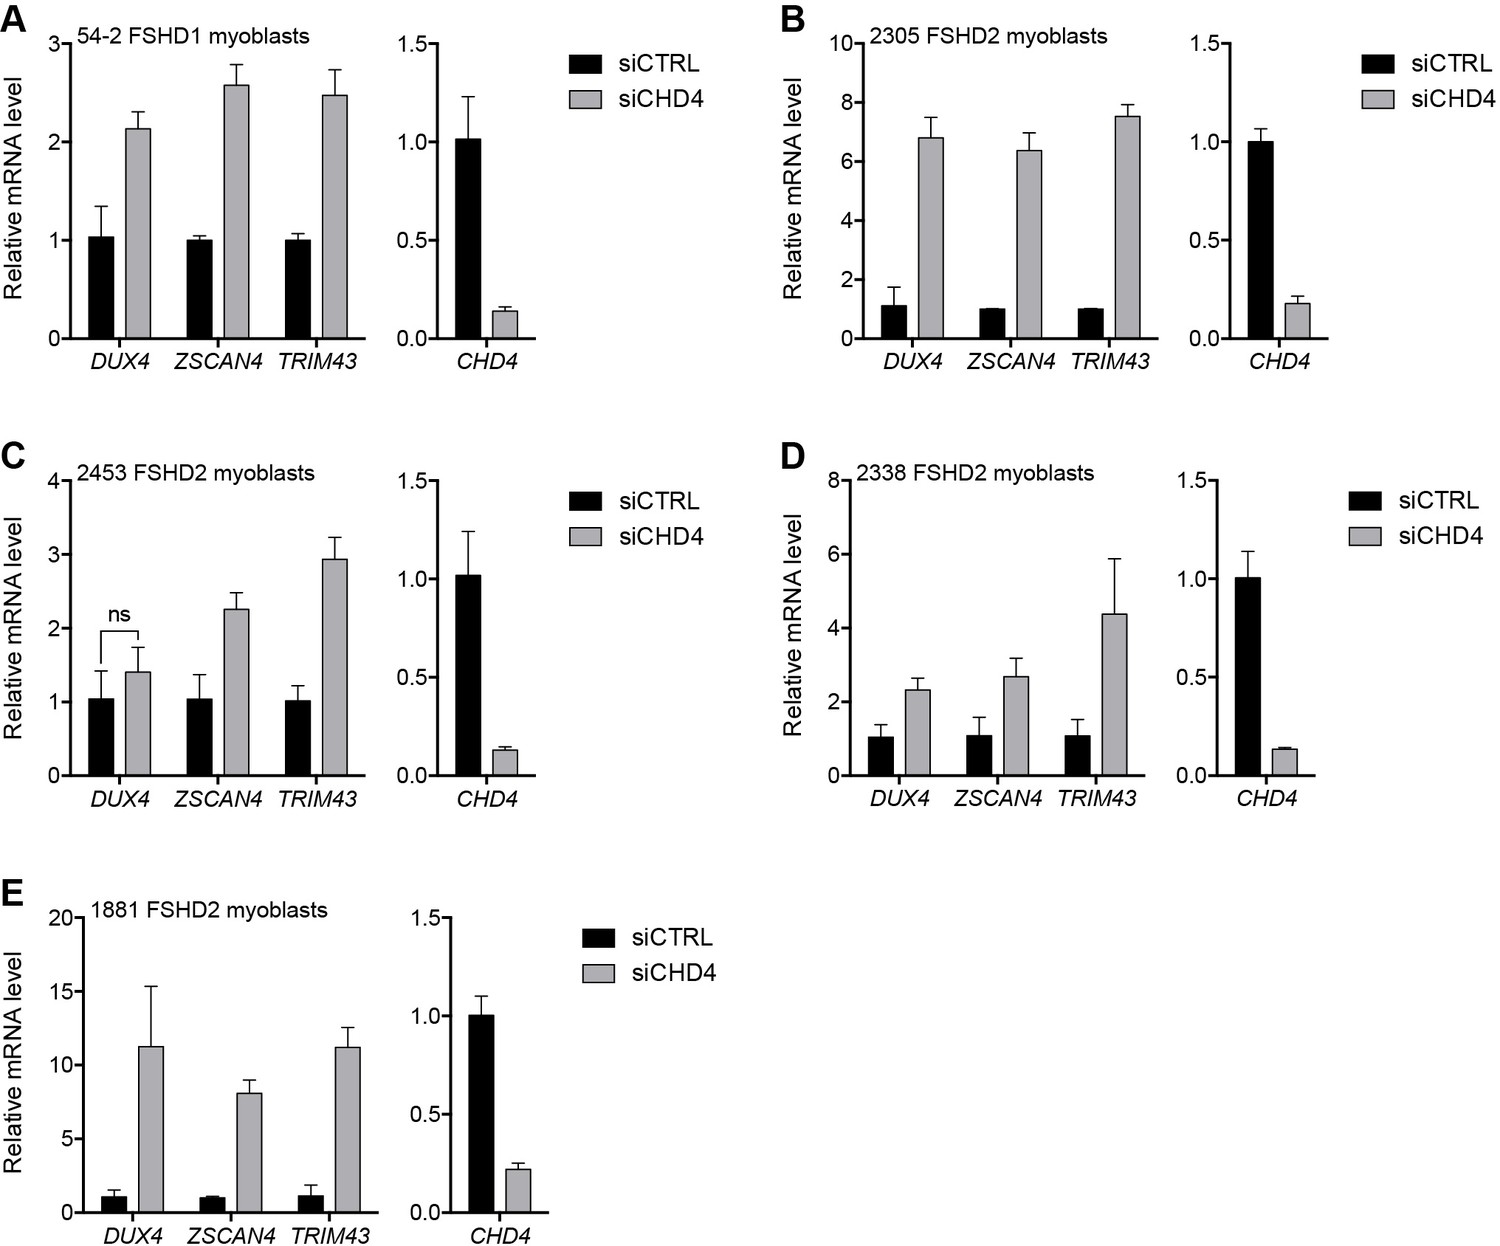
CHD4 depletion in additional FSHD cell lines.
(A–E) CHD4, DUX4, and DUX4 target gene expression as determined by RT-qPCR following control (CTRL) or CHD4 siRNA knockdown in 54–2 FSHD1 (A), 2305 FSHD2 (B), 2453 FSHD2 (C), 2338 FSHD2 (D) or 1881 FSHD2 (E) myoblasts. Error bars denote the standard deviation from the mean of three biological replicates. Statistical significance was calculated by comparing the specific knockdown to the control knockdown for each gene using a two-tailed, two-sample Mann-Whitney U test and p was ≤0.05 unless otherwise specified as not significant (ns). See also Figure 3—source data 1.
Figure 3—figure supplement 5
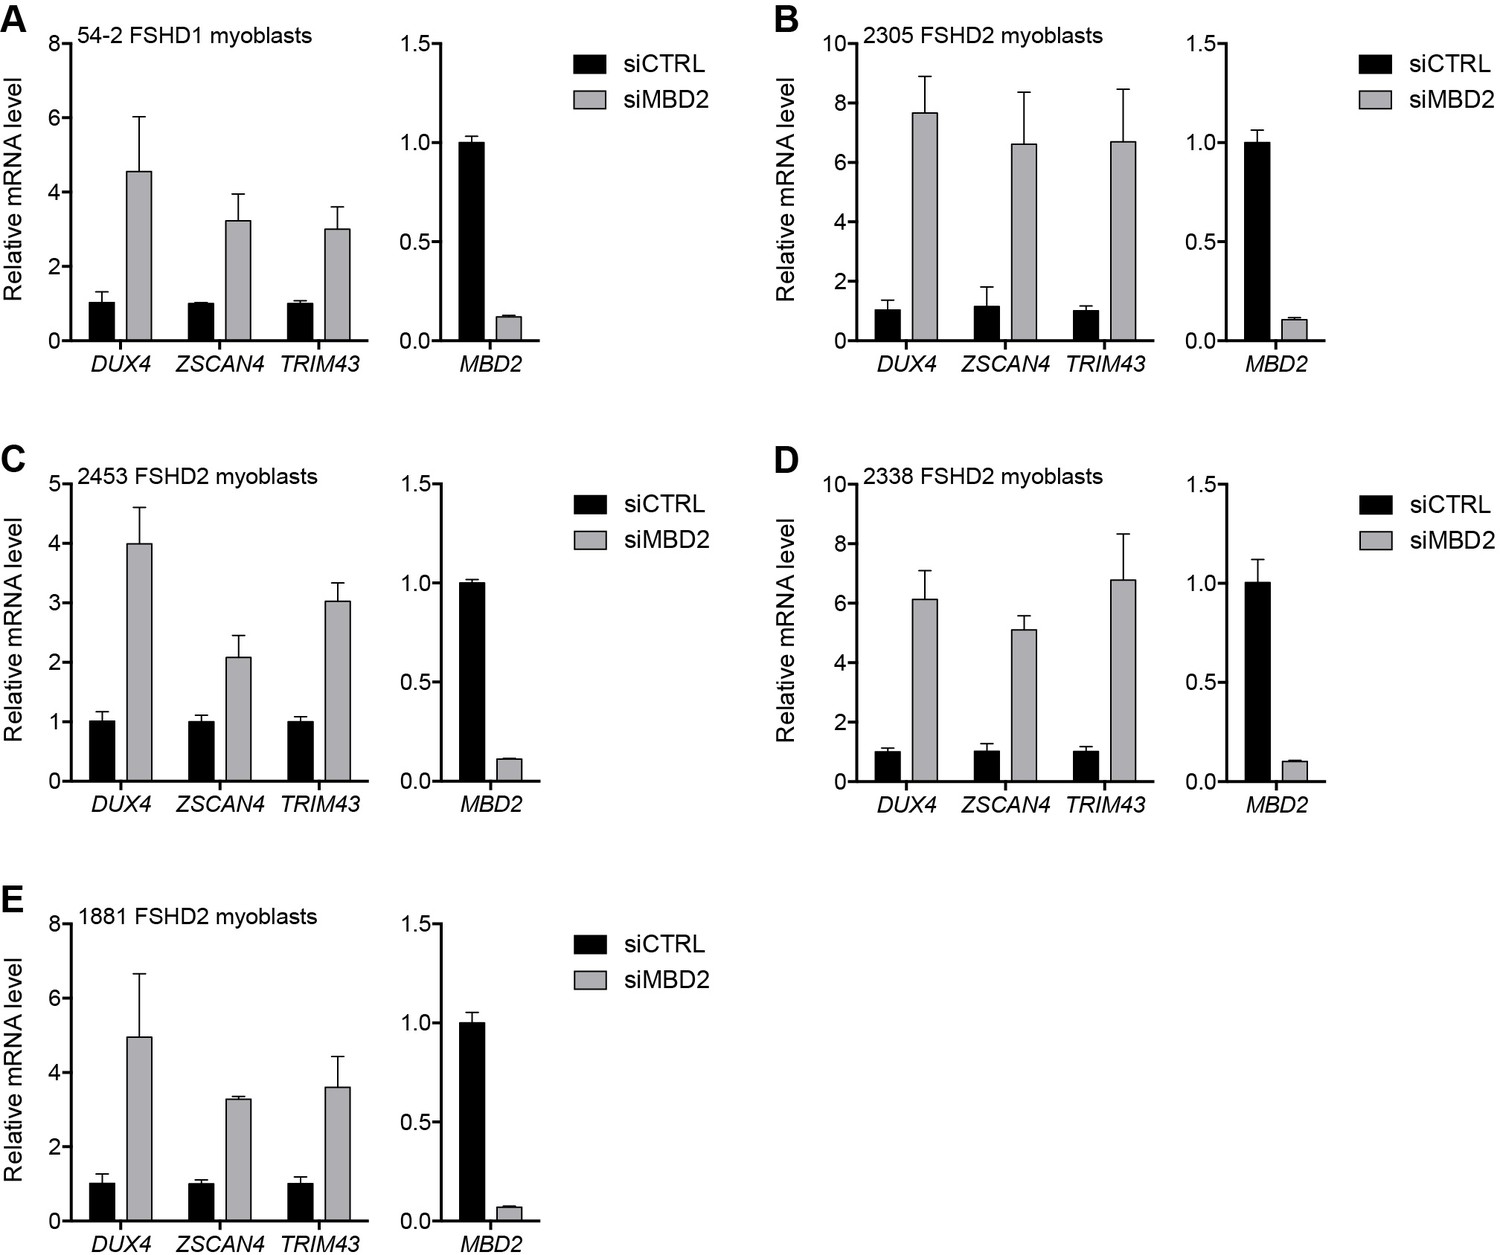
MBD2 depletion in additional FSHD cell lines.
(A–E) MBD2, DUX4, and DUX4 target gene expression as determined by RT-qPCR following control (CTRL) or MBD2 siRNA knockdown in 54–2 FSHD1 (A), 2305 FSHD2 (B), 2453 FSHD2 (C), 2338 FSHD2 (D) or 1881 FSHD2 (E) myoblasts. Error bars denote the standard deviation from the mean of three biological replicates. Statistical significance was calculated by comparing the specific knockdown to the control knockdown for each gene using a two-tailed, two-sample Mann-Whitney U test and p was ≤0.05 unless otherwise specified as not significant (ns). See also Figure 3—source data 1.
Figure 3—figure supplement 6
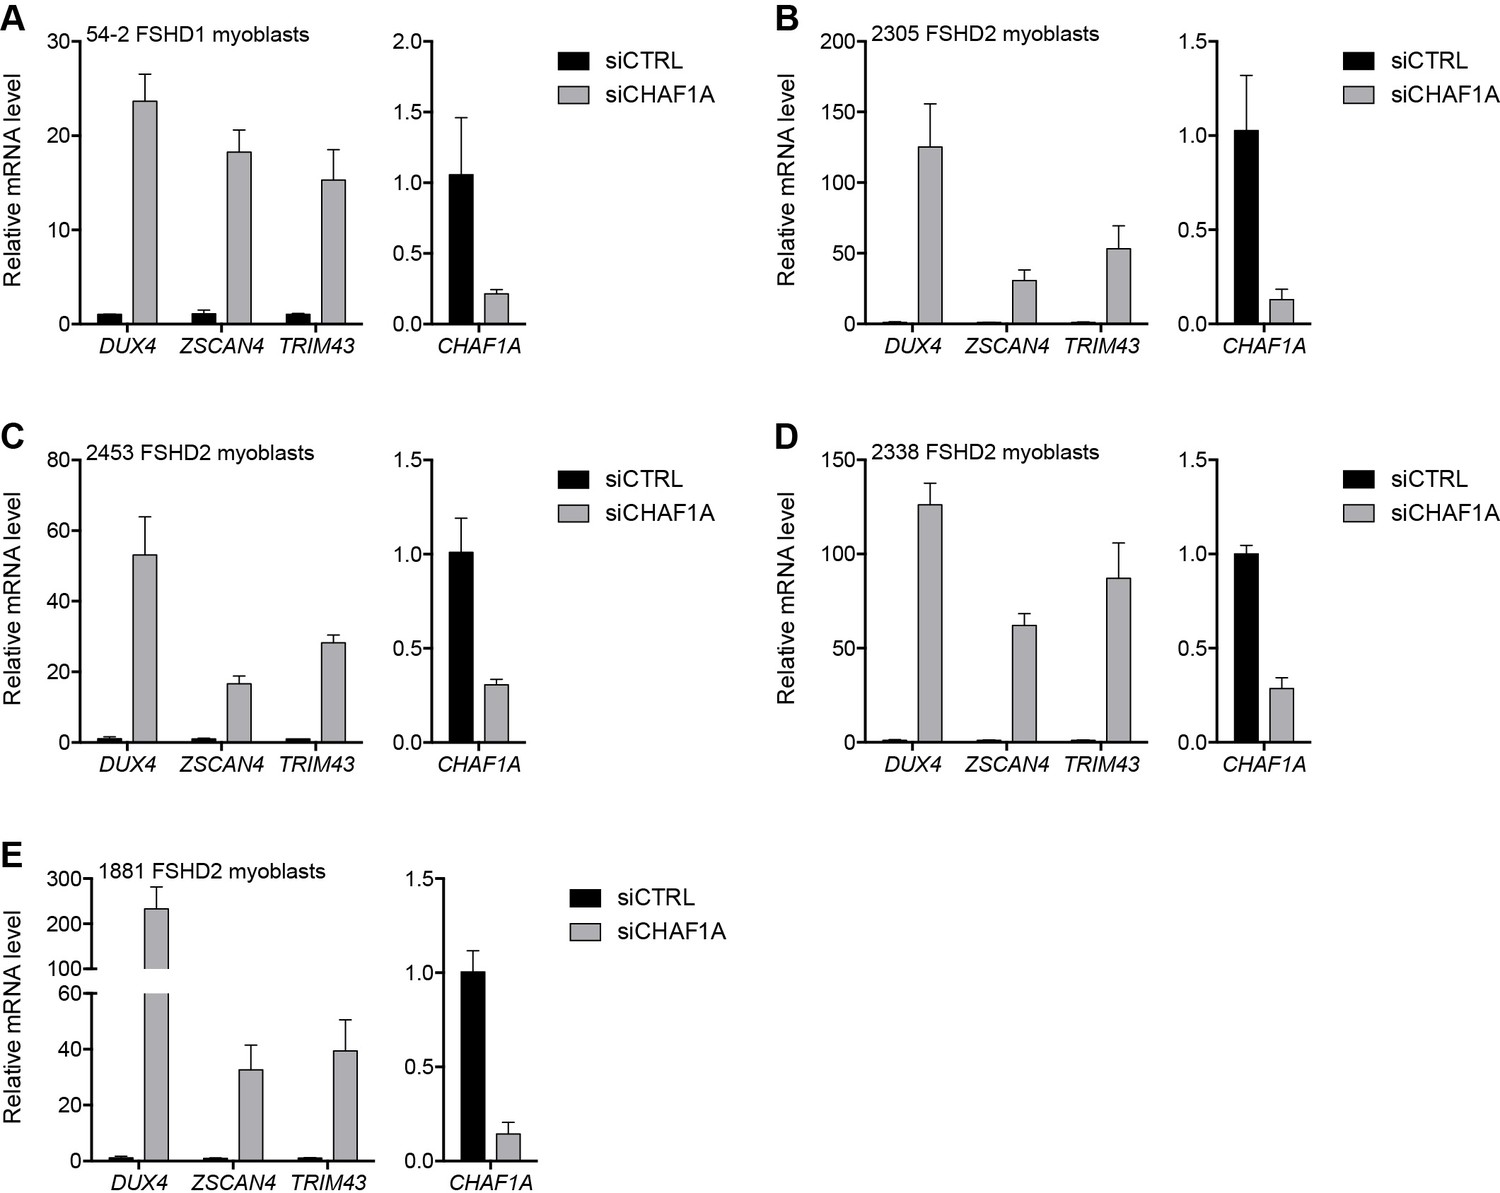
CHAF1A depletion in additional FSHD cell lines.
(A–E) CHAF1A, DUX4, and DUX4 target gene expression as determined by RT-qPCR following control (CTRL) or CHAF1A siRNA knockdown in 54–2 FSHD1 (A), 2305 FSHD2 (B), 2453 FSHD2 (C), 2338 FSHD2 (D) or 1881 FSHD2 (E) myoblasts. Error bars denote the standard deviation from the mean of three biological replicates. Statistical significance was calculated by comparing the specific knockdown to the control knockdown for each gene using a two-tailed, two-sample Mann-Whitney U test and p was ≤0.05 unless otherwise specified as not significant (ns). See also Figure 3—source data 1.
Figure 3—figure supplement 7

MBD1 depletion in additional FSHD cell lines.
(A–E) MBD1, DUX4, and DUX4 target gene expression as determined by RT-qPCR following control (CTRL) or MBD1 siRNA knockdown in 54–2 FSHD1 (A), 2305 FSHD2 (B), 2453 FSHD2 (C), 2338 FSHD2 (D) or 1881 FSHD2 (E) myoblasts. Error bars denote the standard deviation from the mean of three biological replicates. Statistical significance was calculated by comparing the specific knockdown to the control knockdown for each gene using a two-tailed, two-sample Mann-Whitney U test and p was ≤0.05 unless otherwise specified as not significant (ns). See also Figure 3—source data 1.
Figure 4 with 4 supplements
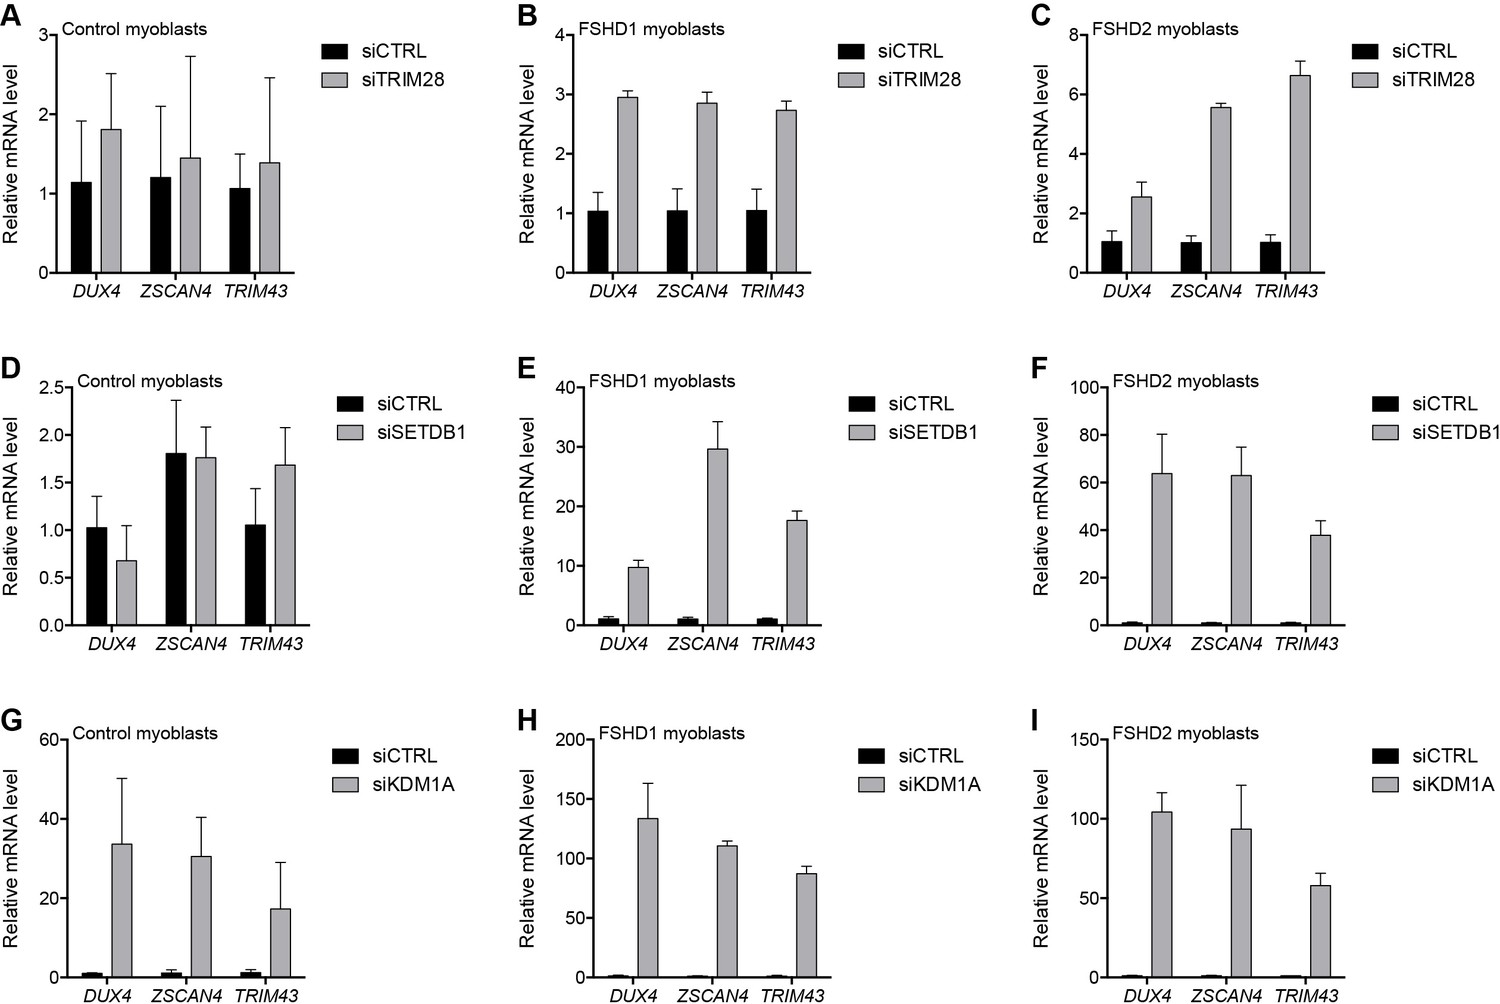
Additional transcriptional repressors silence the D4Z4 repeat.
(A–I) DUX4 and DUX4 target gene expression as determined by RT-qPCR following control (CTRL), TRIM28 (A–C), SETDB1 (D–F) or KDM1A (G–I) siRNA knockdown in MB2401 control (A,D,G), MB073 FSHD1 (B,E,H) or MB200 FSHD2 (C,F,I) myoblasts. Error bars denote the standard deviation from the mean of three biological replicates. Statistical significance was calculated by comparing the specific knockdown to the control knockdown for each gene using a two-tailed, two-sample Mann-Whitney U test and p was ≤0.05 for all comparisons except those in (A) and (D). See also Figure 4—source data 1.
-
Figure 4—source data 1
Source data for Figure 4.
This file contains the source data used to make the graphs presented in Figure 4 and Figure 4—figure supplements 1–4. GraphPad Prism was utilized to visually represent the quantitative data.
- https://doi.org/10.7554/eLife.31023.029
Figure 4—figure supplement 1
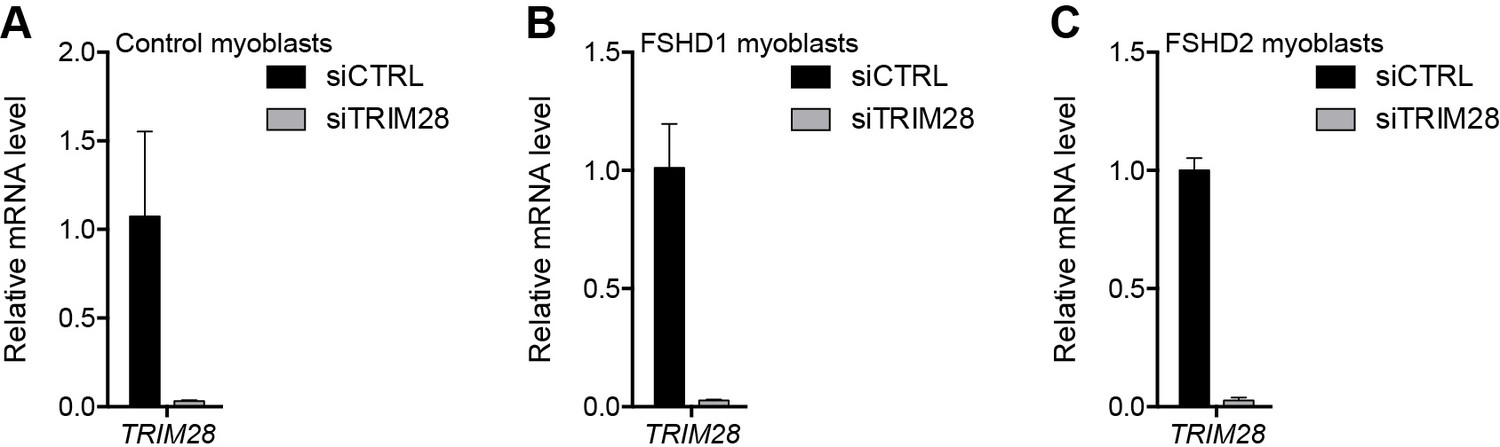
Validation of TRIM28 knockdown.
(A–C) TRIM28 gene expression as determined by RT-qPCR following control (CTRL) or TRIM28 siRNA knockdown in MB2401 control (A), MB073 FSHD1 (B) or MB200 FSHD2 (C) myoblasts. Error bars denote the standard deviation from the mean of three biological replicates. See also Figure 4—source data 1.
Figure 4—figure supplement 2

Validation of SETDB1 knockdown.
(A–C) SETDB1 gene expression as determined by RT-qPCR following control (CTRL) or SETDB1 siRNA knockdown in MB2401 control (A), MB073 FSHD1 (B) or MB200 FSHD2 (C) myoblasts. Error bars denote the standard deviation from the mean of three biological replicates. See also Figure 4—source data 1.
Figure 4—figure supplement 3
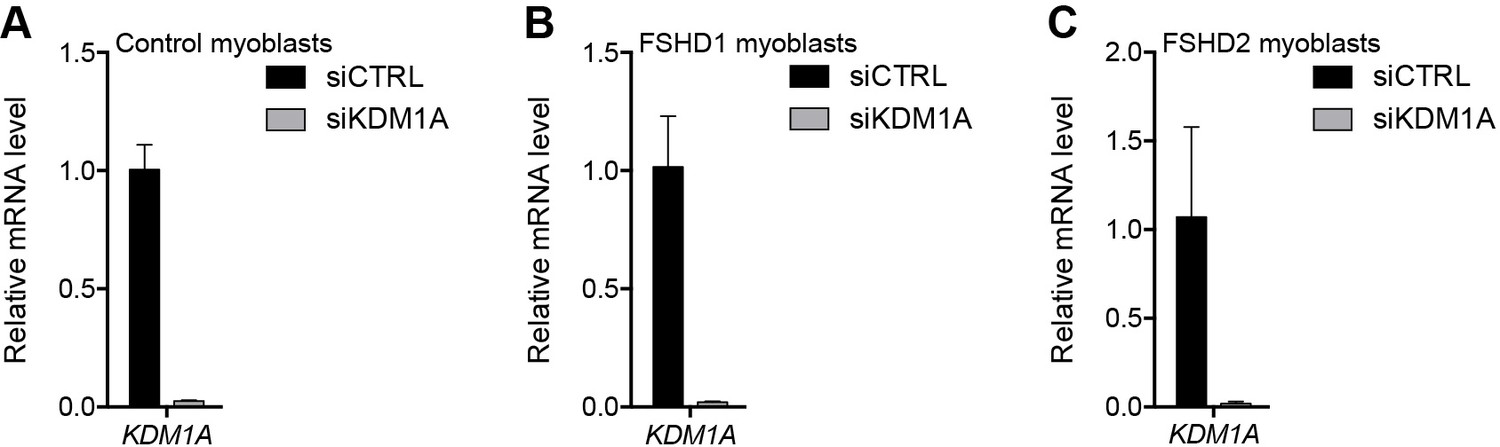
Validation of KDM1A knockdown.
(A–C) KDM1A gene expression as determined by RT-qPCR following control (CTRL) or KDM1A siRNA knockdown in MB2401 control (A), MB073 FSHD1 (B) or MB200 FSHD2 (C) myoblasts. Error bars denote the standard deviation from the mean of three biological replicates. See also Figure 4—source data 1.
Figure 4—figure supplement 4
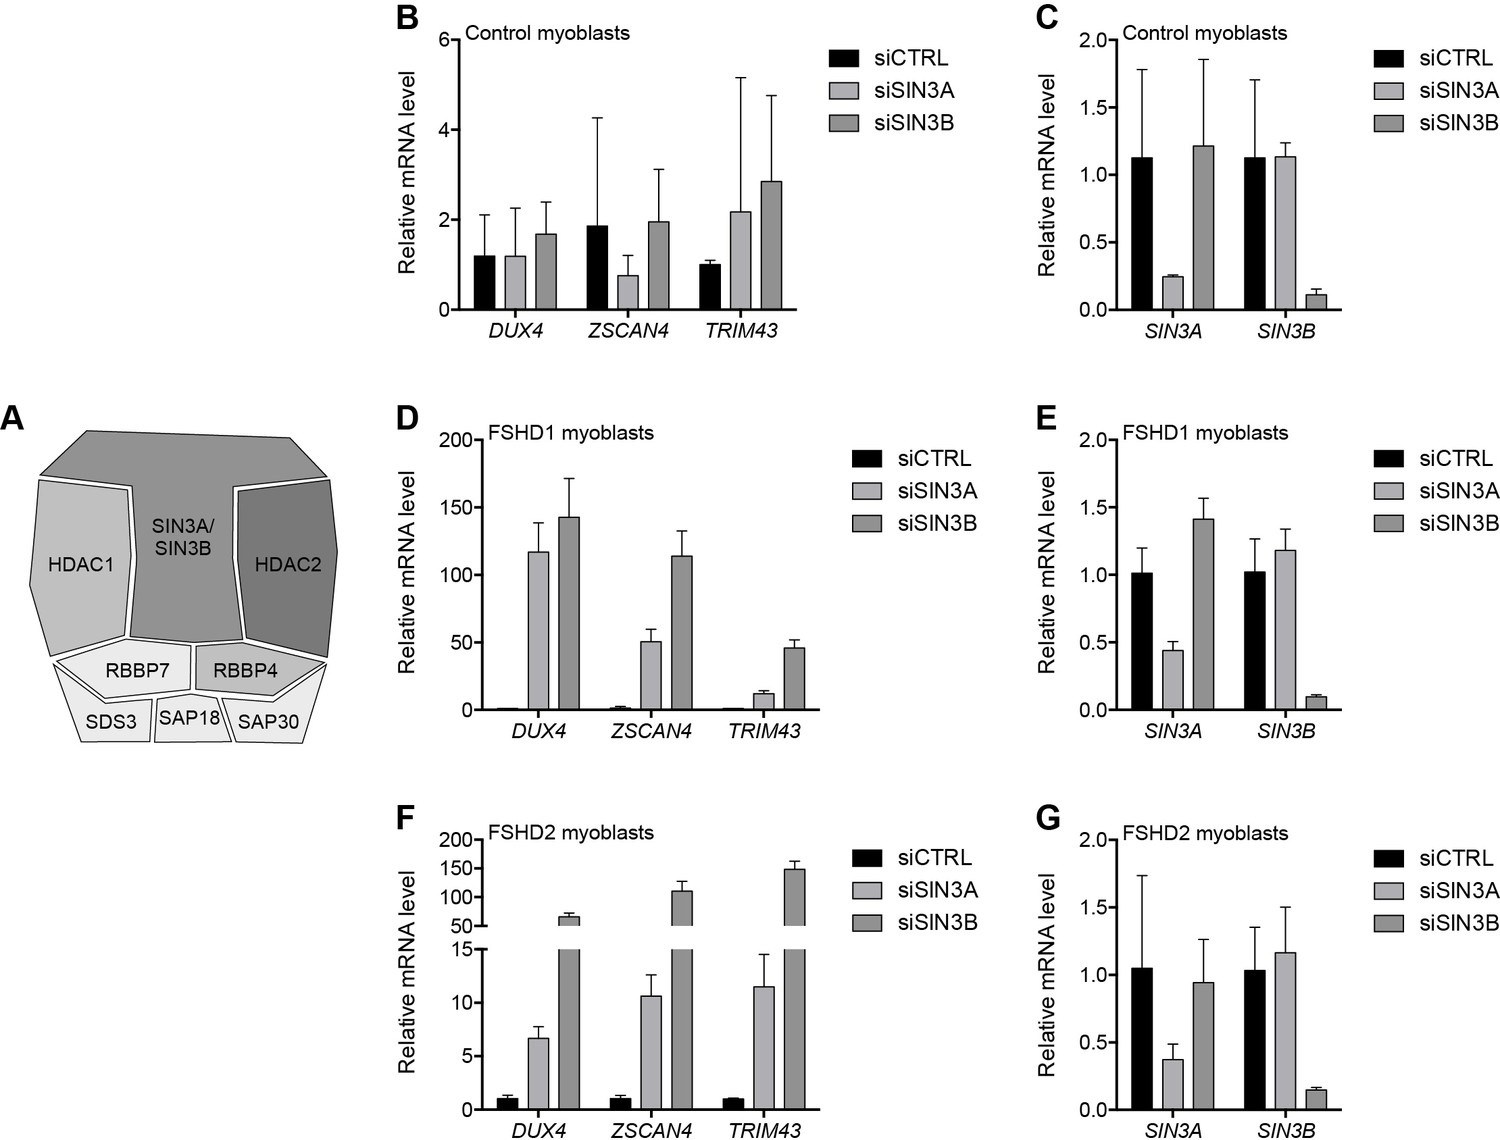
SIN3A/SIN3B knockdown.
(A) Schematic representation of the SIN3 complex, with shading as in Figure 2A depicting the amount of experimental support linking each subunit to DUX4 regulation. (B–G) SIN3A, SIN3B, DUX4, and DUX4 target gene expression as determined by RT-qPCR following control (CTRL), SIN3A or SIN3B siRNA knockdown in MB2401 control (B–C), MB073 FSHD1 (D–E) or MB200 FSHD2 (F–G) myoblasts. Error bars denote the standard deviation from the mean of three biological replicates. See also Figure 4—source data 1.
Figure 5 with 3 supplements

NuRD and CAF-1 complex components repress DUX4 in iPS cells.
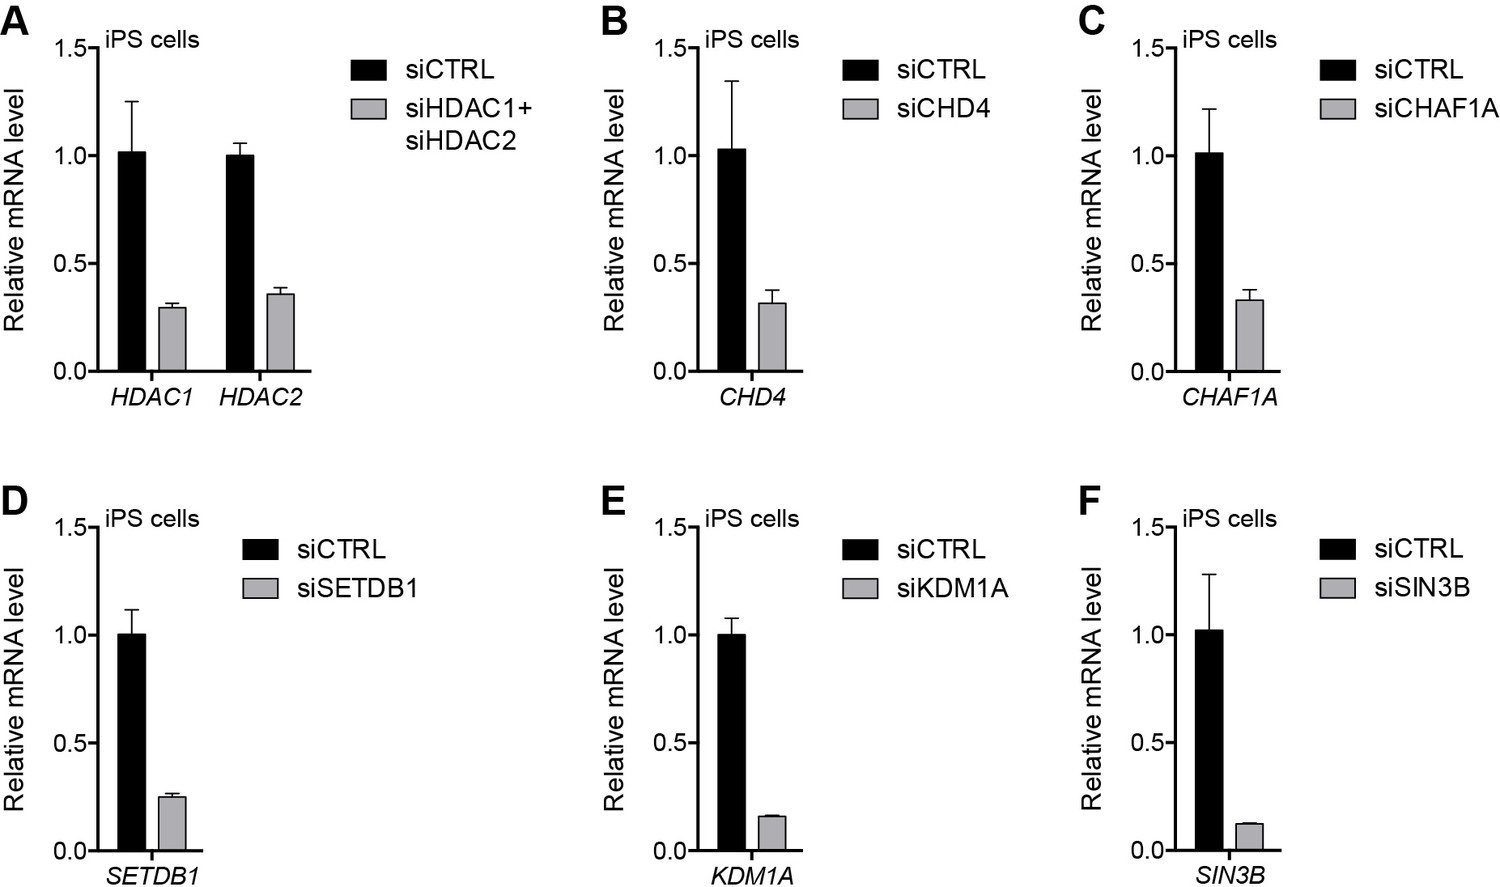
(A–F) DUX4 gene expression as determined by RT-qPCR in human eMHF2 iPS cells following control (CTRL), HDAC1/HDAC2 (A), CHD4 (B), CHAF1A (C), SETDB1 (D), KDM1A (E) or SIN3B (F) siRNA knockdown. Error bars denote the standard deviation from the mean of three biological replicates. Statistical significance was calculated by comparing the specific knockdown to the control knockdown for each gene using a two-tailed, two-sample Mann-Whitney U test and p was ≤0.05 unless otherwise specified as not significant (ns). See also Figure 5—source data 1.
-
Figure 5—source data 1
Source data for Figure 5.
This file contains the source data used to make the graphs presented in Figure 5 and Figure 5—figure supplements 1–3. GraphPad Prism was utilized to visually represent the quantitative data.
- https://doi.org/10.7554/eLife.31023.034
Figure 5—figure supplement 1
Validation of repressor protein knockdowns in eMHF2 iPS cells.
(A–F) Gene expression as determined by RT-qPCR in human eMHF2 iPS cells following control (CTRL), HDAC1/HDAC2 (A), CHD4 (B), CHAF1A (C), SETDB1 (D), KDM1A (E) or SIN3B (F) siRNA knockdown. Error bars denote the standard deviation from the mean of three biological replicates. See also Figure 5—source data 1.
Figure 5—figure supplement 2
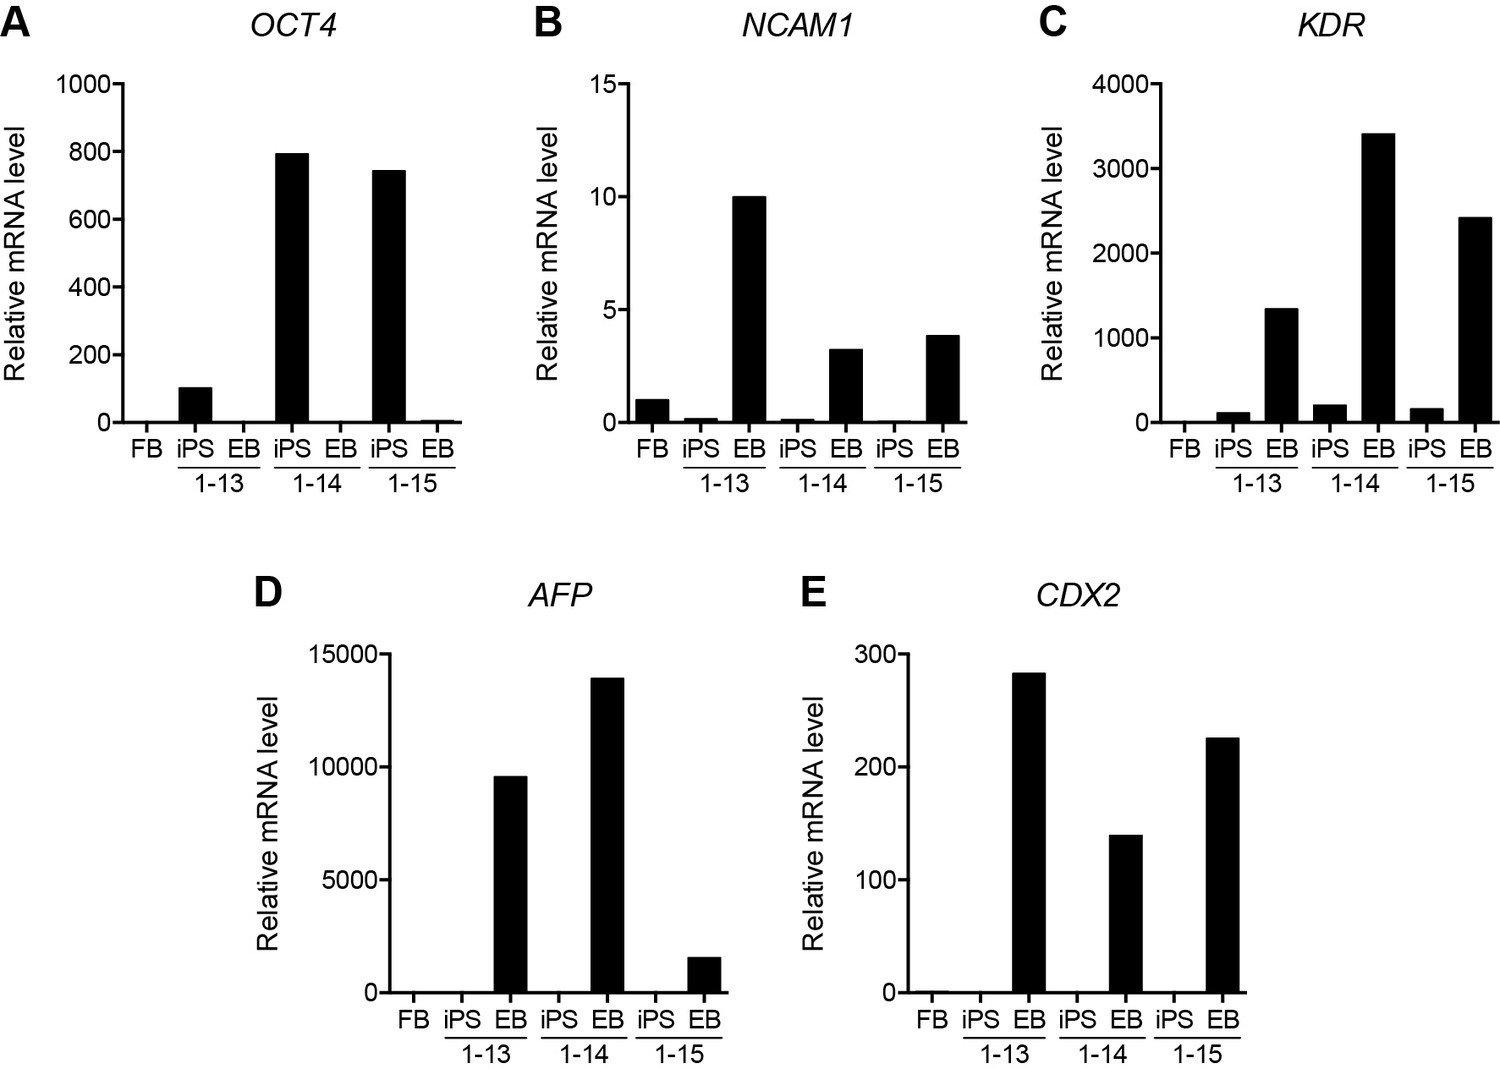
Validation of HFF3 iPS cell generation.
(A–E) Gene expression as determined by RT-qPCR in HFF3 fibroblasts (FB), three isogenic iPS cell lines generated by reprogramming the fibroblast line, and embryoid bodies (EB) derived from the iPS cells. OCT4 (A) is a pluripotency gene, while NCAM1 (B), KDR (C), AFP (D), and CDX2 (E) are highly expressed in ectoderm, mesoderm, endoderm, and trophoblast, respectively. See also Figure 5—source data 1.
Figure 5—figure supplement 3
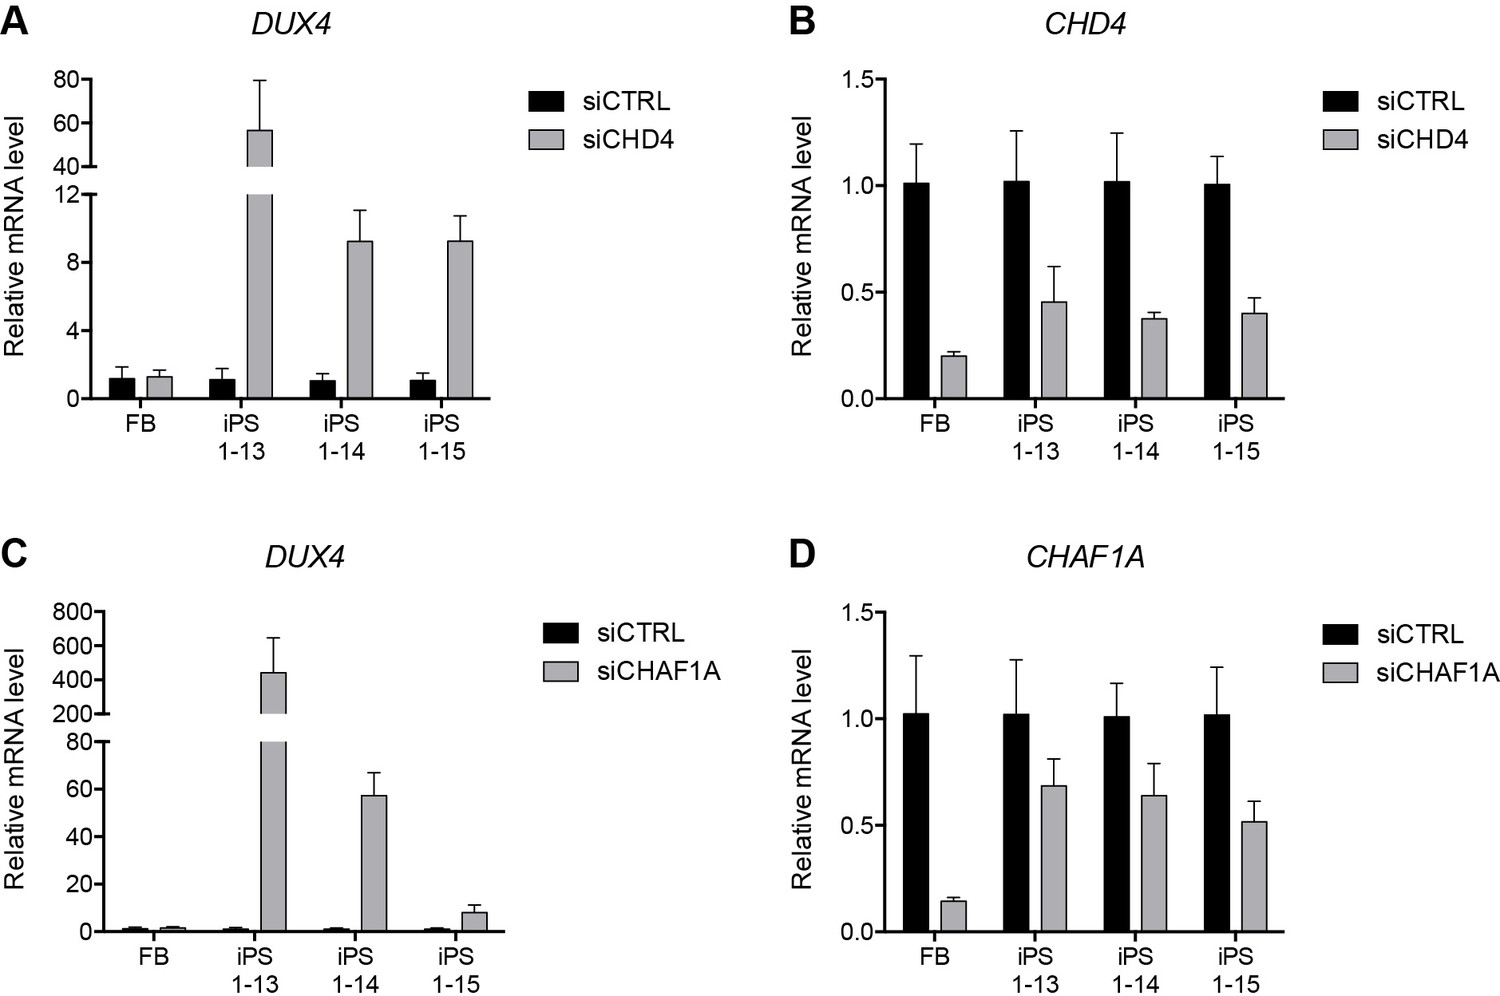
NuRD and CAF-1 knockdown in HFF3 fibroblasts and iPS cells.
(A–D) Gene expression as determined by RT-qPCR following control (CTRL), CHD4 (A–B) or CHAF1A (C–D) siRNA knockdown in human HFF3 fibroblasts (FB) and three isogenic iPS cell lines generated by reprogramming the fibroblast line. DUX4 data were generated with 4qAL primers (see Materials and methods). Error bars denote the standard deviation from the mean of three biological replicates. See also Figure 5—source data 1.
Figure 6 with 2 supplements
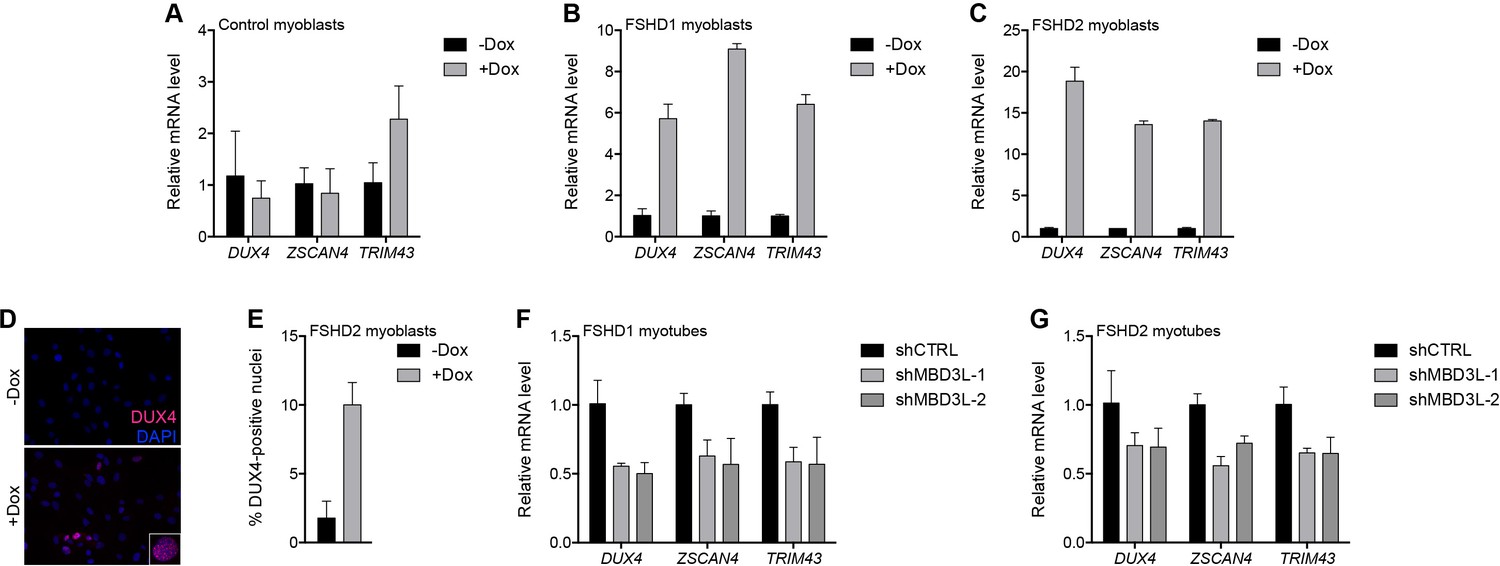
MBD3L2 expression de-represses the D4Z4 array.
(A–C) DUX4 and DUX4 target gene expression as determined by RT-qPCR in MB2401 control (A), MB073 FSHD1 (B) or MB200 FSHD2 (C) myoblasts without (-) or with (+) doxycycline (Dox) treatment for 48 hr to induce MBD3L2 transgene expression in clonal cell lines. (D–E) DUX4-positive nuclei upon overexpression of MBD3L2 in MB200 FSHD2 myoblasts as in (C) were detected by immunofluorescence (D) and quantified by counting three fields representing >125 nuclei (E). (F–G) DUX4 and DUX4 target gene expression as determined by RT-qPCR following control (CTRL) or MBD3L family gene shRNA knockdown in MB073 FSHD1 (F) or MB200 FSHD2 (G) myotubes. Error bars denote the standard deviation from the mean of three biological replicates. Statistical significance was calculated by comparing the specific knockdown to the control knockdown for each gene using a two-tailed, two-sample Mann-Whitney U test and p was ≤0.05 for all comparisons except in (A). See also Figure 6—source data 1.
-
Figure 6—source data 1
Source data for Figure 6.
This file contains the source data used to make the graphs presented in Figure 6 and Figure 6—figure supplements 1–2. GraphPad Prism was utilized to visually represent the quantitative data.
- https://doi.org/10.7554/eLife.31023.038
Figure 6—figure supplement 1
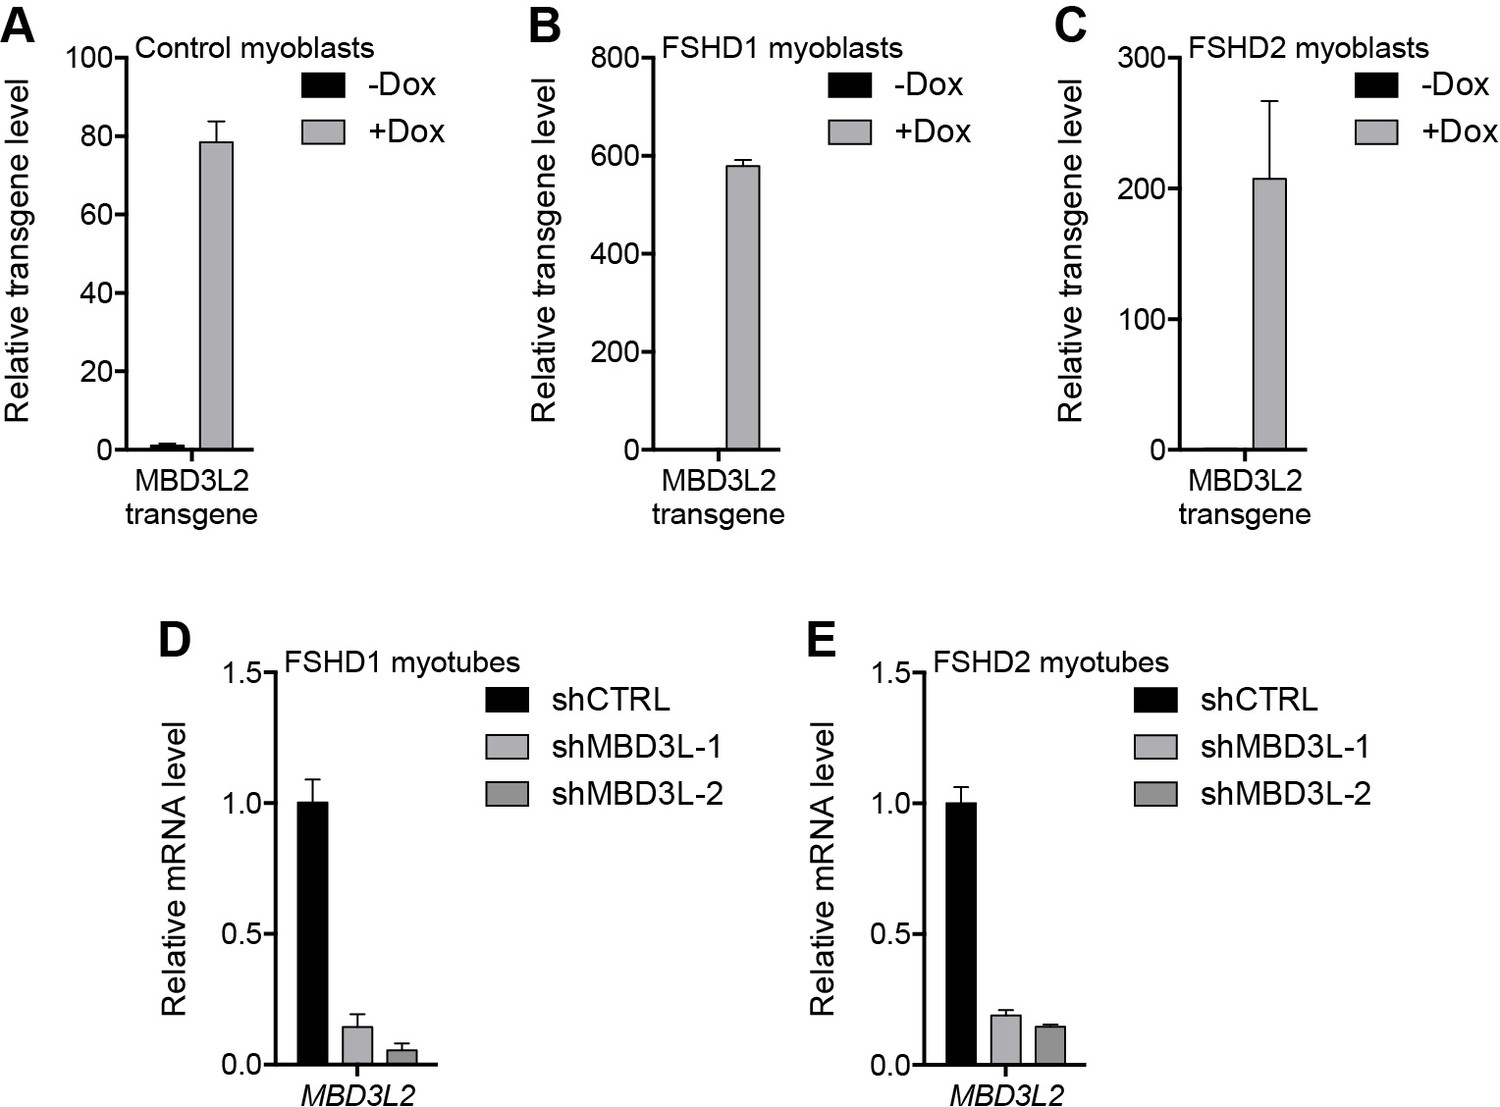
Validation of MBD3L2 overexpression and depletion.
(A–E) The ectopic (A–C) or endogenous (D–E) expression of MBD3L2 as determined by RT-qPCR in MB2401 control (A), MB073 FSHD1 (B) or MB200 FSHD2 (C) myoblasts cultured without (-) or with (+) doxycycline (Dox) for 48 hr, or in MB073 FSHD1 (D) or MB200 FSHD2 (E) myotubes expressing control (CTRL) or MBD3L gene shRNAs. Error bars denote the standard deviation from the mean of three biological replicates. See also Figure 6—source data 1.
Figure 6—figure supplement 2
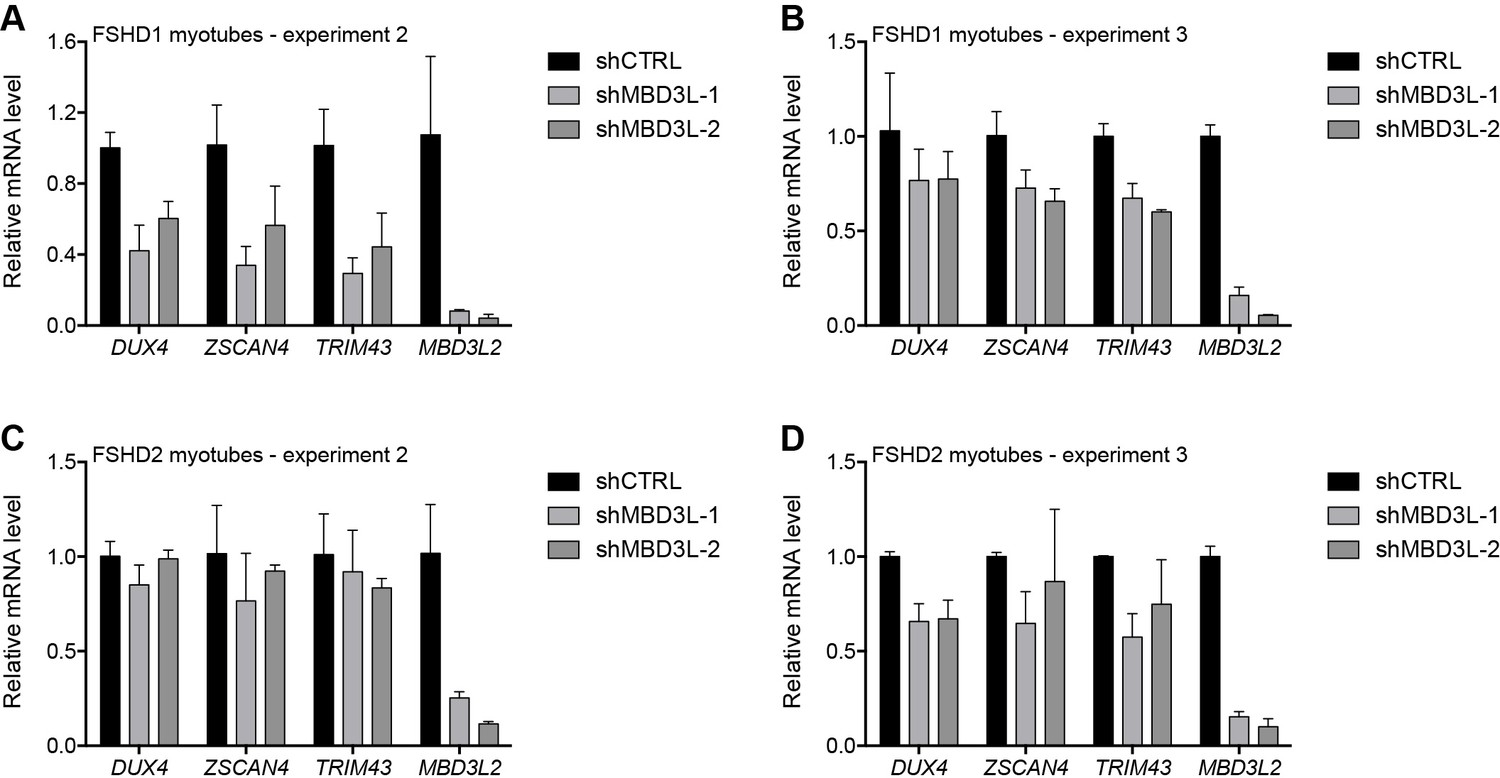
Additional MBD3L knockdown experiments.
(A–D) MBD3L2, DUX4, and DUX4 target gene expression as determined by RT-qPCR in two additional independent experiments with control (CTRL) or MBD3L shRNA-expressing MB073 FSHD1 (A–B) or MB200 FSHD2 (C–D) muscle cell lines differentiated into myotubes. Error bars denote the standard deviation from the mean of three biological replicates. See also Figure 6—source data 1.
Tables
Table 1
Examples of proteins identified by enChIP-MS.
https://doi.org/10.7554/eLife.31023.006| Gene name | Sample | Category | |||
|---|---|---|---|---|---|
| gD4Z4 | gMYOD1 | ||||
| # peptides* | % coverage† | # peptides* | % coverage† | ||
| CBX3/HP1γ | 4.7 | 15.7 | 0.0 | 0.0 | Known D4Z4-associated proteins |
| NCL | 47.4 | 22.3 | 34.0 | 14.2 | |
| PDS5B | 2.0 | 11.2 | 0.0 | 0.0 | |
| RAD21 | 1.8 | 2.9 | 0.0 | 0.0 | |
| SMC1A | 7.0 | 5.8 | 2.0 | 1.8 | |
| SMC3 | 17.0 | 6.7 | 1.0 | 1.0 | |
| SMCHD1 | 1.6 | 2.4 | 0.0 | 0.0 | |
| CHD4 | 8.3 | 3.1 | 0.0 | 0.0 | NuRD complex components |
| HDAC2 | 2.5 | 5.6 | 3.0 | 6.8 | |
| MTA2 | 1.2 | 2.2 | 1.0 | 1.5 | |
| RBBP4 | 4.5 | 7.5 | 4.0 | 6.9 | |
-
*Average number of peptides recovered from each sample type, combining like (gD4Z4 or gMYOD1) immunoprecipitations.
†Average percentage of each protein covered by the identified peptides from each sample type, combining like (gD4Z4 or gMYOD1) immunoprecipitations.
Key resources table
| Reagent type (species) or resource | Designation | Source or reference | Identifiers | Additional information |
|---|---|---|---|---|
| Cell line (H. sapiens) | 1881 myoblasts | Fields Center for FSHD and Neuromuscular Research at the University of Rochester Medical Center (https://www.urmc.rochester.edu/neurology/fields-center.aspx) | See Supplementary file 3 | |
| Cell line (H. sapiens) | 2305 myoblasts | Fields Center for FSHD and Neuromuscular Research at the University of Rochester Medical Center (https://www.urmc.rochester.edu/neurology/fields-center.aspx) | See Supplementary file 3 | |
| Cell line (H. sapiens) | 2338 myoblasts | Fields Center for FSHD and Neuromuscular Research at the University of Rochester Medical Center (https://www.urmc.rochester.edu/neurology/fields-center.aspx) | See Supplementary file 3 | |
| Cell line (H. sapiens) | 2453 myoblasts | Fields Center for FSHD and Neuromuscular Research at the University of Rochester Medical Center (https://www.urmc.rochester.edu/neurology/fields-center.aspx) | See Supplementary file 3 | |
| Cell line (H. sapiens) | 54–2 myoblasts | (Krom et al., 2012) (DOI:10.1016/j.ajpath.2012.07.007) | See Supplementary file 3 | |
| Cell line (H. sapiens) | eMHF2 iPS cells | University of Washington Institute for Stem Cell and Regenerative Medicine Tom and Sue Ellison Stem Cell Core (http://depts.washington.edu/iscrm/ellison) | ||
| Cell line (H. sapiens) | HFF3 fibroblasts | ATCC | ATCC:SCRC-1043; RRID:CVCL_DB29 | |
| Cell line (H. sapiens) | MB073 myoblasts | Fields Center for FSHD and Neuromuscular Research at the University of Rochester Medical Center (https://www.urmc.rochester.edu/neurology/fields-center.aspx) | See Supplementary file 3 | |
| Cell line (Homo sapiens) | MB135 myoblasts | Fields Center for FSHD and Neuromuscular Research at the University of Rochester Medical Center (https://www.urmc.rochester.edu/neurology/fields-center.aspx) | See Supplementary file 3 | |
| Cell line (H. sapiens) | MB200 myoblasts | Fields Center for FSHD and Neuromuscular Research at the University of Rochester Medical Center (https://www.urmc.rochester.edu/neurology/fields-center.aspx) | See Supplementary file 3 | |
| Cell line (H. sapiens) | MB2401 myoblasts | Fields Center for FSHD and Neuromuscular Research at the University of Rochester Medical Center (https://www.urmc.rochester.edu/neurology/fields-center.aspx) | See Supplementary file 3 | |
| Antibody | alpha-Tubulin | Sigma-Aldrich | Sigma-Aldrich:T9026; RRID:AB_477593 | |
| Antibody | Acetyl-Histone H4 | EMD Millipore | EMD Millipore:06866; RRID:AB_310270 | |
| Antibody | CHD4 | Bethyl Laboratories | Bethyl Laboratories:A301081A; RRID:AB_873001 | |
| Antibody | DUX4 (14–3) | (Geng et al., 2011) | ||
| Antibody | DUX4 (E5-5) | (Geng et al., 2011) | ||
| Antibody | FITC anti-mouse | Jackson ImmunoResearch | Jackson ImmunoResearch:715095150; RRID:AB_2340792 | |
| Antibody | FLAG M2 | Sigma-Aldrich | Sigma-Aldrich:F1804 or F3165; RRID:AB_262044 or RRID:AB_259529 | |
| Antibody | HDAC2 | Abcam | Abcam:ab7029; RRID:AB_305706 | |
| Antibody | HRP anti-mouse | Jackson ImmunoResearch | Jackson ImmunoResearch:115035146; RRID:AB_2307392 | |
| Antibody | MBD2 | Bethyl Laboratories | Bethyl Laboratories:A301632A; RRID:AB_1211478 | |
| Antibody | MTA2 | Abcam | Abcam:ab8106; RRID:AB_306276 | |
| Antibody | TRITC anti-rabbit | Jackson ImmunoResearch | Jackson ImmunoResearch:711025152; RRID:AB_2340588 | |
| Recombinant DNA reagent | pCW57.1-MBD3L2 | This paper | Addgene plasmid #106332 | Lentiviral vector expressing doxycycline-inducible MBD3L2 (generated using pCW57.1 [Addgene plasmid #41393]) |
| Recombinant DNA reagent | pGIPZ-shControl | Fred Hutchinson Cancer Research Center Genomics Shared Resource (http://monod.fhcrc.org/rnai/) | ||
| Recombinant DNA reagent | pGIPZ-shMBD3L-1 | Fred Hutchinson Cancer Research Center Genomics Shared Resource (http://monod.fhcrc.org/rnai/) | ||
| Recombinant DNA reagent | pGIPZ-shMBD3L-2 | Fred Hutchinson Cancer Research Center Genomics Shared Resource (http://monod.fhcrc.org/rnai/) | ||
| Recombinant DNA reagent | pZLCv2-3xFLAG-dCas9-HA-2xNLS | This paper | Addgene plasmid #106357 | Lentiviral vector expressing FLAG-tagged, nuclease-deficient Cas9 (generated using lentiCRISPRv2 [Addgene plasmid #52961] and pHR-SFFV-KRAB-dCas9-P2A-mCherry [Addgene plasmid #60954]) |
| Recombinant DNA reagent | pZLCv2-gD4Z4-1-3xFLAG-dCas9-HA-2xNLS | This paper | Addgene plasmid #106352 | Lentiviral vector expressing FLAG-dCas9 and a guide RNA targeting the D4Z4 unit |
| Recombinant DNA reagent | pZLCv2-gD4Z4-2-3xFLAG-dCas9-HA-2xNLS | This paper | Addgene plasmid #106353 | Lentiviral vector expressing FLAG-dCas9 and a gRNA targeting the D4Z4 unit |
| Recombinant DNA reagent | pZLCv2-gD4Z4-3-3xFLAG-dCas9-HA-2xNLS | This paper | Addgene plasmid #106354 | Lentiviral vector expressing FLAG-dCas9 and a gRNA targeting the D4Z4 unit |
| Recombinant DNA reagent | pZLCv2-gMYOD1-3xFLAG-dCas9-HA-2xNLS | This paper | Addgene plasmid #106355 | Lentiviral vector expressing FLAG-dCas9 and a gRNA targeting the MYOD1 distal regulatory region |
| Sequenced-based reagent | enChIP-/ChIP-qPCR primers | This paper | See Supplementary file 4 | |
| Sequenced-based reagent | gRNAs | This paper | See Supplementary file 4 | |
| Sequenced-based reagent | RT-qPCR primers | This paper | See Supplementary file 4 | |
| Sequenced-based reagent | shRNAs | This paper | See Supplementary file 4 | |
| Sequenced-based reagent | siRNAs | This paper | See Supplementary file 4 | |
| Peptide, recombinant protein | 3X FLAG peptide | Sigma-Aldrich | Sigma-Aldrich:F4799 | |
| Commercial assay or kit | QIAshredder | Qiagen | Qiagen:79656 | |
| Commercial assay or kit | RNeasy Mini Kit | Qiagen | Qiagen:74106 | |
| Commercial assay or kit | SuperScript III First-Strand Synthesis System | Invitrogen/Thermo Fisher | Invitrogen/Thermo Fisher:18080051 | |
| Chemical compound, drug | 2-Mercaptoethanol | Sigma-Aldrich | Sigma-Aldrich:M3148 | |
| Chemical compound, drug | Dexamethasone | Sigma-Aldrich | Sigma-Aldrich:D4902 | |
| Chemical compound, drug | DMEM:Nutrient Mixture F-12 | Gibco/Thermo Fisher | Gibco/Thermo Fisher:11320082 | |
| Chemical compound, drug | DNase I | Thermo Fisher | Thermo Fisher:18068015 | |
| Chemical compound, drug | Doxycyline hyclate | Sigma-Aldrich | Sigma-Aldrich:D9891 | |
| Chemical compound, drug | Dulbecco's Modified Eagle Medium (DMEM) | Gibco/Thermo Fisher | Gibco/Thermo Fisher:11965092 | |
| Chemical compound, drug | Dynabeads-Protein G | Thermo Fisher | Thermo Fisher:10003D | |
| Chemical compound, drug | Ham's F-10 Nutrient Mix | Gibco/Thermo Fisher | Gibco/Thermo Fisher:11550043 | |
| Chemical compound, drug | Horse serum | Gibco/Thermo Fisher | Gibco/Thermo Fisher:26050070 | |
| Chemical compound, drug | HyClone Fetal Bovine Serum | GE Healthcare Life Sciences | GE Healthcare Life Sciences:SH30071.03 | |
| Chemical compound, drug | Insulin | Sigma-Aldrich | Sigma-Aldrich:I1882 | |
| Chemical compound, drug | KnockOut Serum Replacement | Gibco/Thermo Fisher | Gibco/Thermo Fisher:10828028 | |
| Chemical compound, drug | Lipofectamine RNAiMAX | Invitrogen/Thermo Fisher | Invitrogen/Thermo Fisher:13778150 | |
| Chemical compound, drug | Matrigel | Corning Life Science | Corning Life Science:354277 | |
| Chemical compound, drug | MEM non-essential amino acids | Gibco/Thermo Fisher | Gibco/Thermo Fisher:11140050 | |
| Chemical compound, drug | mTeSR1 medium | STEMCELL Technologies | STEMCELL Technologies:85850 | |
| Chemical compound, drug | Opti-MEM reducedserum medium | Thermo Fisher | Thermo Fisher:31985070 | |
| Chemical compound, drug | Penicillin/streptomycin | Gibco/Thermo Fisher | Gibco/Thermo Fisher:15140122 | |
| Chemical compound, drug | Polybrene | Sigma-Aldrich | Sigma-Aldrich:107689 | |
| Chemical compound, drug | Puromycin | Sigma-Aldrich | Sigma-Aldrich:P8833 | |
| Chemical compound, drug | Recominant human basic fibroblast growth factor | Promega Corporation | Promega Corporation:G5071 | |
| Chemical compound, drug | Sodium pyruvate | Gibco/Thermo Fisher | Gibco/Thermo Fisher:11360070 | |
| Chemical compound, drug | Transferrin | Sigma-Aldrich | Sigma-Aldrich:T0665 | |
| Chemical compound, drug | Y-27632 ROCK inhibitor | Miltenyi Biotec | Miltenyi Biotec:130106538 | |
| Software, algorithm | Code used for proteomics data analysis | This paper (Jagannathan, 2017) | The R code used for the proteomics data analysis can be accessed via github at https://github.com/sjaganna/2017-campbell_et_al | |
| Software, algorithm | GraphPad Prism | GraphPad Prism (https://graphpad.com) | RRID:SCR_015807 | Version 6 |
| Software, algorithm | ImageJ | ImageJ (http://imagej.nih.gov/ij/) | RRID:SCR_003070 | |
| Software, algorithm | Proteome Discoverer | Thermo Fisher | RRID:SCR_014477 | Version 1.4 |
Additional files
-
Supplementary file 1
Proteins identified by enChIP-MS.
The table lists the gene name, corresponding number of peptides recovered (pseudoquant), and percent coverage for each protein identified by enChIP-MS of nine independent FLAG-dCas9 immunoprecipitations from various gD4Z4- or gMYOD1-expressing myoblast cell lines.
- https://doi.org/10.7554/eLife.31023.039
-
Supplementary file 2
Gene ontology analysis of D4Z4-associated proteins.
The table shows the gene ontology (GO) biological process categories enriched among the D4Z4-associated proteins identified by enChIP-MS, along with the number of observed versus expected proteins in each category and the associated fold enrichment score and p-value.
- https://doi.org/10.7554/eLife.31023.040
-
Supplementary file 3
Characteristics of myoblast cell lines used in this study.
The table summarizes details of the muscle cell lines used for this study.
- https://doi.org/10.7554/eLife.31023.041
-
Supplementary file 4
Oligonucleotide sequences.
The table lists all oligonucleotides used in this study, including gRNAs, siRNAs, shRNAs and primers used for enChIP-qPCR, ChIP-qPCR and RT-qPCR.
- https://doi.org/10.7554/eLife.31023.042
-
Transparent reporting form
- https://doi.org/10.7554/eLife.31023.043
Download links
A two-part list of links to download the article, or parts of the article, in various formats.
Downloads (link to download the article as PDF)
Open citations (links to open the citations from this article in various online reference manager services)
Cite this article (links to download the citations from this article in formats compatible with various reference manager tools)
NuRD and CAF-1-mediated silencing of the D4Z4 array is modulated by DUX4-induced MBD3L proteins
eLife 7:e31023.
https://doi.org/10.7554/eLife.31023


