Cognitive regulation alters social and dietary choice by changing attribute representations in domain-general and domain-specific brain circuits
- California Institute of Technology, United States
- University of Toronto Scarborough, Canada
- University of Toronto, Canada
Figures
Figure 1 with 1 supplement
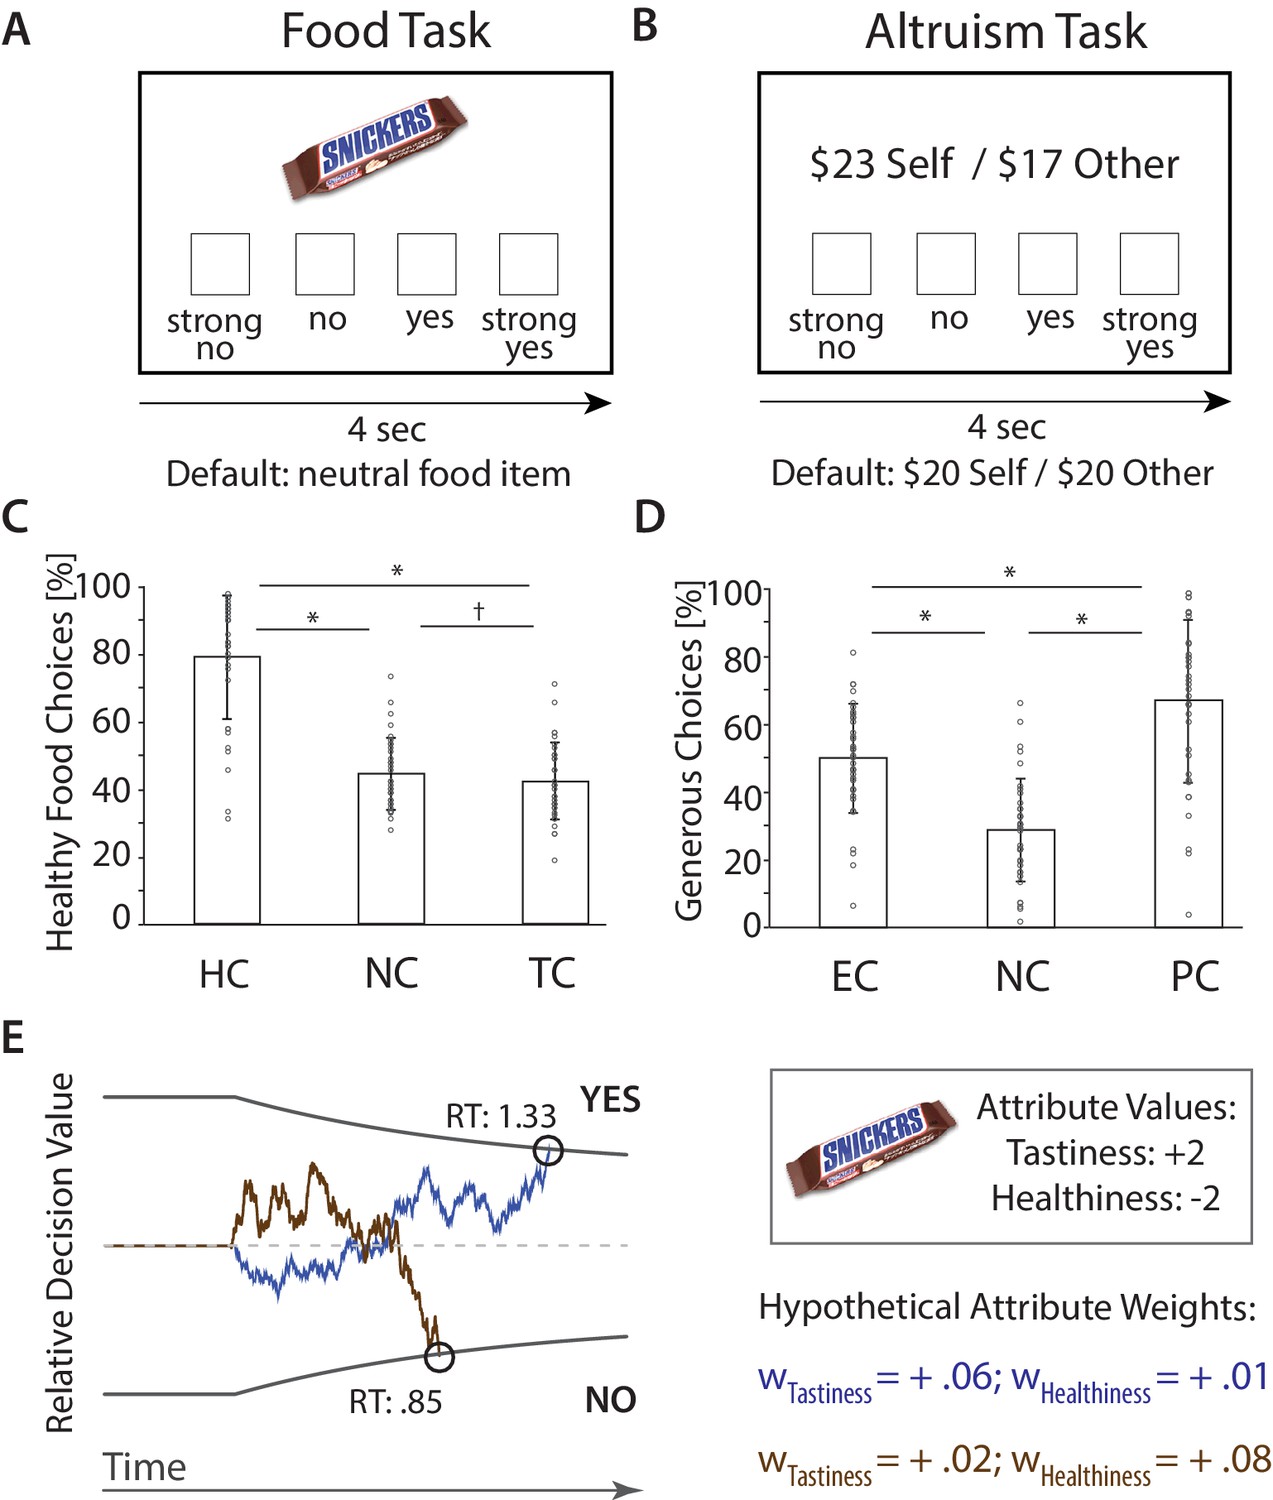
fMRI Paradigms and Choices.
(A) Food Task. Subjects chose between on-screen food items that varied in tastiness and healthiness and a neutral default food. Choices were made in ‘Natural’ [NC], ‘Focus on Health’ [HC], and ‘Focus on Taste’ Conditions [TC]. (B) Altruism Task. Subjects chose between on-screen proposals that affected the payoff of themselves ($Self) and an anonymous partner ($Other) and a default option ($20 for both). Choices were made in ‘Natural’ [NC], ‘Focus on Ethics’ [EC], and ‘Focus on Partner’ Conditions [PC]. (C) (D). Bar plots illustrate condition-wise percentages of healthy (C) and generous (D) choices (M ± SD), and subject-specific scores (circles). *p < 0.05, corrected, †p < 0.05, uncorrected. (E) Computational behavioral model (DDM). Choices (yes/no) are made when the sequential accumulation of noisy value information that unfolds over time crosses the predefined upper or lower threshold for choice. The relative decision value (RDV) at a point in time (t) is computed as the weighted sum of choice relevant attributes plus noise (ε) (i.e., RDVt = RDVt-1 + wTastiness * Tastiness + wHealthiness * Healthiness + εt). In the example displayed here, the value of a candy bar will tend to accumulate in a positive direction if the weight on Tastiness is high (blue line), yielding a choice in favor of a tasty but unhealthy item. However, the value of the food item is more likely to accumulate in a negative direction if the weight on Healthiness is high (brown line). Note that saying Yes can sometimes indicate a healthy choice, and sometimes an unhealthy choice. (RT = reaction times [sec]; figure adapted from [Hutcherson et al., 2015b; Adolphs and Tusche, 2017]).
Figure 1—figure supplement 1
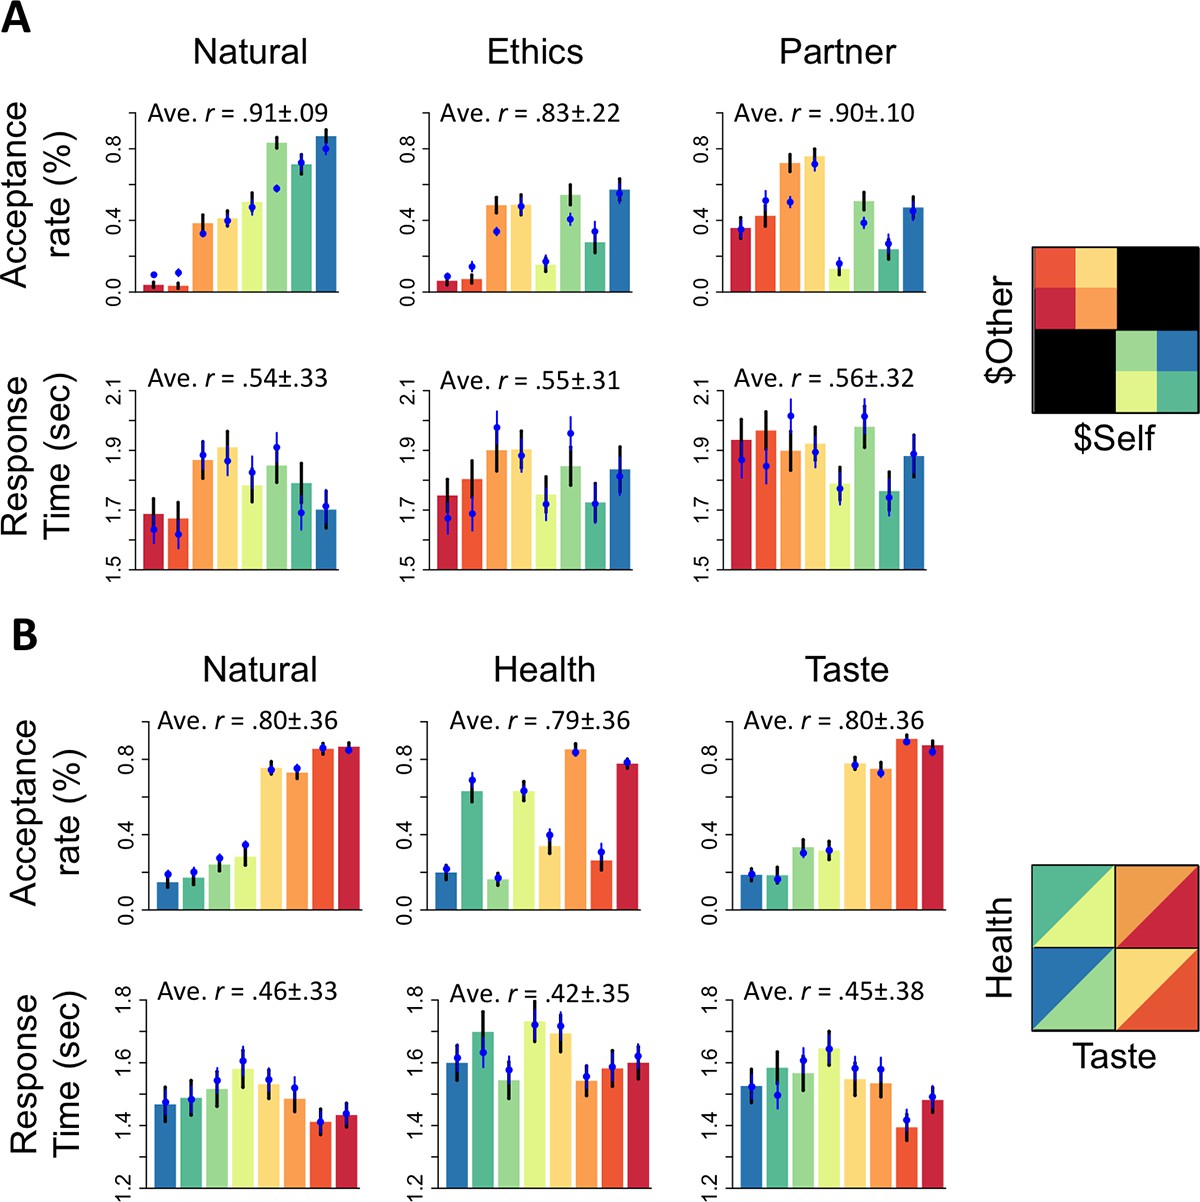
Drift diffusion model (DDM) fits to behavior in both choice tasks.
(A) Correspondence in the altruism task between observed acceptance rates (top) and response times (bottom) for different proposal types (bars) and model predictions (blue circles, determined using best-fitting parameters for each subject). On average, subject-level correlation between observed and predicted acceptance rates across trial types was generally quite high. (B) Correspondence in the food task between observed and model-predicted acceptance rates (top) and response times (bottom) for foods of varying taste and healthiness (subject-specific ratings outside the scanner). For illustration purposes, for both tasks model fit to behavior is shown for eight bins created based on the displayed color scheme (right) for variations in choice-relevant attributes (increased attribute values from left to right). Thus, bar colors correspond to trials with specified combination of attributes.
Figure 2 with 1 supplement
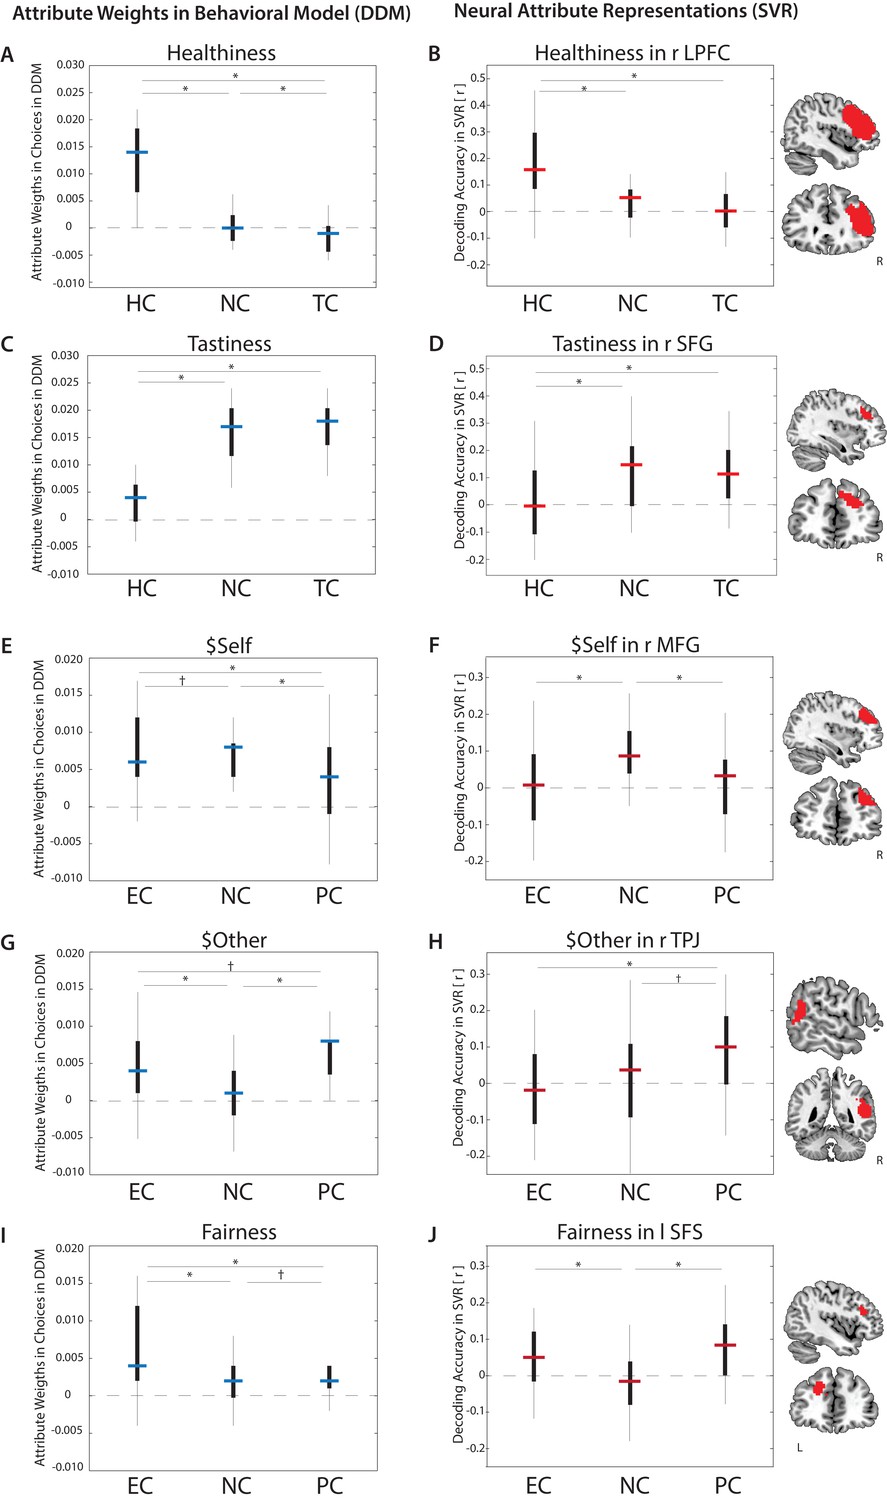
Goal-dependent modulation of attribute value encoding.
Behavioral weights (left column) assigned to attributes in food choices (A. Healthiness, C. Tastiness) or altruistic choices (E. $Self, G. $Other, I. Fairness) varied by regulatory goal (estimates of drift diffusion models, DDMs). Neural decoding accuracies of attribute values (right column) also varied across conditions in specific brain regions (B. Healthiness, D. Tastiness, F. $Self, H. $Other, J. Fairness) (p < 0.05, FWE corrected at cluster-level) (estimates of Support Vector Regression models, SVRs). Bars represent median estimates (blue = behavioral DDMs, red = neural SVRs; black boxes signify 25–75 percentile, lines illustrate the overall distribution), HC = Health Condition, NC = Natural Condition, TC = Taste Condition, PC = Partner Condition, EC = Ethics Condition, L = left hemisphere, R = right hemisphere, LPFC = Lateral Prefrontal Cortex, SFG = Superior Frontal Gyrus, MFG = Mid Frontal Gyrus, TPJ = Temporoparietal Junction, SFS = Superior Frontal Gyrus.
Figure 2—figure supplement 1

Goal-dependent modulation of neural value encoding in DMPFC ($Self) and Precuneus ($Other) in the altruism task.
Panel displays average decoding accuracies for clusters where neural representations of attributes varied across regulation conditions for neural Support Vector Regressions (SVRs) (p<0.001, FWE corrected at cluster-level). Bars represent median estimates; black boxes signify 25–75 percentile, lines illustrate the overall distribution. HC = Health Condition, NC = Natural Condition, TC = Taste Condition, PC = Partner Condition, EC = Ethics Condition, L = left hemisphere, R = right hemisphere.
Figure 3 with 2 supplements

Conjunction of neural representations of attribute values.
Multivariate response patterns in the VMPFC encoded trial-wise values of all choice-relevant food attributes (Tastiness, Healthiness) and altruistic attributes ($Self, $Other, Fairness) across regulation conditions, as indicated by a conjunction of attribute-specific decoding maps thresholded at p < 0.05, FWE corrected at cluster-level.
Figure 3—figure supplement 1

Conjunction of brain areas that encoded trial-by-trial values of all attributes.
Attribute values for Healthiness, Tastiness, $Self, $Other, Fairness. Each attribute was thresholded at p < 0.001, cluster-level corrected, k = 10 voxels. Not displayed are clusters in the supplemental motor area ([MNI −3 26, 46], 43 voxels) and visual cortex ([MNI −28,–85, 32], 15 voxels, [MNI −21,–67, 40], 10 voxels). Coordinates refer to center of mass for the identified clusters in MNI space (Montreal Neurological Institute), R = right hemisphere.
Figure 3—figure supplement 2
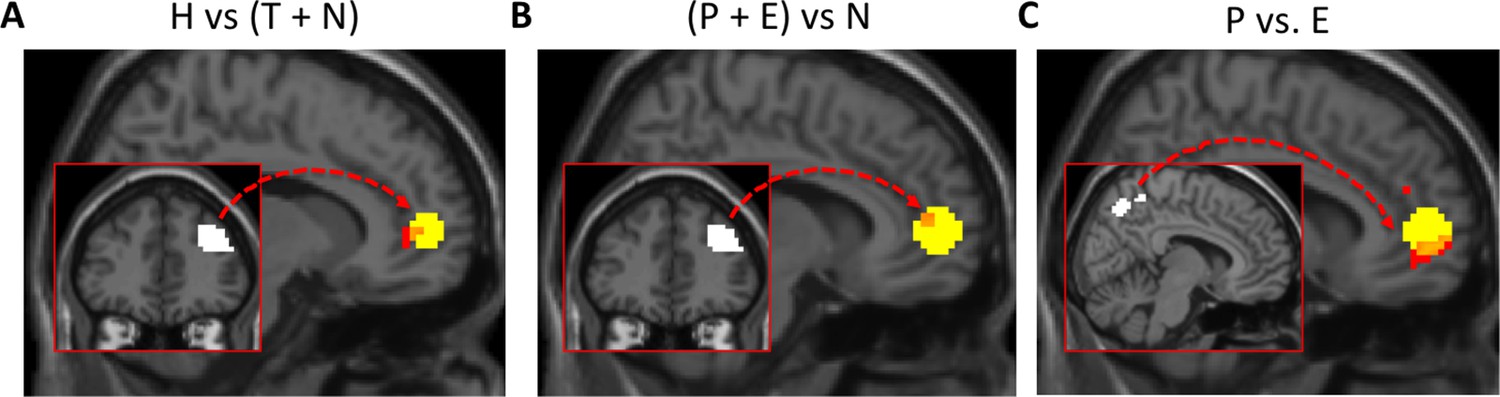
Exploratory functional connectivity analyses.
(A) Region of the VMPFC (red) where increased connectivity with the DLPFC during Health vs. Natural and Taste focus conditions correlates with Δw Healthiness in Health vs. Natural and Taste Focus. The yellow region shows the VMPFC ROI defined by the conjunction of all attributes. Orange indicates overlap. Inset: DLPFC seed region. (B) Region of the VMPFC (red) where decreased connectivity with the DLPFC during Partner and Ethics conditions compared to Natural predicted decreases in Δw $Self in Partner and Ethics vs. Natural condition. The yellow region shows the VMPFC ROI defined by the conjunction of all attributes. Inset: DLPFC seed region. (C) Region of the Precuneus where increased connectivity with the VMPFC during Partner vs. Ethics conditions Δw $Other weight in Partner vs. Ethics trials. Yellow region shows the VMPFC ROI defined by the conjunction of all attributes. Inset: Precuneus seed region. All results are shown thresholded at p < 0.005 uncorrected.
Figure 4
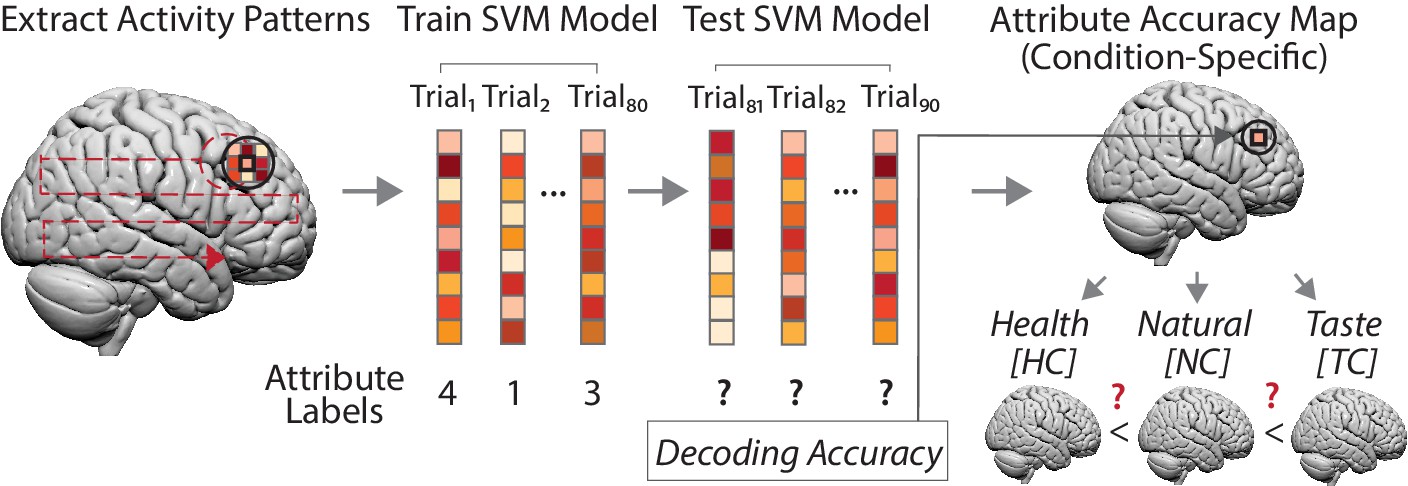
Goal-dependent coding of attribute values (left to right).
For each participant, we created a spherical searchlight (left panel, black sphere) and extracted multi-voxel response patterns for every trial of a choice task (middle panel). Next, we trained a support vector machine (SVM) regression model with data of 8 runs (80 trials), using neural response patterns as features and trial-wise attribute values as labels (e.g. a food’s perceived tastiness). Test data consisted of data of the ninth run (10 trials) for which we predicted the trial-wise attribute values solely based on neural response patterns of these trials. The decoding accuracy (average of 9-fold cross-validation) was assigned to the central voxel of the sphere from which we extracted the neural data (right upper panel). This procedure was repeated for every measured voxel (left panel, dotted red line), yielding a whole brain accuracy map for an attribute, separately for each task condition and participant. Finally, at the group level (lower right panel), we used these whole-brain accuracy maps to test for brain regions where predictive information on an attribute was increased/decreased depending on the task condition, based on predictions of the behavioral computational model (DDM). (Note that condition-specific accuracy maps also allowed testing for main effects of neural encoding of an attribute (i.e. encodes attribute values), irrespective of whether one or several conditions drive the effect.).
Figure 5
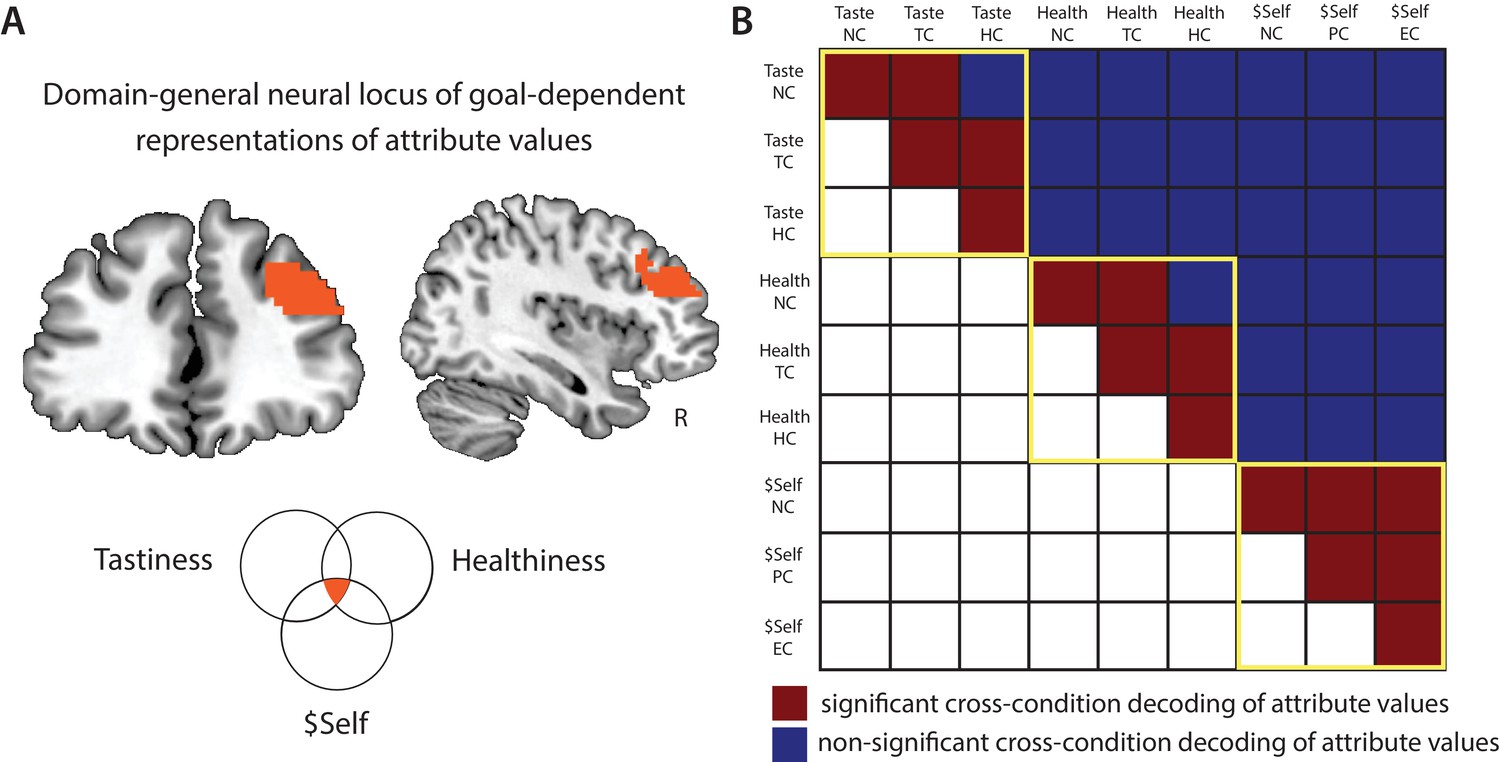
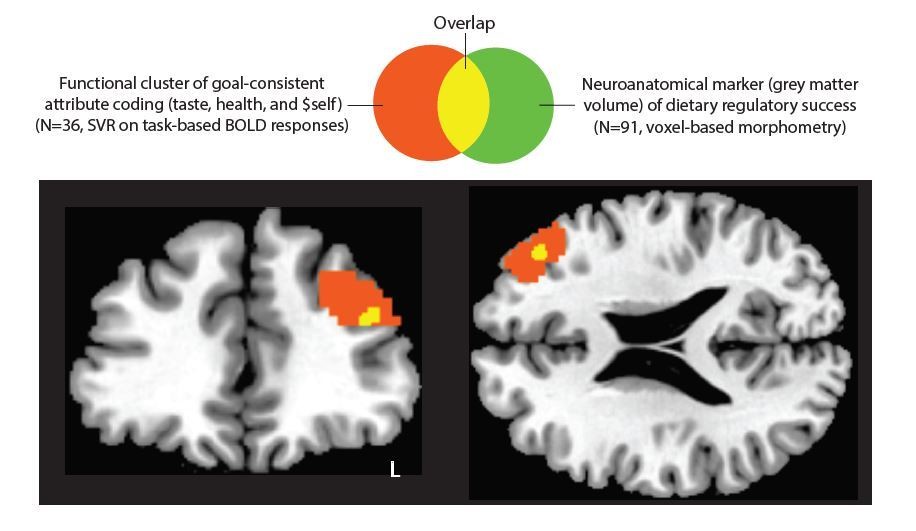
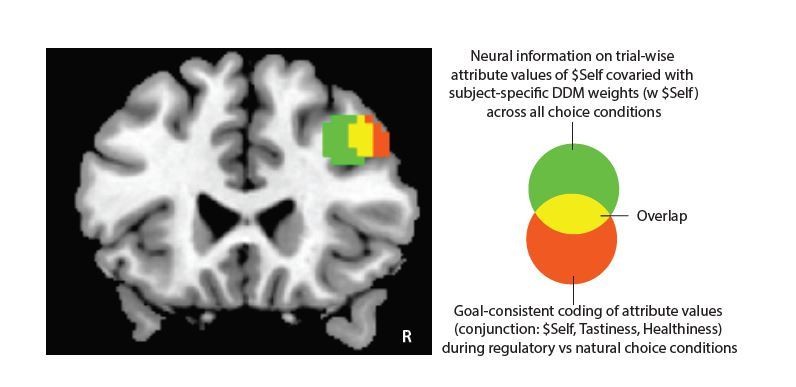
Domain-general locus of goal-dependent attribute coding.
(A) Conjunction of voxels in DLPFC that flexibly encoded attribute values of Healthiness, Tastiness, and $Self across conditions within the respective task (p < 0.05, FWE corrected at cluster-level). (B) Cross-condition decoding analyses tested for shared neural code in the DLPFC conjunction area across attributes and regulatory goals. Multivariate SVR models were trained on data in one condition (e.g. Taste NC) and tested on another (e.g. Taste TC), and vice versa (2-fold cross-validation; within-cell sanity checks used split-half approach). Red illustrates significant cross-condition decoding, blue illustrates non-significant results (permutation tests, cutoff-values of 95th percentile of empirical null-distribution). Within-attribute decoding (yellow frames): similar neural codes in DLPFC encode values of an attribute across contexts/regulatory conditions (with the exception of 2 of 18 tests). Cross-attribute decoding: neural response patterns that encode values of one attribute don’t allow predicting values of another attribute (neither within-task [tastiness-healthiness] nor across tasks [tastiness-$Self, healthiness-$Self]), independent of contexts. This pattern of results indicates that goal-sensitive representations of attribute values in DLPFC rely on attribute-specific neural codes.
Author response image 1
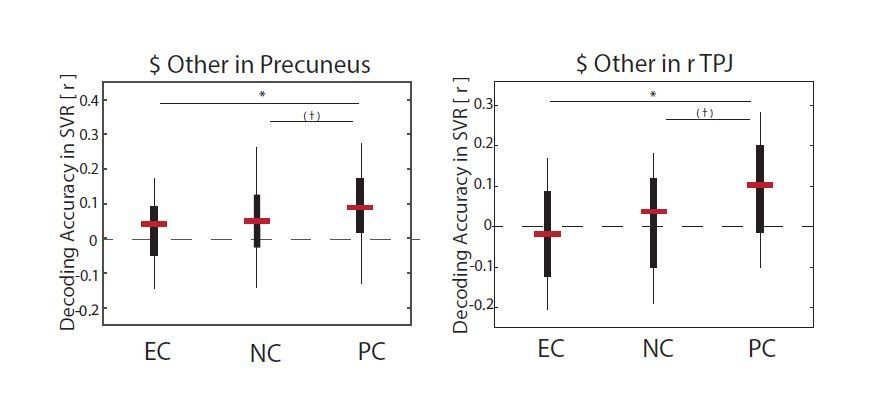
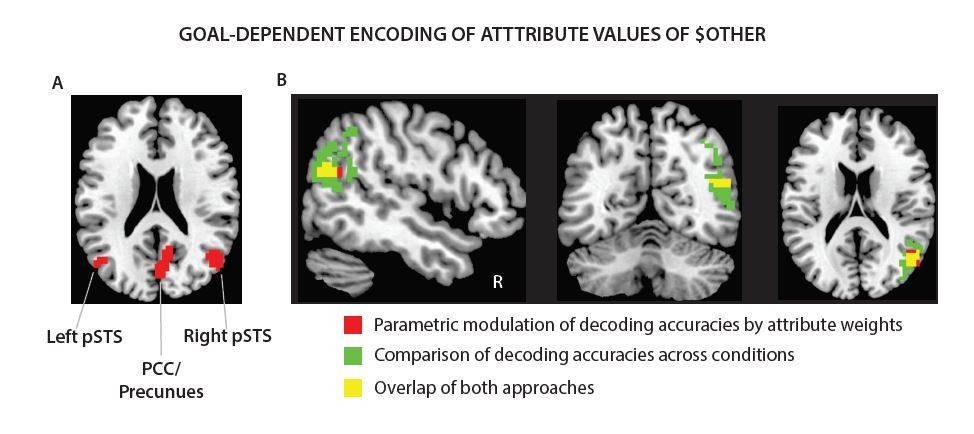
Multi-voxel response patterns in the precuneus reliably predicted individuals’ altered generosity in the altruism task (ΔGenerous Choices [PC – EC]: r = 0.57, p = 0.002 [CI: -0.41, 0.38]; ΔGenerous Choices [(NC, PC) – EC]: r = 0.61, p = 0.004 [CI: -0.41, 0.41]).
This finding is consistent with the pattern of results on goal-dependent encoding of others benefits in this brain region (left panel). Response patterns in the rTPJ, on the other hand, did not significantly predict individual’s goal-dependent changes in generosity (all p’s ≥ 0.065).
Author response image 2

The figure illustrates two VMPFC-ROIs used for the supplemental analyses.
https://doi.org/10.7554/eLife.31185.020
Author response image 3
Author response image 4
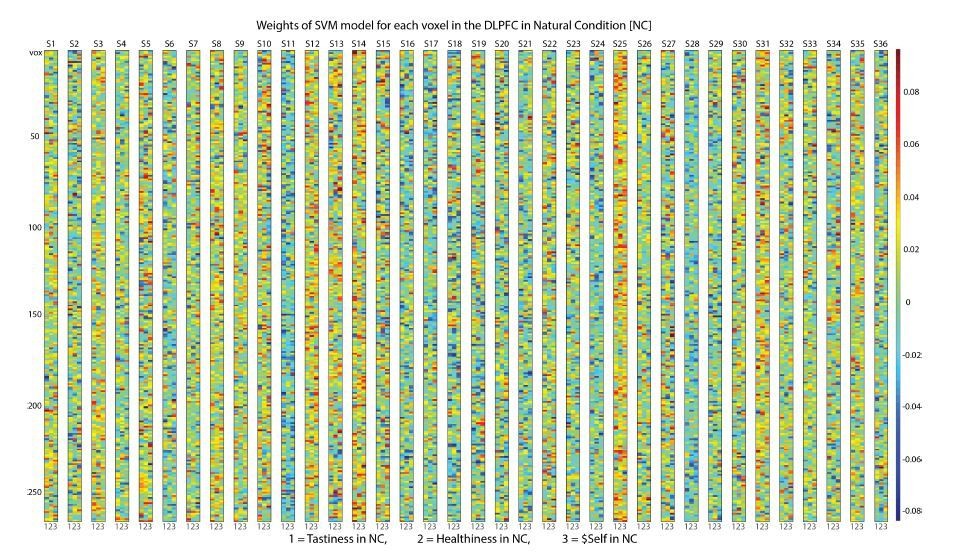
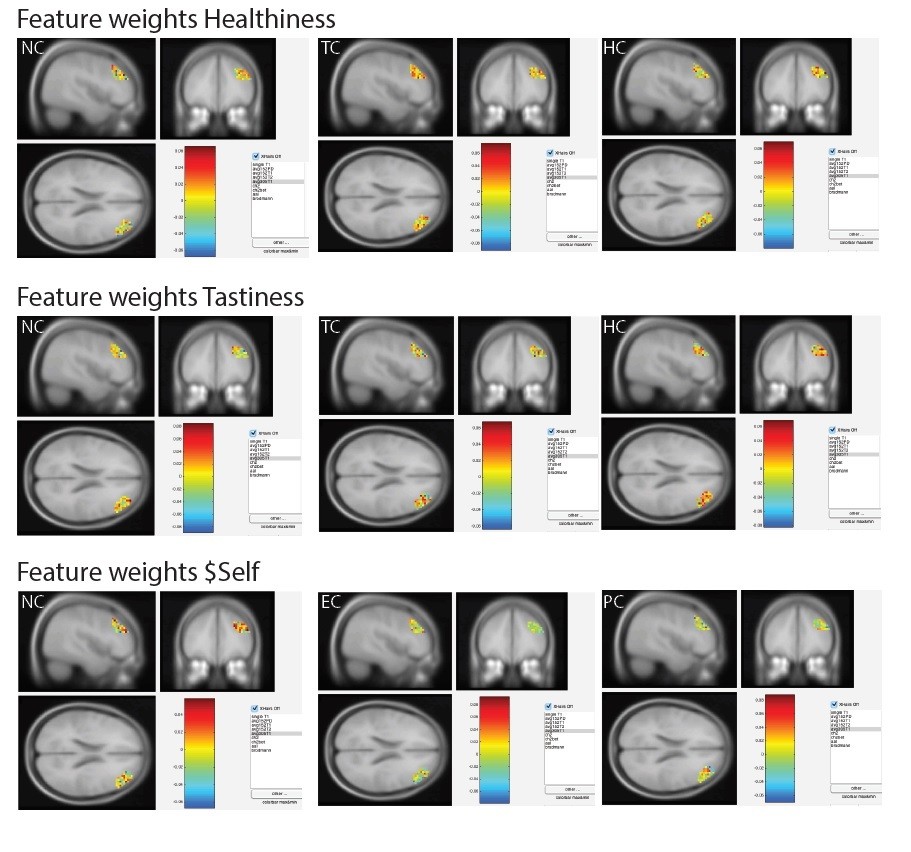
Voxel-wise feature weights of the Support Vector Regression Model in Natural trials [NC] in both choice tasks.
https://doi.org/10.7554/eLife.31185.022
Author response image 5
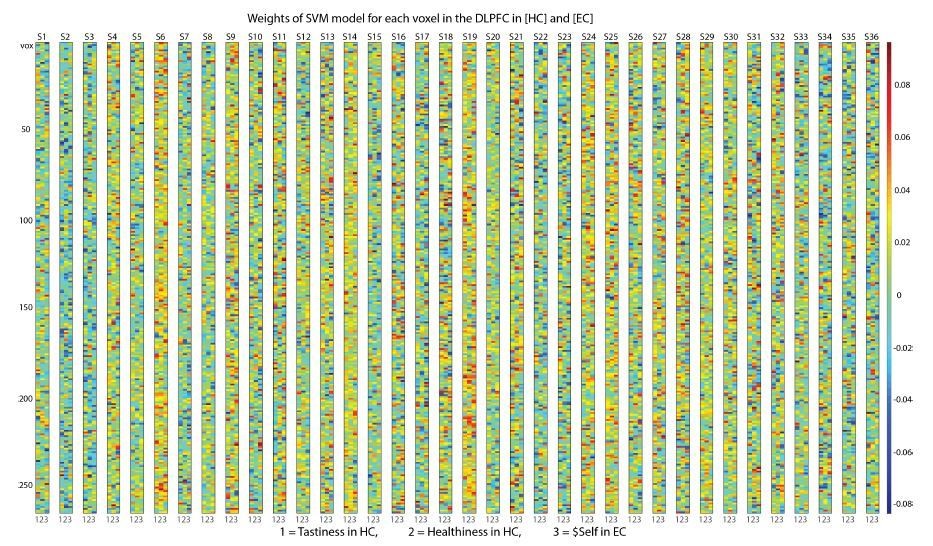
Voxel-wise feature weights of the Support Vector Regression Model in Health [HC] and Ethics trials [EC].
https://doi.org/10.7554/eLife.31185.023
Author response image 6

Voxel-wise feature weights of the Support Vector Regression Model in Taste [HC] and Partner trials [PC].
https://doi.org/10.7554/eLife.31185.024
Author response image 7
Author response image 8

Author response image 9
Author response image 10
Tables
Table 1
Correlation of regulatory success (RS) in both choice tasks.
https://doi.org/10.7554/eLife.31185.004| Regulatory Success (RS) in Food Task | ||||
|---|---|---|---|---|
| RS [HC - NC] | RS [HC - TC] | RS [NC - TC] | ||
| RS in Altruism Task | ΔRS [PC - NC] | 0.52 * | 0.56 * | 0.33 † |
| ΔRS [EC - NC] | 0.37 † | 0.37 † | 0.14 | |
| ΔRS [PC - EC] | 0.48 * | 0.53 * | 0.38 † | |
-
*p < 0.05 Bonferroni corrected, †p < 0.05 uncorrected; HC = Health Condition, NC = Natural Condition, TC = Taste Condition, PC = Partner Condition, EC = Ethics Condition
Table 2
Model-estimated weights (w) assigned to choice-relevant attributes in the food task and altruism task (DDMs).
https://doi.org/10.7554/eLife.31185.007| Attributes | Sample size (N) | Regulation Conditions in Food Task | ||
|---|---|---|---|---|
| Mean (±SD) | Mean (±SD) | Mean (±SD) | ||
| Natural [NC] | Focus on Health [HC] | Focus on Taste [TC] | ||
| w Healthiness | 36 | −0.0003 (±0.0040) | 0.0121 (±0.0074) | −0.0019 (±0.0037) |
| w Tastiness | 36 | 0.0163 (±0.0054) | 0.0044 (±0.0064) | 0.0167 (±0.0051) |
| Regulation Conditions in Altruism Task | ||||
| Natural [NC] | Focus on Partner [PC] | Focus on Ethics [EC] | ||
| w $Self | 49 | 0.0082 (±0.0038) | 0.0037 (±0.0057) | 0.0070 (±0.0050) |
| w $Self | 36 | 0.0082 (±0.0040) | 0.0037 (±0.0059) | 0.0068 (±0.0049) |
| w $Other | 49 | 0.0010 (±0.0039) | 0.0059 (±0.0040) | 0.0047 (±0.0049) |
| w $Other | 36 | 0.0009 (±0.0039) | 0.0057 (±0.0040) | 0.0048 (±0.0049) |
| w Fairness | 49 | 0.0018 (±0.0034) | 0.0029 (±0.0035) | 0.0062 (±0.0056) |
| w Fairness | 36 | 0.0019 (±0.0035) | 0.0026 (±0.0036) | 0.0062 (±0.0058) |
Table 3
Neural prediction of trial-wise attribute values in food choices and altruistic choices.
https://doi.org/10.7554/eLife.31185.008| Brain region | Side | T | k | MNI | ||
|---|---|---|---|---|---|---|
| x | y | z | ||||
| Main Effect of Healthiness | ||||||
| Dorsolateral Prefrontal Cortex (DLPFC) | L | 5.83 | 24 | −57 | 23 | 34 |
| Lateral PFC (LPFC) | L | 6.29 | 45 | −42 | 35 | 4 |
| LPFC | R | 5.83 | 17 | 54 | 41 | 19 |
| Ventromedial PFC (VMPFC) | R/L | 5.69 | 6 | -3 | 47 | −20 |
| Main Effect of Tastiness | ||||||
| VMPFC, extends to Mid (MFG) and Superior Frontal Gyrus (SFG) | L/R | 8.29 | 1097 | -9 | 50 | -2 |
| Inferior Parietal Lobe (IPL)/Supramarginal Gyrus (SMG) | R | 6.01 | 39 | 48 | −46 | 46 |
| Pre-Supplemental Motor Area (pre-SMA) | L | 7.06 | 82 | -3 | 23 | 46 |
| SMA | L/R | 6.51 | 100 | 6 | 5 | 70 |
| Motor Cortex | L | 8.85 | 410 | −42 | −28 | 58 |
| Visual Cortex | L | 7.68 | 288 | −30 | −91 | 25 |
| Visual Cortex/IPL/Precuneus | L/R | 7.23 | 1814 | 6 | −61 | 34 |
| Cerebellum | L | 6.23 | 9 | −27 | −70 | −35 |
| Main Effect of $Self * | ||||||
| Prefrontal Cortex (VLPFC, DLPFC, VMPFC, DMPFC) | L/R | 5.39 | 1306 | −27 | 50 | 19 |
| SMA | L/R | 4.42 | 111 | 3 | -1 | 55 |
| Visual Cortex | L/R | 6.94 | 2901 | -3 | −82 | 4 |
| Main Effect of $Other | ||||||
| Dorsomedial PFC (DMPFC) | L/R | 7.16 | 485 | -3 | 44 | 25 |
| VMPFC | R | 5.92 | 108 | 18 | 50 | -2 |
| LPFC | L | 5.58 | 12 | −39 | 32 | 19 |
| Inferior Frontal Gyrus (IFG) | L | 5.51 | 10 | −48 | 26 | -5 |
| SMA | R | 5.54 | 15 | 6 | 23 | 46 |
| Visual cortex | L/R | 7.87 | 661 | -3 | −79 | 4 |
| Cuneus | L | 5.71 | 74 | −24 | −76 | 40 |
| Main Effect of Fairness | ||||||
| Prefrontal Cortex (includes MPFC, MFG, IFG, right anterior insula) | L/R | 7.54 | 1866 | 45 | 23 | 34 |
| VMPFC | R | 5.84 | 67 | 24 | 59 | 7 |
| Precuneus | L/R | 6.25 | 60 | 0 | −73 | 46 |
| SMG | R | 6.22 | 72 | 60 | −37 | 46 |
| IPL | L | 5.52 | 7 | −39 | −55 | 43 |
| Visual cortex | R | 6.07 | 95 | 12 | −88 | 10 |
-
Results are reported at a statistical threshold of p < 0.05, FWE corrected at voxel-level (cluster threshold of 5 voxels); * main effect for $Self reported at a statistical threshold of p < 0.05, FWE corrected at cluster-level (height threshold of p < 0.001); only peak activations of clusters are reported; L = left hemisphere, R = right hemisphere, MNI = Montreal Neurological Institute, k = cluster size in voxel
Table 4
Goal-dependent change of neural information content on attribute values.
https://doi.org/10.7554/eLife.31185.013| Attribute | Brain region | Side | T | k | MNI | ||
|---|---|---|---|---|---|---|---|
| x | y | z | |||||
| Healthiness | |||||||
| [HC > (NC, TC)] | (D)LPFC | R | 4.40 | 402 | 51 | 23 | 25 |
| Visual Cortex | L/R | 6.38 | 593 | 0 | −79 | 7 | |
| [HC > NC] | (D)LPFC | R | 4.54 | 241 | 48 | 44 | 19 |
| Visual Cortex | L/R | 5.52 | 210 | −3 | −79 | 10 | |
| [HC > TC] | (D)LPFC | R | 4.28 | 212 | 51 | 23 | 25 |
| Visual Cortex | L/R | 6.51 | 910 | 3 | −82 | 1 | |
| Tastiness | |||||||
| [(NC, TC) > HC] | SFG | R | 4.58 | 362 | 24 | 35 | 37 |
| Motor Cortex | L | 4.46 | 265 | −36 | −16 | 37 | |
| Visual Cortex | L/R | 5.19 | 230 | −3 | −70 | 1 | |
| [NC > HC] | SFG | R | 4.08 | 227 | 24 | 35 | 40 |
| Visual Cortex | L/R | 4.39 | 159 | −3 | −70 | 1 | |
| R | 4.83 | 252 | 45 | −88 | 14 | ||
| [TC > HC] | SFG | R | 3.91 | 102 | 24 | 35 | 37 * |
| Motor Cortex | L | 4.48 | 319 | −48 | −22 | 64 | |
| Visual Cortex | L/R | 4.73 | 123 | −3 | −73 | 1 | |
| $Self | |||||||
| [NC > (EC, PC)] | DMPFC | L/R | 4.18 | 127 | −12 | 53 | 46 |
| [NC > EC] | DMPFC | L/R | 4.14 | 98 | −3 | 44 | 43 |
| MFG | R | 3.88 | 52 | 39 | 50 | 34 * | |
| $Other | |||||||
| [PC > EC] | Precuneus | L | 4.45 | 648 | −15 | −67 | 46 |
| Temporoparietal junction (TPJ) | R | 3.85 | 170 | 51 | −61 | 16 | |
| Visual cortex | L/R | 4.26 | 276 | −3 | −64 | 4 | |
| [(PC, NC) > EC] | Precuneus/TPJ | L/R | 4.70 | 1142 | 12 | −61 | 49 |
| SMA | L | 4.50 | 189 | −18 | 5 | 67 | |
| Fairness | |||||||
| [(EC, PC) > NC] | Mid Cingulate Cortex/MFG | L | 5.19 | 118 | −15 | 23 | 31 |
| [PC > NC] | Mid Cingulate Cortex/MFG | L | 5.18 | 183 | −15 | 23 | 31 |
-
Results are reported at a statistical threshold of p < 0.05, FWE corrected at cluster-level (height threshold of p < 0.001), * indicates clusters that were FDR-corrected at the cluster level; only peak activations of clusters are reported; L = left hemisphere, R = right hemisphere, MNI = Montreal Neurological Institute, k = cluster size in voxels.
Additional files
-
Supplementary file 1
Supplemental tables.
(A) Drift diffusion model (DDM) parameters and RTs. Table reports Mean and Standard Deviations (±SD). b = initial height of the barrier; d = rate of decay for collapsing barriers; NDT = non decision time.; RTs = reaction times. Results for the Altruism Task are reported both for full sample (N = 49), and for the subset of participants that also completing the Food Task (N = 36).
(B) Support vector regressions (SVRs) of decision values (DV) in both choice tasks. Results for goal-independent encoding of DVs (Main effect for DV, averaged information content across three conditions in each task) are reported at a statistical threshold of p < 0.05, FWE corrected at voxel-level; † indicates results for goal-dependent variations in DV (repeated measures ANOVAs across three conditions in each task) reported at p < 0.001, FWE cluster-corrected at p < 0.05, k = 10 voxels; only peak activations of clusters are reported; L = left hemisphere, R = right hemisphere, k = cluster size in voxels, MNI = Montreal Neurological Institute.
(C) Correlation of regulatory success in goal-dependent attribute weighting across choice domains. Correlation coefficients for change scores in attribute weights (w) in food choices and altruistic choices estimated in two separate DDMs. Successful reduction in the weight on selfish considerations (Δw $Self) in altruistic choices was correlated with successfully amplifying the weight on health considerations (Δw Healthiness) suppressing the weight of taste considerations (Δw Tastiness) in food choices. Changes in the ability to increase social considerations (Δw Other) were not correlated to goal-consistent changes in food attributes. Δw Tastiness [NC - TC] is not displayed, as estimated attribute weights did not significantly differ between conditions. Note also that differences scores in Δw Healthiness [NC - TC] (last column) were minimal, limiting the interpretability of the respective correlation analyses.
(D) Decoding of individual differences in regulatory success in DLPFC (altruism task). Decoding of individual differences in regulation success based on response patterns in right DLPFC (Figure 5A) obtained in the altruism task. Response patterns reliably predicted the extent of increased generous choice behavior. Consistent with key results reported in the main text, neural activation patterns also predicted individual’s increased healthy choices in a separate food task. Regarding altered attributes weights, predictive information in DLPFC was selective for subjects’ inhibition of $Self weights, but did not extend to altered weights on $Other or Fairness, confirming results reported in the main text. Higher-than-chance predictions are reported when decoding accuracy values exceeded the 95th percentile of empirical null-distribution (cutoff), obtained with 1000 replications of the analysis on permuted data sets.
(E) Univariate encoding of attributes in food task and altruism task. Regions reported as significant if they passed a cluster-corrected threshold p < 0.05, with a voxel-defining threshold of p < 0.001, uncorrected, unless otherwise noted. * Illustrates results significant at p < 0.001, uncorrected, reported for completeness: subgenual area did not overlap with the area of vmPFC that displayed overlapping representations of all attributes; only peak activations of clusters are reported; L = left hemisphere, R = right hemisphere, MNI = Montreal Neurological Institute, k = cluster size in voxels.
- https://doi.org/10.7554/eLife.31185.015
-
Transparent reporting form
- https://doi.org/10.7554/eLife.31185.016
Download links
A two-part list of links to download the article, or parts of the article, in various formats.
Downloads (link to download the article as PDF)
Open citations (links to open the citations from this article in various online reference manager services)
Cite this article (links to download the citations from this article in formats compatible with various reference manager tools)
Cognitive regulation alters social and dietary choice by changing attribute representations in domain-general and domain-specific brain circuits
eLife 7:e31185.
https://doi.org/10.7554/eLife.31185


