Telomere repeats induce domains of H3K27 methylation in Neurospora
- University of Oregon, United States
- University of Fukui, Japan
Figures
Figure 1 with 4 supplements
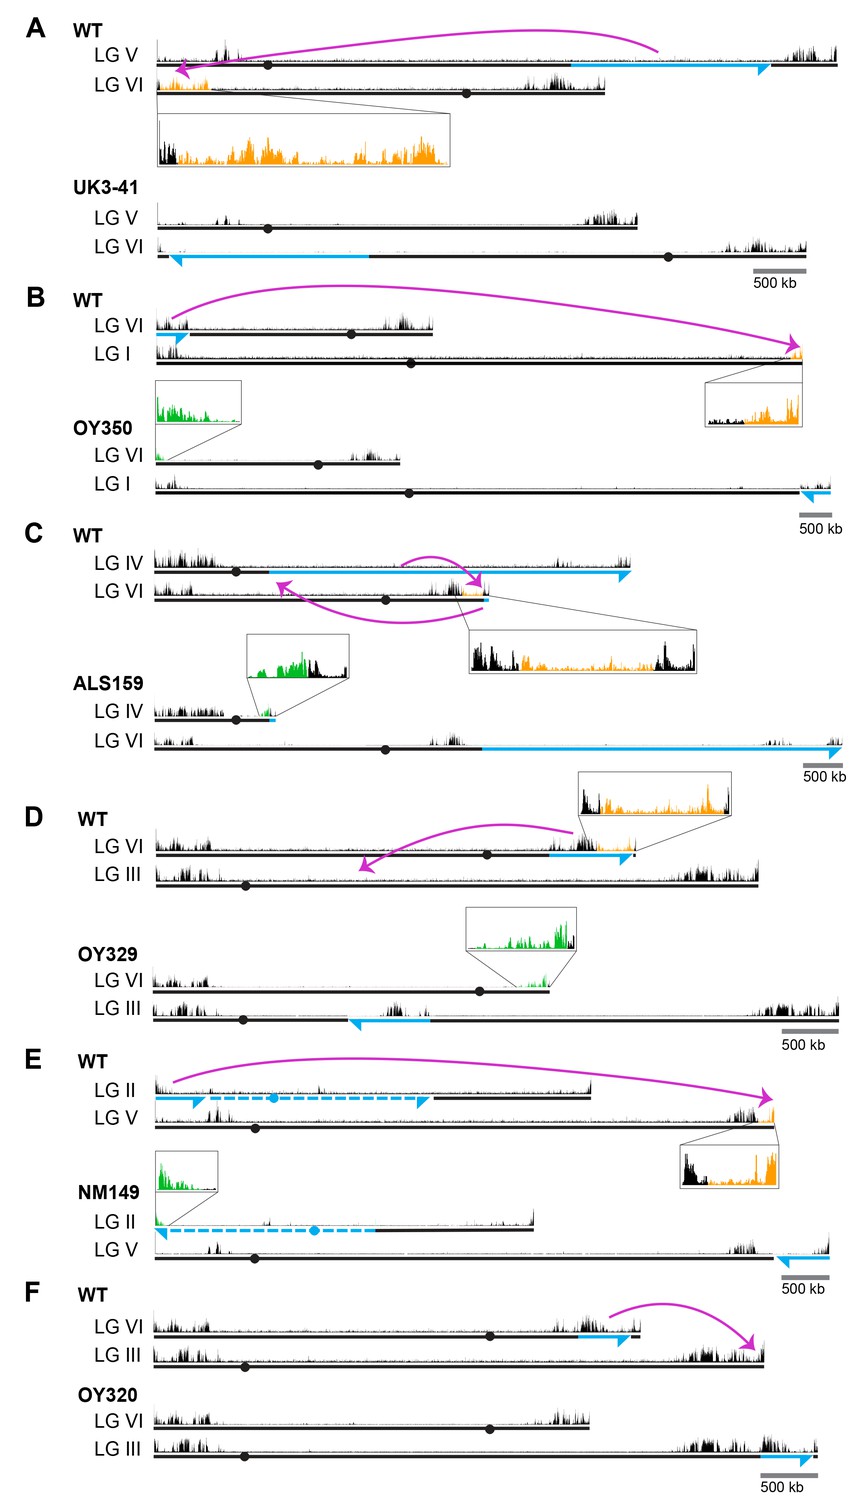
Chromosomal rearrangements are associated with altered H3K27me2/3.
(A–F) Schematics show the movement (magenta curved arrows) of translocated segments and the resulting chromosomal rearrangements for six translocation strains. ChIPs were done on biological triplicates and pooled for sequencing. Solid and dashed blue lines indicate source of translocated segments while arrowheads indicate directionality of rearranged segments. H3K27me2/3 ChIP-seq tracks of WT and translocation strains are displayed above chromosome diagrams with zoom-in sections in boxes. H3K27me2/3 signals that were lost in translocation strains are shown in orange, H3K27me2/3 signals gained are indicated in green and invariant H3K27me2/3 signals are shown in black. Circles indicate centromeres. Gains and losses of H3K27me2/3 were confirmed by qPCR (Figure 1—figure supplement 4).
Figure 1—figure supplement 1
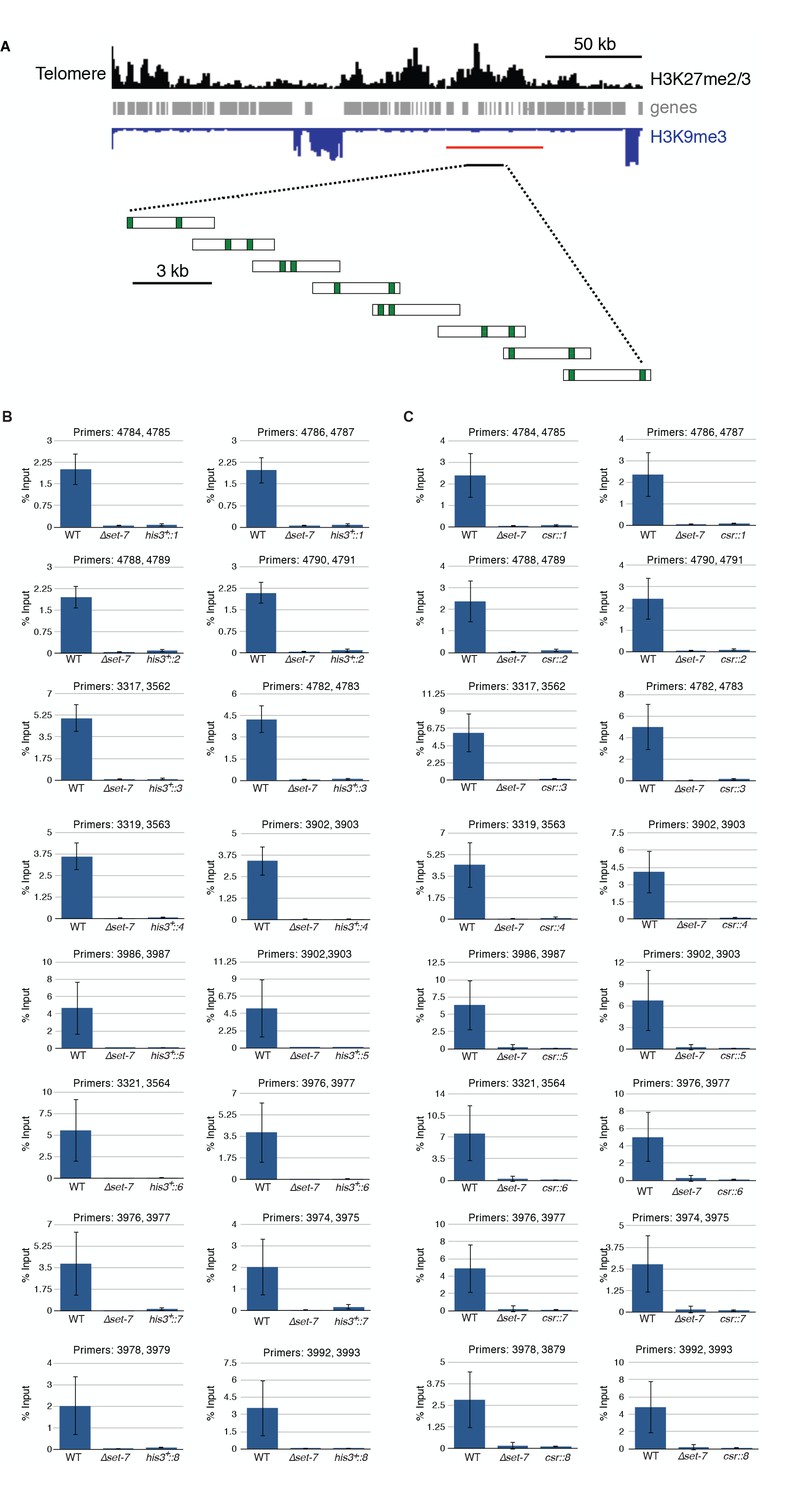
Three kilobase segments from a natural H3K27me2/3 domain are insufficient to trigger de novo H3K27me2/3 at ectopic loci.
(A) Distribution of H3K27me2/3 (black), genes (gray) and H3K9me3 (blue, inverted) are displayed for the left subtelomere of LG VI (Jamieson et al., 2013). The red bar indicates the region deleted for the transplantation experiments. The eight three kb segments (expanded below the black bar) were targeted to the his-3 and csr-1 loci. Green vertical bars represent the locations of qPCR primer pairs used in H3K27me2/3 ChIP experiments. H3K27me2/3 ChIP-qPCR indicates the absence of ectopic H3K27me2/3 in strains containing regions 1–8, each separately targeted to (B) his-3 and (C) csr-1. Each ChIP experiment was performed in biological triplicate; qPCR analyses were performed on each sample in technical triplicate. Bars represent means of biological triplicates and error bars show standard deviation. Primers are listed in Supplementary file 2.
Figure 1—figure supplement 2
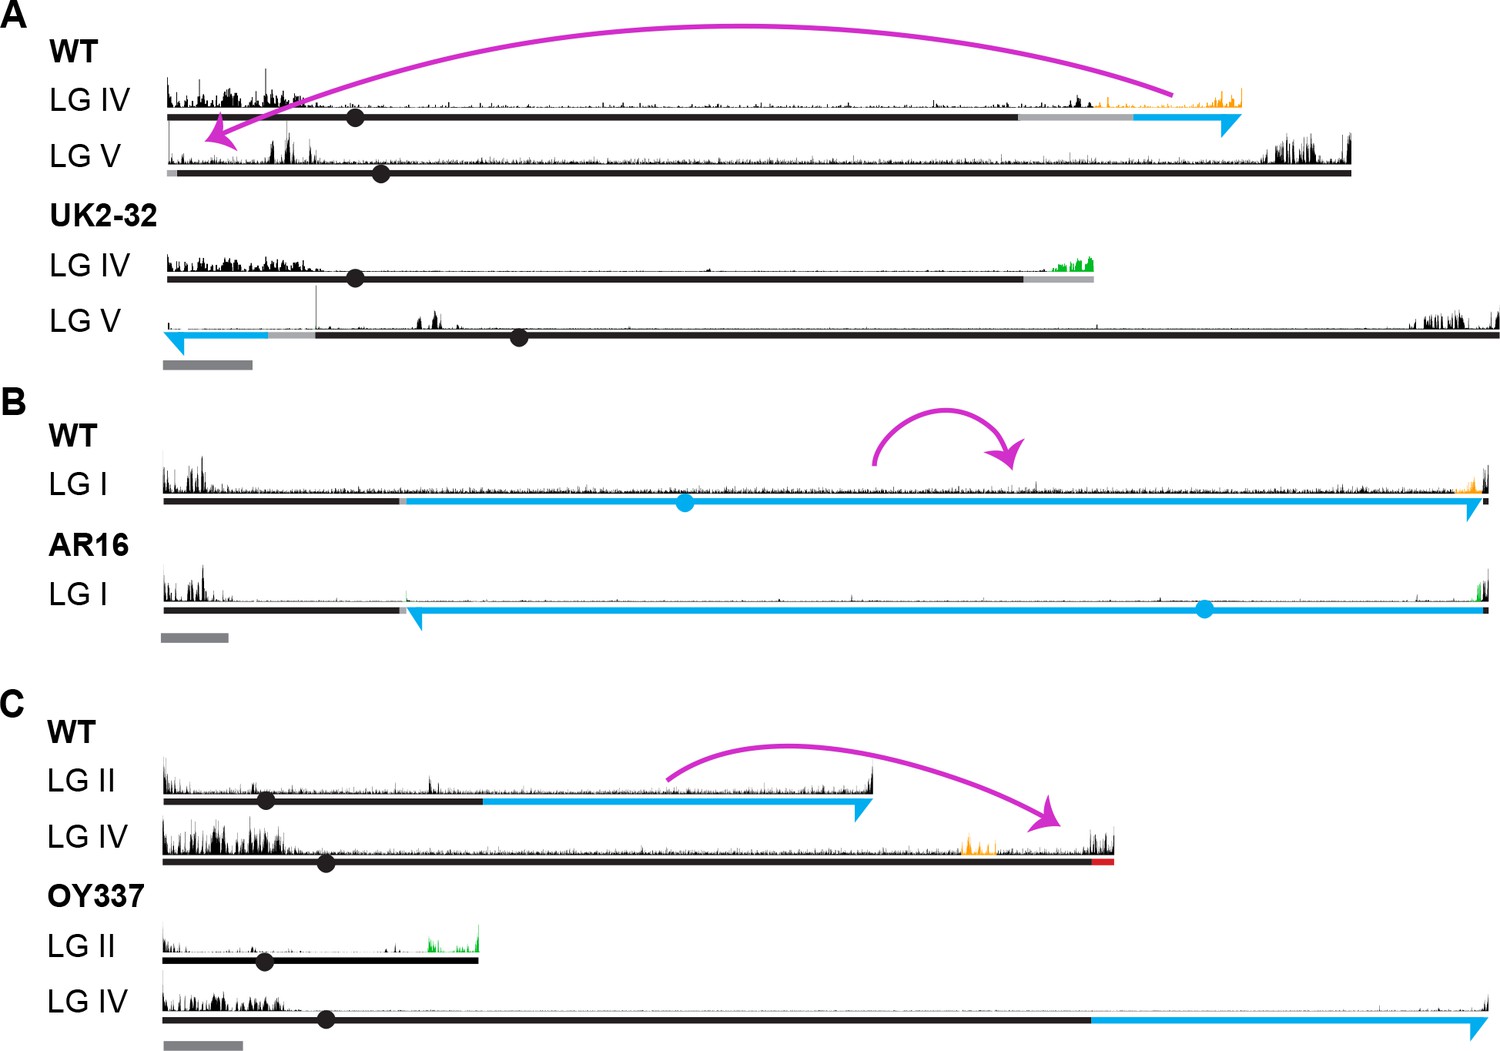
H3K27me2/3 profiles of additional strains containing chromosomal rearrangements.
Chromosome rearrangements and H3K27me2/3 ChIP-seq (pooled biological triplicates) profiles are shown for translocations UK2-32 (A), AR16 (B) and OY337 (C). Magenta curved arrows illustrate the movement of chromosomal segments in the translocations. Blue and dashed lines distinguish chromosome sources while arrows indicate the directionality of translocated segments. Light gray lines highlight regions of uncertainty with respect to the locations of breakpoints based on available genetic evidence (see Materials and methods). Solid red line indicates chromosome deletions. H3K27me2/3 ChIP-seq tracks of WT and translocation strains are displayed above chromosome diagrams. H3K27me2/3 that was lost in a translocation strain is highlighted in orange in the corresponding WT track while new H3K27me2/3 is indicated in green. Conserved H3K27me2/3 is shown in black. Circles indicate centromeres. Dark gray bars indicate 500 kb.
Figure 1—figure supplement 3
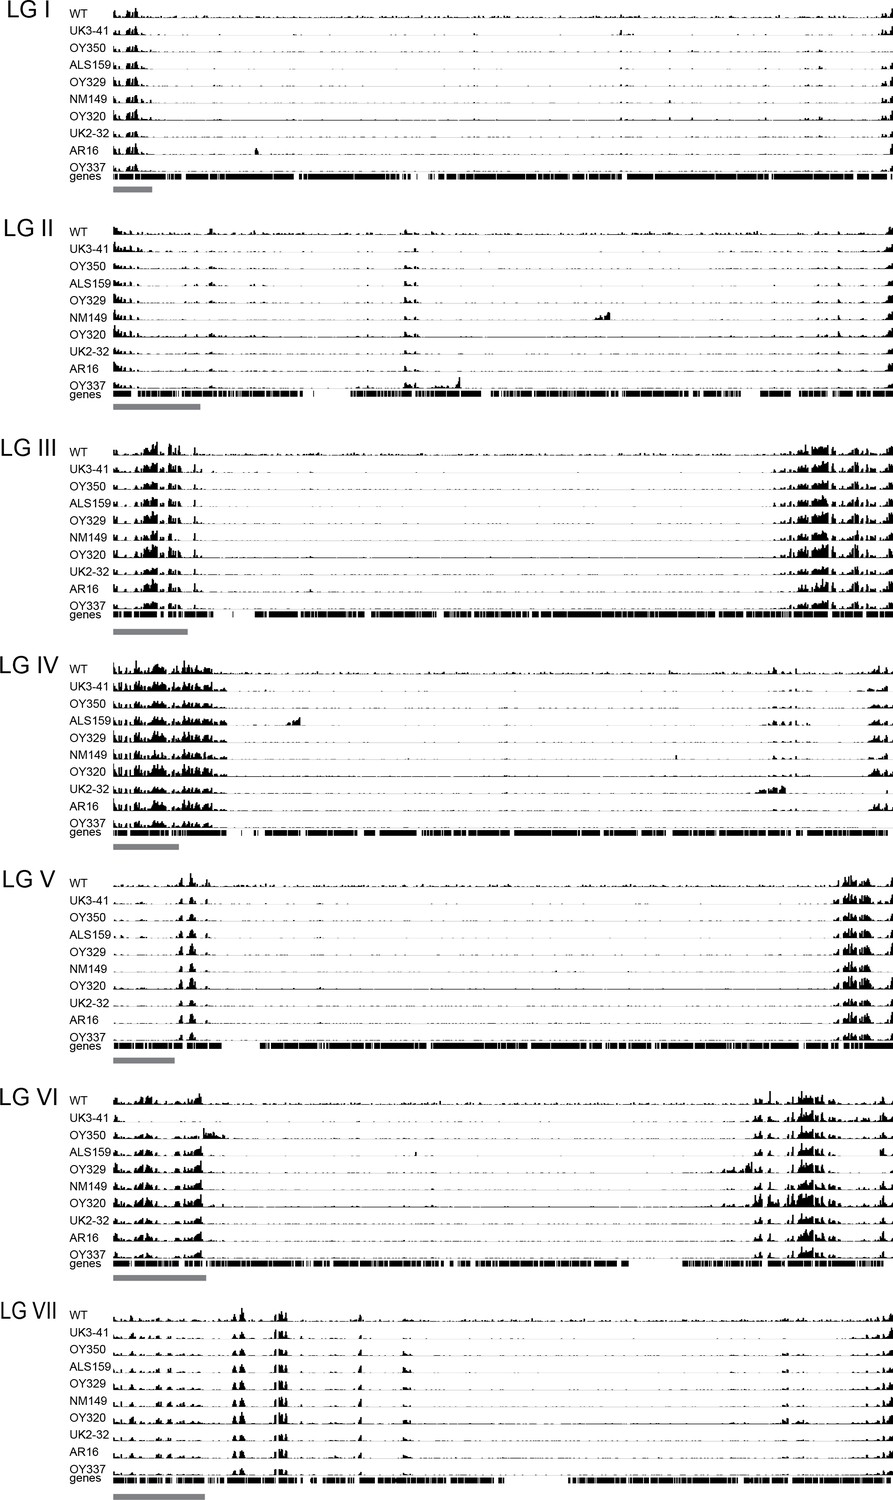
Whole genome view of H3K27me2/3 ChIP-seq in WT and chromosomal translocation strains.
H3K27me2/3 ChIP-seq for all seven N. crassa chromosomes is displayed for WT and nine chromosomal translocation strains mapped onto the WT genome. Genes are indicated below the ChIP-seq track as vertical black bars. Grey scale bar represents 500 kb.
Figure 1—figure supplement 4

qPCR validation of H3K27me2/3 ChIP-seq data from translocation strains.
The gains and losses of H3K27me2/3 in ChIP-seq experiments were confirmed by ChIP-qPCR at representative regions for UK3-41 (A), OY350 (B), ALS159 (C), OY329 (D), NM149 (E), OY337 (F), UK2-32 (G), and AR16 (H). Each ChIP experiment was performed in biological triplicate; qPCR analyses were performed on each sample in technical triplicate. Bars represent means of biological triplicates and error bars show standard deviation. Primers are listed in Supplementary file 2.
Figure 2
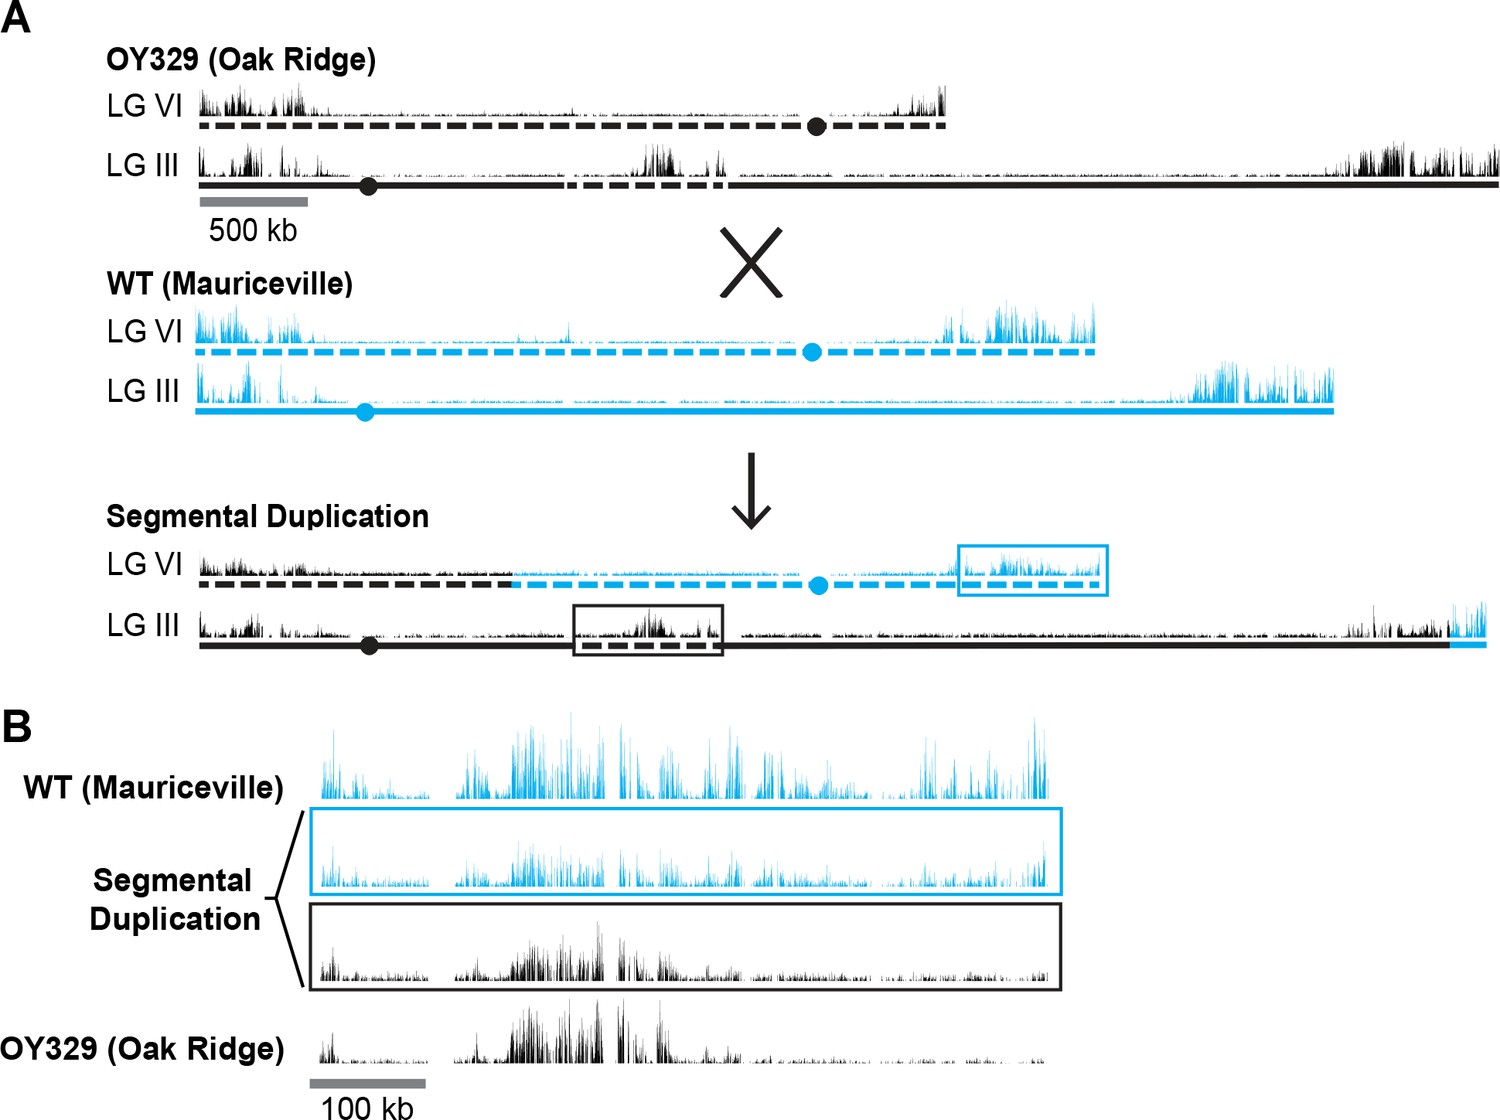
A segmental duplication confirms H3K27me2/3 position effect.
(A) Diagram of a cross between the OY329 (Oak Ridge) insertional translocation strain and a polymorphic wild-type strain (Mauriceville), resulting in a strain bearing a duplicated chromosomal segment (outlined by rectangles). H3K27me2/3 ChIP-seq tracks (single experiment) and chromosomes are shown in black for the Oak Ridge strain and blue for Mauriceville. Solid and dashed lines indicate chromosome source. (B) Expanded view of the duplicated chromosome segment in parental strains and duplication-containing offspring along with associated SNP-parsed H3K27me2/3 profiles.
Figure 3 with 1 supplement
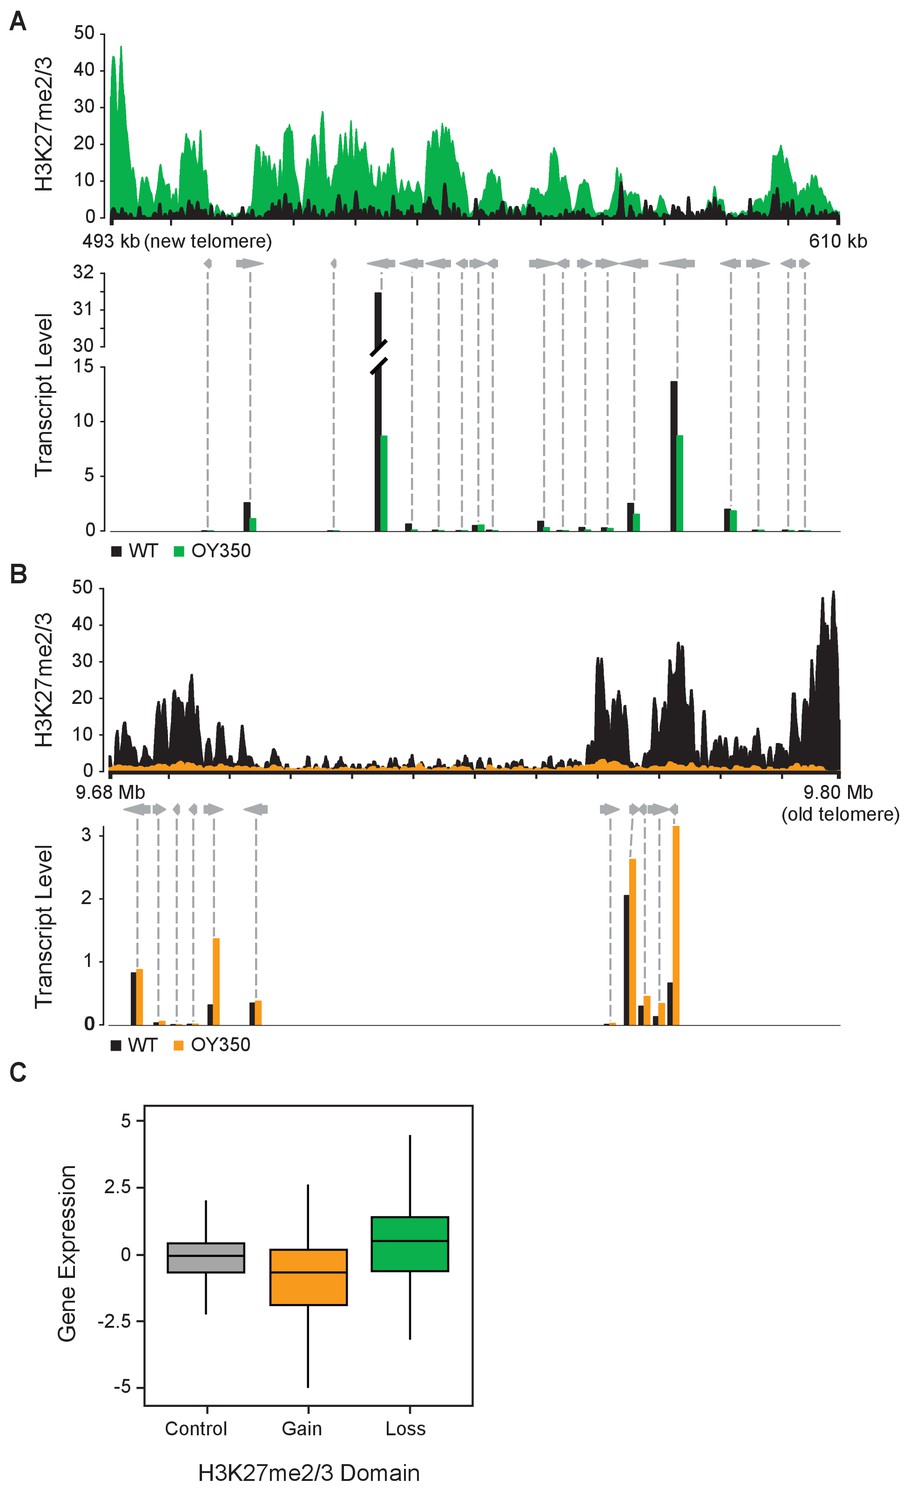
Altered gene expression reflects changes in H3K27me2/3.
(A) Reduced gene expression in novel subtelomeric region (LG VIL) that gains H3K27me2/3 in translocation OY350. The top panel displays H3K27me2/3 ChIP-seq reads of OY350 (green) normalized to the corresponding non-translocated segment in WT (black) using a 350 bp sliding window. The bottom panel shows normalized mRNA-seq read counts (counts/1000) for genes (gray arrows) in the region for WT (black) and OY350 (green). ChIP-seq data are from pooled biological triplicates; RNA-seq data are from biological duplicates. (B) Shifting a normally subtelomeric region to an internal position in translocation OY350 results in loss of H3K27me2/3 on LG IR and increased gene expression. The top panel displays H3K27me2/3 ChIP-seq reads of OY350 (orange) normalized to WT (black) using a 500 bp sliding window. The bottom panel shows normalized mRNA-seq read counts (counts/1000) for genes (gray arrows) in the region for WT (black) and OY350 (orange). (C) A box plot summarizes the relationship between gain (green) or loss (orange) of H3K27me2/3 in seven chromosomal translocation strains (ALS159, AR16, OY329, OY337, OY350, UK2-32, and UK3-41) and associated gene expression changes (log2[translocation/WT]) within the corresponding domains. The control (gray) represents gene expression in regions that do not exhibit changes in H3K27me2/3.
Figure 3—figure supplement 1
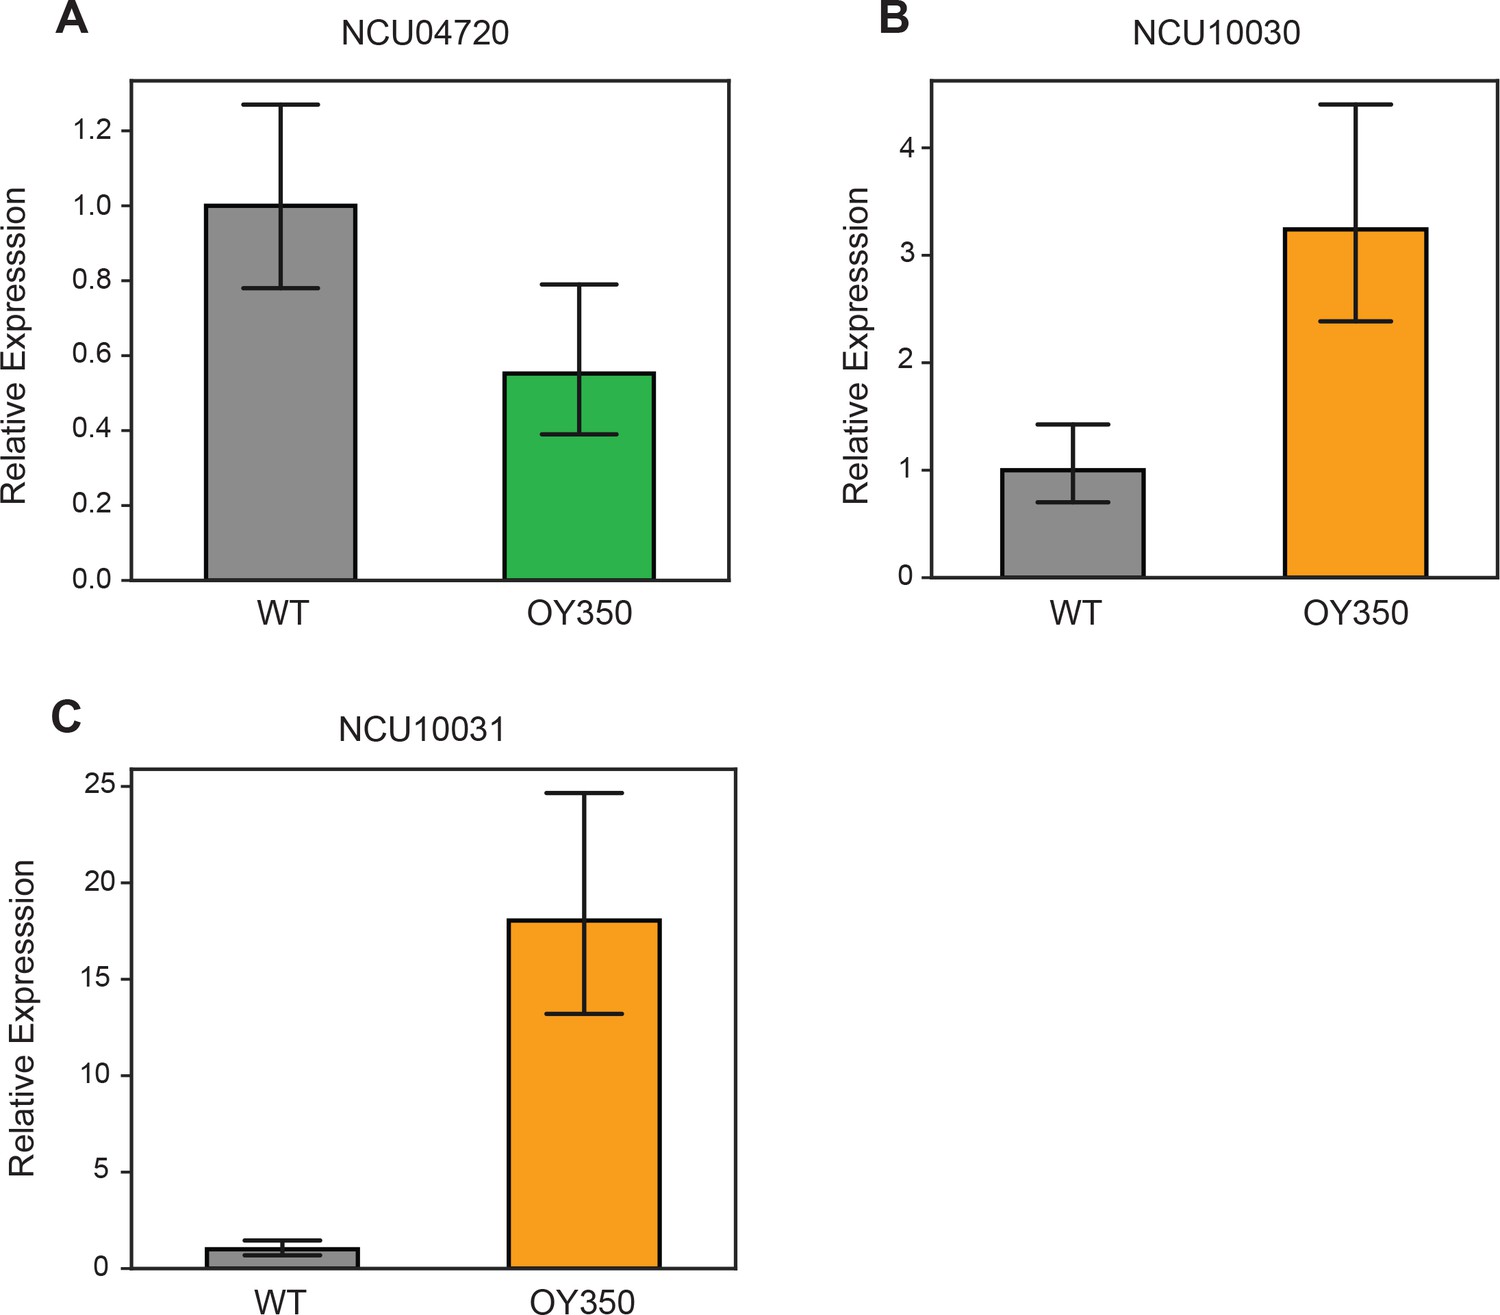
qPCR validation of RNA-seq expression changes in translocation OY350.
The effects of gain of H3K27me2/3 (A) and loss of H3K27me2/3 (B,C) on associated gene expression levels were verified by qPCR. Gene expression levels were normalized to housekeeping gene, NCU02840. qPCR analyses were performed on each sample in technical triplicate. Bars represent means of biological triplicates and error bars show standard deviation. Primers are listed in Supplementary file 2.
Figure 4 with 1 supplement
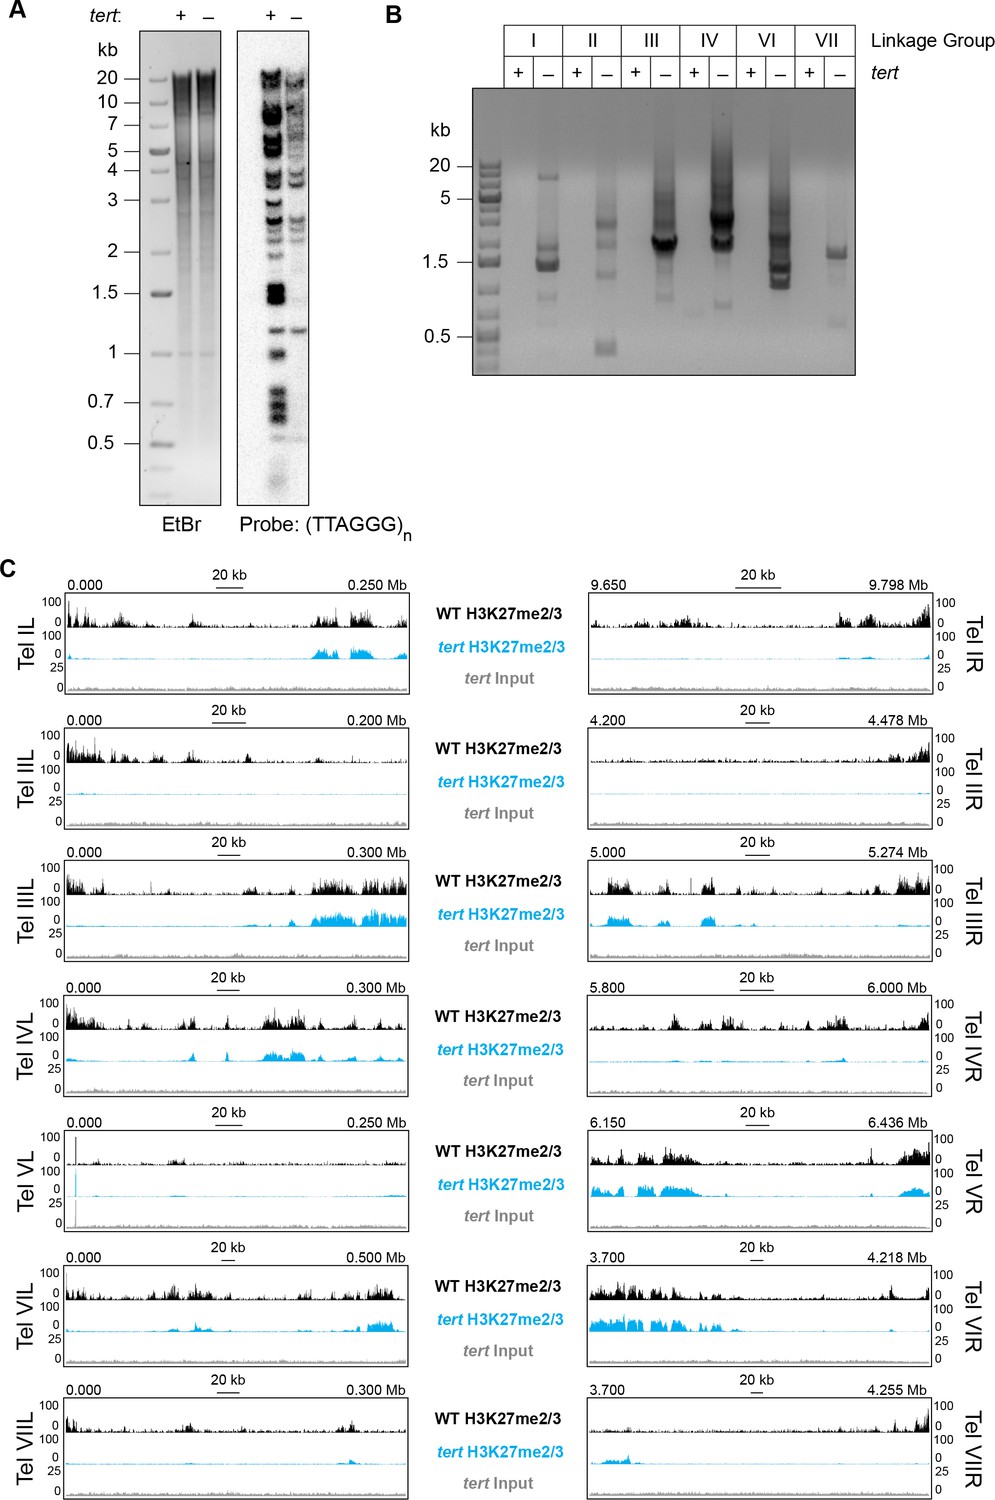
Loss of tert disrupts chromosome ends and abolishes subtelomeric H3K27me2/3.
(A) Southern hybridization of genomic DNA from WT and tert strains digested with HindIII/NotI reveals loss of chromosome ends marked with the telomere repeats (TTAGGG)n, which was used as the probe. The ethidium bromide (EtBr) image demonstrates equal loading of WT and tert genomic DNA. (B) Circularization of chromosomes was demonstrated by generation of PCR products with outwardly directed primers near chromosome ends in a tert strain, but not a WT strain. (C) H3K27me2/3 ChIP-seq of tert (single sample; blue track) compared to WT (pooled biological triplicates; black track). Sequence coverage of the tert ChIP input (gray track) is also shown.
Figure 4—figure supplement 1
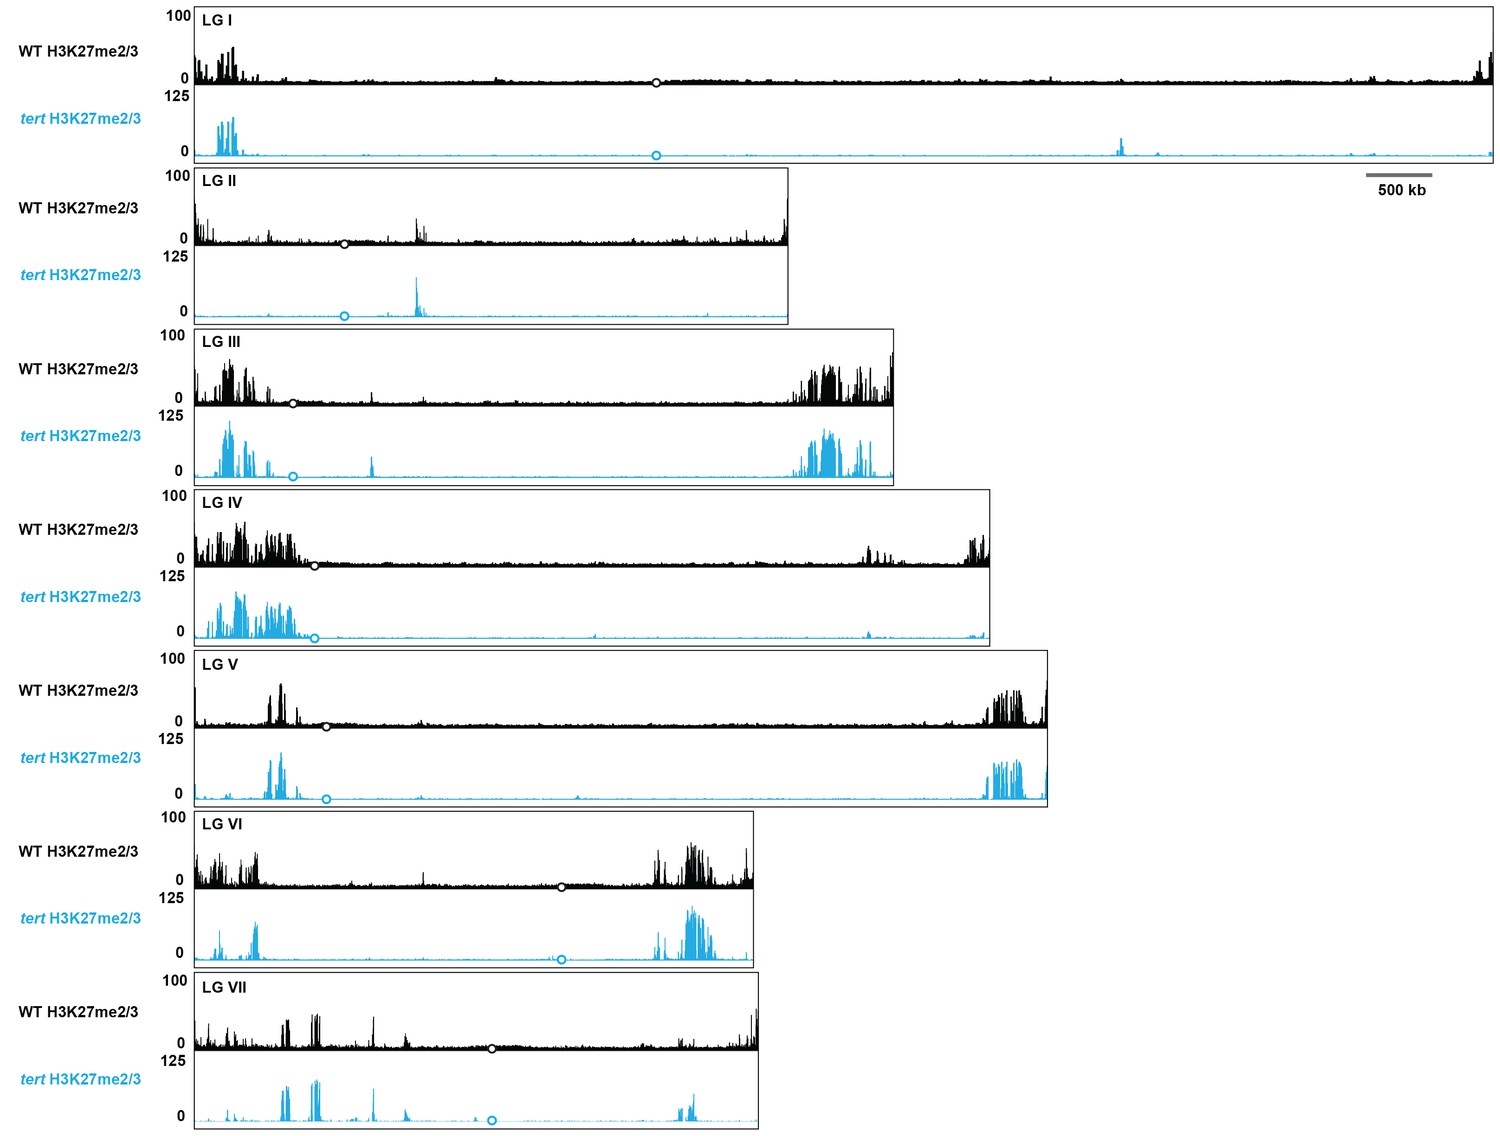
Whole genome view of H3K27me2/3 ChIP-seq in WT and tert.
H3K27me2/3 ChIP-seq for all seven N. crassa chromosomes is displayed for WT (pooled biological triplicates; black track) and tert (single sample; blue). The y-axis is number of reads averaged over 25 bp windows. Open black or blue circles indicate location of centromeres.
Figure 5 with 2 supplements
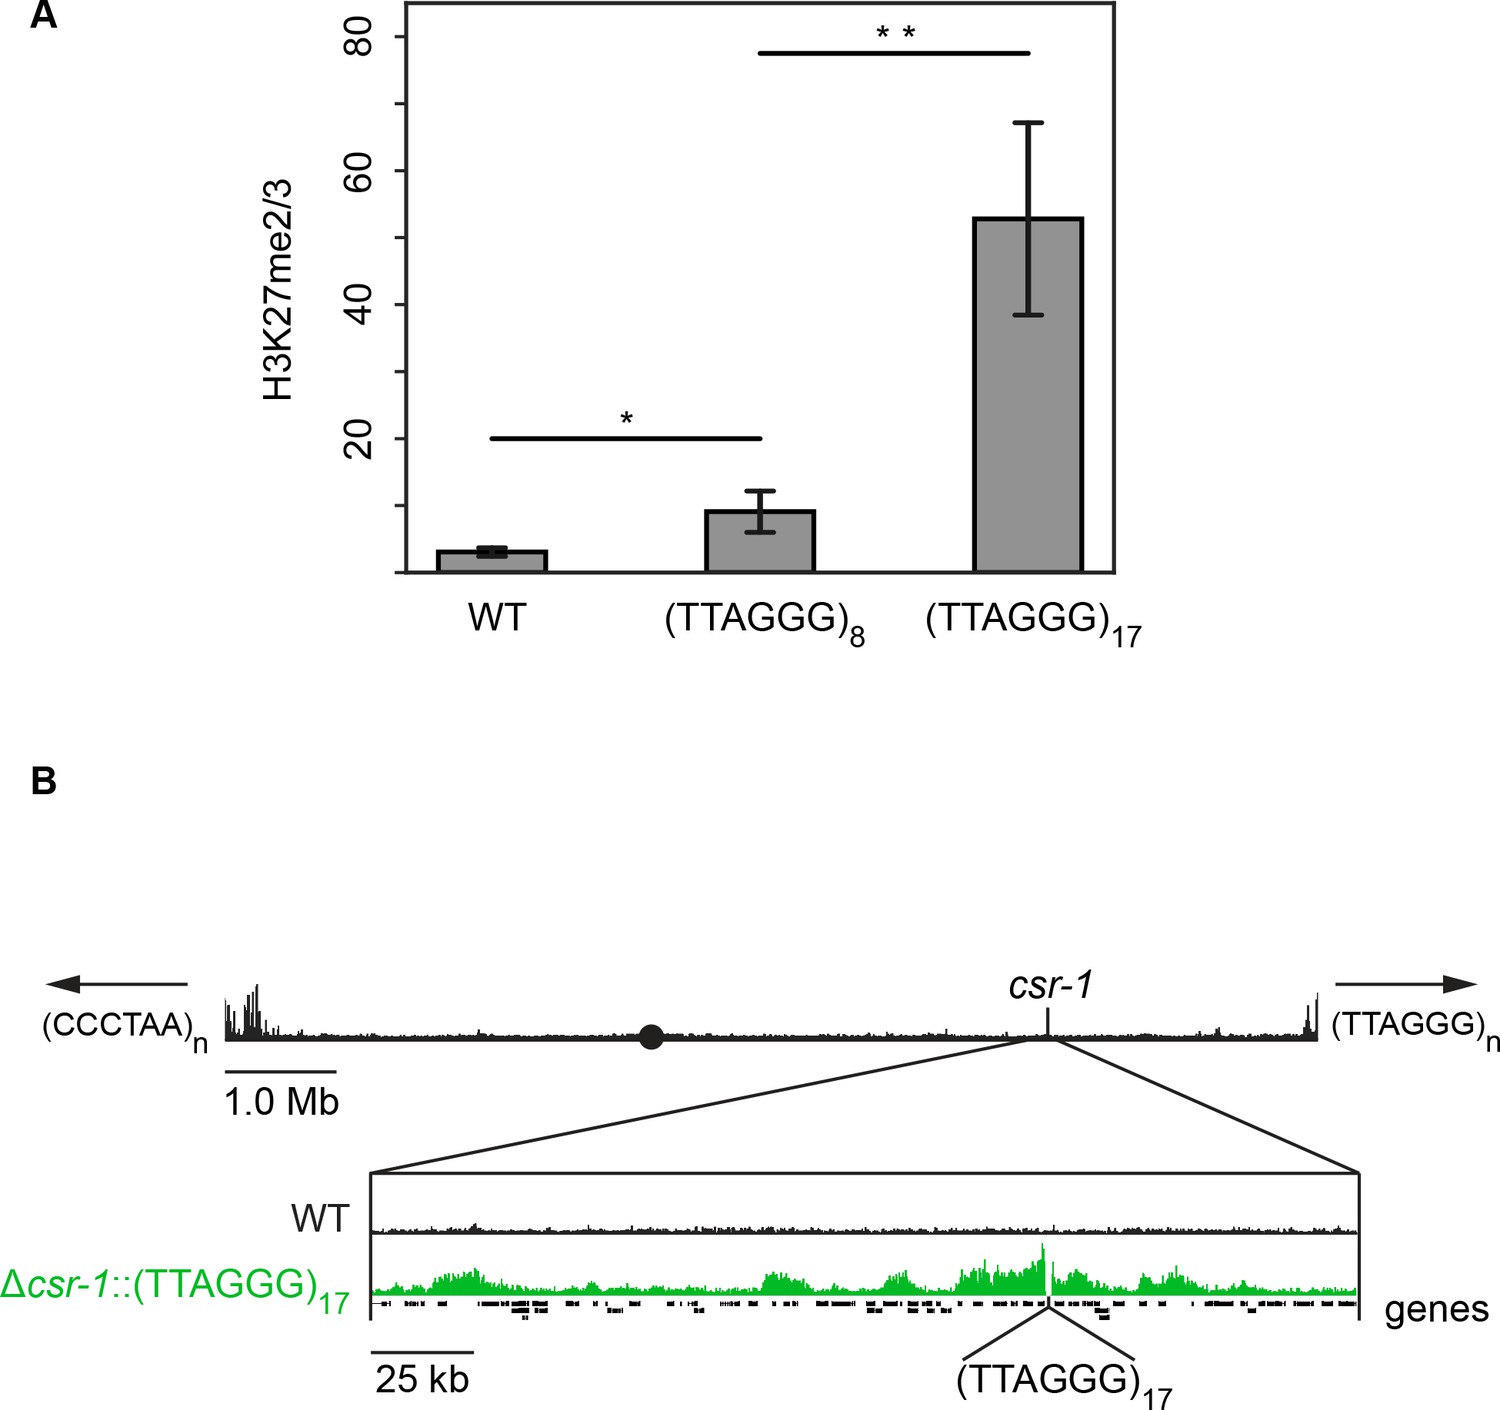
Telomere repeats targeted to the csr-1 locus induce an approximately 225 kb H3K27me2/3 domain.
(A) qPCR analyses (biological triplicates) of H3K27me2/3 ChIP with strains containing 8 or 17 telomere repeats at the csr-1 locus, with WT strain as a control (means displayed; error bars show standard deviation; single and double asterisks represent p=0.01488 and p=0.00336 respectively). Level of H3K27me2/3 normalized to Telomere 1L. MWT = 3.05970, SDWT = 0.64784, 95% CIWT = [2.32656, 3.79264]; M8 = 9.08627, SD8 = 3.09022, 95% CI8 = [5.58937, 12.58303]; M17 = 52.78110, SD17 = 14.35716, 95% CI17 = [36.53461, 69.02719]. (B) H3K27me2/3 ChIP-seq of full WT LG I (pooled biological triplicates; black track). Black circle indicates the centromere, csr-1 position is indicated by vertical line, and arrows at chromosome ends indicate 5’ to 3’ polarity of telomere repeats. Expansion below shows the extent and shape of the H3K27me2/3 domain induced in the Δcsr-1::(TTAGGG)17 strain (single sample; green track) compared to WT (black track). Site of csr-1 replacement with telomere repeats indicated below ChIP-seq tracks. Genes are displayed as black bars.
Figure 5—figure supplement 1

Telomere repeats targeted to the his-3 locus induce local H3K27me2/3 domain.
qPCR analyses of H3K27me2/3 ChIP with strains containing 21, 22, or 23 telomere repeats at the his-3 locus, with WT biological triplicates as a control. Level of H3K27me2/3 normalized to Telomere 1L.
Figure 5—figure supplement 2

Whole genome view of H3K27me2/3 ChIP-seq in WT and Δcsr-1::(TTAGGG)17.
H3K27me2/3 ChIP-seq for all seven N. crassa chromosomes is displayed for WT (pooled biological triplicates) and Δcsr-1::(TTAGGG)17 (single sample). The y-axis is number of reads averaged over 25 bp windows. Open black circles indicate location of centromeres.
Additional files
-
Supplementary file 1
List of strains.
The numbers and their corresponding genotypes are indicated for all strains used in this study.
- https://doi.org/10.7554/eLife.31216.015
-
Supplementary file 2
List of primers.
All primers included in this study are identified by primer number, a brief description of how they were used and their corresponding sequence.
- https://doi.org/10.7554/eLife.31216.016
-
Supplementary file 3
List of plasmids.
Plasmids used in this study are identified by number and accompanied by a brief description of how they were utilized.
- https://doi.org/10.7554/eLife.31216.017
-
Supplementary file 4
Chromosome rearrangement breakpoint analyses.
A synopsis of the analyses we used to detect translocation breakpoints. Breakpoints were detected by LUMPY (Layer et al., 2014) and confirmed by PCR (for primer sequences, see Supplementary file 2).
- https://doi.org/10.7554/eLife.31216.018
-
Transparent reporting form
- https://doi.org/10.7554/eLife.31216.019
Download links
A two-part list of links to download the article, or parts of the article, in various formats.
Downloads (link to download the article as PDF)
Open citations (links to open the citations from this article in various online reference manager services)
Cite this article (links to download the citations from this article in formats compatible with various reference manager tools)
Telomere repeats induce domains of H3K27 methylation in Neurospora
eLife 7:e31216.
https://doi.org/10.7554/eLife.31216


