Diverse modes of synaptic signaling, regulation, and plasticity distinguish two classes of C. elegans glutamatergic neurons
- The Rockefeller University, United States
Figures
Figure 1 with 2 supplements
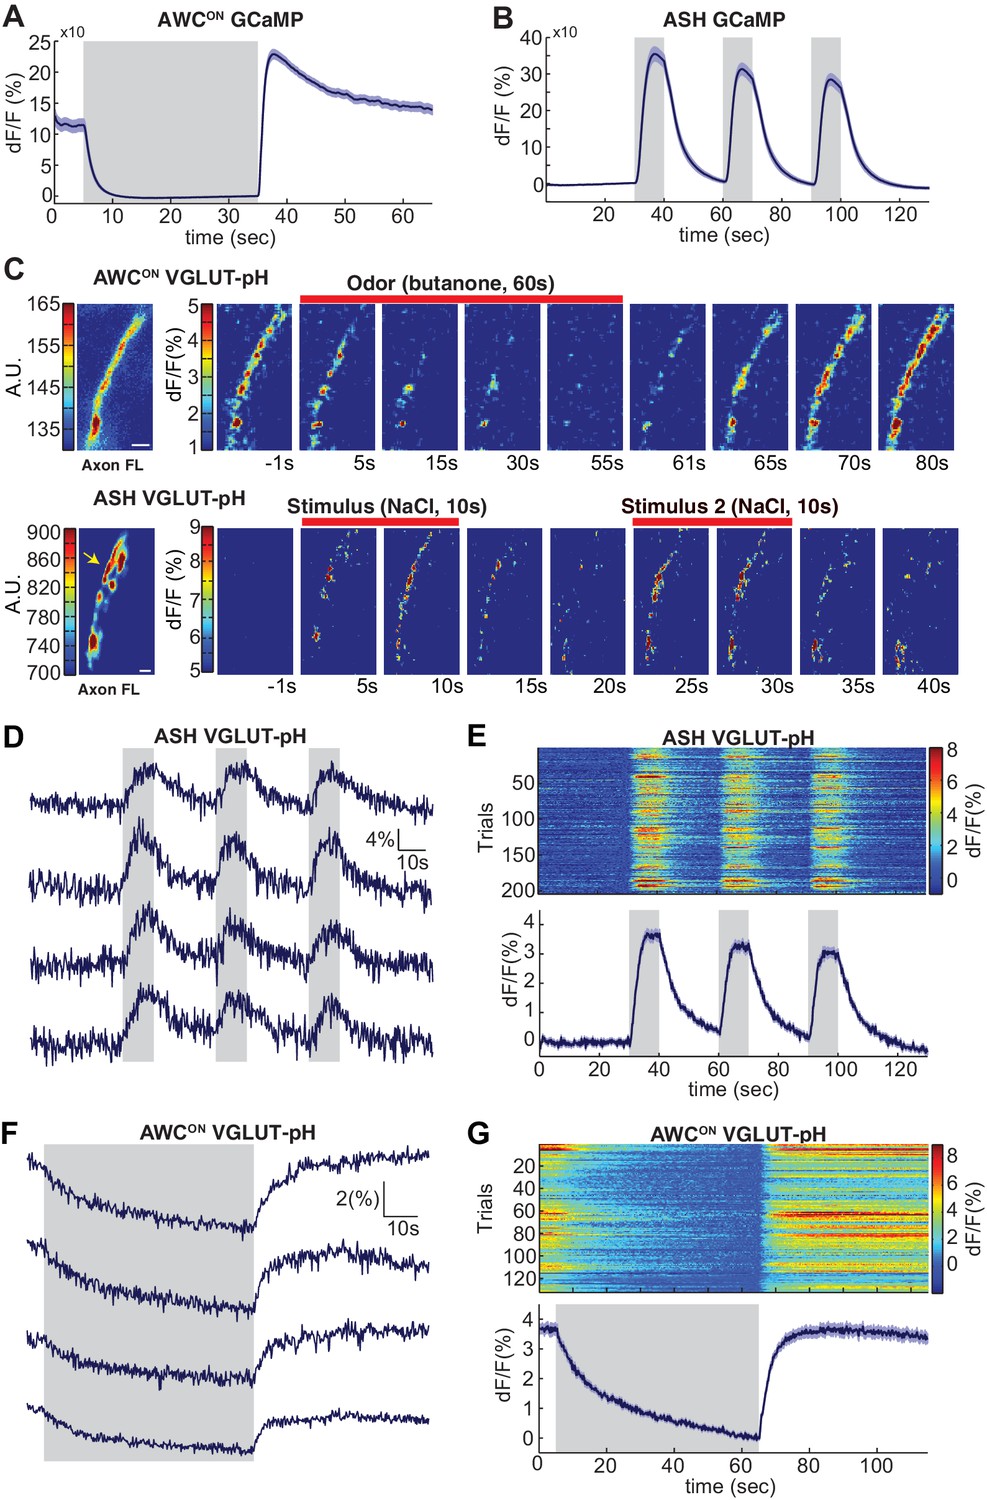
Sensory stimuli evoke VGLUT-pH signals in AWCON and ASH neurons.
(A) AWCON GCaMP5A responses in the cell body upon butanone stimulation (n = 47, 16 animals, 2–3 trials each). (B) ASH GCaMP3 responses in the cell body upon 500 mM NaCl stimulation (n = 39, 13 animals, three trials each). Gray shaded areas mark stimulus period. (C) Individual AWCON and ASH VGLUT-pH responses. Left: Fluorescence intensity of VGLUT-pH along the axon prior to stimulation (a.u. arbitrary units). White scale bars = 2 um. Right: Images of VGLUT-pH fluorescence changes upon butanone (AWCON) or NaCl (ASH) stimulation at t = 0 (red bars), presented as change in fluorescence versus reference F (F at ~t = 55 s for AWCON, t=-1s for ASH, see Materials and methods). Recordings were smoothed using a running average (three frames, three pixels in x and y). (D,F) Single trials of ASH (D) and AWCON (F) VGLUT-pH responses from four individuals. Top trace in each panel is from the axon in (C). (E,G) Population ASH (E) and AWCON (G) VGLUT-pH responses. Top panel: Heat map of individual trials, three trial per animal, presented in sequential order. Bottom panel: Mean response from all trials. AWCON: 132 trials from 44 animals, three trials each. ASH: 204 trials from 68 animals, three trials each. Blue shading around traces indicates S.E.M.
-
Figure 1—source data 1
Source data for Figure 1.
- https://doi.org/10.7554/eLife.31234.005
Figure 1—figure supplement 1
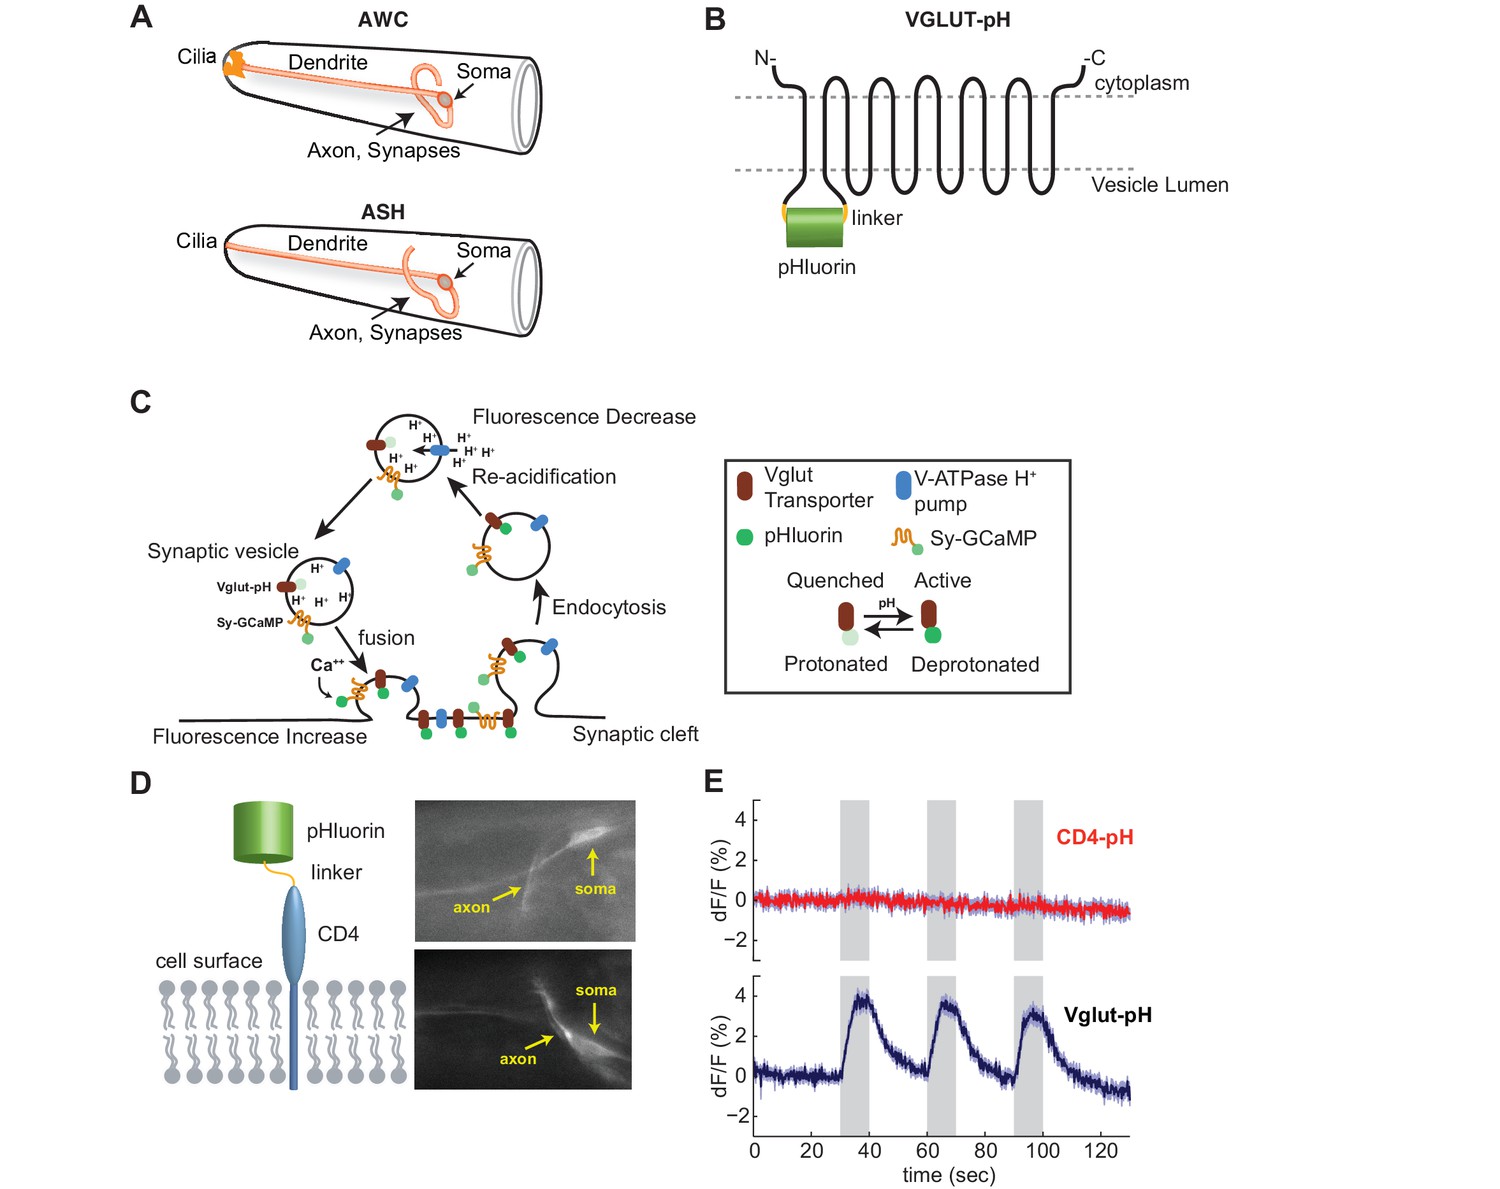
Anatomy of AWCON and ASH and illustration of synaptic reporters.
(A) Anatomical diagram of AWC and ASH neurons. Redrawn from www.wormatlas.com. (B) Diagram of VGLUT-pH reporter, with pH-sensitive fluorophore inserted into a lumenal domain of the protein. (C) Diagram of simplified synaptic vesicle cycle, incorporating synaptic activity reporters used here. VGLUT-pH reports pH changes of the synaptic vesicle lumen associated with exocytosis. syGCaMP, a fusion to the synaptic vesicle protein synaptogyrin, reports changes in calcium concentration at the cytosolic face of synaptic vesicles. Although illustrated together, these reagents are used separately. (D) LEFT: Diagram of CD4-pH construct used to target pHluorin to the extracellular surface of ASH. RIGHT: Two animals expressing CD4-pH in ASH under the sra-6 promoter. ASH axon and cell body (soma) indicated. Images are from recordings in (E) and are averages of the first five frames. (E) TOP: Average response of ASH CD4-pH (n = 33 trials, 11 animals, three trials each). No response was detected. BOTTOM: Average response of ASH VGLUT-pH control (n = 39 trials, 13 animals, three trials each). Gray areas mark stimulus periods (500 mM NaCl). Shading = S.E.M.
Figure 1—figure supplement 2
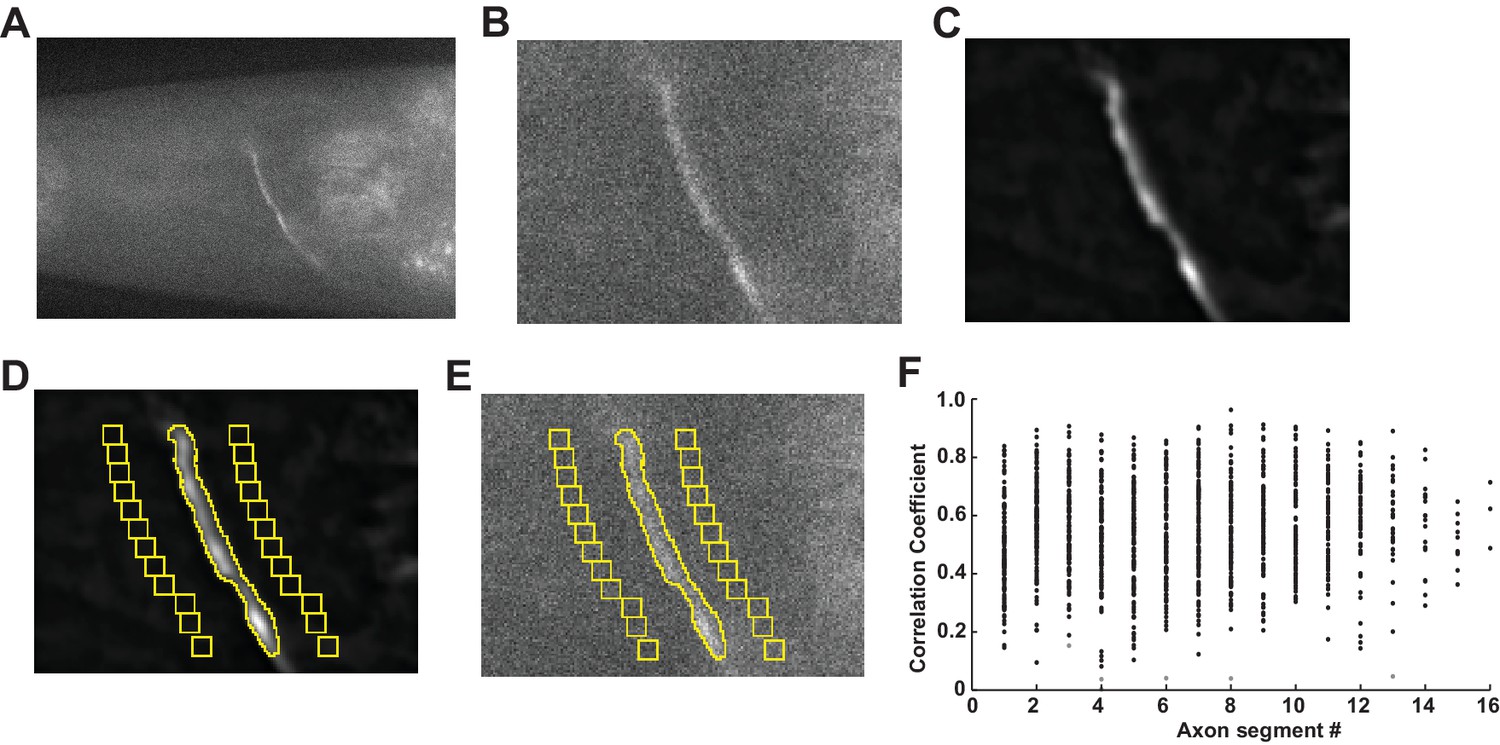
VGLUT-pH data acquisition.
(A) Single plane of AWCON VGLUT-pH recording after drift-registration correction. (B) Zoomed view around the axon in (A). (C) Mean intensity projection after the recording was processed by rolling background subtraction and 3D-averaging. (D) Selection of axon and background ROIs. (E) Intensity measurements are then taken from the raw drift-corrected recording. (F) ROI segments along the axon correlated with overall mean activity of the axon. Each point represents the correlation coefficient of an axon segment with the mean signal of the axon during a standard recording (see Materials and methods). Data from 120 AWCON VGLUT-pH axons stimulated with 11.2 µM butanone. Each axon had 8–16 ROI segments. p<0.000001 for all correlation coefficients except the points labeled in light gray, which were not significant p>0.05.
Figure 2 with 1 supplement
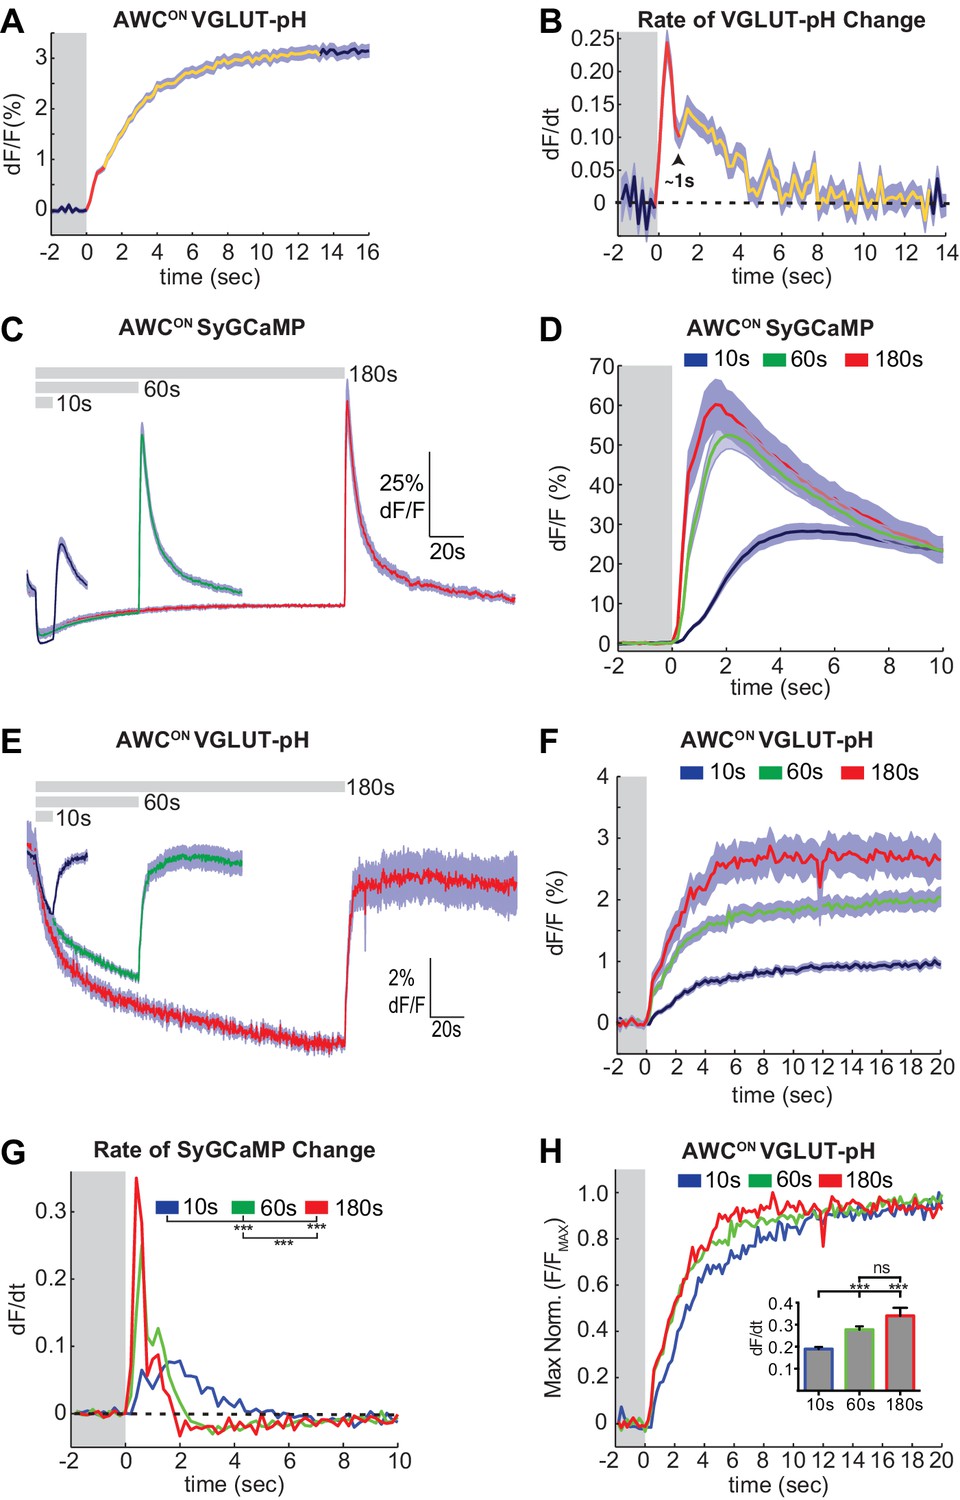
Two kinetic phases of VGLUT-pH responses and calcium influx in AWCON.
(A) Mean AWCON Vglut-pH signal upon odor removal (60 s stimulus, n = 219 trials, 1–3 trials per animal). Trace is colored according to transitions in time derivative in (B). (B) Mean time derivative of AWCON VGLUT-pH signals in (A). (C) AWCON synaptic calcium responses to butanone pulses measured with syGCaMP; traces aligned to odor addition. 10 s pulses: n = 42 (7 animals, six trials each). 60 s pulses: n = 21 (7 animals, three trials each). 3 min pulses: n = 7 (7 animals, one trial each). (D) syGCaMP responses from (C) aligned to odor removal. (E) AWCON VGLUT-pH responses to butanone pulses; traces aligned to odor addition. 10 s pulses: n = 120 (20 animals, six trials each). 60 s pulses: n = 59 (21 animals, 2–3 trials each). 3 min pulses: n = 14 (14 animals, one trial each). (F) VGLUT-pH responses from (E) aligned to odor removal. (G) Mean time derivative of AWCON syGCaMP signals in (D) shows different peak rates 1 s after odor removal (***p<0.0001, one-way ANOVA with Tukey’s correction). (H) Average VGLUT-pH odor removal responses from (F) after normalizing response magnitude. Inset: Average peak time derivative of AWCON VGLUT-pH signals 1 s after odor removal. ***p<0.0001, ns (p=0.14), One-way ANOVA with Tukey’s correction. For time derivative plots each individual trial was smoothed with a running average (three frames) before taking the derivative. Units are change in dF/F (%) per 200 ms. Gray areas in A,B,D,F-H mark odor stimulus periods. Shading indicates S.E.M.
-
Figure 2—source data 1
Source data for Figure 2.
- https://doi.org/10.7554/eLife.31234.008
Figure 2—figure supplement 1
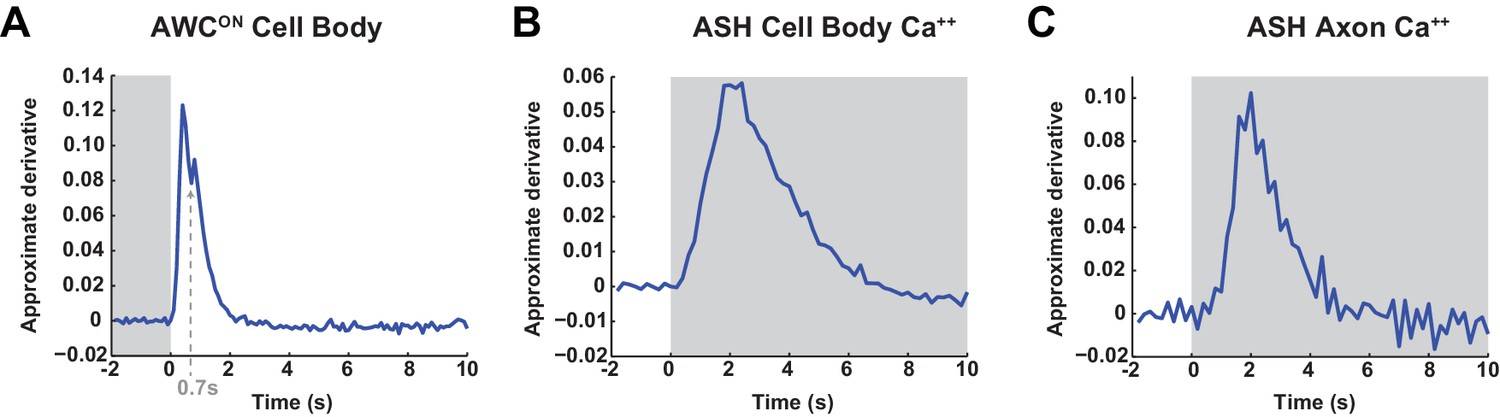
Time derivative of AWCONand ASH GCaMP signals in the cell body and ASH GCaMP signals in the axon.
(A) A transition between two positive influx rates may occur ~0.7 s after odor removal, similar to the transition observed in synaptic calcium by syGCaMP recordings in Figure 2G. Average from 47 trials from 16 wild-type animals. (B,C) Time derivative of the mean ASH GCaMP3 signal at the cell body (B) and axon (C) during a 500 mM NaCl stimulus. No heterogeneity of influx rates was detectable with this sensor. Data from Figure 1B. Gray areas mark stimulus periods.
Figure 3

The SNARE complex is required for VGLUT-pH responses in AWCON and ASH.
(A,B) VGLUT-pH responses are eliminated by cell-specific expression of TeTx light chain. (A) AWCON str-2 promoter driving TeTx n = 25 (9 animals, 2–3 trials each). AWCON wt (TeTx-array negative animals tested in parallel) n = 28 (10 animals, 2–3 trials each). (B) ASH sra-6 promoter driving TeTx n = 33 (11 animals, three trials each). ASH wt (TeTx-array negative animals tested in parallel) n = 24 (8 animals, three trials each). (C,D) VGLUT-pH responses in unc-64(e246) (partial loss of function) syntaxin mutants. (C) AWCON unc-64(e246) n = 30 (10 animals, three trials each). AWCON wt n = 23 (9 animals, 2–3 trials each). (D) ASH unc-64(e246) n = 24 (8 animals, three trials each). ASH wt n = 18 (6 animals, three trials each). (E, F) VGLUT-pH responses in ric-4(md1088) (partial loss of function) SNAP-25 mutants. (E) AWCON ric-4(md1088) n = 12 (4 animals, three trials each). AWCON wt n = 15 (5 animals, three trials each). (F) ASH ric-4(md1088) n = 16 (6 animals, 2–3 trials each). ASH wt n = 32 (11 animals, 2–3 trials each). Mutations are described in Supplementary file 2. All differences are significant (p<0.0001, unpaired t-test), as detailed in Supplementary file 3A. Gray areas mark stimulus periods. Shading indicates S.E.M.
-
Figure 3—source data 1
Source data for Figure 3.
- https://doi.org/10.7554/eLife.31234.010
Figure 4
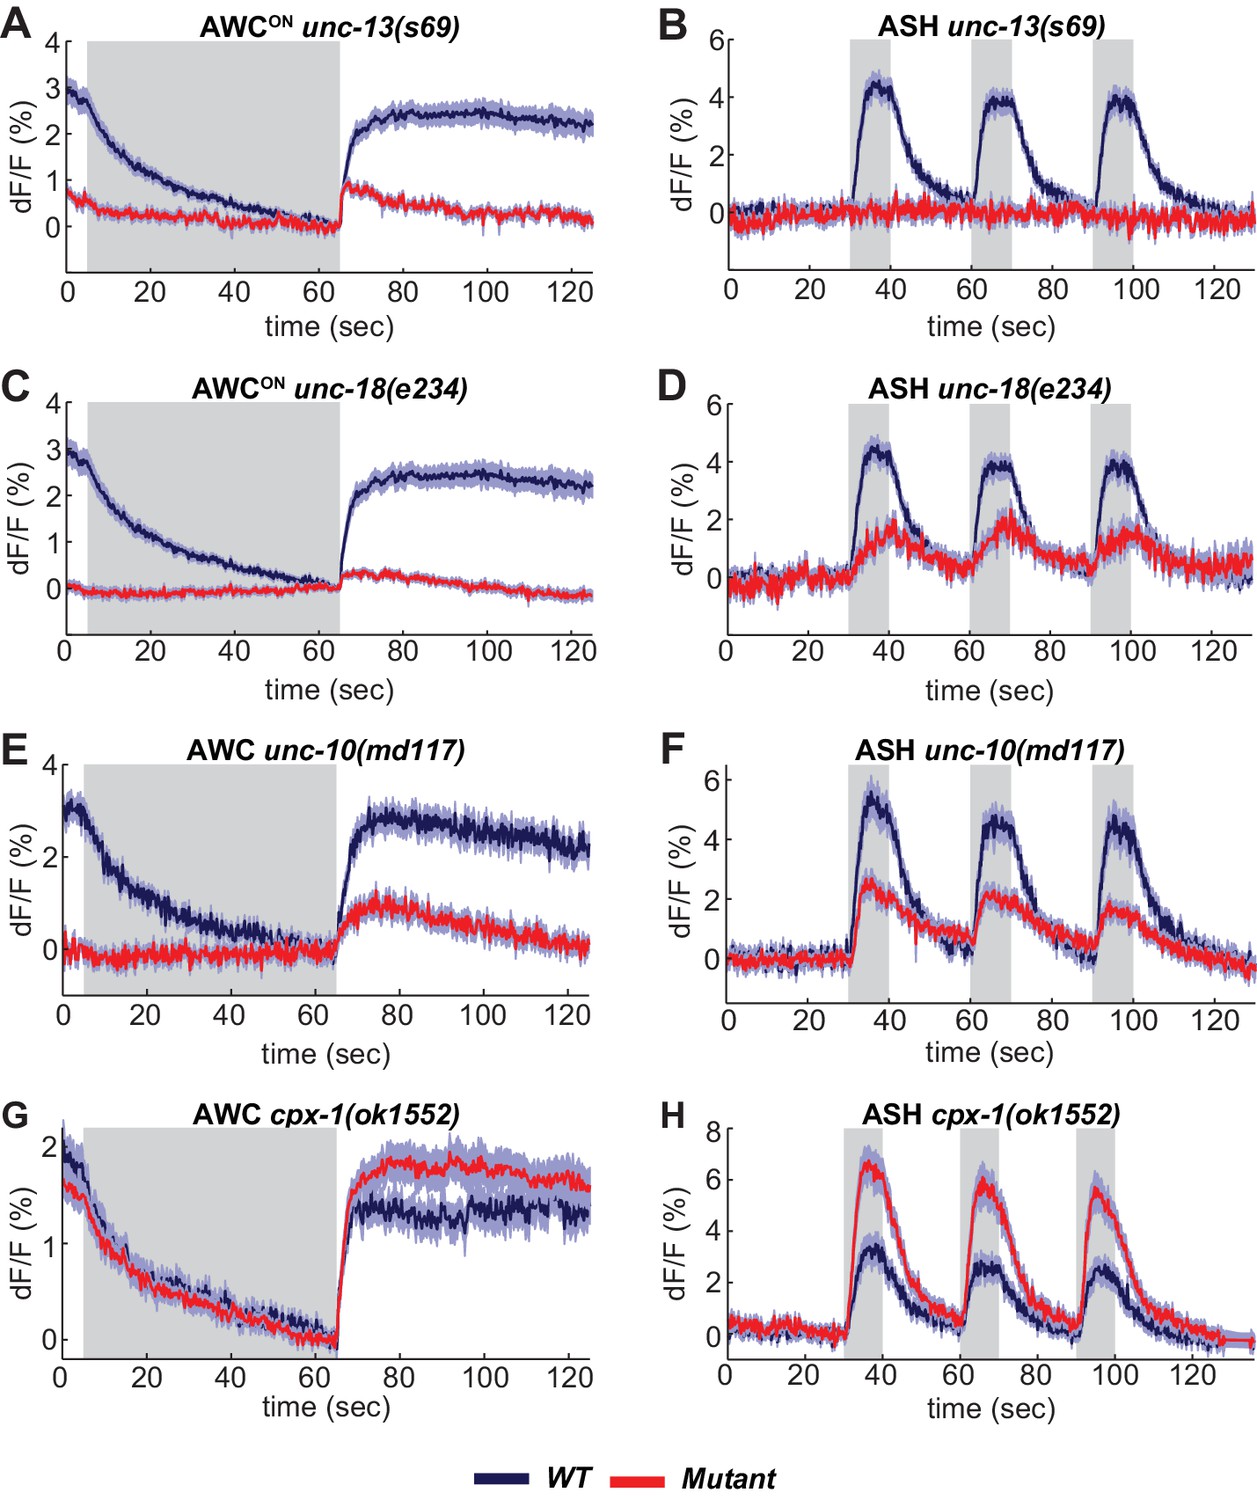
SNARE regulators differentially affect AWCON and ASH.
(A,B) VGLUT-pH responses in unc-13(s69) null mutants. (A) AWCON responses in unc-13(s69), n = 25 (9 animals, 2–3 trials each) and wt, n = 33 (11 animals, three trials each). (B) ASH responses in unc-13(s69), n = 18 (7 animals, 1–3 trials each) and wt, n = 42 (14 animals, three trials each). (C,D) VGLUT-pH responses in unc-18(e234) mutants. (C) AWCON responses in unc-18(e234), n = 25 (9 animals, 1–3 trials each) and wt, n = 33 (11 animals, three trials each). (D) ASH responses in unc-18(e234), n = 22 (8 animals, 1–3 trial each) and wt, n = 42 (14 animals, three trials each). (E,F) VGLUT-pH responses in unc-10(md117) mutants. (E) AWCON responses in unc-10(md117), n = 23 (8 animals, 1–3 trials each), and wt, n = 27 (9 animals, three trials each). (F) ASH responses in unc-10(md117), n = 33 (12 animals, 2–3 trials each), and wt, n = 24 (8 animals, three trials each). (G,H) VGLUT-pH responses in cpx-1(ok1552) mutants. (G) AWCON responses in cpx-1(ok1552), n = 36 (12 animals, three trials each), and wt, n = 17 (6 animals, 2–3 trials each). (H) ASH responses in cpx-1(ok1552), n = 38 (13 animals, 2–3 trials each), and wt n = 33 (11 animals, three trials each). WT and mutants are significantly different in panels A-F and H, as detailed in Supplementary file 3B. Gray areas mark stimulus periods. Shading indicates S.E.M.
-
Figure 4—source data 1
Source data for Figure 4.
- https://doi.org/10.7554/eLife.31234.012
Figure 5
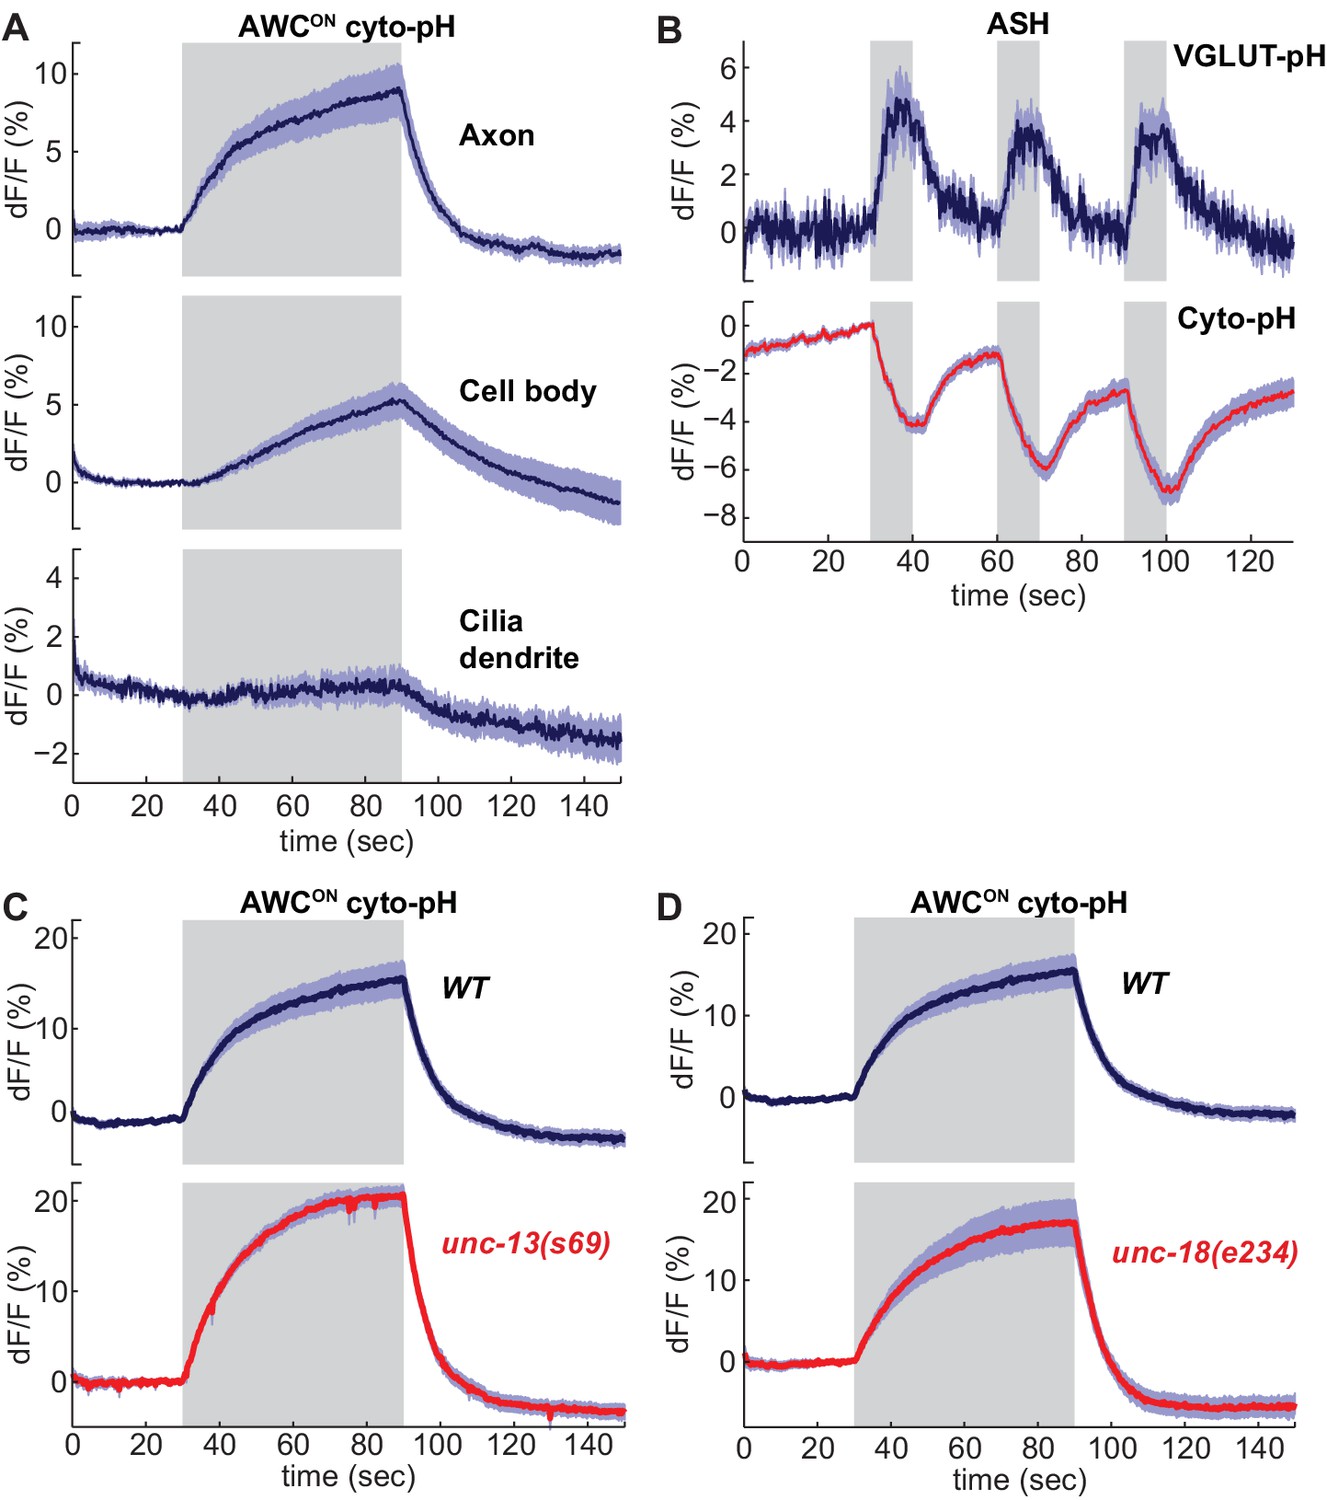
Sensory stimuli evoke cytoplasmic pH changes in AWCON and ASH.
(A) Average cyto-pH signals at different subcellular sites of AWCON. Axon and cell body, n = 9 (3 animals, three trials each), Cilia-dendrite n = 6 (2 animals, three trials each). (B) Average ASH VGLUT-pH response (top) and cyto-pH response (bottom), tested in parallel under the same stimulus conditions. VGLUT-pH n = 9 (3 animals, three trials each). cyto-pH n = 27 (9 animals, three trials each). (C,D) Average AWCON cyto-pH responses in (C) unc-13(s69) and (D) unc-18(e234) mutants. Mutants and wild-type controls were measured on the same days; neither mutant was significantly different from wild-type (p>0.12, one-way ANOVA with Tukey’s correction). unc-13(s69) n = 15 (5 animals, three trials each). unc-18(e234) n = 11 (4 animals, 2–3 trials each). wt n = 18 (6 animals, three trials each). Gray areas mark stimulus periods. Shading indicates S.E.M.
-
Figure 5—source data 1
Source data for Figure 5.
- https://doi.org/10.7554/eLife.31234.014
Figure 6 with 2 supplements
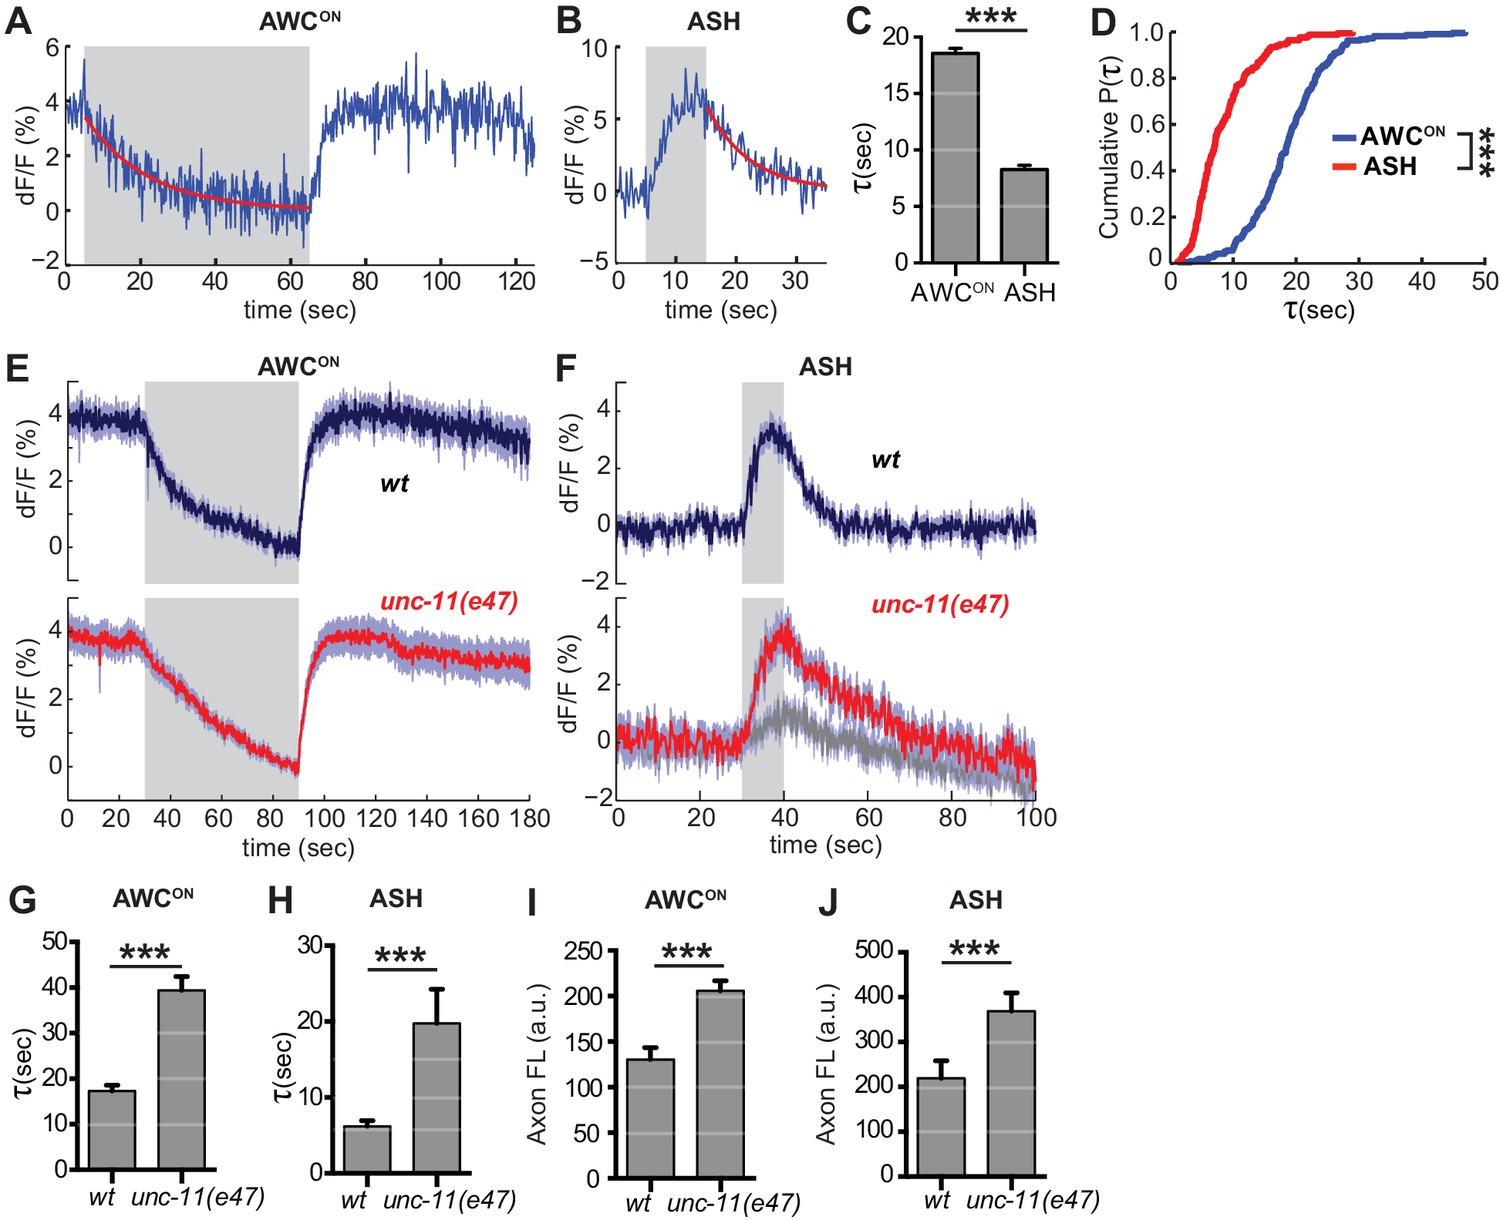
Synaptic vesicle retrieval is accelerated by AP180/CALM.
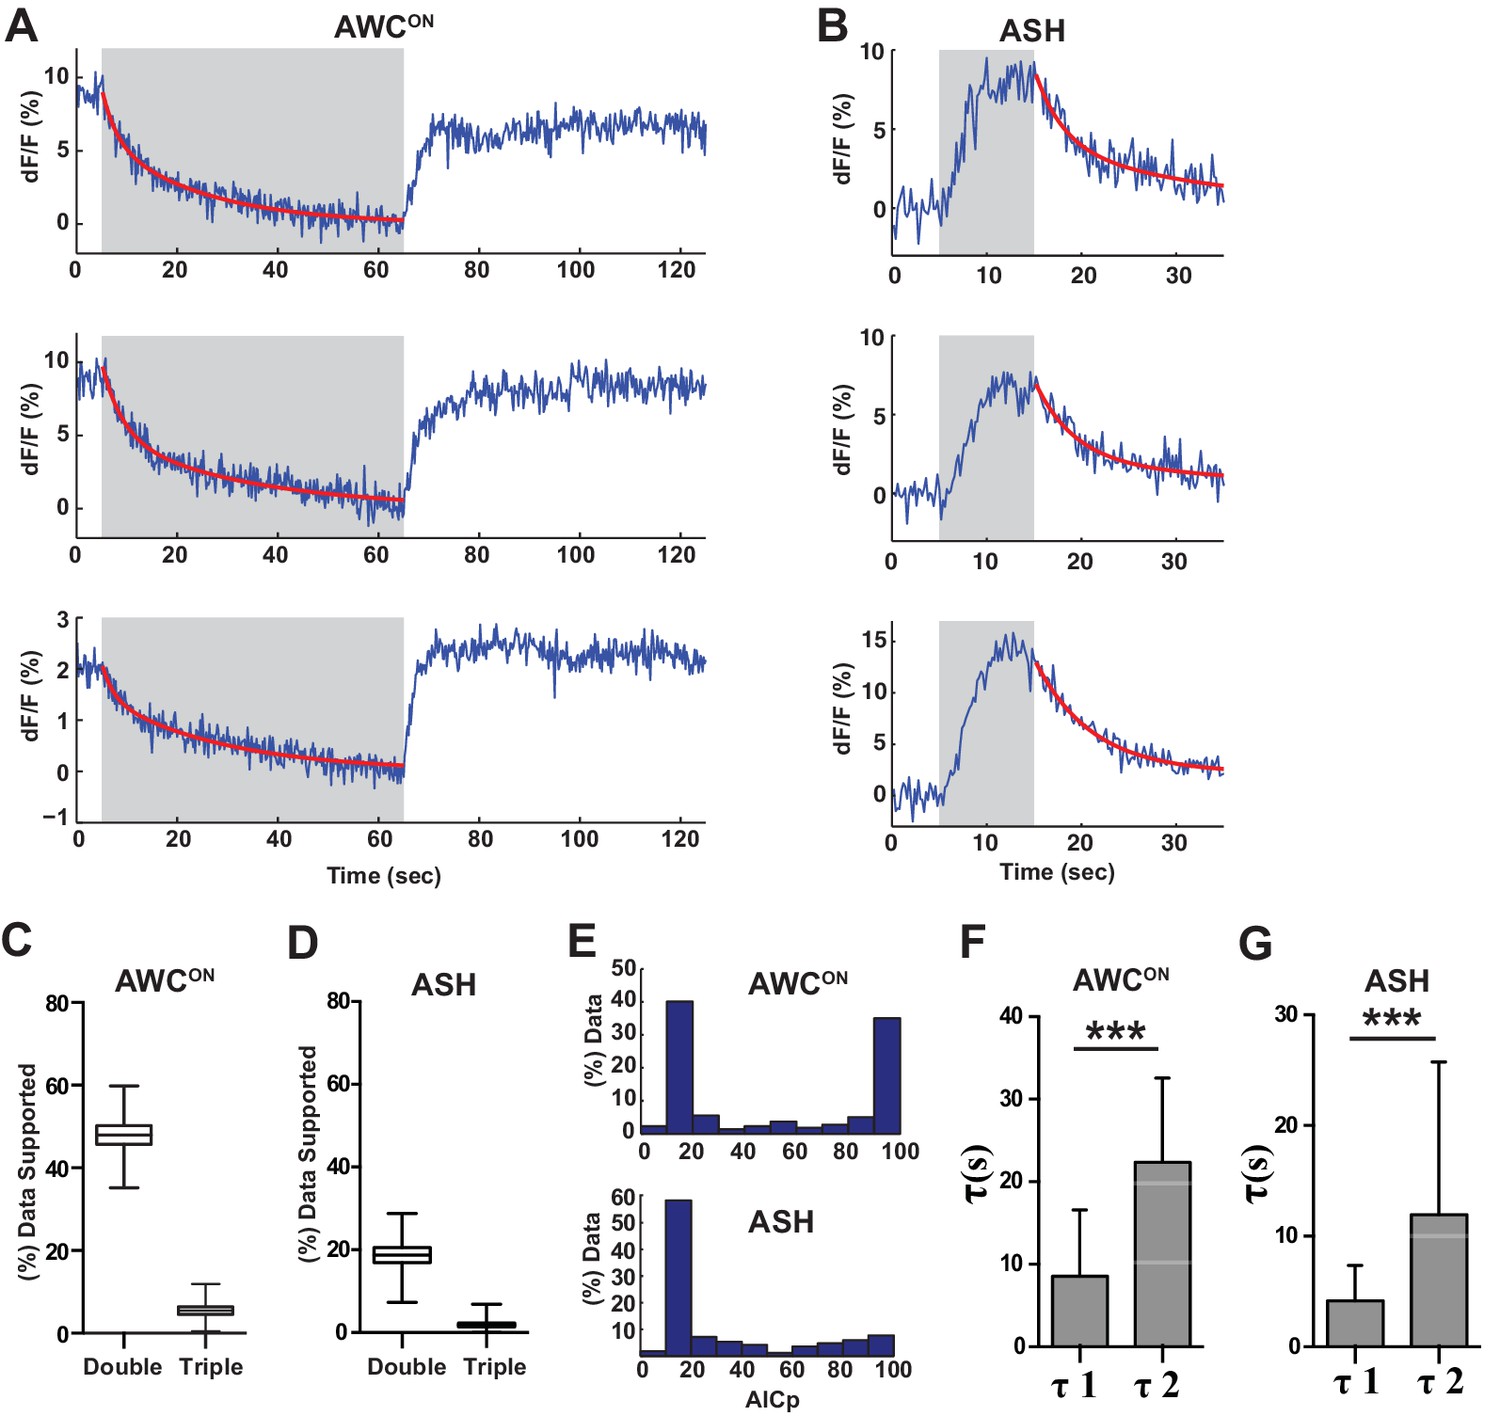
(A,B) Representative single exponential fits (red) to single trials of (A) AWCON and (B) ASH VGLUT-pH decays upon stimulus addition or removal, respectively. For each neuron, some responses were consistent with double exponential decay models (Figure 6—figure supplement 1). (C) Average time constant of AWCON and ASH decays from single exponential fits. AWCONn = 218 (76 animals, 2–3 trials each). ASH n = 168 (56 animals, 2–3 trials each). ***p<0.0001, unpaired t-test. (D) Empirical cumulative distribution plot of data in (C). Distributions differ by Kolmogorov-Smirnov test, ***p<0.0001. (E,F) Average VGLUT-pH responses in unc-11(e47) mutants. (E) AWCON responses in unc-11(e47) n = 27 (10 animals, 2–3 trials each), wt n = 15 (5 animals, three trials each). One unc-11(e47) animal did not respond and was removed from the analysis. (F) ASH responses in unc-11(e47) mutants. wt n = 21 (7 animals, three trials each). unc-11(e47) n = 23 (8 animals, 2–3 trials each). Red trace: mean of 9 trials (five animals, 1–2 trails each) with clear responses to odor addition. Magnitude of response does not differ from wt (p=0.72, peak odor response); Gray trace: mean of 14 trials that produced weak or non-detectable responses to odor addition, significantly different from wt (p<0.0001, peak odor response). One-way ANOVA, Tukey’s correction. (G,H) Average time constants from single exponential fits (initial 20 s of decay) of data in (E,F). For ASH unc-11(e47) mutants, only data from the red trace was used. Unpaired t-test, p<0.0001. AWCON unc-11(e47) n = 25 (10 animals, 2–3 trials each); wt n = 15 (5 animals, three trials each). ASH n as in (F). (I,J) Average axon fluorescence (first 5 frames of the recording). (I) AWCON wt n = 12 animals, unc-11(e47) n = 19 animals. (J) ASH wt n = 7 animals, unc-11(e47) n = 8 animals. Unpaired t-test, p<0.0001. Gray areas mark stimulus periods. Shading and error bars indicate S.E.M.
-
Figure 6—source data 1
Source data for Figure 6.
- https://doi.org/10.7554/eLife.31234.018
Figure 6—figure supplement 1
A proportion of VGLUT-pH recordings are consistent with multiple retrieval time constants.
(A,B) Three individual examples of AWCON (A) or ASH (B) VGLUT-pH decays that fit a double exponential decay model with greater than 95% likelihood based on AICp (see Materials and methods). Gray areas mark stimulus periods. (C,D) Percent of VGLUT-pH data that fits a double or triple exponential model with greater than 50% likelihood (AICp >50%). Box and whisker plot created by 10,000 sampled bootstrap sampling. (E) Frequency histogram of AICp-based likelihood values for double exponential fits to VGLUT-pH data. An AICp value of >50 supports a double exponential fit with increasing likelihood; an AICp of less than 50 supports a single exponential with increasing likelihood. (C–E) AWCON data: n = 218 (76 animals, 2–3 trials each). ASH data: n = 168 (56 animals, 2–3 trials each). (F,G) Average decay constants from double exponential fits. Note similarity of two AWCON timescales to effects of plasticity in Figure 7F. Fits that minimized tau1 or tau2 to ~zero were excluded from the average. AWCON data: n = 211 (76 animals, 2–3 trials each). ASH data: n = 125 (56 animals, 2–3 trials each). Error bars = standard deviation. t-test p<0.0001. All ASH and AWCON data pooled from wild-type data used in this study. AWCON stimulus = 11.2 µM butanone (60 s). ASH stimulus = 500 mM NaCl (10 s).
Figure 6—figure supplement 2

VGLUT-pH decay time constants are not correlated with expression level or response magnitude.
(A) Scatter plot of AWCON VGLUT-pH decay time constants versus baseline axon fluorescence intensity. Two different AWCON VGLUT-pH transgenic lines with different expression levels are represented by the black and blue points. Axon intensities were normalized to the brightest axon detected in the line (FLMAX). Time constants are from single exponential fits, as in Figure 6. Correlation coefficient = 0.01, p=0.89, not significant. (B) AWCON decay time constants plotted against the magnitude of basal release, dF/F0 prior to stimulus onset; F0 is fluorescence level prior to stimulus removal. Correlation coefficient = 0.024, p=0.73, not significant. (C) Scatter plots of ASH VGLUT-pH decay time constants versus baseline axon fluorescence intensity. Correlation coefficient = −0.029, p=0.72, not significant. (D) ASH decay time constants after stimulus removal, compared to peak dF/F during stimulus. Correlation coefficient = 0.058, p=0.46, not significant. AWCONn = 218 (76 animals, 2–3 trials each). ASH n = 168 (56 animals, 2–3 trials each).
Figure 7
Recent neural activity modulates AWCON VGLUT-pH retrieval.
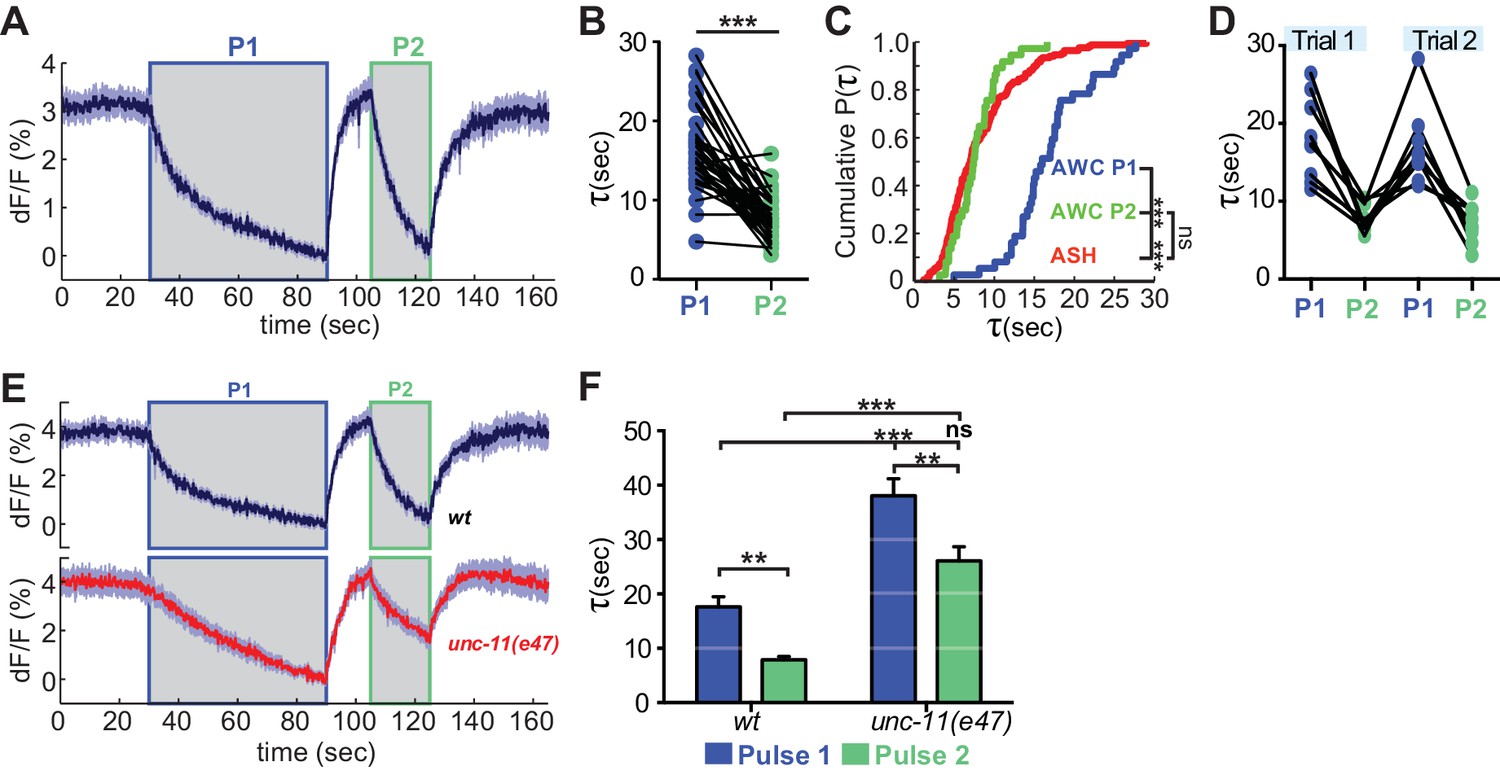
(A) Average AWCON VGLUT-pH response to two successive odor stimuli, applied for 60 s (P1) and 20 s (P2). n = 39 (13 animals, three trials each). (B) Time constants from single-term exponential fits to P1 and P2 from (A) performed on the initial 20 s of the decay for each pulse. n = 37 (13 animals, 2–3 trials each). Paired t-test, ***p<0.0001. (C) Cumulative distribution plot of time constants for AWC P1, AWC P2, and ASH VGLUT-pH decays. AWC P1 and AWC P2 data from (B) and ASH data from Figure 6D. Kruskal-Wallis and Dunn’s test for multiple comparisons, ***p<0.0001, ns p=0.1. (D) Time constants for P1 and P2 from two consecutive trials of the stimulation protocol in (A) (n = 8 animals, 70 s between trials). (E) Average AWC VGLUT-pH signals in wt and unc-11(e47) mutants. wt n = 21 (7 animals, three trials each). unc-11(e47) n = 25 (9 animals, three trials each) (two non-responding trials removed). (F) Average time constants from single exponential fits (initial 20 s of decay) of data in (E). wt n = 21 (7 animals, three trials each). unc-11(e47) n = 22 (8 animals, 2–3 trials each). Two-way ANOVA, ***p<0.0001, **p<0.008, ns (p=0.07). Gray areas marks stimulus periods. Shading and error bars indicate S.E.M. ns = not significant.
-
Figure 7—source data 1
Source data for Figure 7.
- https://doi.org/10.7554/eLife.31234.020
Figure 8 with 1 supplement
pkc-1 regulates AWCON glutamate release downstream of calcium influx.
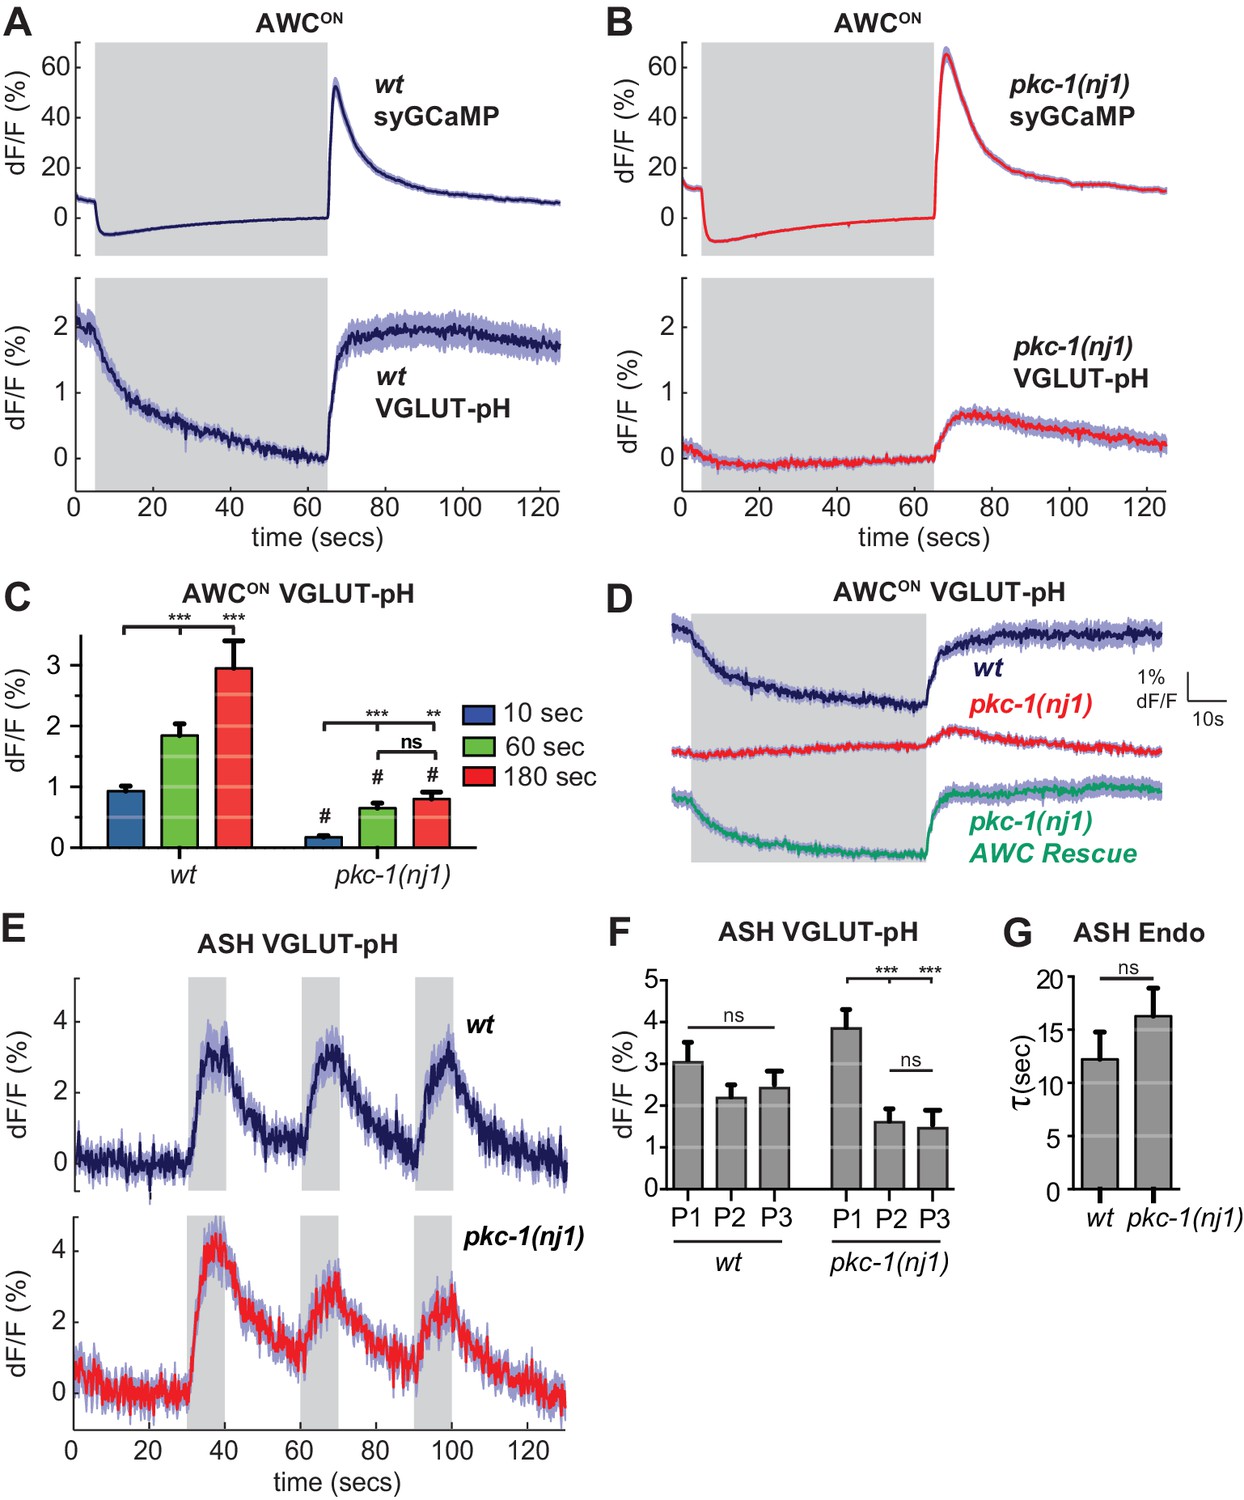
(A,B) AWCON synaptic calcium (top) and VGLUT-pH (bottom) responses in (A) wild-type and (B) pkc-1(nj1) mutant animals. wt SyGCaMP n = 21 (7 animals, three trials each), pkc-1 SyGCaMP n = 25 (9 animals, 1–3 trials each). wt VGLUT-pH n = 29 (10 animals, 2–3 trials each), pkc-1(nj1) VGLUT-pH n = 48 (17 animals, 2–3 trials each). (C) Average AWCON VGLUT-pH peak response magnitude after odor removal for indicated stimulation durations. #, different from wild-type p<0.0001. **p=0.0026, ***p<0.0001. Two-way ANOVA Tukey’s correction. 10 s pulses: wt n = 60 (10 animals, six trials each). pkc-1(nj1) n = 102 (17 animals, 4–6 trials each). 60 s pulses: as in (A,B). 3 min pulses: wt n = 8 (8 animals, one trial each). pkc-1(nj1) n = 15 (15 animals, one trial each). (D) Expression of pkc-1 cDNA in AWCON rescues pkc-1(nj1) VGLUT-pH responses. wt n = 18 (6 animals, three trials each). pkc-1(nj1) n = 30 (10 animals, three trials each). pkc-1(nj1) AWCON rescue n = 30 (10 animals, three trials each). (E) ASH VGLUT-pH responses in pkc-1(nj1) mutants. wt n = 15 (5 animals, three trials each). pkc-1(nj1) n = 15 (6 animals, 2–3 trials each). (F) Average ASH VGLUT-pH peak responses for each stimulus pulse (P1-3) within a trial. Data from (E). Two-way ANOVA Tukey’s correction. ***p<0.0001. (G) Average time constants from single exponential fits of data in (E, first pulse). Supporting statistical analysis for all panels is detailed in Supplementary file 3C and Source Data. Gray areas mark stimulus periods. Shading and error bars indicate S.E.M. ns = not significant.
-
Figure 8—source data 1
Source data for Figure 8.
- https://doi.org/10.7554/eLife.31234.023
Figure 8—figure supplement 1
pkc-1(lf) alters synaptic release downstream of calcium influx.
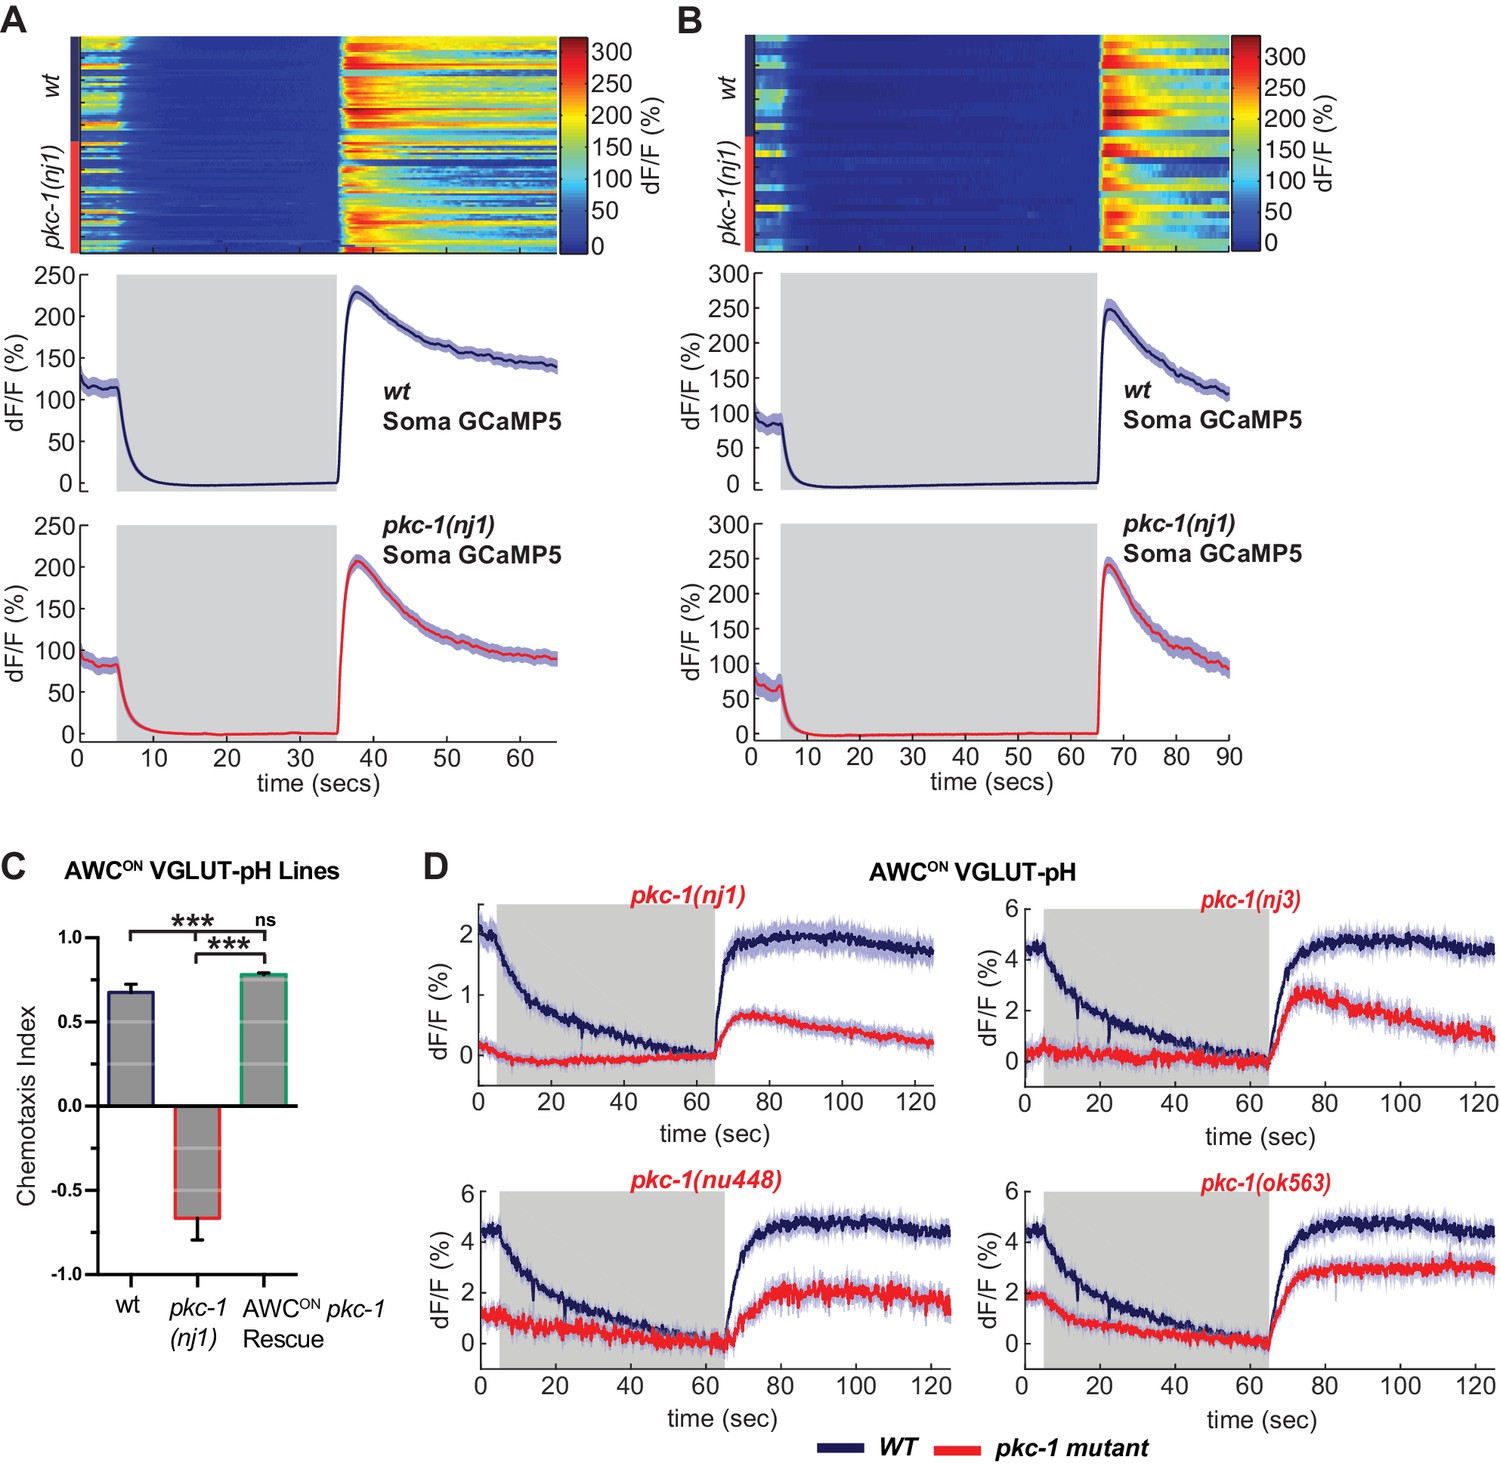
(A,B) AWCON GCaMP5 responses to 30 s (A) and 60 s (B) pulses of butanone, measured at the soma. Top panels: Heat map of individual trials. Bottom: average across trials. (A) pkc-1(nj1) n = 50 (17 animals, 2–3 trials each), wt n = 47 (16 animals, 2–3 trials each). (B) pkc-1(nj1) n = 16 (16 animals), wt n = 16 (16 animals), one trial each. (C) Butanone chemotaxis index (see Materials and methods) of AWCON VGLUT-pH transgenics used in Figure 8D, showing that expression of pkc-1 cDNA in AWCON under the str-2 promoter rescues pkc-1(nj1) chemotaxis. n = 3 population assays per genotype. One-way ANOVA, ***p<0.0001. ns = not significant. Error bars = S.E.M. (D) VGLUT-pH responses in pkc-1 mutant alleles. nj1 and nu488 disrupt the kinase domain, nj3 terminates the protein before the kinase domain, and ok563 disrupts two of three isoforms (see Supplementary file 2). pkc-1(nj1) data are from Figure 8B. pkc-1(nu448) n = 10 (4 animals, 2–3 trials each), pkc-1(nj3) n = 18 (6 animals, three trials each), pkc-1(ok563) n = 48 (16 animals, three trials each), wt n = 36 (12 animals, three trials each). Alleles nu488, nj3 and ok563 are plotted with the mean response of pooled wild-type controls from those experiments. Gray areas mark stimulus periods, 11.2 µM butanone. Shading = S.E.M.
Additional files
-
Source code 1
Tracking and analysis source codes
- https://doi.org/10.7554/eLife.31234.024
-
Supplementary file 1
Strain list
- https://doi.org/10.7554/eLife.31234.025
-
Supplementary file 2
Molecular identities of mutations
- https://doi.org/10.7554/eLife.31234.026
-
Supplementary file 3
(A) Supporting statistics tables for Figure 3 (B) Supporting statistics tables for Figure 4 (C) Supporting statistics tables for Figure 8.
- https://doi.org/10.7554/eLife.31234.027
-
Transparent reporting form
- https://doi.org/10.7554/eLife.31234.028
Download links
A two-part list of links to download the article, or parts of the article, in various formats.
Downloads (link to download the article as PDF)
Open citations (links to open the citations from this article in various online reference manager services)
Cite this article (links to download the citations from this article in formats compatible with various reference manager tools)
Diverse modes of synaptic signaling, regulation, and plasticity distinguish two classes of C. elegans glutamatergic neurons
eLife 6:e31234.
https://doi.org/10.7554/eLife.31234


