Local processing in neurites of VGluT3-expressing amacrine cells differentially organizes visual information
- Washington University School of Medicine, United States
- Allen Institute for Brain Science, United States
Figures
Figure 1 with 3 supplements
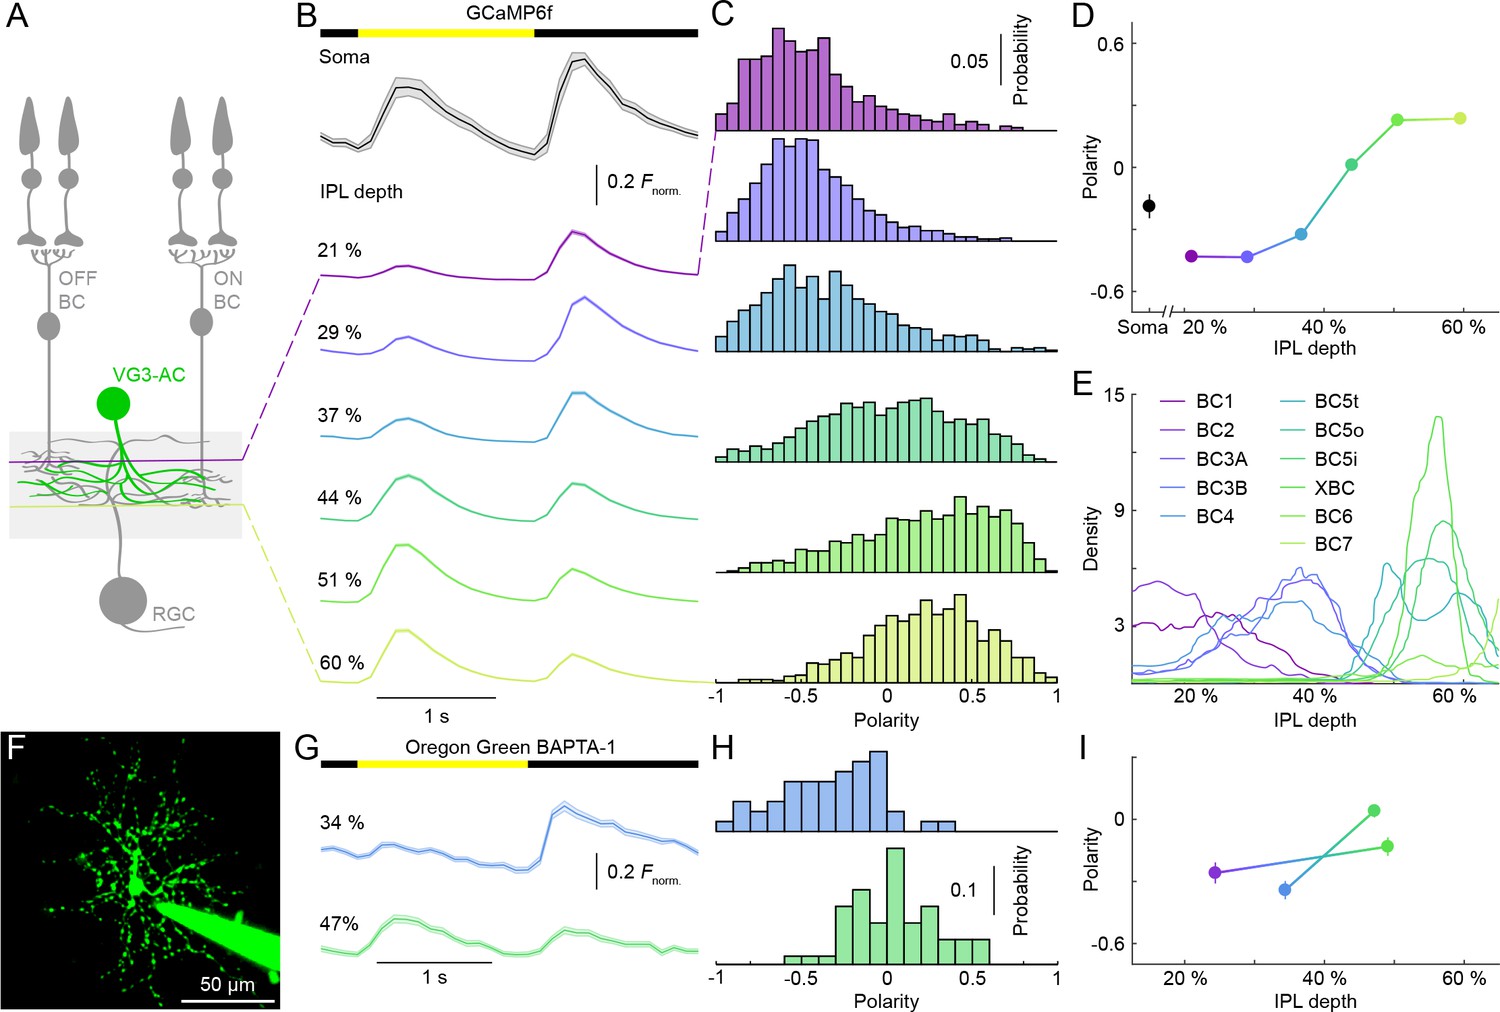
Contrast preferences of VG3-AC neurites shift across IPL depths.
(A) Schematic of the VG3-AC circuit. VG3-AC neurites receive input from ON and OFF bipolar cells (ON and OFF BC) and synapse onto RGCs. (B) Ca2+ transients of ROIs at different imaging depth elicited by contrast steps in a small spot (diameter: 100 μm). A bar at the top indicates the stimulus timing. The black trace (shaded area) shows the mean (±SEM) responses of VG3-AC somata (n = 15). The six color-coded traces (shaded areas) indicate the mean (±SEM) responses of neurite ROIs at different IPL depths (21%: n = 673, purple; 29%: n = 972, blue; 37%: n = 817, sky; 44%: n = 1029, green; 51%: n = 1380, lime; 60%: n = 928, olive). (C, D) Distributions (C) and mean ± SEM (D) of polarity indices of VG3-AC neurite ROIs at different IPL depths color-coded as in (B). Polarity indices differed between IPL depths (p<10−16, Kruskal-Wallis one-way ANOVA). ROIs at 21% and 29% IPL depth were more biased to OFF responses than at other depths (p<10−4 compared to 37%; p<10−7 for 44–60%). ROIs from 51–60% IPL depth were more biased to ON than ROIs from 21–44% (p<10−7). No significant differences were observed between 21% and 29% (p=0.99) and between 51% and 60% (p=0.98). Even without image segmentation, using the average activity of each image plane a single data point, polarity indices differed across IPL depths (p<10−12, Kruskal-Wallis one-way ANOVA; 21%: n = 15; 29%: n = 18; 37%: n = 14; 44%: n = 16; 51%: n = 23; 60%: n = 20). (E) Lines show the distributions (i.e. skeleton densities) of axons of different OFF (BC1 – BC4) and ON (BC5t – BC7) bipolar cells types from 15–65% IPL depth, according to (Greene et al., 2016; Helmstaedter et al., 2013) (F) Representative image of a VG3-AC filled with Oregon Green BAPTA-1 via a patch-clamp pipette. (G, H) The average responses (±SEM, G) and polarity index distributions (H) of ROIs of a single VG3-AC at two IPL depths (34%: n = 50, blue; 47%: n = 59, green). (I) Depth-dependent shift in polarity indices (mean ±SEM) of neurite ROIs of two VG3-ACs filled with Oregon Green BAPTA-1 (depth-dependent differences within cells p<10−8 and p<0.05).
Figure 1—figure supplement 1
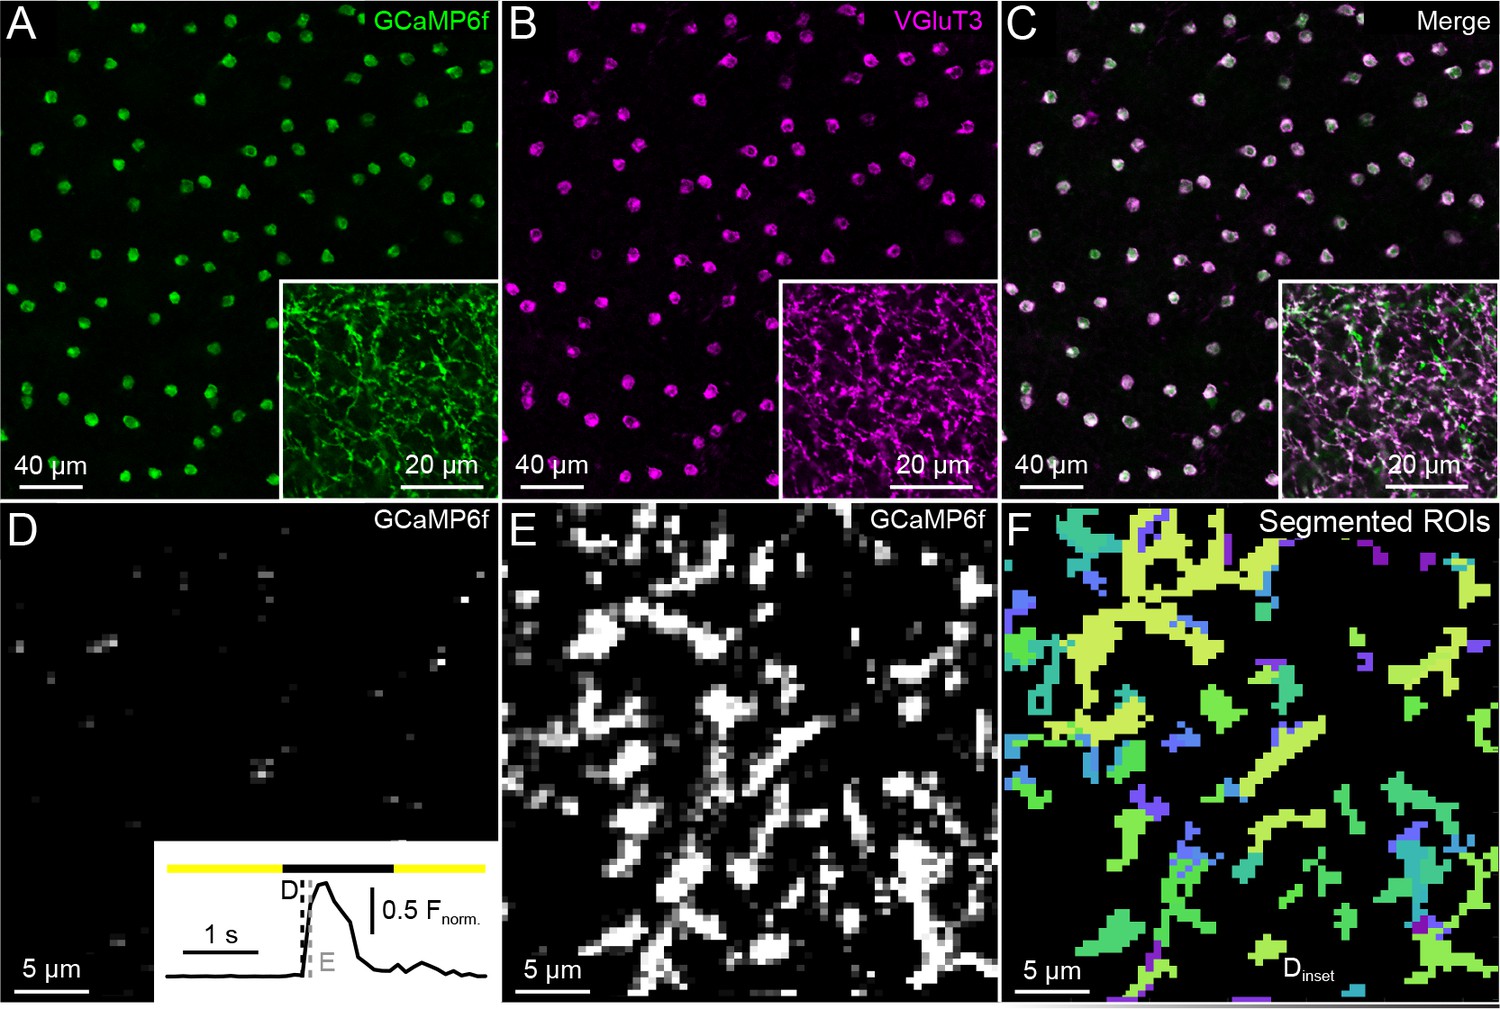
Specificity of GCaMP6f expression, VG3-AC neurite Ca2+responses, and functional image segmentation.
(A–C). Representative confocal images of the inner nuclear layer and IPL (insets) stained with anti-GFP, which recognizes GCaMP6f (A, C, green), and anti-VGluT3 (B, C, magenta). Conditional probabilities for co-staining were P(VGluT3-positive | GCaMP6f-positive)=1 (n = 111 cells) and P(GCaMP6f-positive | VGluT3-positive)=0.98 (n = 113 cells). We used optic nerve crush experiments to confirm that sparse off target expression RGCs of VG3-Cre mice did not significantly affect our results (Figure 1—figure supplement 3). (D) Inset: a representative GCaMP6f response trace of an ROI marked in (F), responding to a small spot of light (diameter: 100 μm). (D–E) Frames of a two-photon image series at time points indicated by dashed lines in the inset of (D). (F) Image segmentation of the scan field shown in (D) and (E) by a serial clustering procedure (see Materials and methods).
Figure 1—figure supplement 2
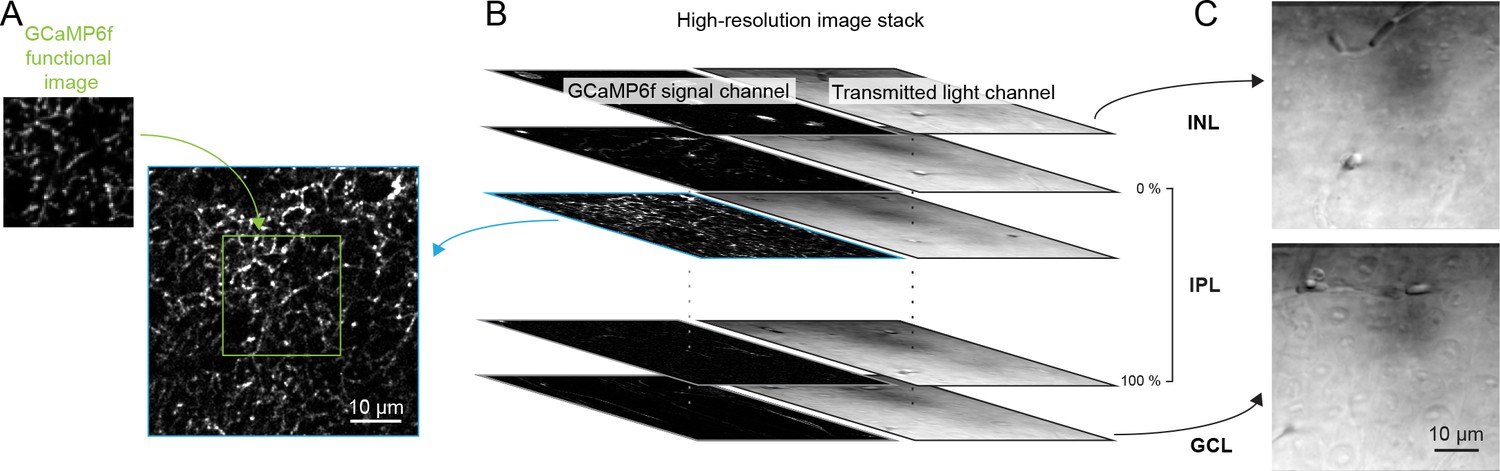
Registration of scan fields of functional GCaMP6f imaging to high-resolution image stacks to identify IPL depth.
(A, B) Each functional imaging scan field of VG3-AC neurites (A), green, 64 × 80 pixels over 33 × 33 µm) was registered to one frame of a high-resolution image stack (B), blue, 512 × 512 pixels over 75 × 75 µm, 0.2 µm / z step) acquired at the end of the functional imaging series. (C) Transmitted laser light was collected during acquisition of the high-resolution stack and used to identify the boundaries of the IPL. Top: transmitted light image of the inner plexiform layer (INL). Bottom: transmitted light image of the ganglion cell layer (GCL).
Figure 1—figure supplement 3

Depth-dependent shift in contrast preferences in neurites of VG3-Cre:Ai148 mice 3 weeks after optic nerve crush.
(A) Ca2+ transients of ROIs at different imaging depth to a contrast steps in a small spot (diameter: 100 μm) recorded 3 weeks after optic nerve crush, which removes most RGCs (Park et al., 2008). The somata of VG3-ACs are localized exclusively in the inner nuclear layer; and all cells labeled by GCaMP6f in the ganglion cell layer of VG3-Cre:Ai148 mice have axons, suggesting that they are RGCs. To confirm the loss of RGCs after unilateral optic nerve crush, we compared the number of GCaMP6f-positive somata in the ganglion cell layer of the affected eye 3 weeks after nerve crush, to the number of GCaMP6f-positive somata in the ganglion cell layer of the other eye. This revealed that optic nerve crush reduced the RGC density by 74%. A bar at the top indicates the stimulus timing. The different color-coded traces (shaded areas) indicate the mean (±SEM) responses of ROIs at different IPL depths (23%: n = 120, purple; 30%: n = 203, blue; 42%: n = 178, green; 50%: n = 156, lime; 59%: n = 156, olive). (B) Distributions of polarity indices of VG3-AC neurite ROIs at different IPL depths color-coded as in (A). (C) Schematic of optical nerve crush procedure. (D) Summary data (mean ± SEM) of polarity indices as a function of IPL depth. Polarity indices differed between different IPL depths (p<10−101, Kruskal-Wallis one-way ANOVA). ROIs at 23% and 30% IPL depth were more biased to OFF responses than at other depths (p<10−8 for 41–59%). ROIs from 50–59% IPL depth were more biased to ON responses than ROIs from 23–32% (p<10−8 for 23–30%; p<10−4 for 42%). No significant differences were observed between 23% and 30% (p=0.79) nor between 50% and 59% (p=0.62).
Figure 2 with 3 supplements
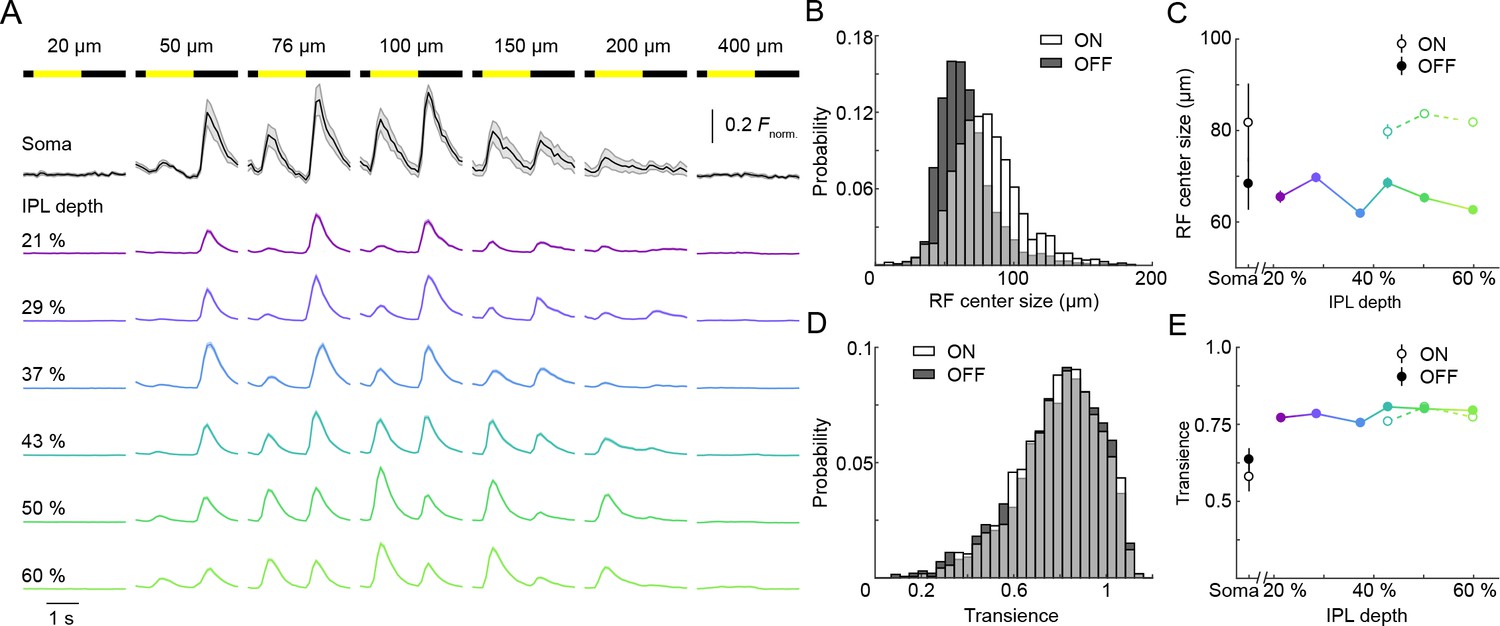
ON and OFF responses in VG3-AC neurites differ in preferred stimulus size, but are equally transient.
(A) Ca2+ responses of ROIs at different imaging depths to contrast steps in spots of different size. Spot diameters are noted above the bars indicating stimulus timing. The black traces (shaded areas) show the mean (±SEM) responses of VG3-AC somata (n = 8). The color-coded traces (shaded areas) indicate the mean (±SEM) responses of ROIs at different IPL depths (21%: n = 306, purple; 29%: n = 456, blue; 37%: n = 336, sky; 43%: n = 367, green; 50%: n = 700, lime; 60%: n = 588, olive). (B) The distributions of ON (white) and OFF (dark gray) receptive field center sizes of VG3-AC neurite ROIs. ON receptive field centers were larger than OFF receptive field centers (p<10−99, Wilcoxon rank sum test) (C) Receptive field center sizes (mean ±SEM) of ON (open circles) and OFF (filled circles) responses as a function of IPL depth. Because small response amplitudes led to rejection of >50% of ON responses of ROIs from 21–37% IPL depth (s. Material and methods), we restrict comparisons to 43–60% IPL depth. At all these depths, ON receptive field center sizes were larger than OFF receptive field center sizes (43%: p<10−8, 50%: p<10−9, 60%: p<10−9, Wilcoxon rank sum test with multiple comparison correction using the Benjamini–Hochberg procedure). Even without image segmentation, using the average activity of each image plane a single data point, ON receptive field centers were larger than OFF receptive field centers (p<10−3, Wilcoxon rank sum test, total: n = 61, 21%: n = 6; 29%: n = 13; 37%: n = 7; 43%: n = 6; 50%: n = 12; 60%: n = 17). (D) The distributions of transience indices of ON (white) and OFF (dark gray) responses of VG3-AC neurite ROIs did not differ significantly (p=0.925, Wilcoxon rank sum test). (E) Summary data (mean ± SEM) of transience indices of ON (open circle) and OFF (filled circle) responses as a function of IPL depth. Due to the high rejection rate of ON responses from 21 to 37% IPL depth, comparisons were restricted to 43–60% IPL depth. Transience indices of ON response is marginally lower than those of OFF responses at 43% (p<0.05), but were not significantly different at 50% (p=0.82) and 60% (p=0.05) IPL depth (Wilcoxon rank sum test with multiple comparison correction using the Benjamini–Hochberg procedure). We are not sure what accounts for the greater response transience observed in VG3-AC neurites vs. somata (p<10−4, Wilcoxon rank sum test). One possibility is that inhibitory synaptic inputs favor neurites and abbreviate responses.
Figure 2—figure supplement 1
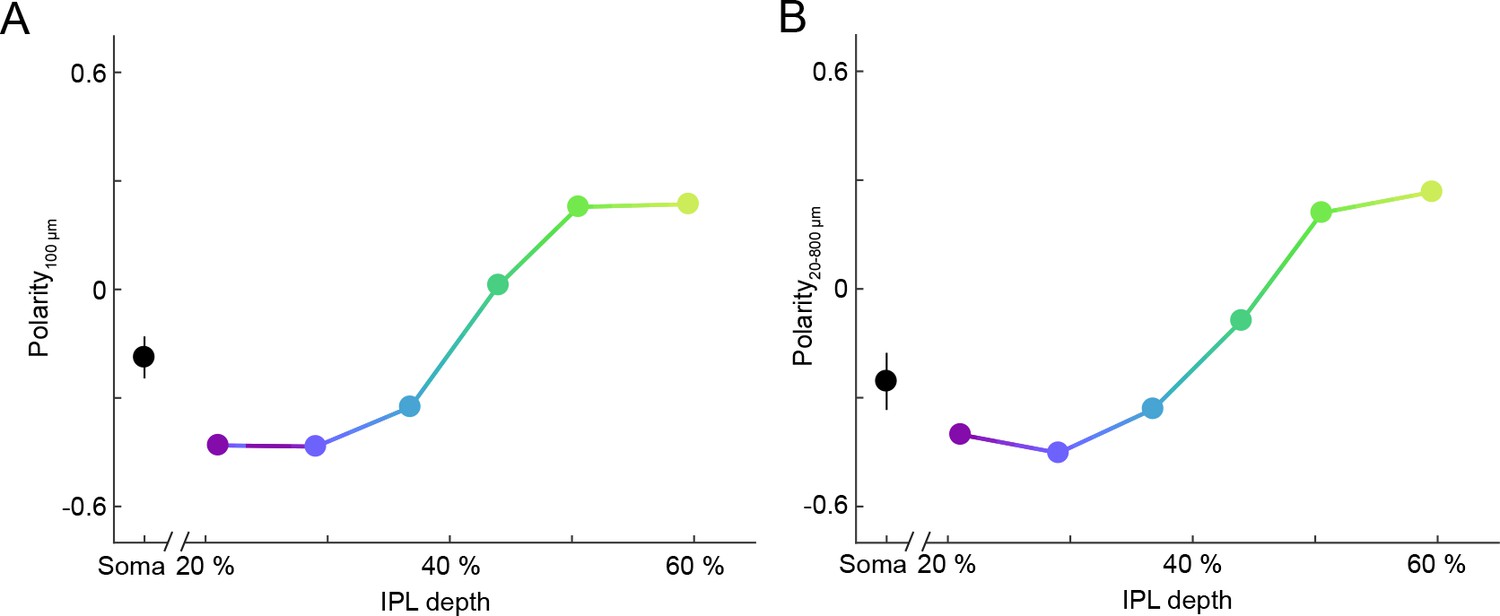
Depth-dependent shift in contrast preferences of VG3-AC neurites is robust across stimulus sizes.
(A, B) Summary data (mean ± SEM) of polarity indices as a function of IPL depth, calculated from responses to a single spot size (A), diameter: 100 μm, s. Figure 1D) or from responses to all stimulus sizes (B), diameters: 20 μm – 800 μm). In (B), polarity indices differed between different IPL depths (p<10−65, Kruskal-Wallis one-way ANOVA). ROIs at 21% and 29% IPL depth were more biased to OFF responses than at other depths (p<10−7 for 37–60%). ROIs at 60% IPL depth were more biased to ON responses than ROIs from 21 to 51% (p<10−7 for 21–44%; p<0.01 for 51%).
Figure 2—figure supplement 2
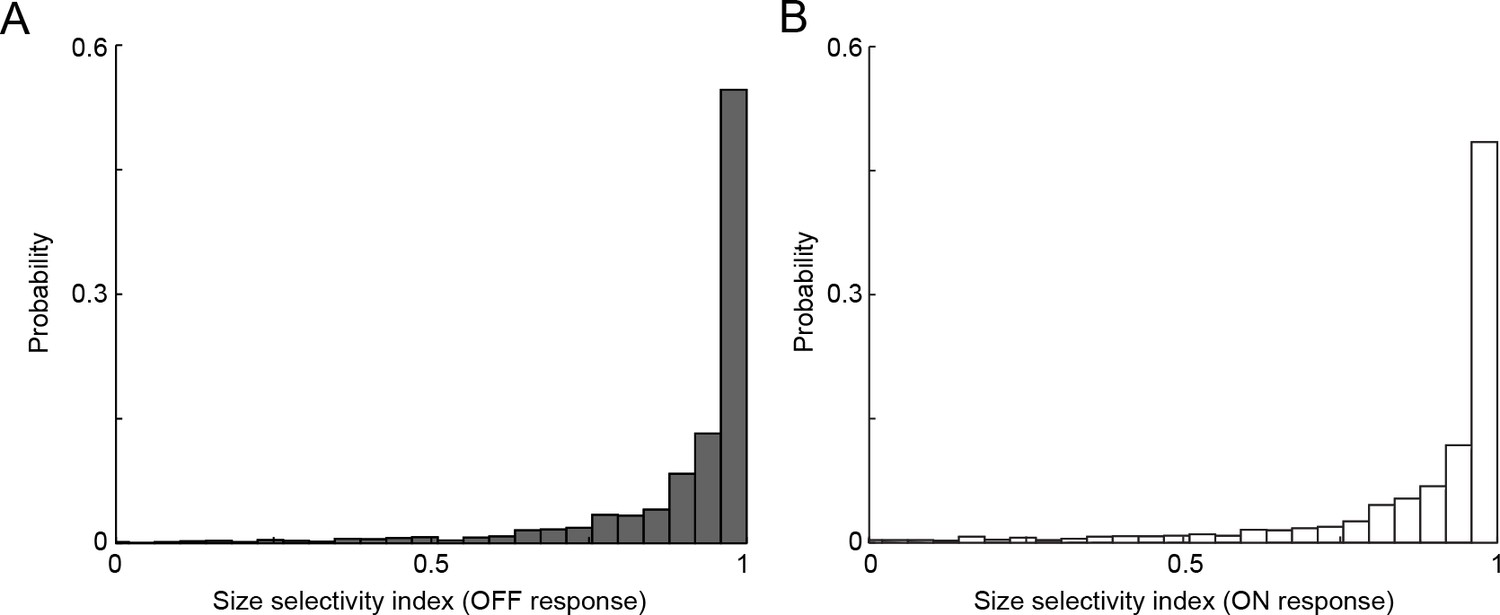
VG3-AC neurites respond selectively to small stimuli.
(A, B) The distribution of size selectivity indices calculated as the ratio of the difference between responses (A: OFF, B: ON) to small (diameter: 100 μm) and large (diameter: 400 μm) and the sum of these responses in VG3-AC neurite ROIs. The median of size selectivity indices were 0.97 and 0.95 for OFF and ON responses, respectively. For presentation purposes, negative size selectivity indices are not shown (1.8% and 5.4% of ROIs for OFF and ON responses, respectively).
Figure 2—figure supplement 3

Scan rates did not limit measurement of VG3-AC neurite response transience.
(A) Ca2+ transients of ROIs recorded at different scan rates from two different IPL depths. The bar at the top indicates the stimulus timing. Black traces (shaded areas) show the mean (±SEM) responses of VG3-AC neurites scanned at 9.5 Hz; and teal traces (shaded areas) show the mean (±SEM) responses of VG3-AC neurites scanned at 37.9 Hz. (40% at 9.5 Hz: n = 126; 40% at37.9 Hz: n = 67; 54% at 9.5 Hz: n = 62; 54% at 37.9 Hz: n = 28.) (B) Summary data (mean ± SEM) of transience indices as a function of IPL depth for responses scanned at 9.5 Hz (black) and 37.9 Hz (teal). The response transience of ROIs was not significantly different between frequencies (p=0.22, main effect of frequency, three-way ANOVA). The interactions between frequency and contrast (p=0.83), frequency and depth (p=0.11), and among frequency, contrast and depth (p=0.31) were not significantly different.
Figure 3
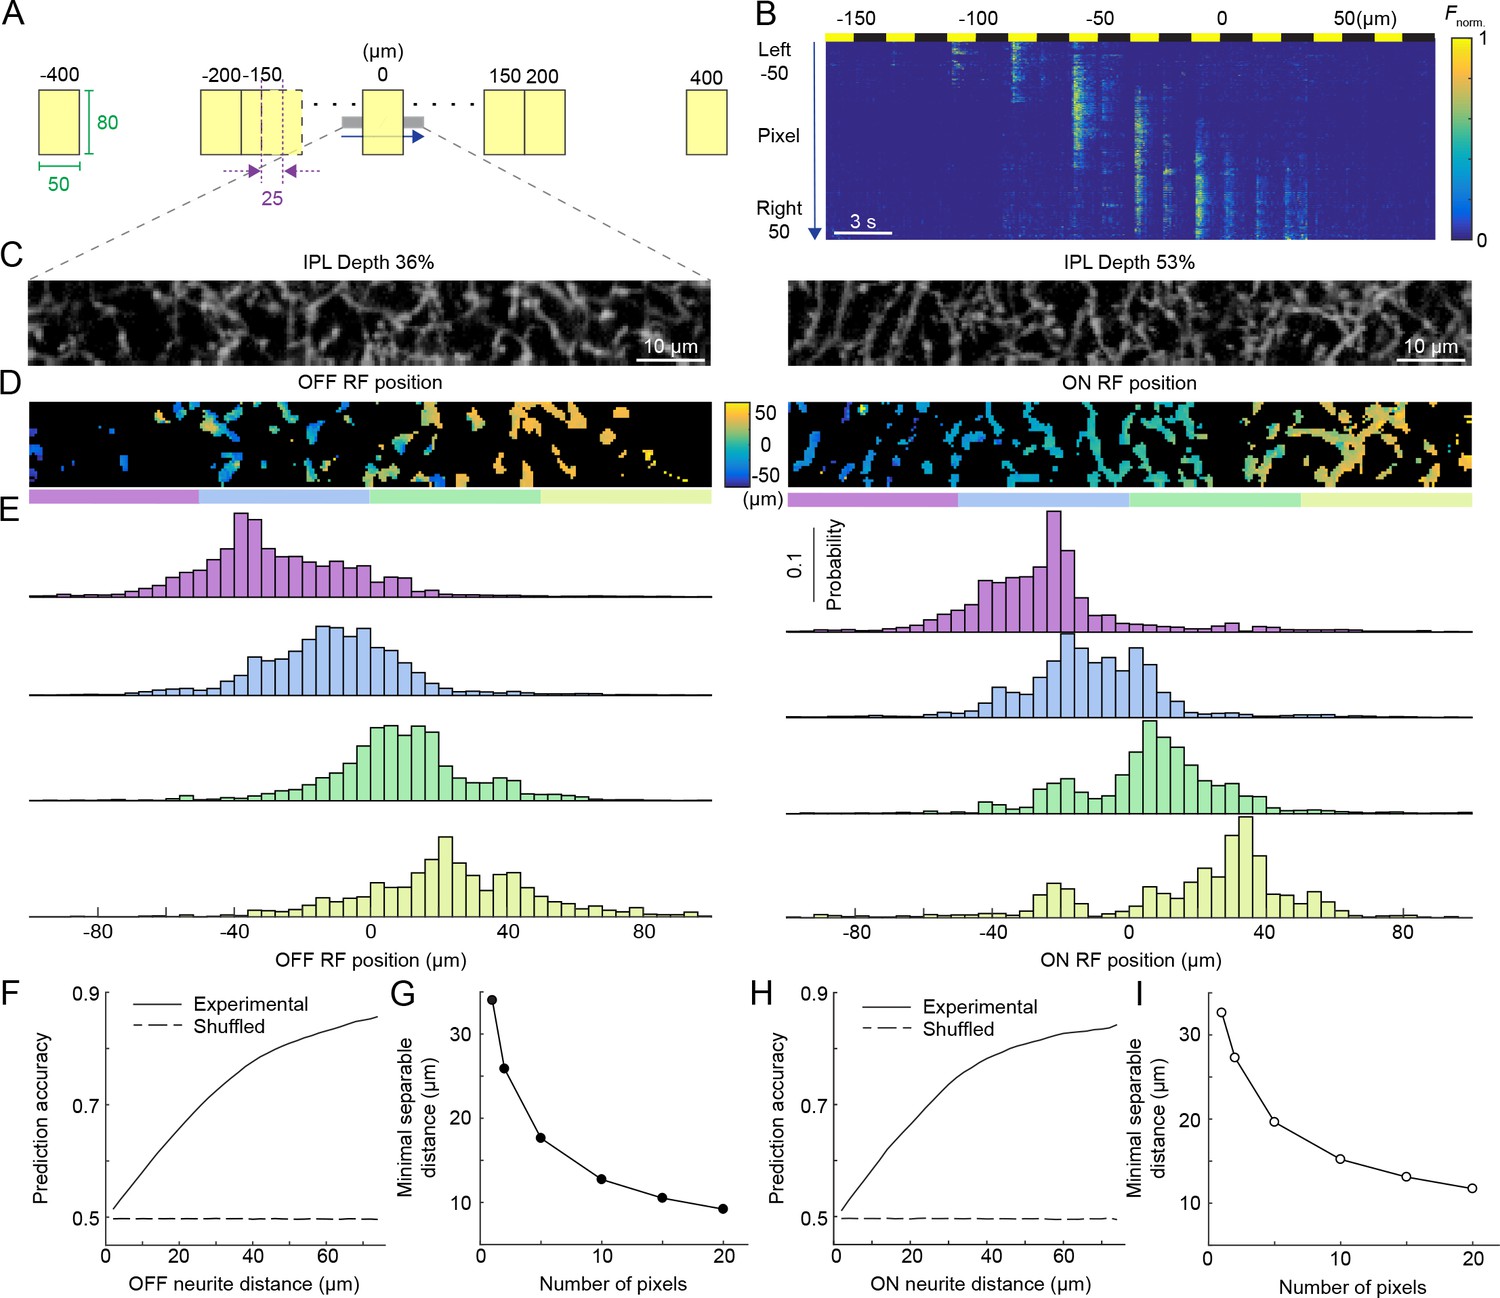
Population activity of the VG3-AC plexus encodes spatial information with high precision.
(A) Schematic of visual stimulus. Vertical bars (height: 60–80 μm, height: 50 μm width) were presented at 17 different positions along the horizontal axis of a rectangular imaging region (height: 13 μm, width: 100 μm). Stimulus positions were symmetric around the center of the imaging region and spaced by 25 μm center-center distances from −150 μm to 150 μm. In addition, bars were presented −400 μm, −200 μm, 200 μm, and 400 μm from the center of the imaging region. Each bar was presented three for 1.5 s with an interval of 1.5 s between stimuli. The order of stimulus positions was randomized and each stimulus repeated three times. (B) Heatmap of normalized responses in VG3-AC neurites to bars stimuli from −150 μm to 100 μm from the center of the imaging region at an IPL depth of 53%. Responses have been reordered by stimulus positions. Each row of the heatmap represents the activity a single pixel. Pixels were sorted by their distance from the center of the imaging region (−50 μm to 50 μm). (C) Representative images of the VG3-AC plexus in the scan region obtained by averaging the GCaMP6f signal over (left: IPL depth 36%, right: IPL depth 53%). (D) Maps of receptive field positions in the same regions of the VG3-AC plexus shown in (C) (left: OFF responses, right: ON responses). (E) Distributions of receptive field positions of pixels in four adjacent subsections (color-coded from left to right in: purple, sky, lime, and olive) of the scan regions shown in (C) and (D). Receptive field positions of the pixels of each image were aligned to zero their average. (F, H) The accuracy with which a naive Bayes classifier can assign the location of a VG3-AC neurite pixel based on its receptive field position to one of two image subsections increases as a function of the distance between these subsections (solid lines). Dashed lines shows the accuracy when classifiers were trained on shuffled receptive field positions. (G, I) The minimum separable distance (i.e. the point at which prediction accuracy reaches 75%) decreased when predictions were based on multiple pixels (e.g. median ROI size in VG3-AC neurites: 10 pixels).
Figure 4 with 1 supplement

Uniform local motion preference of VG3-AC neurites.
(A) Schematic at the top shows the time course of the grating motion in the receptive field center and surround (s. Video 2, and Materials and methods). The black trace (shaded area) shows the mean (±SEM) responses of VG3-AC somata (n = 11). The color-coded traces (shaded areas) indicate the mean (±SEM) responses of ROIs at different IPL depths (24%: n = 388, purple; 29%: n = 202, blue; 36%: n = 500, sky; 43%: n = 322, green; 49%: n = 308, lime; 58%: n = 298, olive). (B) The distribution of local motion preference indices of all ROIs. (C) Summary data (mean ± SEM) of local motion preference indices as a function of IPL depth. Local motion preference indices did not differ across IPL depths (p=0.09, Kruskal-Wallis one-way ANOVA). No ROI group at any depth was significantly different from any ROI group at another depth.
Figure 4—figure supplement 1

Uniform local motion preference of VG3-AC neurites.
Schematic at the top shows the time course of the grating motion in the receptive field center and surround (s. Video 2, and Materials and methods). Heatmaps of response of individual ROIs to this stimulus. Each panel shows the ROIs within a given depth group. The response of each ROI were normalized to their maximum. ROIs within each panel were sorted by their local motion preference indices in the descending order (24%: n = 388; 29%: n = 202; 36%: n = 500; 43%: n = 322; 49%: n = 308; 58%: n = 298).
Videos
Video 1
Ca2+imaging of VG3-AC neurite responses to contrast steps in spots of varying size recorded at different IPL depths.
Image series of GCaMP6f responses at 24% (middle) and 53% (right) IPL depth to contrast steps in spots of different size (left). The video is sped up 2.5-fold relative to the image acquisition. In the left panel, the area of the scan fields is indicated by a red box. Two average normalized ROI traces are shown at the bottom of the middle and the right panel.
Video 2
Ca2+imaging of VG3-AC neurite responses to white bar at different distance from the center.
Image series of GCaMP6f responses at 53% IPL depth to a vertical stimulus bar (1.5 s ON, 1.5 s OFF) presented at different positions along the horizontal axis of the imaging region. The video is sped up 2.5-fold relative to the image acquisition. The scan field is indicated by a red box. Normalized response traces of pixels from four different parts of scan field are shown at the bottom, color-coded according to the bar beneath the scan field.
Video 3
Ca2+imaging of VG3-AC neurite responses to motion.
Image series of GCaMP6f responses at 55% IPL depth (right) to synchronous or isolated motion of square wave gratings in the center and surround separated by a gray annulus (left). The video is sped up 1.25-fold relative to the image acquisition. In the left panel, the area of the scan fields is indicated by a red box. The average normalized ROI trace is shown at the bottom of the right panel.
Additional files
-
Transparent reporting form
- https://doi.org/10.7554/eLife.31307.016
Download links
A two-part list of links to download the article, or parts of the article, in various formats.
Downloads (link to download the article as PDF)
Open citations (links to open the citations from this article in various online reference manager services)
Cite this article (links to download the citations from this article in formats compatible with various reference manager tools)
Local processing in neurites of VGluT3-expressing amacrine cells differentially organizes visual information
eLife 6:e31307.
https://doi.org/10.7554/eLife.31307


