Oxytocin signaling in the medial amygdala is required for sex discrimination of social cues
- Howard Hughes Medical Institute, Harvard University, United States
Figures
Figure 1 with 1 supplement
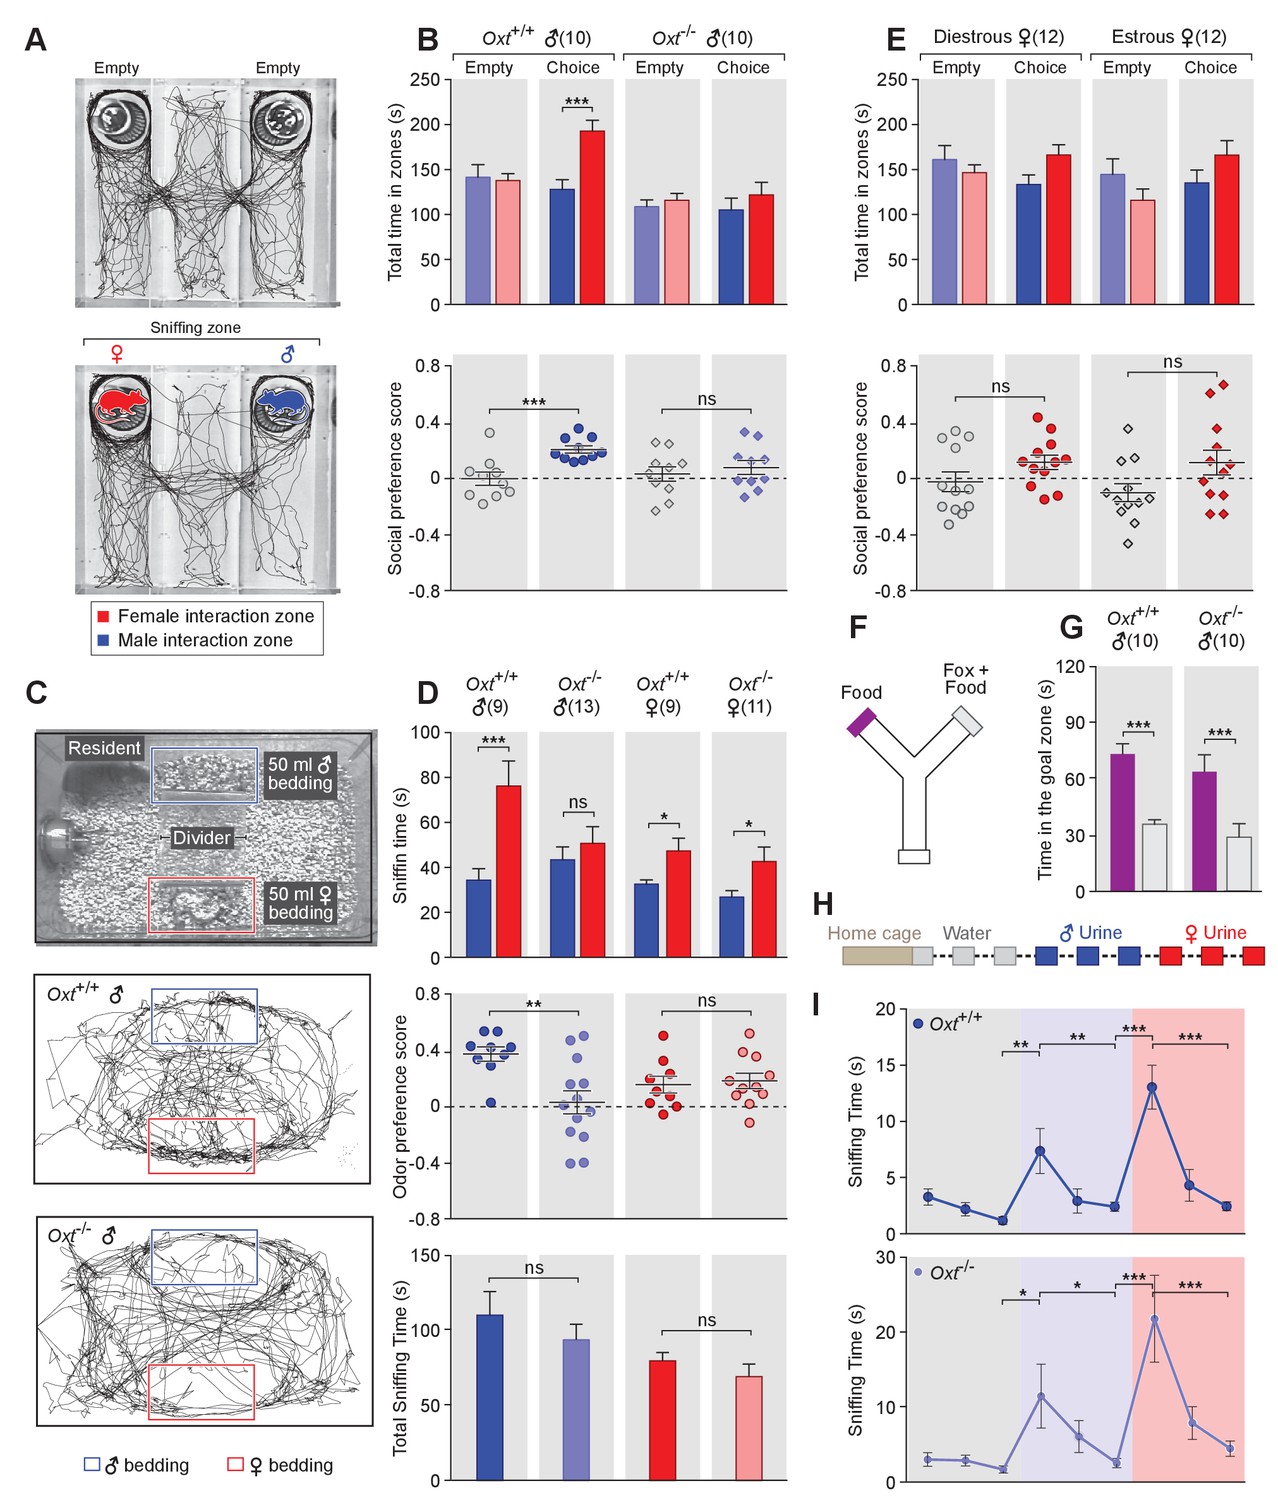
OXT signaling is required for male mice to discriminate female and male conspecifics.
(A) A 3-chamber-social-investigation paradigm testing social preference. Representative traces of a male subject mouse habituating in the 3-chamber paradigm with empty enclosure cups (Upper), and then exploring male and female mice confined in the enclosure cups (Bottom). (B) Comparison of time spent by Oxt+/+ and Oxt-/- male mice in each interaction zone (Upper, t test) and social preference score (Bottom, t test). ***p<0.001, ns, not significant. (C) A chemostimuli preference paradigm and representative traces of Oxt+/+ and Oxt-/- male mice. (D) Comparison of time spent by Oxt+/+ and Oxt-/- male and female mice investigating each odor cue (Upper, t test), odor preference score (Middle, t test) and total time spent investigating odor cues (Bottom, t test). ***p<0.001, **p<0.01, *p<0.05, ns, not significant. (E) Comparison of time spent by diestrous and estrous female mice in each interaction zone (Upper, t test) and social investigation preference score (Bottom, t test). (F–G) Y-maze paradigm testing the willingness of mice to investigate goal zones with food vs. fox urine spiked food. t test, ***p<0.001. (H) Odor habituation by repeat presentation of one urinary odor and dishabituation by a second urinary odor. (I) Time spent by mice investigating each odor indicates that both Oxt+/+ and Oxt-/- male can be habituated by the urine from one sex and then dishabituated by the urine from another sex. Fisher’s LSD test, ***p<0.001, **p<0.01, *p<0.05.
Figure 1—figure supplement 1
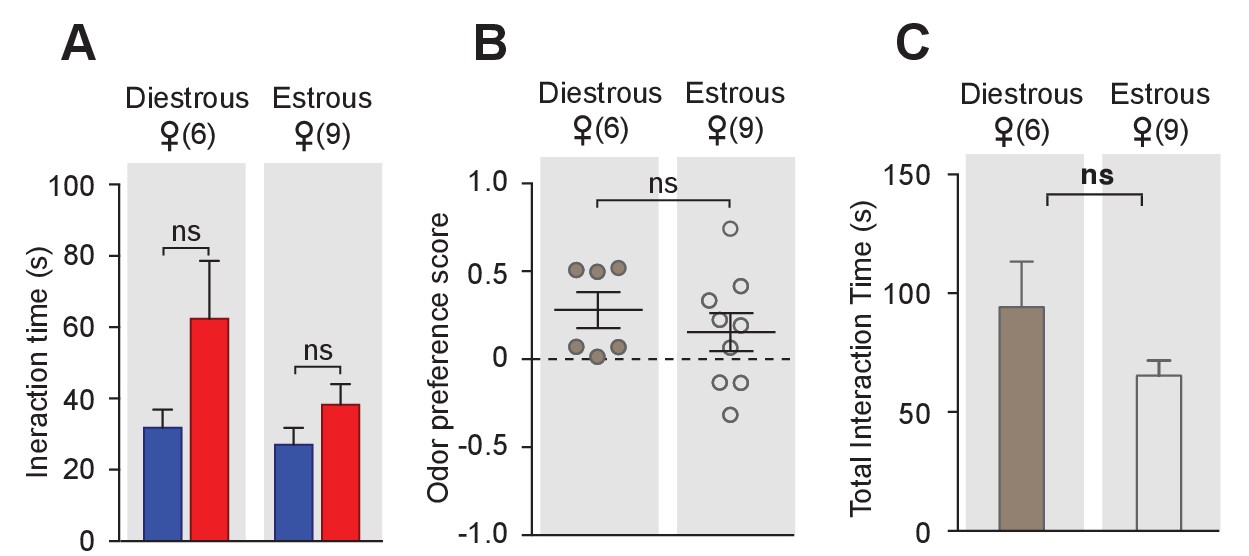
Conspecific odor cue preference of female mice in different estrous stages.
Female mice in different estrous stages did not show any preference in investigating female cues versus male cues (t test) (A), and did not differ in odor preference scores (t test) (B) and total investigation time (t test) (C).
Figure 2 with 2 supplements
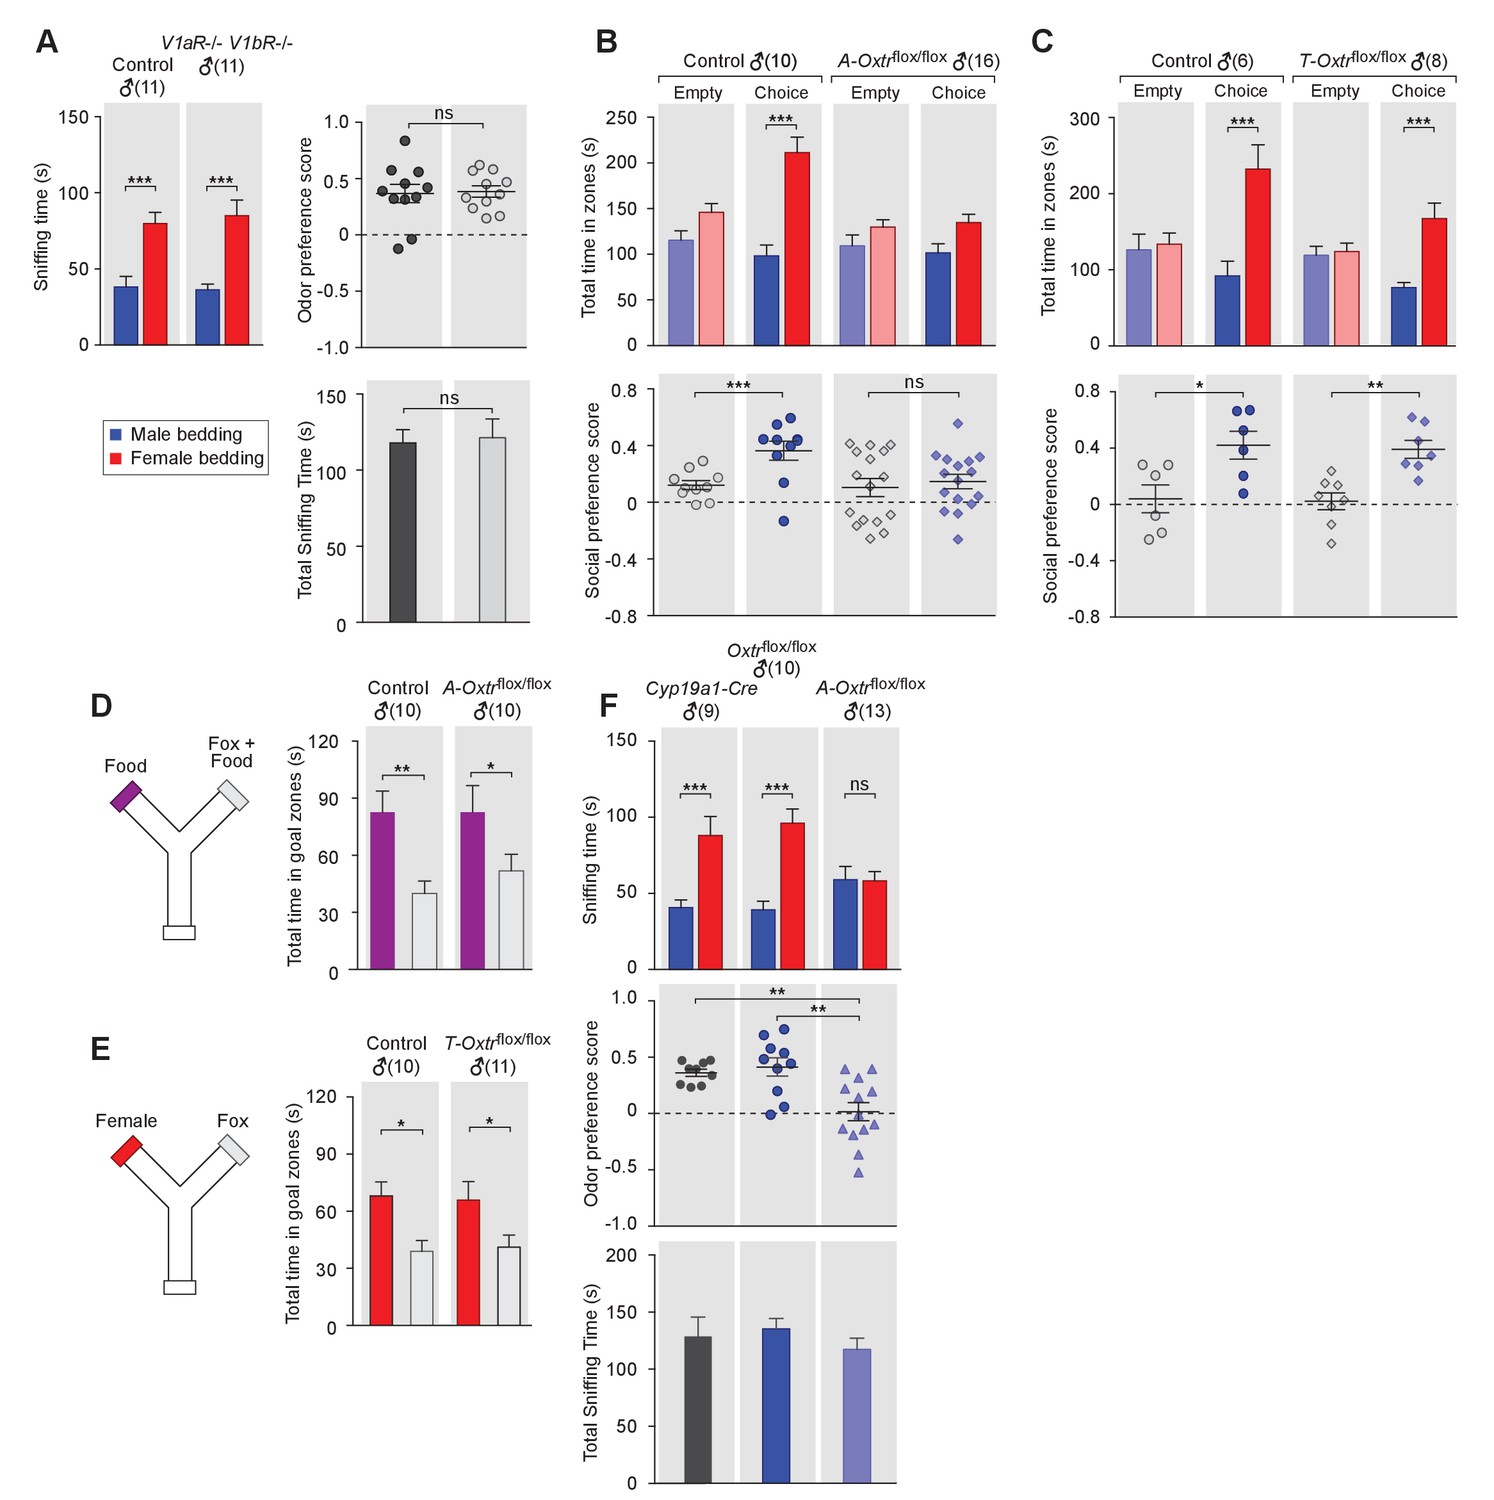
OXT signaling in aromatase-expressing neurons is required for the discrimination of male and female conspecifics.
(A) Male mice lacking AVP signaling showed normal preference for female conspecific cues. Left: time spent investigating each odor cue. Upper right: odor preference score; Bottom right: total time spent in the investigation of odor cues. t test, ***p<0.001, ns, not significant. (B) Male mice lacking OXT signaling in Cyp19a1 (aromatase)-expressing neurons (A-Oxtrflox/flox) have impaired preference for female conspecifics in the 3-chamber social preference test. Upper: time spent in each interaction zone. Bottom: social preference score. t test, ***p<0.001, **p<0.01, ns, not significant. (C) Comparison of control (Oxtrflox/flox) and Trh-Cre; Oxtrflox/flox (T-Oxtrflox/flox) mice in social interaction preference using the 3-Chamber paradigm. Upper: time spent in each interaction zone. Bottom: social preference score. t test, ***p<0.001, **p<0.01, *p<0.05. (D) Y-maze paradigm testing the willingness of control and A-Oxtrflox/flox male mice to investigate food vs. fox urine spiked food. t test, **p<0.01, *p<0.05. (E) Responses of control and T-Oxtrflox/flox mice to predator cues and female cues in a Y-maze paradigm. t test, *p<0.05. (F) Male mice lacking OXTR (A-Oxtrflox/flox) in aromatase-expressing neurons have impaired preference for female olfactory cues. Upper: time spent investigating each odor cue. Middle: odor preference score. Bottom: total time spent in the investigation of odor cues. t test, **p<0.01, ***p<0.001, ns, not significant.
Figure 2—figure supplement 1
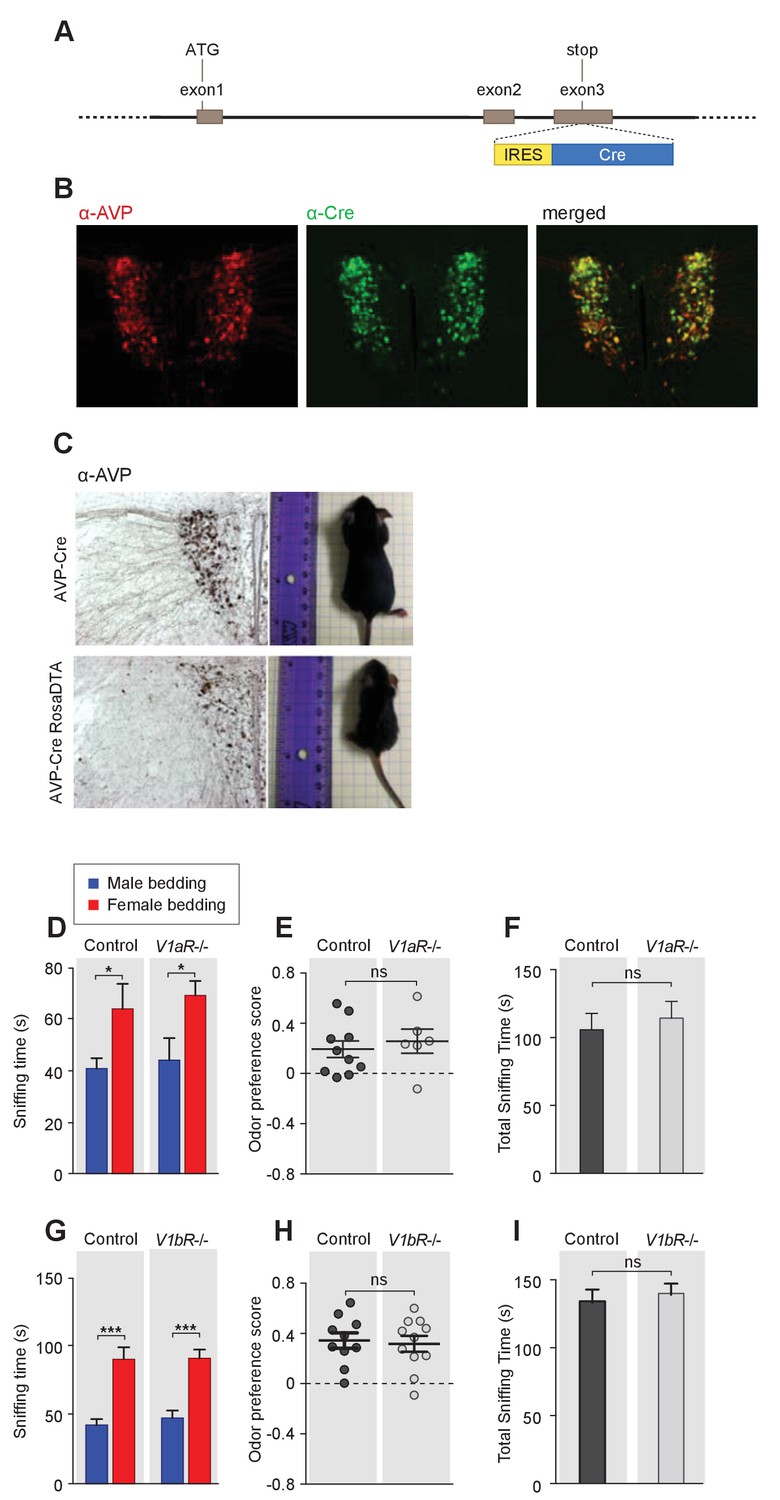
Odor preference of male mice with impaired AVP signaling.
(A) Schematic illustration of the BAC transgenic Avp-IRES-Cre line. (B) Co-labeling of AVP and Cre Immunostaining in Avp-IRES-Cre mouse. (C) Avp-Cre crossed to the ROSA26-eGFP-DTA line leads to dramatic reduction in the number of AVP neurons and the body size of animals (male littermates around 1 month old). (D–F) Duration of olfactory investigation (t test), odor preference score (t test), and total investigation time (t test) of control and V1aR-/- male mice. *p<0.05, ns, not significant. (G–I) Duration of olfactory investigation (t test), odor preference score (t test), and total investigation time (t test) of control and V1bR-/- male mice, ***p<0.001, ns, not significant.
Figure 2—figure supplement 2
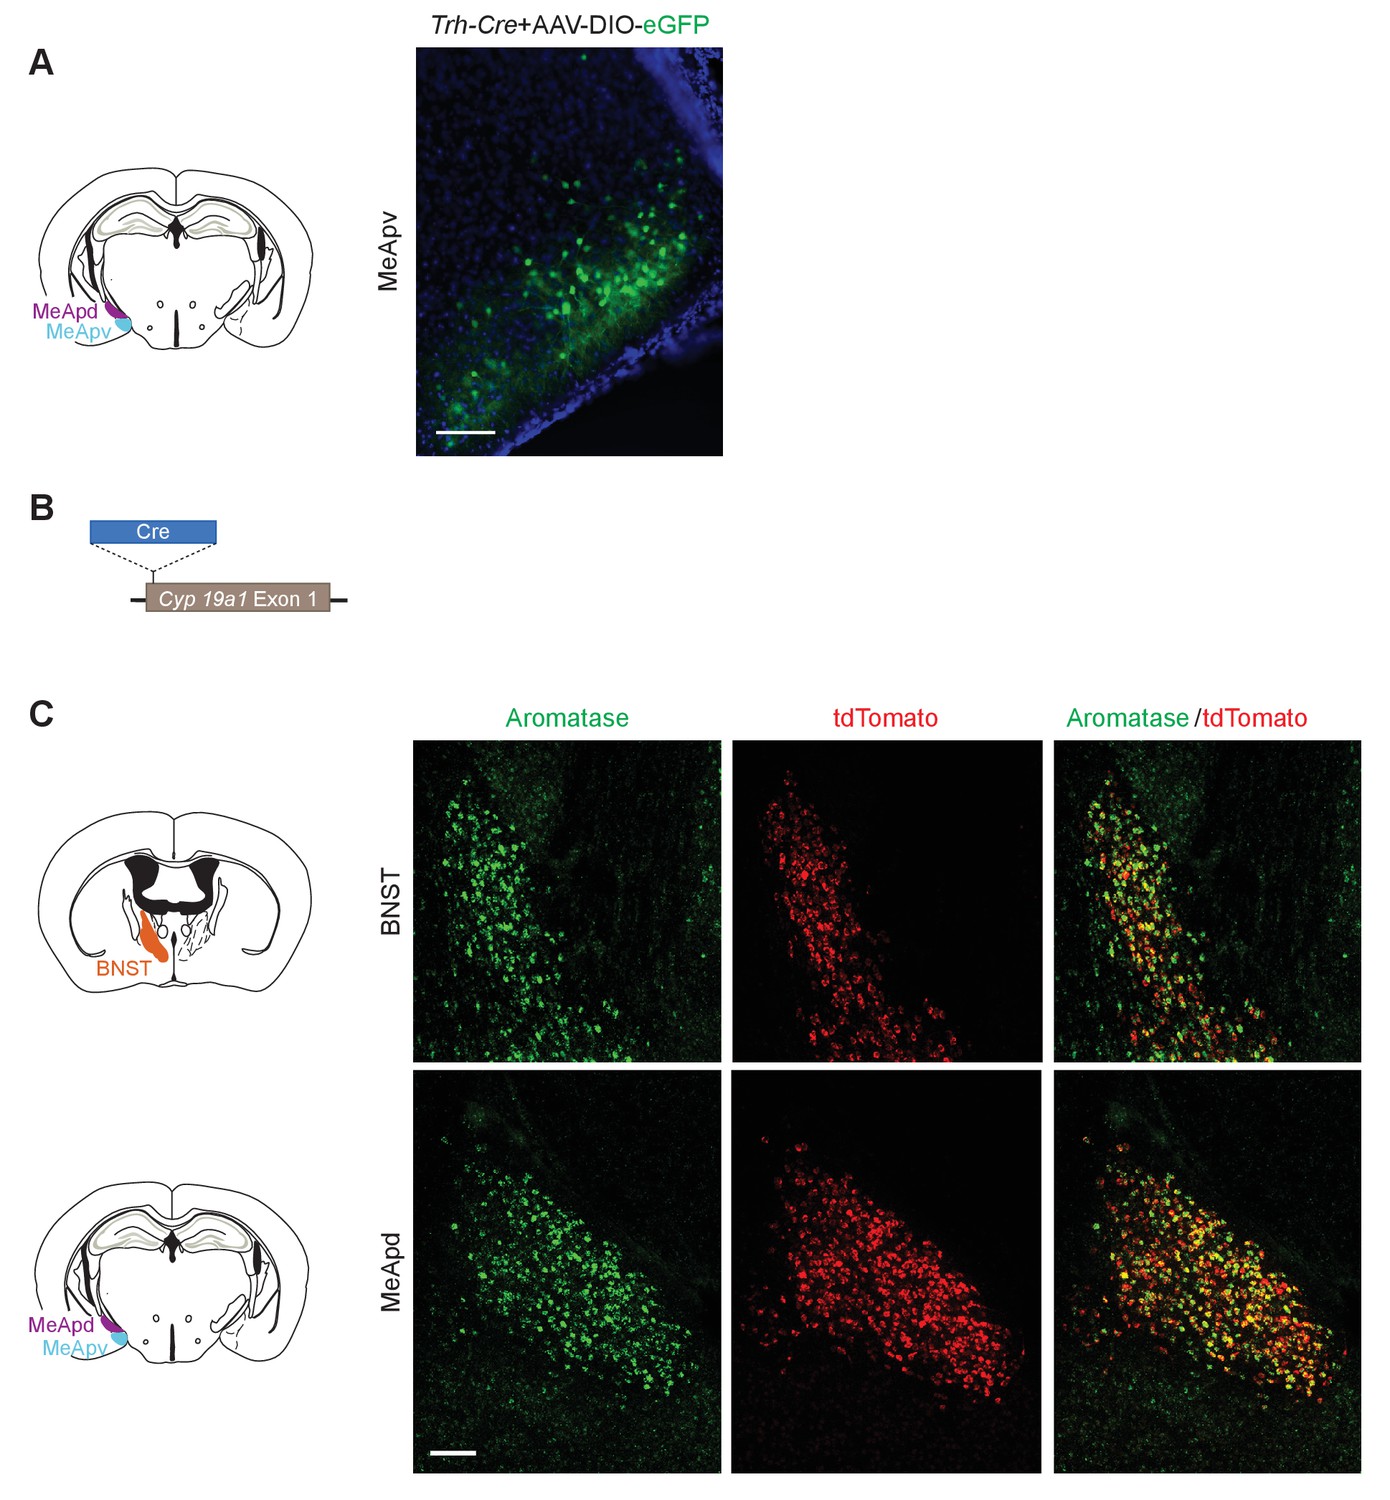
Construction of the Cyp19a1-Cre transgenic mouse line.
(A) Verification of the Cre expression pattern of a Trh-Cre line by injecting a reporter AAV to the MeA. (B) Schematic illustration of the generation of a Cyp19a1-Cre line. The Cre coding sequence was inserted right before the start codon of the aromatase gene, while the ATG start codon of the aromatase sequence was mutated to the stop codon of TTG. (C) Co-labeling of aromatase and tdTomato in a Cyp19a1-Cre;tdTomato reporter line. Upper: Double in situ hybridization of aromatase and tdTomato in the BNST. Bottom: Double in situ hybridization of aromatase and tdTomato in the MeApd.
Figure 3
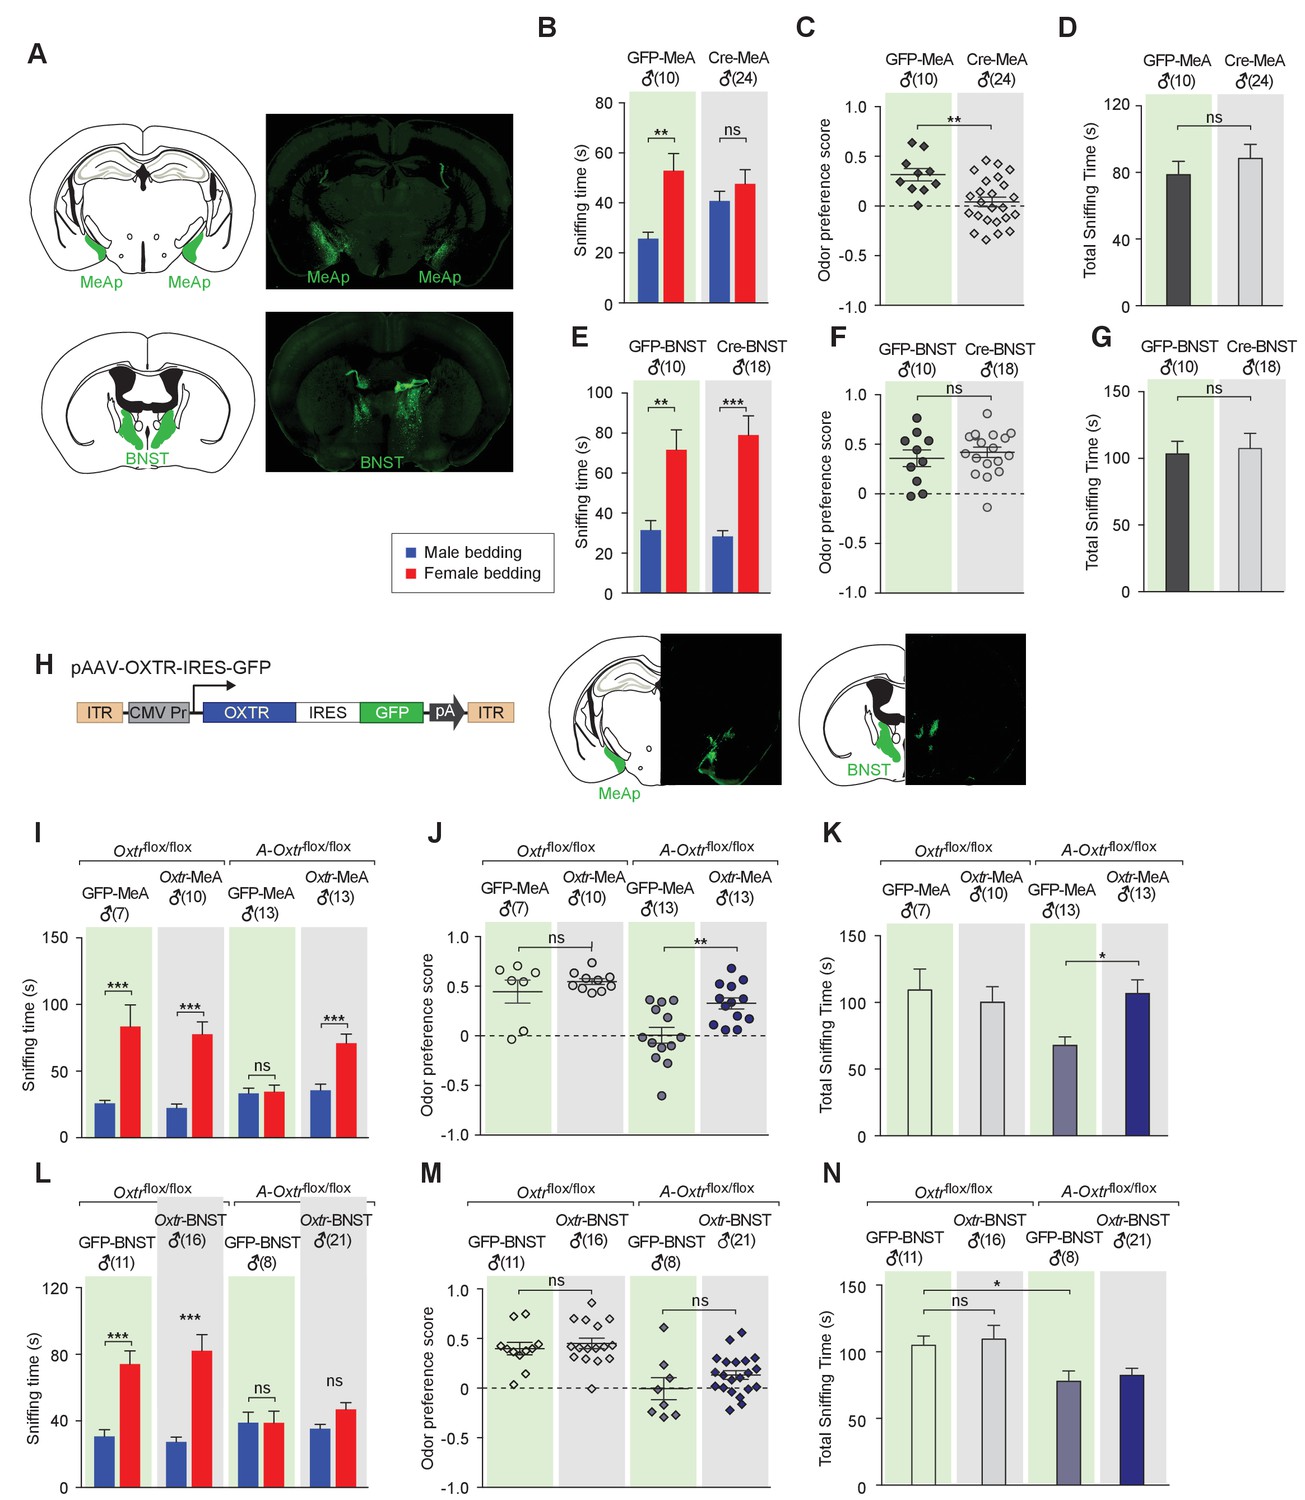
Aromatase-expressing neurons in the MeApd are the cellular substrate mediating OT signaling in sexual discrimination.
(A) Virus-mediated ablation of OXTR in the MeA (Upper) and BNST (Bottom) of Oxtrflox/flox mice. Illustrations of the MeAp and BNST were adapted from the Paxinos and Franklin mouse brain atlas. The AAV-eGFP and AAV-Cre-eGFP viruses are stereotaxically injected into the MeAp and BNST of Oxtrflox/flox male. (B–D) Time spent investigating each odor cue, odor preference scores, and total time investigating odor cues of Oxtrflox/flox mice with either AAV-eGFP or AAV-Cre-eGFP injection of the MeAp. t test, **p<0.01, ns, not significant. (E–G) Effects of OXTR ablation in the BNST on time investigating each odor cue, odor preference scores, and total time investigating odor cues. t test, ***p<0.001, **p<0.01, ns, not significant. (H) Virus-mediated expression of OXTR in the MeA and BNST via the AAV-OXTR-IRES-eGFP virus. (I–N) Time spent investigating each odor cue, odor preference scores, and total time investigating odor cues of Oxtrflox/flox (control) and Cyp19a1-Cre; Oxtrflox/flox (A-Oxtrflox/flox) mice with MeAp (I–K) or BNST (L–N) virus injection. t test, ***p<0.001, **p<0.01, *p<0.05.
Figure 4
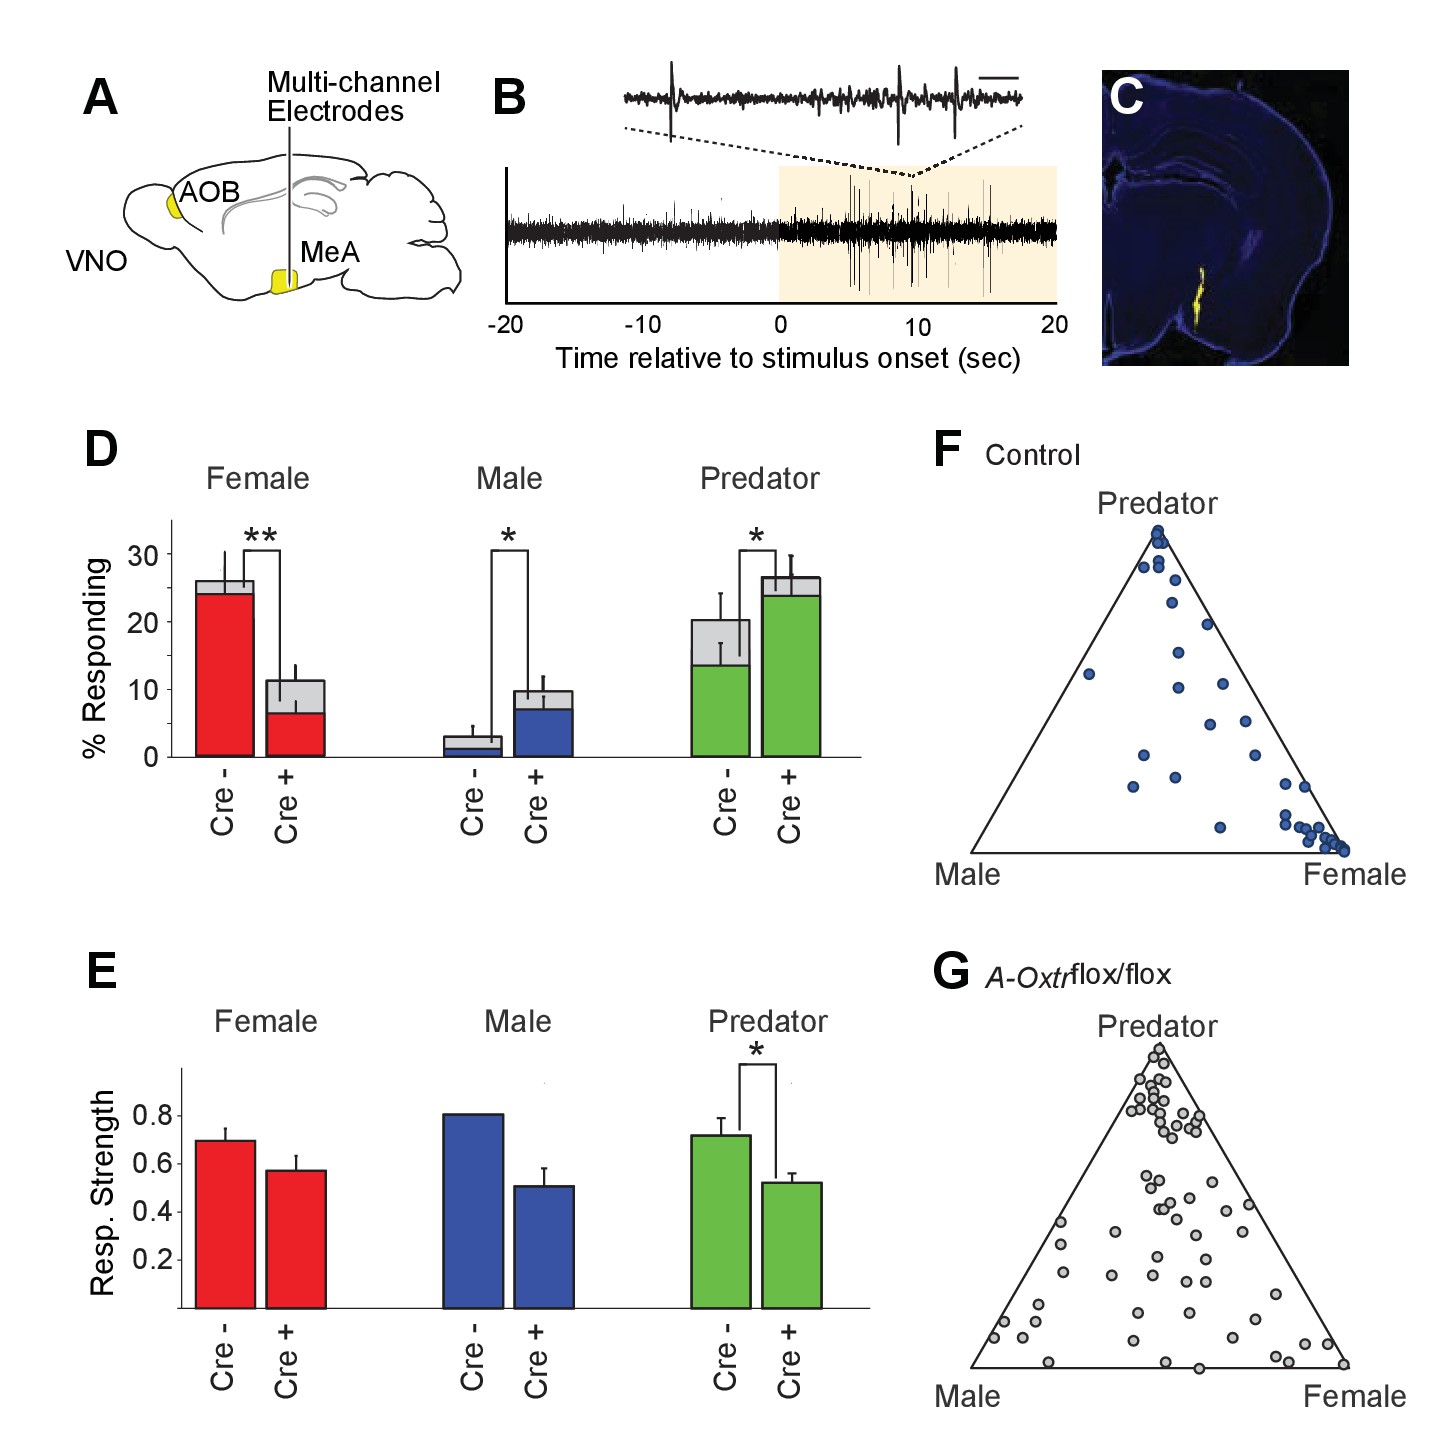
OXT signaling is critical for dimorphic neuronal responses of the MeA to conspecific cues.
(A) Schematic showing core elements of the vomeronasal pathway (yellow) and the targeting of multichannel probes to the MeA. (B) Single voltage trace showing an increase in the activity of a well-isolated unit following VNO sensory stimulation (yellow). Inset shows a subset of the voltage trace at higher time resolution. (C) DiI labeled electrode tract located squarely in the MeA (blue: DAPI; Yellow: DiI). (D) Comparison of responses to male, female, and predator stimuli in Oxtrflox/flox and Cyp19a1-Cre; Oxtrflox/flox male mice. Grey bars: percentage of single MeA units that responded to each stimulus (nonparametric ANOVA; p<=0.05). Colored bars indicate the percentage of single units that responded most strongly for the indicated stimulus. Asterisks indicate a significant difference in response rate between Oxtrflox/flox and Cyp19a1-Cre; Oxtrflox/flox animals (permutation t-test; *p<0.05; **p<0.0001). (E) Comparison of response strength to male, female, and predator stimuli in Oxtrflox/flox and Cyp19a1-Cre; Oxtrflox/flox (A-Oxtrflox/flox) animals. Response strength = (post-pre)/(post +pre); where for a given neuron post = the firing rate in 40 s after the stimulus was presented and pre = the firing rate in 20 s prior to when the stimulus was presented. Asterisks indicate a significant difference in response rate between Oxtrflox/flox and A-Oxtrflox/flox animals (permutation t-test; *p<0.01) (F-G) Selectivity of MeA units to sensory stimuli in control (Oxtrflox/flox) (F) and A-Oxtrflox/flox (G) animals. Each point represents the sensory responses of an individual unit with at least one significant response to male, female, or predator stimuli. Points located near a vertex indicate selective responses for the indicated stimulus. Points located in the center of the plot indicate less selective responses.
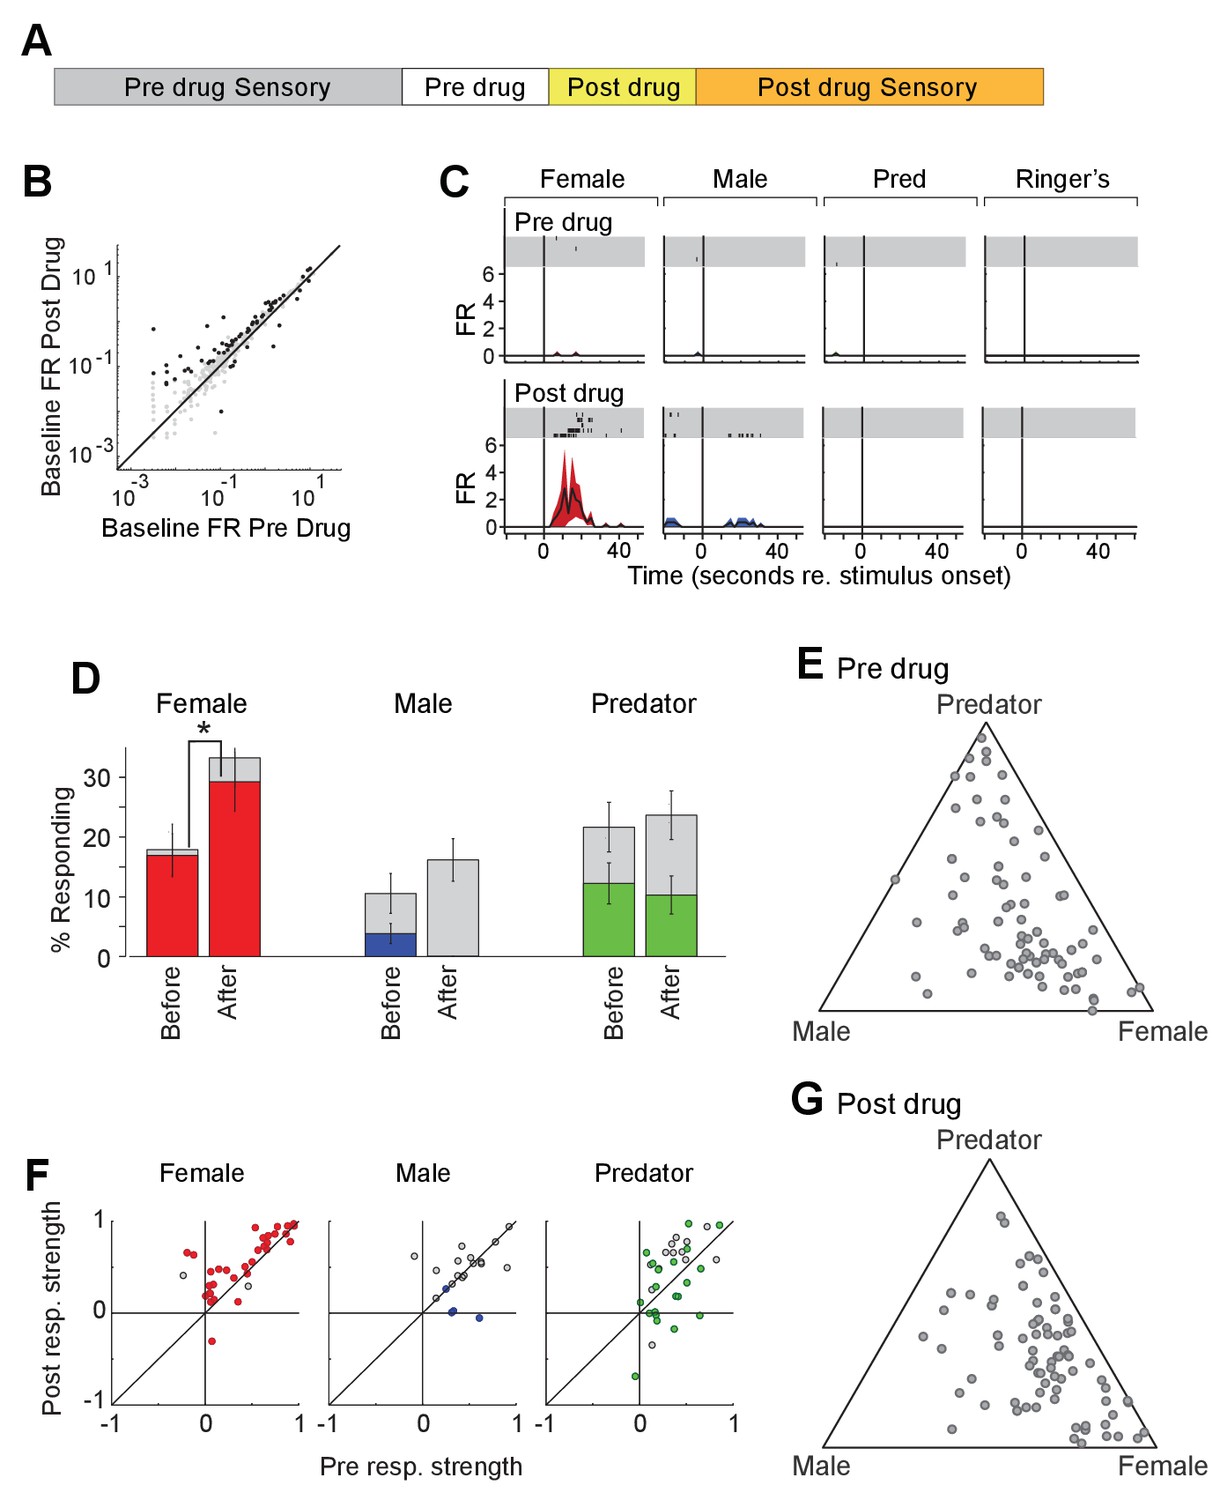
Figure 5 with 1 supplement
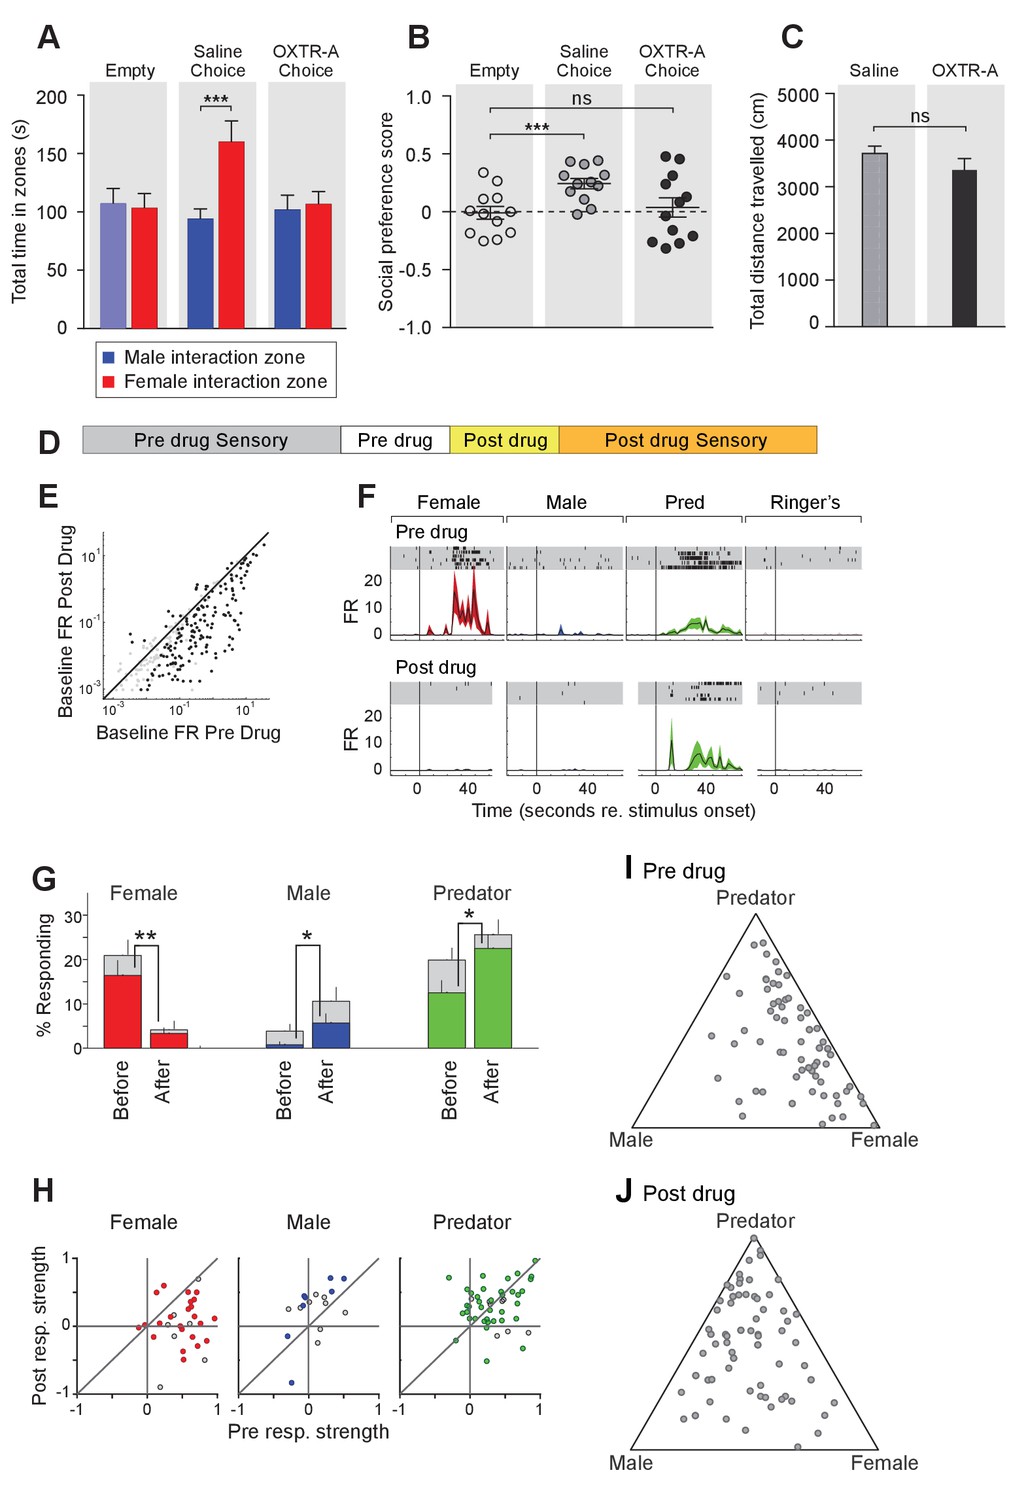
Acute pharmacological inhibition of OXTR leads to impaired social interaction preference and altered neuronal response profile in the MeA.
(A–C) Comparison of times spent in each interaction zone (t test), social preference scores (paired t test) and distance traveled (paired t test) of the subjects (Oxtrflox/flox) before and after IP injection of OXTR antagonist (OXTR-A). ***p<0.001, **p<0.01. (D) Structure of combined pharmacology and electrophysiology experiments. Sensory responses were determined prior to drug application (~50 min), followed by a 10 min baseline period. Drugs were injected IP, and a second baseline period was collected. Finally, sensory responses were determined after drug application. (E) Firing rate (spikes/second) for single units in the absence of sensory stimuli (abscissa: firing rate before antagonist; ordinate: firing rate after antagonist; log scale). (F) Responses of a single MeA unit to sensory stimuli before and after the mouse was injected with OXTR-A. For each panel, raster plots indicating the timing of individual action potentials elicited by multiple presentations of the same stimulus (shaded region). Histograms of the mean response and standard error for the same data are shown below each raster plot. Time zero indicates alignment to the start of stimulus presentation. (G) Comparison of responses to male, female, and predator stimuli before and after antagonist injection. Grey bars: percentage of single MeA units that responded to each stimulus (nonparametric ANOVA; p<=0.05). Colored bars: percentage of single units that responded most strongly for the indicated stimulus. Asterisks indicate a significant difference in the fraction of responsive units before and after OXTR-A injection (permutation t-test; *p<0.05; **p<0.001) (H) Comparison of response strength before and after OXTR-A injection for all single units responding to a given stimulus. Grey points indicate single units with a statistically significant response to the stimulus plotted in each axis. Colored points indicate units with a significant response that was also the strongest response (compared with responses to the other stimuli). Abscissa: (post-pre)/(post + pre) prior to OXTR-A injection. Ordinate: (post-pre) / (post + pre) after OTRA injection. (I–J) Selectivity of MeA units to sensory stimuli before (I) and after (J) OXTR-A injection. Each point represents the sensory responses of an individual unit with at least one significant response to male, female, or predator stimuli.
Figure 5—figure supplement 1
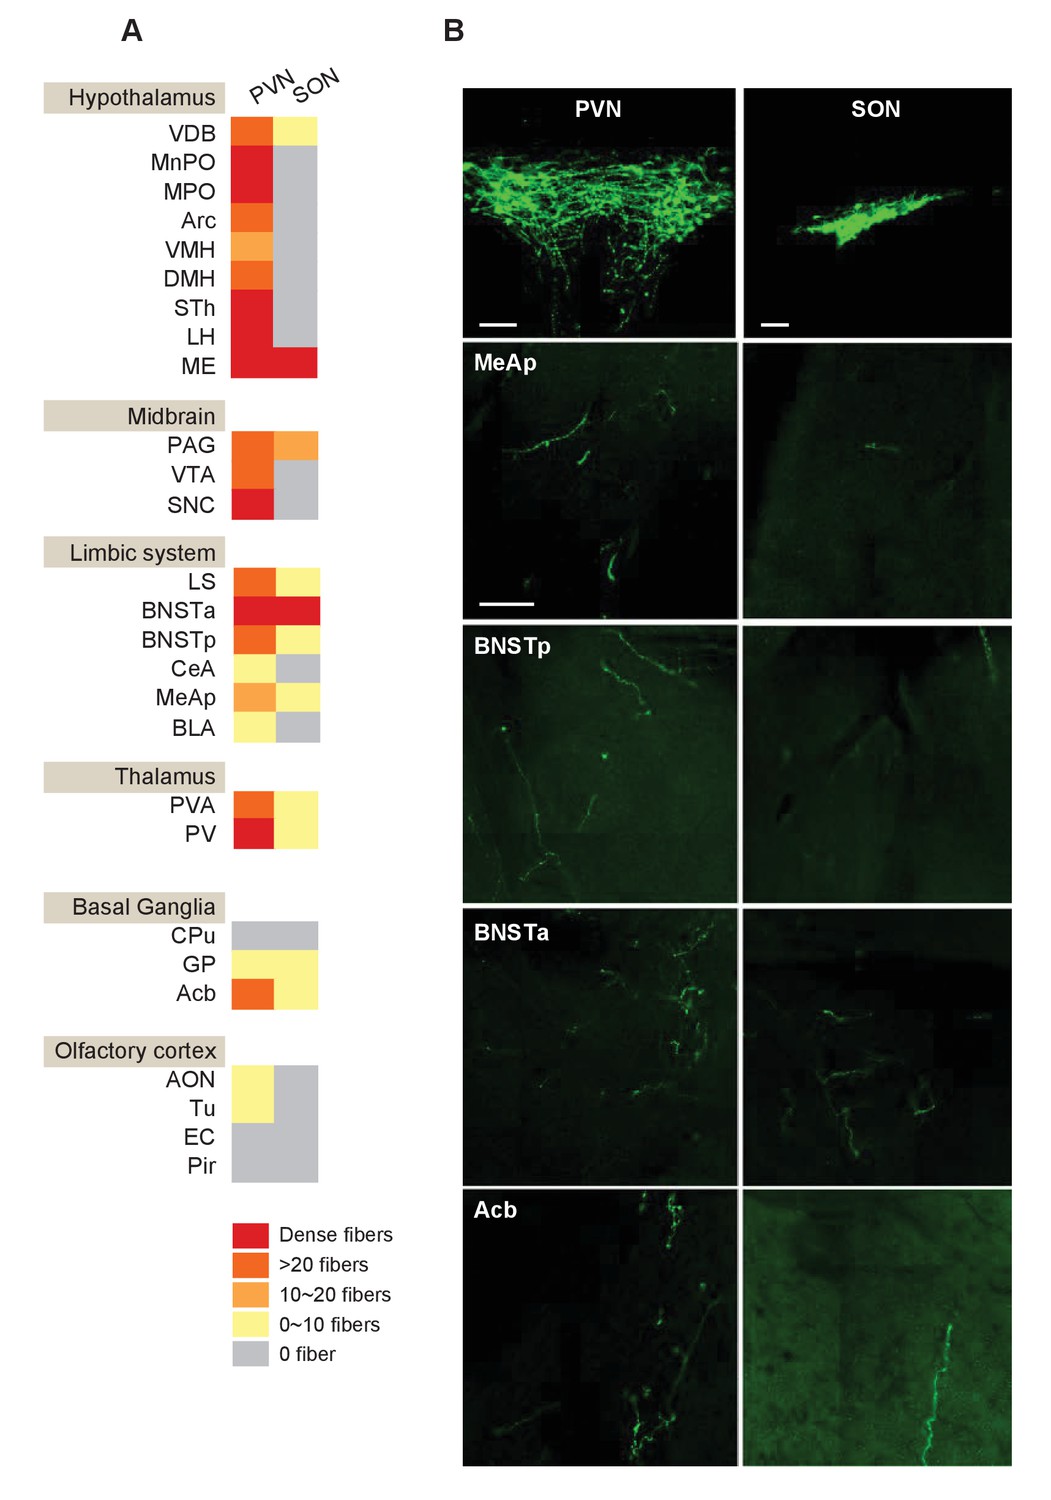
Mapping of OXT outputs from the PVN and the SON.
(A) Summarized distribution and density of OXT fibers derived from the PVN or SON in different brain areas. OXT fibers are mapped by injecting a Cre-dependent AAV-ChR2-YFP to either the PVN or the SON of Oxt-iCre mice, and fine fibers are revealed by GFP immunostaining. For each nucleus, two virgin female and two virgin male mice were analyzed. Four equal series of 50 μm thick coronal sections were prepared and one brain series from each mouse was analyzed for the number of fibers per mm2. (B) OXT fibers derived from the OXT-expressing neurons in the PVN (Left) and SON (Schultz et al., 2000) in selected brain areas. Scale bar = 100 um.
Figure 6 with 1 supplement
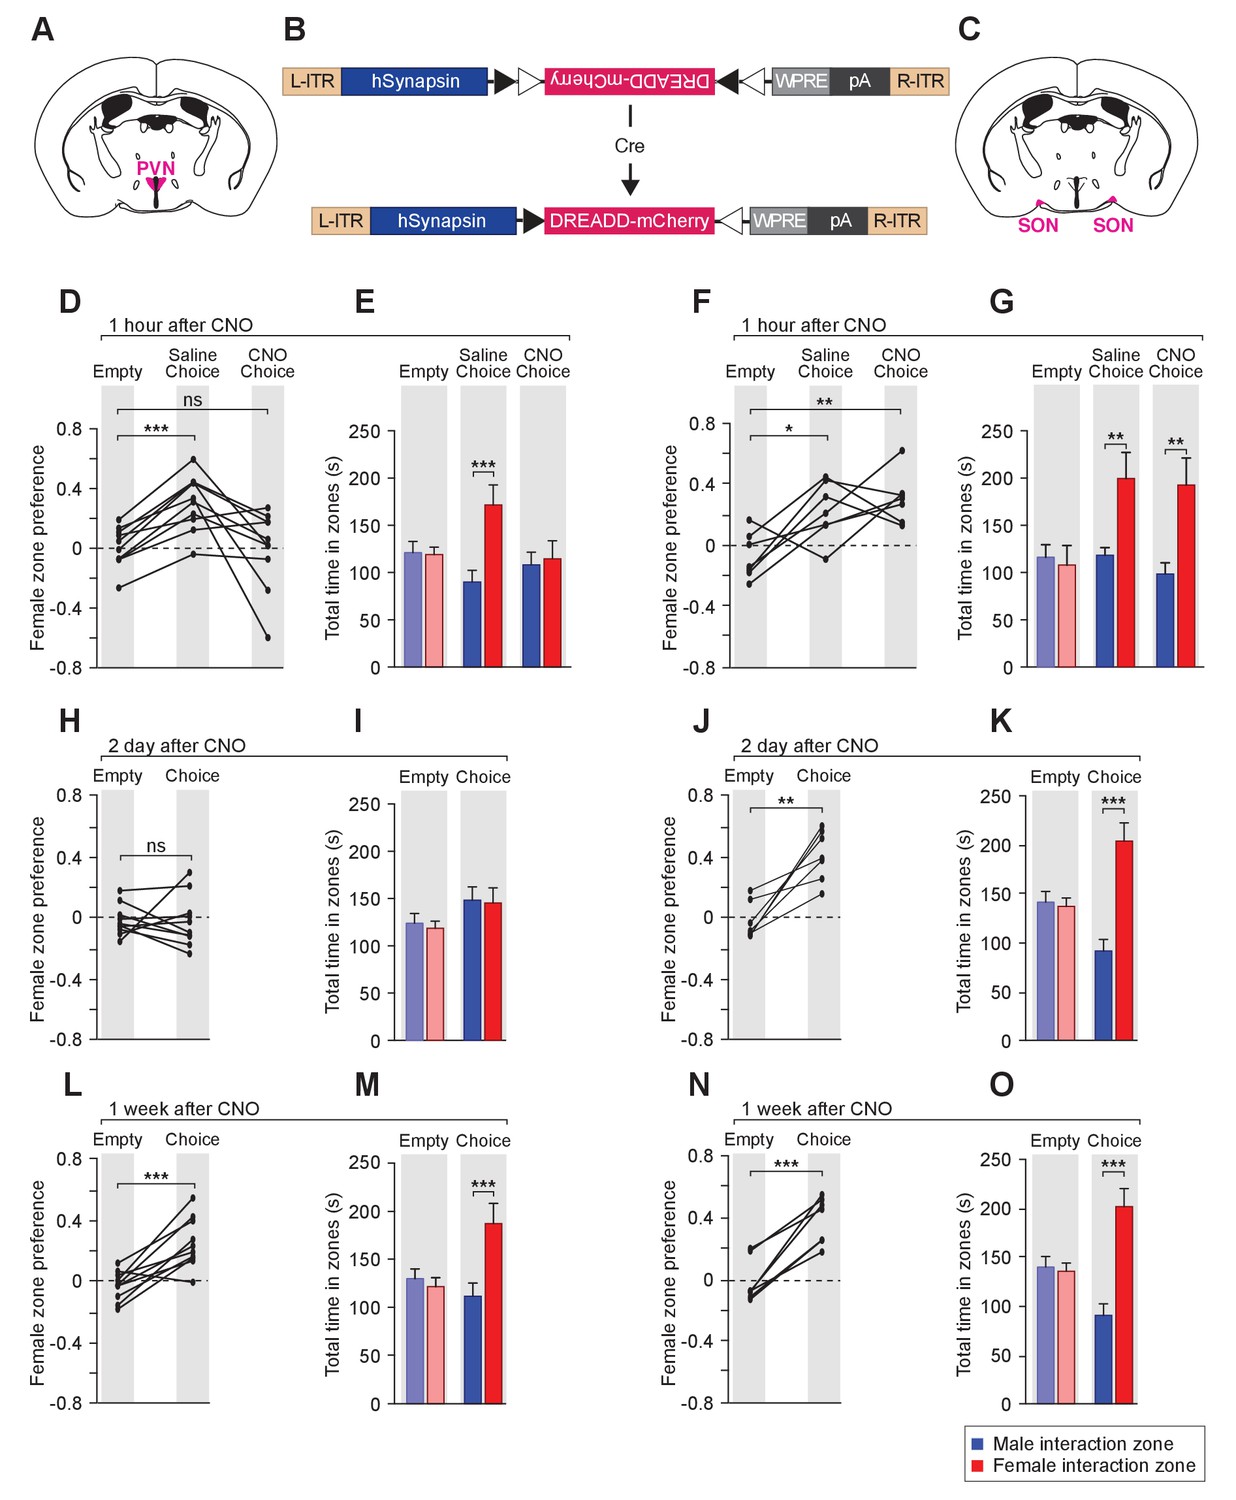
Acute chemogenetic inhibition of OXT signaling is sufficient to disturb the discrimination of female and male conspecifics.
(A–C) Schematic of hM4Di mediated inhibition of OXT-expressing neurons. Illustration of the PVN (A) and SON (C) in coronal sections are adapted from the Paxinos and Franklin mouse brain atlas. The AAV8-hSyn-DIO-hM4Di-mCherry virus (B) is stereotaxically injected into either the PVN or SON of Oxt-IRES-Cre (Oxt-iCre) male mice. Rapid and reversible inhibition of the OXT-expressing neurons can be induced by IP injection of CNO. (D, E, H, I, L, M) Time courses of changes in the social investigation preference scores (paired t test) and durations that the subjects spent in each sniffing zone (t test) of Oxt-iCre male mice after CNO-mediated inhibition of OXT-expressing neurons in the PVN. ***p<0.001 (F, G, J, K, N, O) Time courses of changes in the social investigation preference scores (paired t test) and durations that the subjects spent in each sniffing zone (t test) of Oxt-iCre male mice after CNO-mediated inhibition of OXT-expressing neurons in the SON. ***p<0.001, **p<0.01, *p<0.05.
Figure 6—figure supplement 1
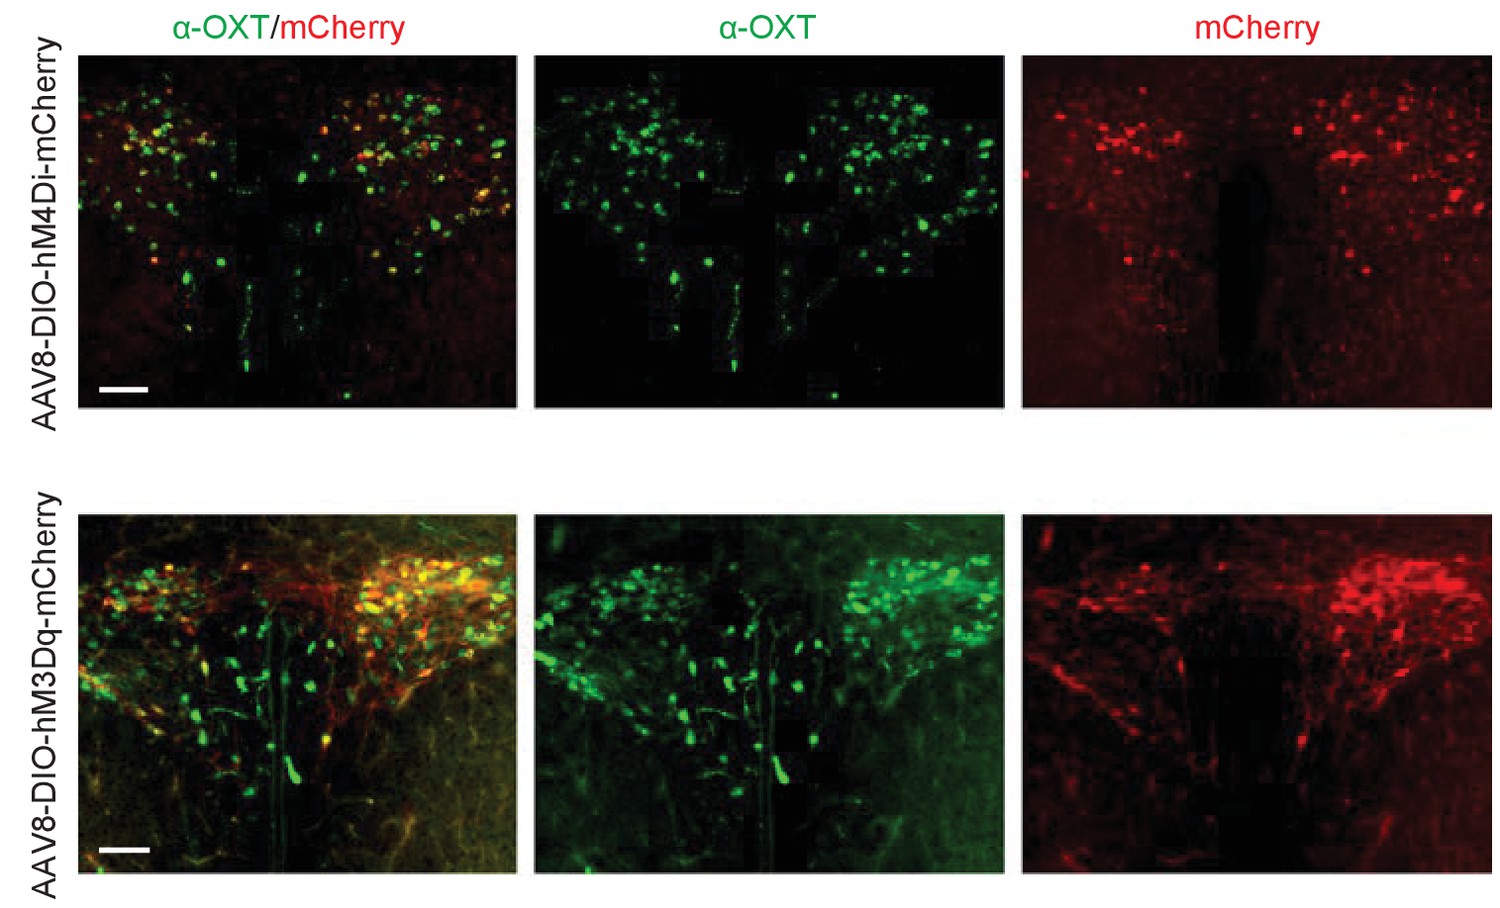
DREADD AAV virus-mediated manipulation of OT neurons.
Co-labeling of OXT immunostaining with mCherry in Oxt-iCre mouse injected with the excitatory DREADD (AAV8-hSyn-DIO-hM3Dq-mCherry) and the inhibitory DREADD (AAV8-hSyn-DIO-hM4Di-mCherry) AAV viruses.
Figure 7 with 1 supplement
Acute chemogenetic activation of OXT signaling alters social interaction preference and neuronal response profile in the MeA.
(A) Structure of combined pharmacology and electrophysiology experiments. Sensory responses were determined prior to drug application (~50 min), followed by a 10 min baseline period. Drugs were injected IP, and a second baseline period was collected. Finally, sensory responses were determined after drug application. (B) Firing rate (spikes/second) for single units in the absence of sensory stimuli (abscissa: firing rate before CNO; ordinate: firing rate after CNO; log scale). Black points indicate single units that displayed a significant change in activity after CNO injection. (C) Responses of a single MeA unit to sensory stimuli before and after the mouse was injected with CNO. For each panel, raster plots indicating the timing of individual action potentials elicited by multiple presentations of the same stimulus (shaded region). Histograms of the mean response and standard error for the same data are shown below each raster plot. Time zero indicates alignment to the start of stimulus presentation. (D) Comparison of responses to male, female, and predator stimuli before and after CNO injection. Grey bars: percentage of single MeA units that responded to each stimulus (nonparametric ANOVA; p<=0.05). Colored bars: percentage of single units that responded most strongly for the indicated stimulus. Asterisks indicate a significant difference in the fraction of responsive units before and after CNO injection (permutation t-test; *p<0.05). (E, G) Selectivity of MeA units to sensory stimuli before (E) and after CNO injection (G). Each point represents the sensory responses of an individual unit with at least one significant response to male, female, or predator stimuli. (F) Comparison of response strength before and after CNO injection for all single units responding to a given stimulus. Grey points indicate single units with a statistically significant response to the stimulus plotted in each axis. Colored points indicate units with a significant response that was also the strongest response (compared with responses to the other stimuli). Abscissa: (post-pre)/(post + pre) prior to CNO injection. Ordinate: (post-pre)/(post + pre) after CNO injection.
Figure 7—figure supplement 1
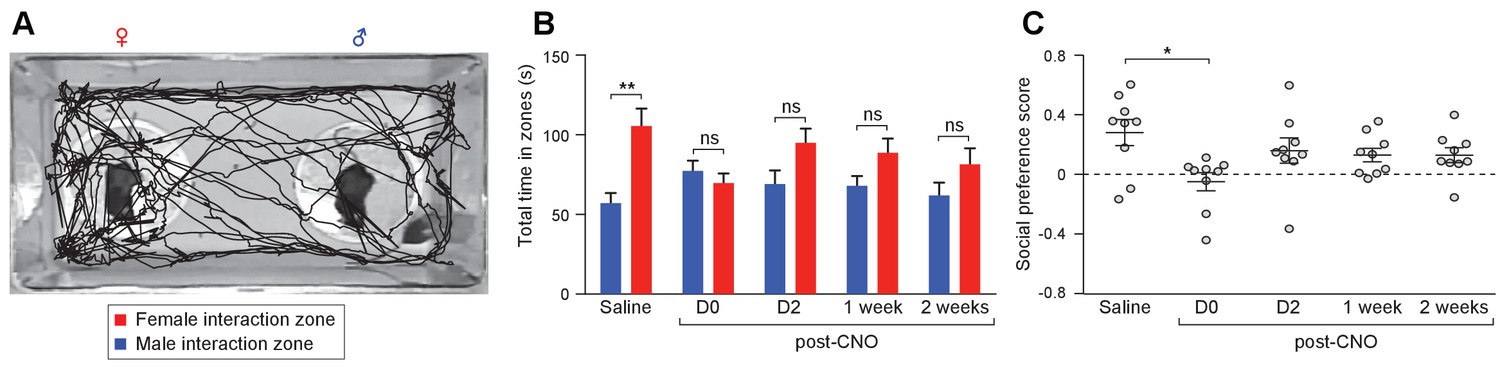
Acute chemogenetic activation of OXT signaling alters social interaction preference.
(A) Representative traces of a subject mouse in a social interaction paradigm assessing the preference of the subject to investigate a pair of anesthetized female and male stimuli. The path traveled by the subject was tracked and time spent near each stimulus mouse was measured automatically by Ethovision. (B–C) Changes in the time spent in each interaction zone (t test) and social investigation preference scores (t test) of Oxt-iCre male mice after excitatory DREADD-mediated activation of OXT neurons in the PVN. The AAV8-DIO-hM3Dq-mCherry virus was stereotaxically injected into the PVN of Oxt-iCre male mice. The subjects performed social preference tests after saline injection, and 15 min, 2 days, 1 week and 2 weeks after CNO injection. **p<0.01, ns, not significant.
Additional files
-
Transparent reporting form
- https://doi.org/10.7554/eLife.31373.016
Download links
A two-part list of links to download the article, or parts of the article, in various formats.
Downloads (link to download the article as PDF)
Open citations (links to open the citations from this article in various online reference manager services)
Cite this article (links to download the citations from this article in formats compatible with various reference manager tools)
Oxytocin signaling in the medial amygdala is required for sex discrimination of social cues
eLife 6:e31373.
https://doi.org/10.7554/eLife.31373


