Impaired spatial memory codes in a mouse model of Rett syndrome
- Baylor College of Medicine, United States
- Howard Hughes Medical Institute, Baylor College of Medicine, United States
- Jan and Dan Duncan Neurological Research Institute, Texas Children’s Hospital, United States
Figures
Figure 1
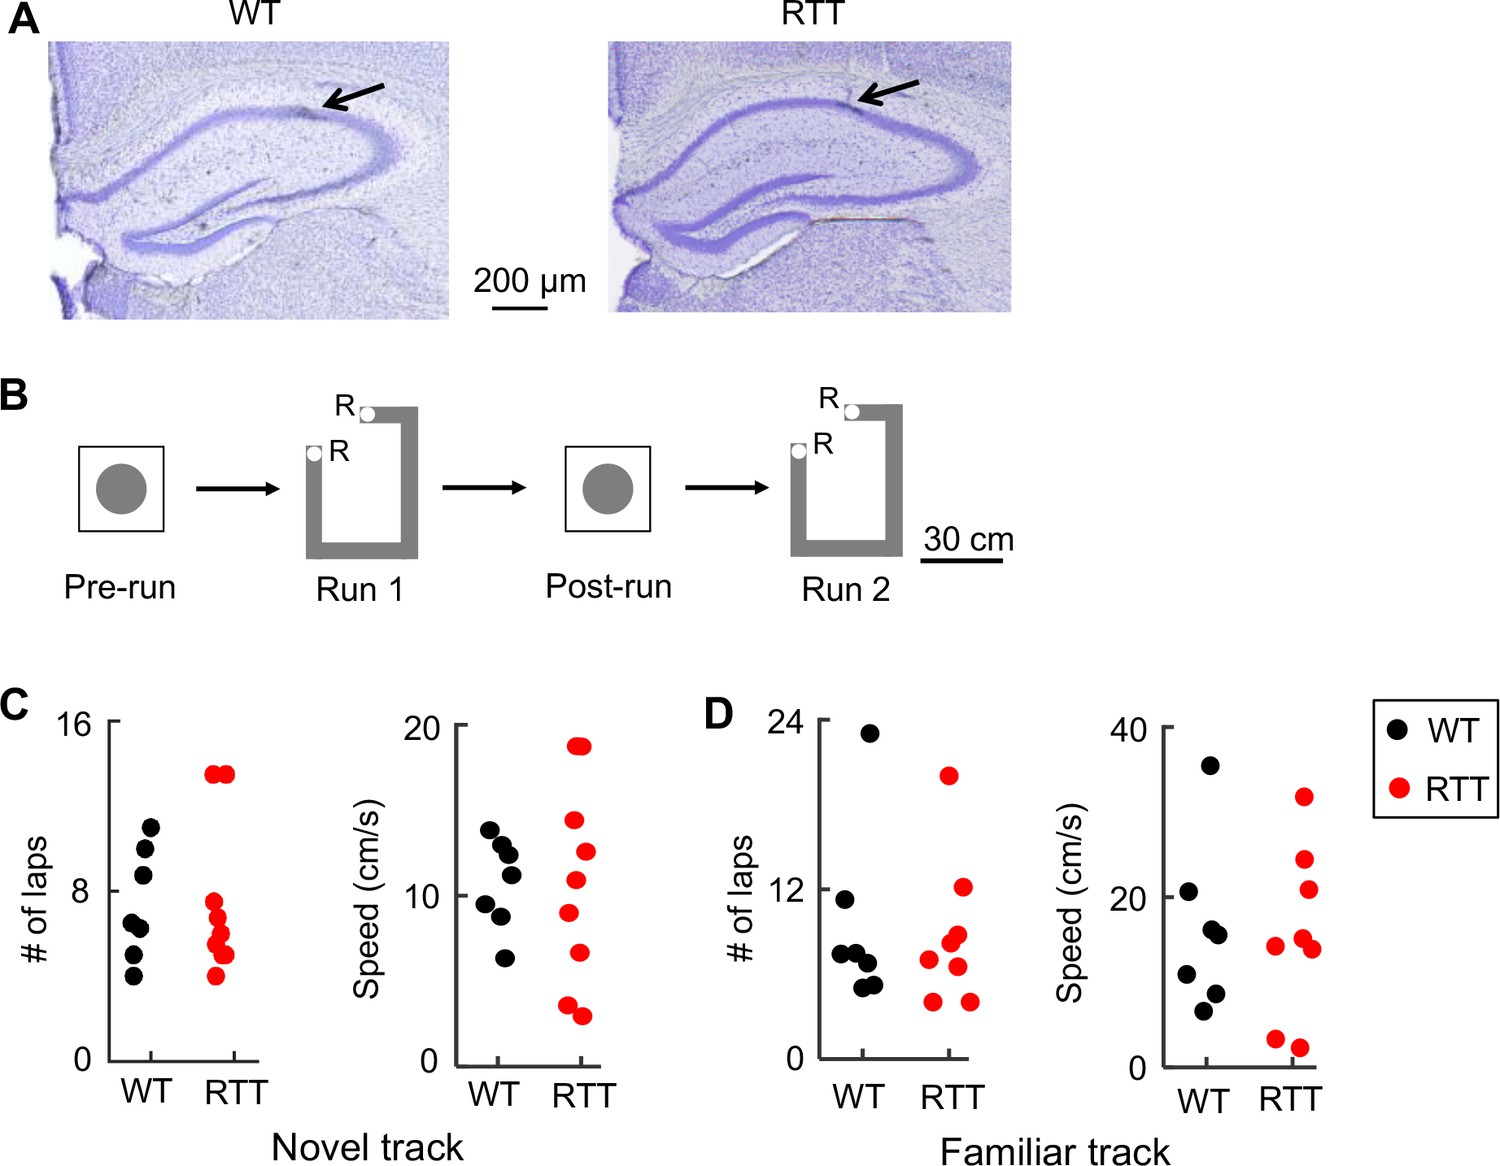
Recording of CA1 cells in WT and RTT mice during track-running and during rest.
(A) Coronal brain sections of a WT and a RTT mouse stained with cresyl violet. Arrow: tetrode location. (B) Recording sessions and schematics of a track and a rest box. Animals ran back and forth on the track for food reward (R: reward sites) for two sessions (Run 1 and Run 2) and rested in the box before (Pre-run) and after (Post-run) the first run session. (C) Number of laps and running speed of WT and RTT mice on the novel track. Number of animals: N = 7 (WT), 9 (RTT). Wilcoxon ranksum tests: p=0.66 for number of laps; p=0.65 for speed. (D) Same as in (C), but on the familiar track. Number of animals: N = 7 (WT), 8 (RTT). Wilcoxon ranksum tests: p=0.93 for number of laps, p=0.96 for speed.
Figure 2 with 2 supplements
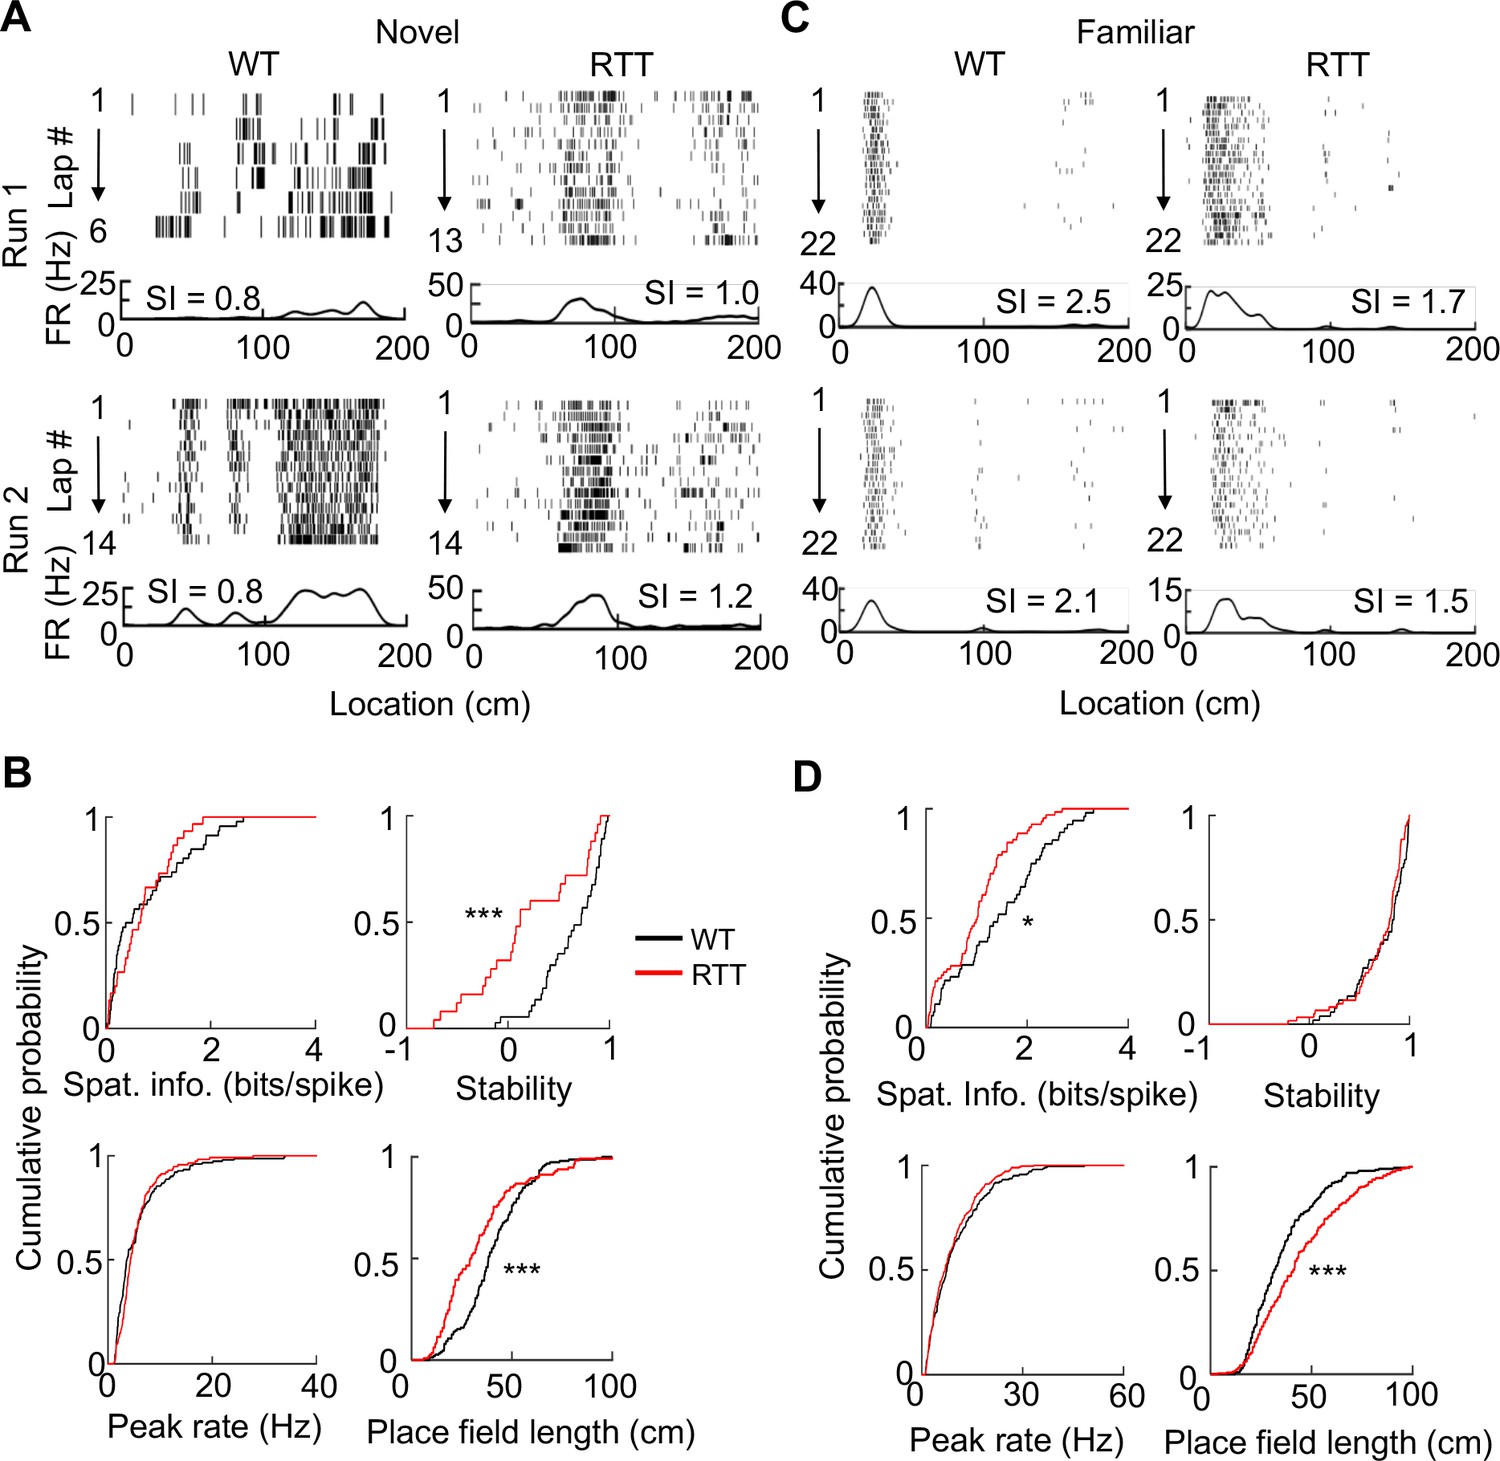
Place cells in RTT mice had less firing specificity in the familiar, but not in the novel, environment.
(A) Firing activities of an example WT and RTT cell during running on the novel track in two sessions (Run 1, Run 2). For each panel, the top shows spike raster of a cell during every running lap on a linearized trajectory (running direction: from left to right). Each row is a lap and each tick is a spike. The bottom trace is the firing rate curve averaged over all laps in a session. (B) Distributions of spatial information, stability, peak firing rate within place fields, and place field length for WT and RTT place cells on the novel track. Spatial information: p=0.67, Wilcoxon ranksum test; number of cells by active trajectories: N = 79 (WT), 51 (RTT). Stability: ***p=0.0008; number of cells by active trajectory in both run sessions: N = 37 (WT), 25 (RTT). Peak rate: p=0.25; place field length: ***p=0.0001; number of place fields: N = 151 (WT), 115 (RTT). (C) Same as in (A), but for example cells on the familiar track. (D) Same as in (B), but for place cells on the familiar track. Spatial information: *p=0.016, number of cells by active trajectories: N = 87 (WT), 120 (RTT). Stability: p=0.33; number of cells by active trajectories in both run sessions: N = 52 (WT), 61 (RTT). Peak rate: p=0.26; place field length: ***p=2.1×10⁻⁸; number of place fields: N = 206 (WT), 280 (RTT).
Figure 2—figure supplement 1
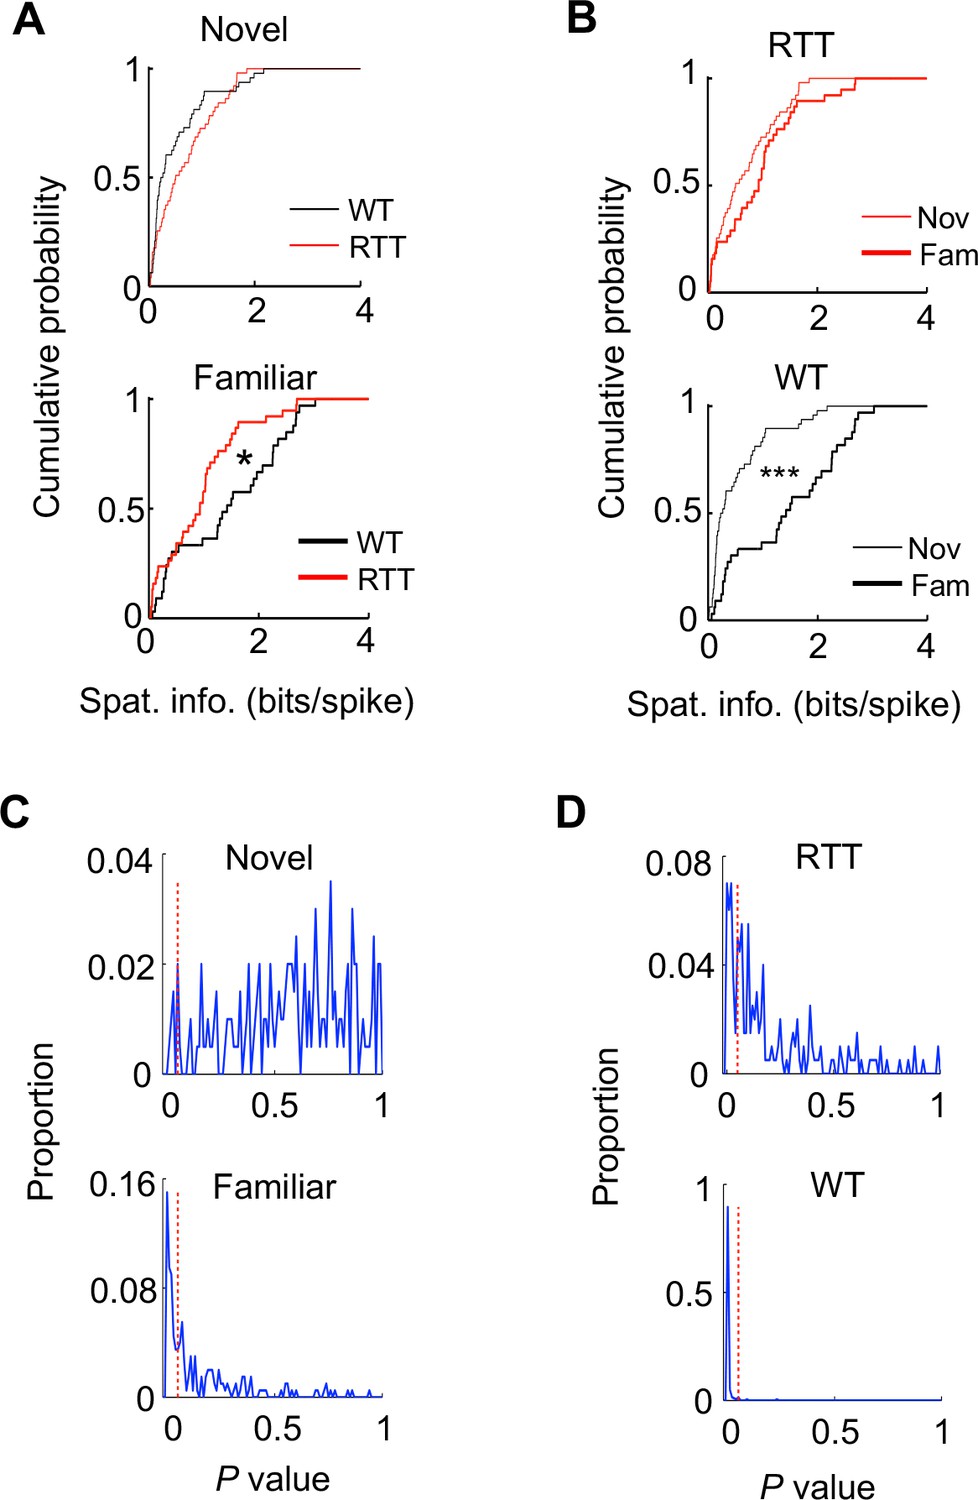
Place cells in RTT mice were impaired in experience-dependent increase in spatial information, after cells active on the novel and familiar tracks were down-sampled.
The cells were randomly selected from the recorded cells active on the novel and familiar track in such a way that the number of cells was 31 for both genotypes (RTT, WT) on both the novel and familiar track. The random downsampling was repeated 200 iterations. (A) Cumulative distributions of spatial information for the down-sampled WT and RTT cells on the novel and familiar track in one example of iteration. Novel: p=0.096, Wilcoxon ranksum test comparing WT and RTT cells, number of cells by active trajectories: N = 51 (WT), 48 (RTT). Familiar: *p=0.026; number of cells by active trajectories: N = 38 (WT), 33 (RTT). (B) Same data as in (A), but comparing novel and familiar tracks for RTT and WT cells. RTT: p=0.15; WT: ***p=1.3×10⁻⁵. (C) Distribution of Wilcoxon ranksum test P values among all iterations for comparing spatial information between WT and RTT cells on the novel and familiar track. There were 3 and 42% of iterations producing a P value < 0.05 (red dashed line) on the novel and familiar track, respectively. The numbers suggest that the downsamping reduced the statistical power of comparing WT and RTT cells on the familiar track and therefore produced an insignificant P value for the originally significant comparison (Figure 2D) in many iterations. The downsampling largely did not affect the originally insignificant comparison between WT and RTT cells on the novel track (Figure 2B), because the number of down-sampled cells (31) was similar to the original number of WT cells (53) and RTT cells (31). (D) Similar to (C), but for P values among all iterations for comparing spatial information between the novel and familiar tracks for RTT and WT cells. There were 25 and 98% of iterations producing a P value < 0.05 (red dashed line) for RTT and WT cells, respectively. The numbers indicate that the vast majority of iterations showed significant increase in spatial information from the novel to familiar track in WT cells, but not in RTT cells, suggesting the experience-dependent increase in spatial information was impaired in RTT mice.
Figure 2—figure supplement 2
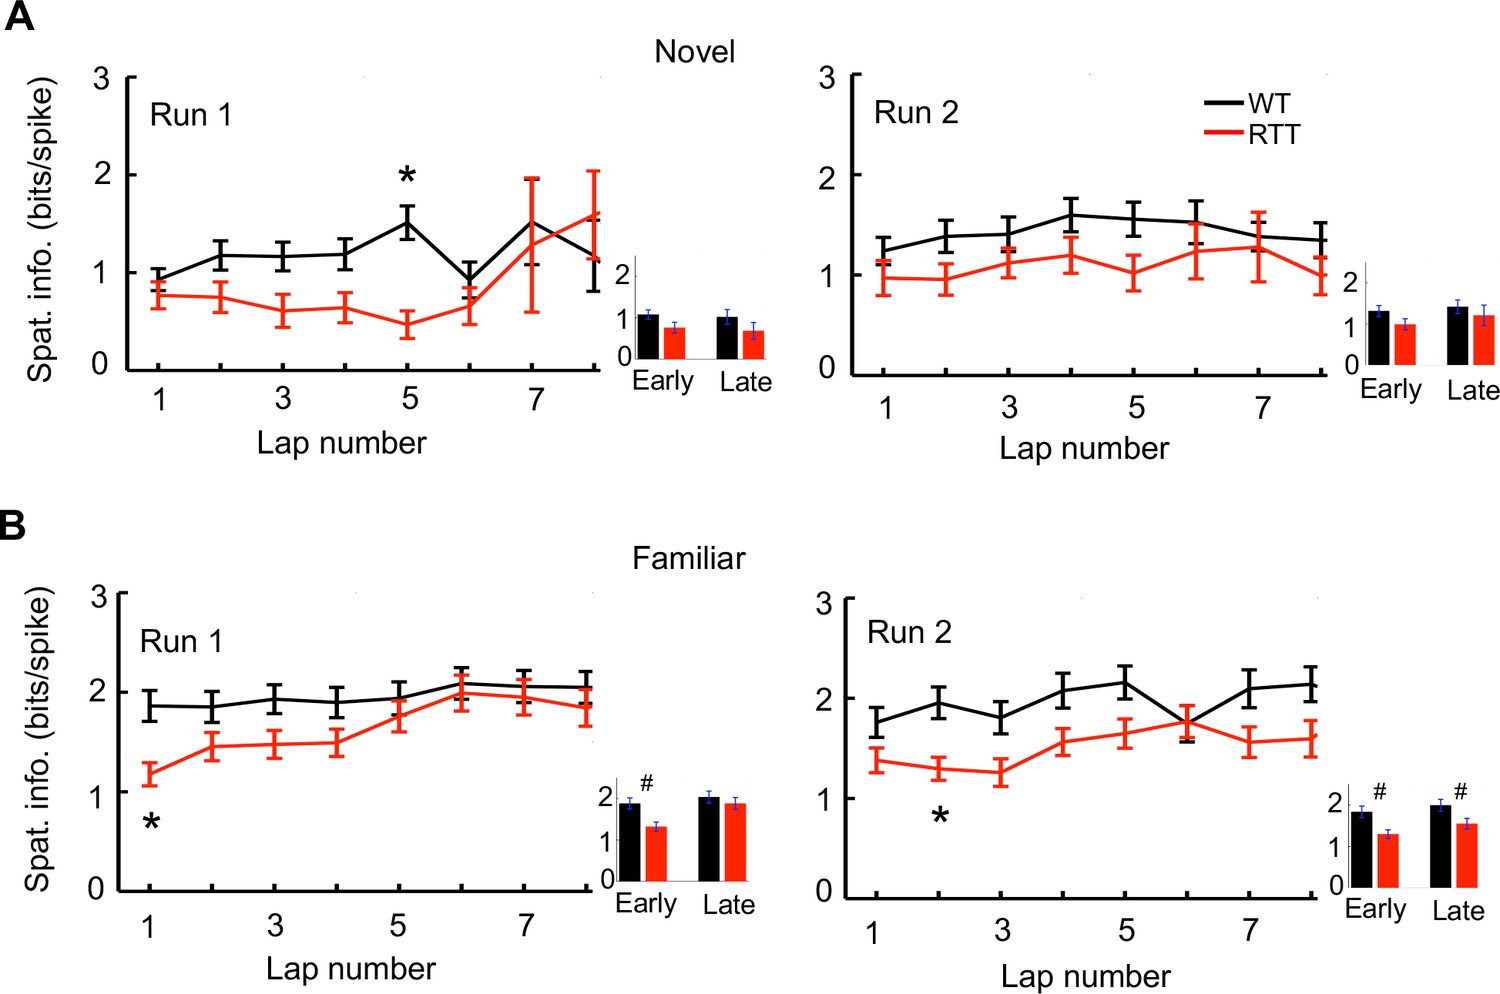
Lap-by-lap spatial information of place cells on the novel and familiar tracks.
(A) Lap-by-lap spatial information in Run 1 and Run 2 on the novel track. Inset on the right of each panel: average spatial information during the early (1–3) and late (6–8) laps. *p<0.00625, Wilcoxon ranksum test with significance level adjusted for multiple (8) comparisons. Number of cells: N = 53 (WT), N = 31 (RTT). (B) Same as (A), but on the familiar track. Number of cells: N = 65 (WT), 103 (RTT). *p<0.00625; #p<0.025. Note that the spatial information of RTT cells started lower on the familiar track in both Run1 and Run 2 than that of WT cells.
Figure 3
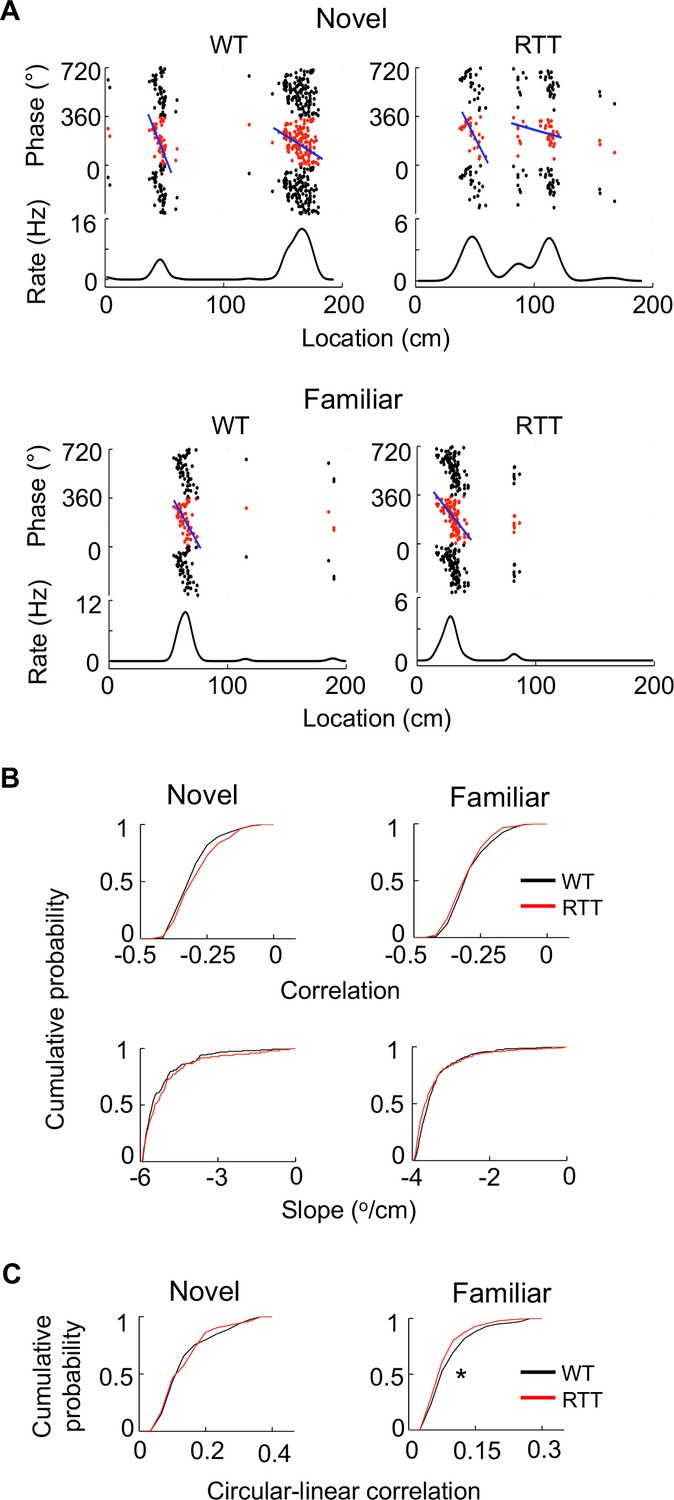
Place cells in RTT mice displayed largely normal phase precession on the novel and familiar track.
(A) Example cells with theta phase precession from a WT and RTT animal on the novel and familiar track. For each panel, the top depicts theta phases of a cell versus positions on the track plotted three cycles and the bottom is the cell’s mean firing rate. Solid line: linear regression of the theta phases versus positions. (B) Cumulative distributions of linear correlations and slopes of theta phase and position regressions for place fields in the WT and RTT mice on the novel and familiar tracks. Novel correlation: p=0.11, Wilcoxon ranksum test; slope: p=0.16; number of place fields: N = 160 (WT), 103 (RTT). Familiar correlation: p=0.15; slope: p=0.053; N = 237 (WT), 293 (RTT). (C) Cumulative distributions of circular-linear correlations of theta phase and position regressions for place fields in the WT and RTT mice on the novel and familiar tracks. Novel: p=0.77, Wilcoxon ranksum test; number of place fields: N = 160 (WT), 103 (RTT). Familiar: *p=0.016; N = 237 (WT), 293 (RTT).
Figure 4 with 3 supplements
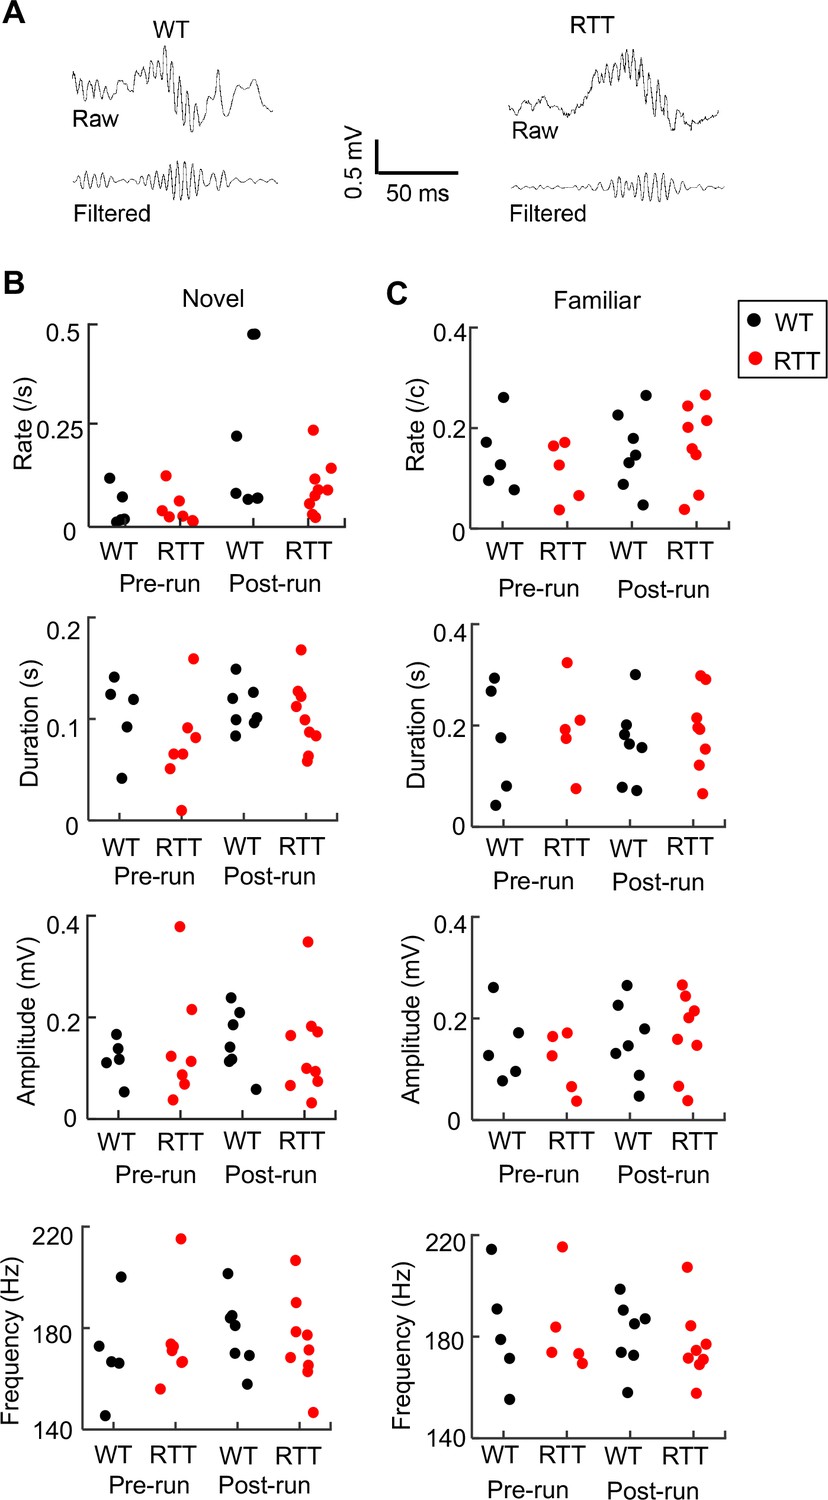
Ripple parameters were similar between WT and RTT mice during resting before (Pre-run) and after (Post-run) running on the novel and familiar track.
(A) Raw and filtered (pass band: 100–250 Hz) LFP traces from a WT and RTT animal. (B) Ripple occurrence rate, duration, amplitude, and frequency during resting before (Pre-run) and after (Post-run) running on the novel track. Each dot is the parameter averaged over all ripple events in an animal. Number of animals: N = 5 (WT), 7 (RTT) for Pre-run and 7 (WT), 9 (RTT) for Post-run. ANOVA analysis reveals no significant effect of genotype on occurrence rate (F(1, 26)=2.0, p=0.17), duration (F(1, 26)=1.8, p=0.19), amplitude (F(1, 26)=0.04, p=0.84), or frequency (F(1, 26)=0, p=1.0). There was a significant effect of session on occurrence rate (F(1, 26)=6.8, *p=0.015), but not on duration (F(1, 26)=1.6, p=0.22), amplitude (F(1, 26)=0.14, p=0.71), or frequency (F(1, 26)=0.33, p=0.57). There was no significant effect of the interaction between genotypes and resting sessions (Pre- and Post-run) on occurrence rate (F(1, 24)=1.8, p=0.20), duration (F(1, 24)=0.54, p=0.47), amplitude (F(1, 24)=0.04 P=0.84), or frequency (F(1, 24)=0.41, p=0.53). (C) Same as in (B), but during resting before (Pre-run) and after (Post-run) running on the familiar track. Number of animals: N = 5 (WT), 5 (RTT) for Pre-run and 7 (WT), 8 (RTT) for Post-run. Effect of genotype on occurrence rate (F(1, 23)=0.15, p=0.70), duration (F(1, 23)=0.49, p=0.49), amplitude (F(1, 23)=0.12, p=0.73, and frequency (F(1, 23)=0.06, p=0.81). The main effect of session on occurrence rate was no longer significant (F(1, 26)=4.2, p=0.053), neither was on duration (F(1, 26)=0.02, p=0.88), amplitude (F(1, 26)=1.0, p=0.31), or frequency (F(1, 26)=0.33, p=0.57). There was also no significant effect of the interaction between genotypes and resting sessions (Pre- and Post-run) on occurrence rate (F(1, 21)=0.02, p=0.88), duration (F(1, 21)=0, p=0.96), amplitude (F(1, 21)=0.57, p=0.46), or frequency (F(1, 21)=0.14, p=0.71).
Figure 4—figure supplement 1
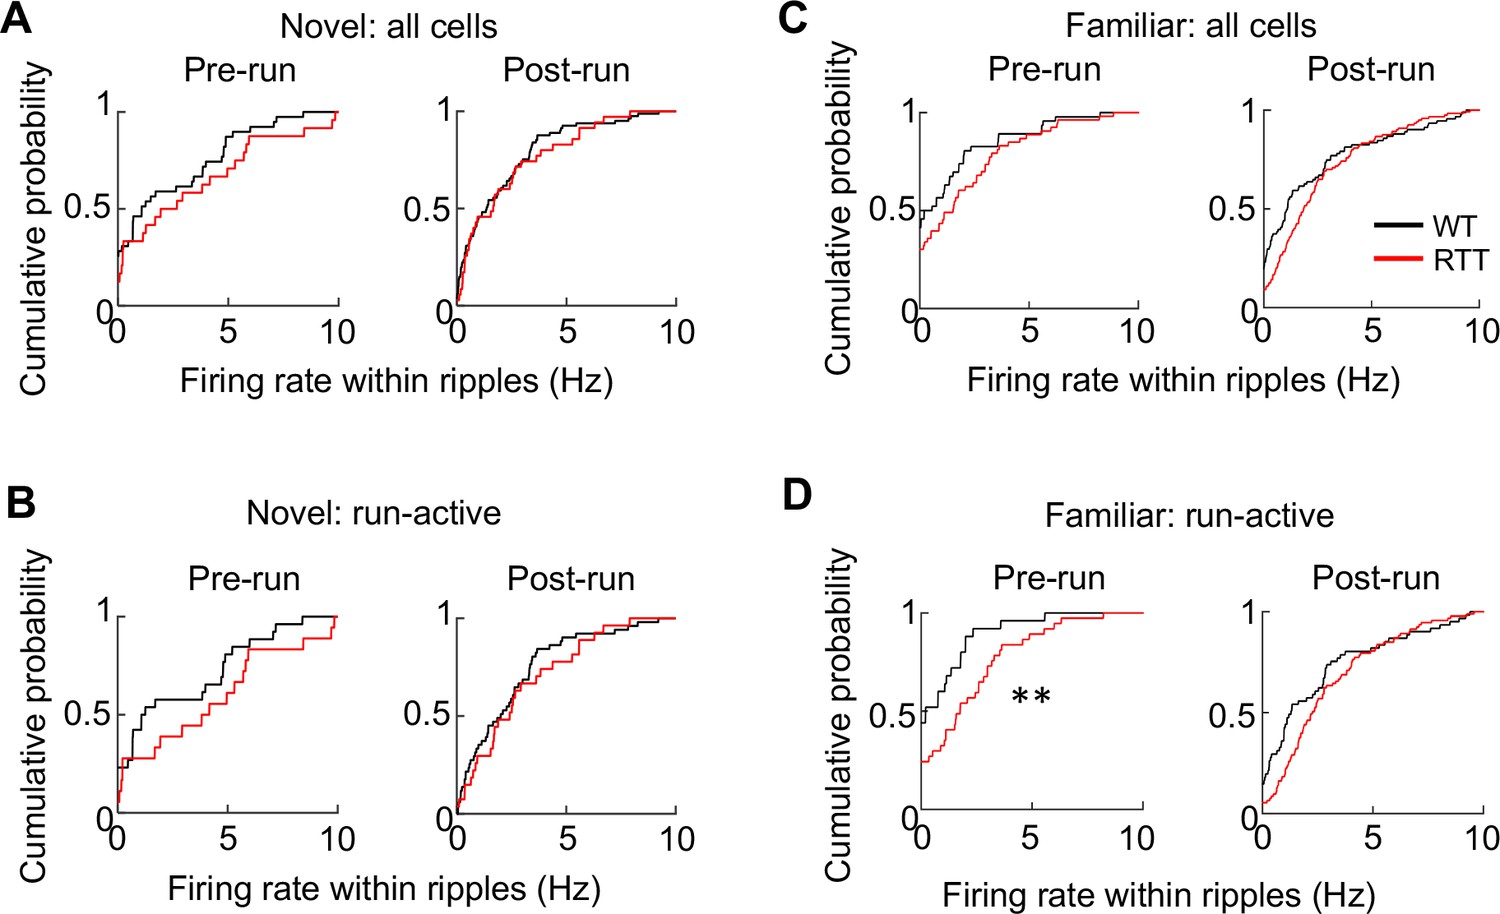
Firing rates of CA1 cells in WT and RTT mice within ripples.
(A) Cumulative distributions of firing rate for all putative CA1 pyramidal cells within ripple events before (Pre-run) and after (Post-run) running on the novel track. Pre-run: N = 40 (WT), 26 (RTT); p=0.14, Wilcoxon ranksum test. Post-run: N = 84 (WT), 39 (RTT); p=0.35. (B) Same as in (C), but for run-active cells. Pre-run: N = 26 (WT), 20 (RTT); p=0.07. Post-run: N = 53 (WT), 31 (RTT); p=0.23. (C, D) Same as in (A, B), respectively, but before and after running on the familiar track. (C) Pre-run: N = 51 (WT), 50 (RTT); p=0.06; Post-run: N = 102 (WT), 135 (RTT); p=0.11. (D) Pre-run: N = 24 (WT), 42 (RTT); **p=0.003. Post-run: N = 65 (WT), 103 (RTT); p=0.06.
Figure 4—figure supplement 2
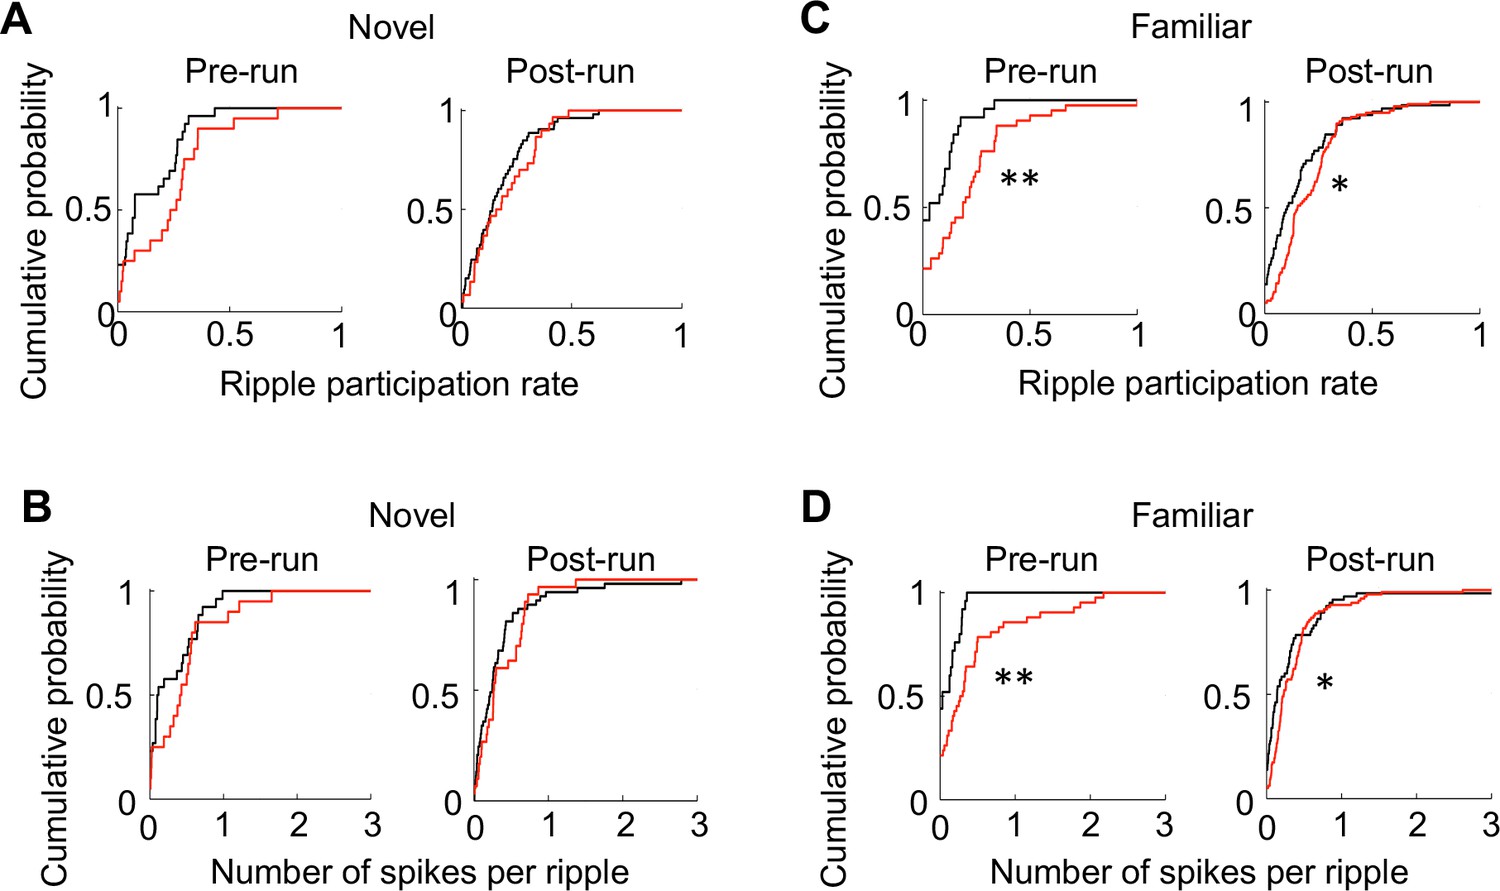
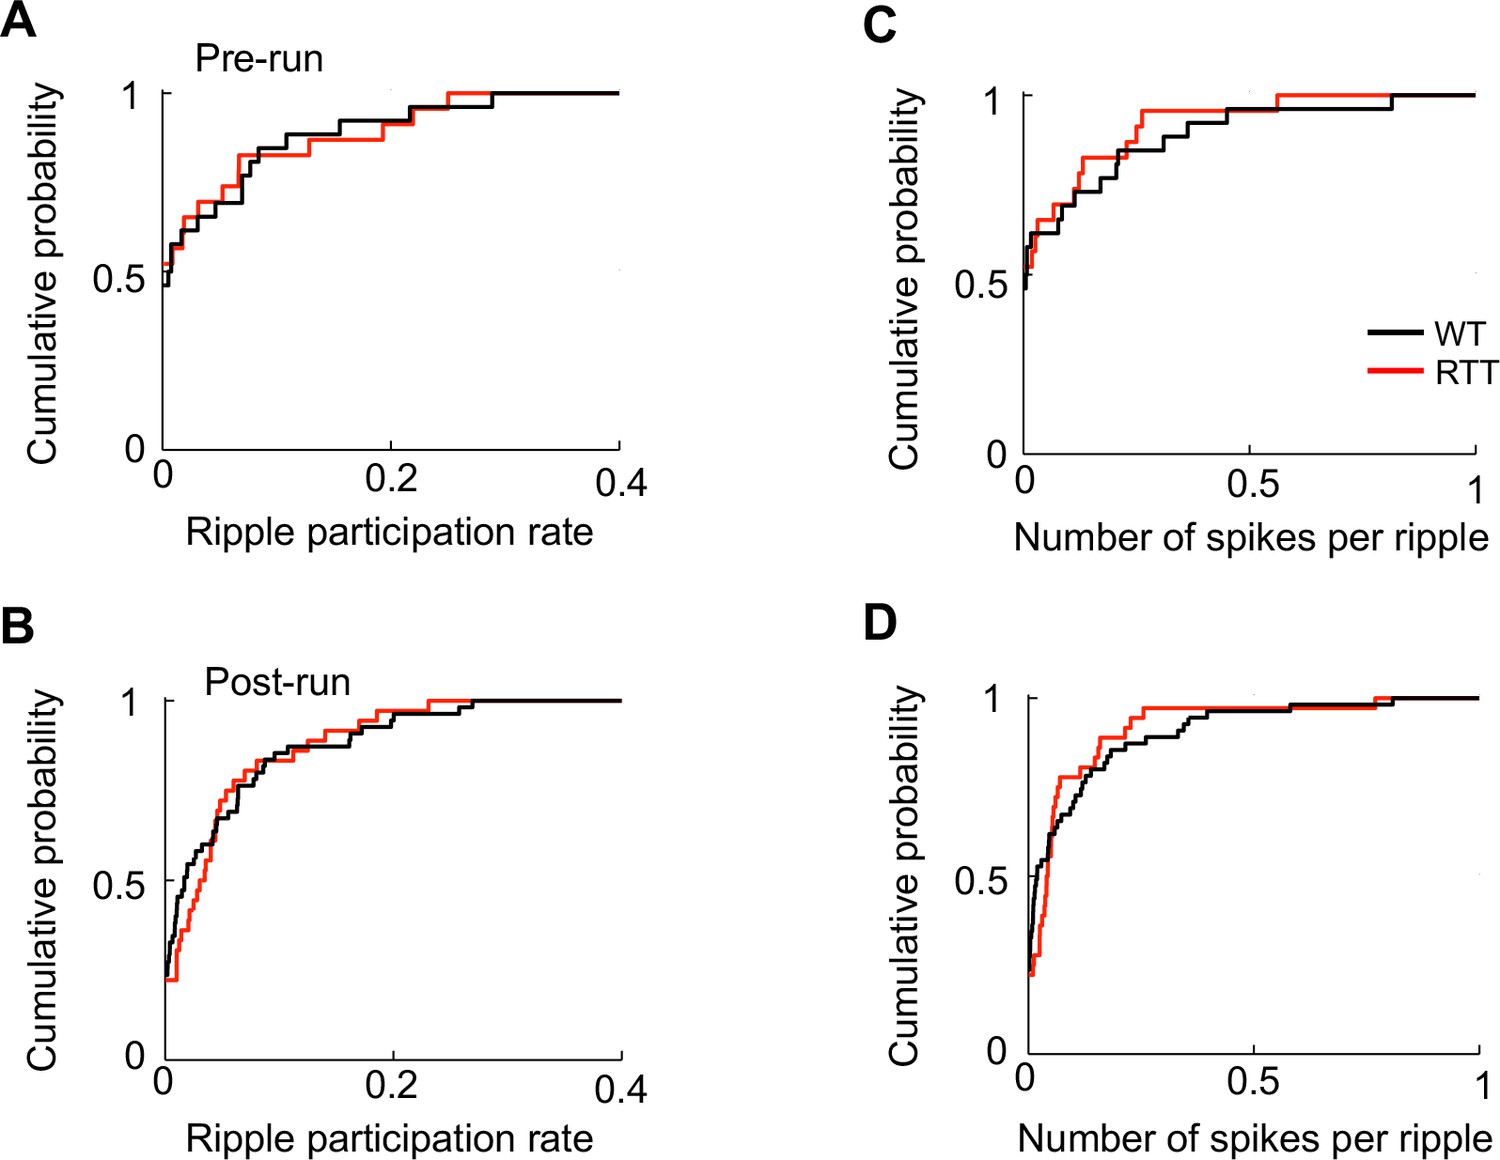
Run-active cells in RTT mice displayed enhanced activities within ripples.
(A) Cumulative distributions of ripple participation rate for run-active cells in WT and RTT mice before (Pre-run) and after (Post-run) running on the novel track. Pre-run: p=0.07, Wilcoxon ranksum test; N = 26 (WT), 20 (RTT). Post-run: p=0.39, N = 53 (WT), 31 (RTT). (B) Same as (A), but for number of spikes per ripple event. Pre-run: p=0.23; N = 26 (WT), 20 (RTT). Post-run: p=0.22, N = 53 (WT), 31 (RTT). (C) Cumulative distributions of ripple participation rate for run-active cells in WT and RTT mice before (Pre-run) and after (Post-run) running on the familiar track. Pre-run: **p=0.0023, Wilcoxon ranksum test; N = 24 (WT), 42 (RTT). Post-run: *p=0.012, N = 65 (WT), 103 (RTT). (D) Same as (C), but for number of spikes per ripple event. Pre-run: **p=0.0025; N = 26 (WT), 20 (RTT). Post-run: *p=0.019, N = 53 (WT), 31 (RTT).
Figure 4—figure supplement 3
Activities of run-inactive cells within ripples did not differ between WT and RTT mice.
(A – D) Cumulative distributions of ripple participation rate and number of spike per ripple for run-inactive cells in WT and RTT mice during Pre- and Post-run. Cells in Pre-/Post-run sessions before/after running the novel and familiar track are combined. (A): N = 26 (WT), 23 (RTT); p=0.81, Wilcoxon ranksum test. (B): N = 55 (WT), 36 (RTT); p=0.58. (C): N = 26 (WT), 23 (RTT); p=0.74. (D): N = 55 (WT), 36 (RTT); p=0.68. There was no significant difference between Run-run and Post-run in any of the parameters in either WT or RTT mice (p>0.55).
Figure 5 with 3 supplements
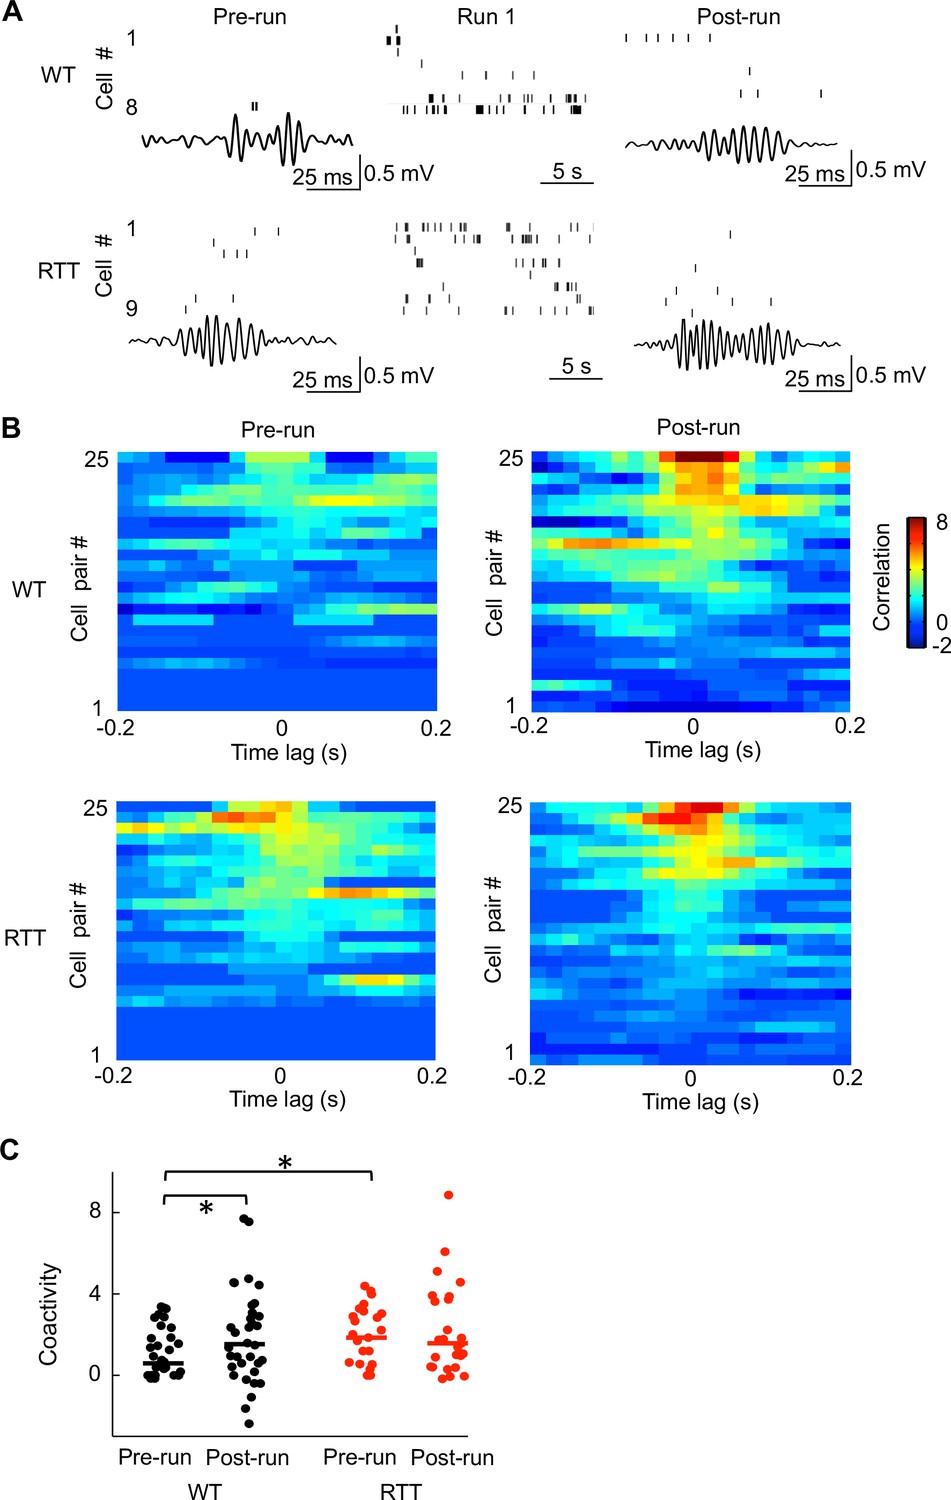
Run-active cells in RTT mice failed to increase their firing synchrony following running on the novel track.
(A) Spiking activities of run-active cells in an example WT and RTT mouse within a ripple event in Pre-run and Post-run and within a running lap in Run 1. Each row represents a cell and each tick is a spike. Bottom trace: LFP filtered within the ripple band (100–250 Hz). (B) Cross-correlograms of pairs of run-active cells within ripples in Pre-run and Post-run. Pairs are ordered by their peak correlations. 25 pairs in RTT mice and a random subset of 25 pairs out of 34 in WT mice are plotted. All these pairs were recorded throughout all sessions of Pre-run, Run 1 and Post-run. (C) Coactivities of all run-active cell pairs in WT and RTT mice within ripple events in Pre-run and Post-run. Solid lines: median values. Number of pairs: N = 34 (WT), 25 (RTT). WT coactivity between Pre-run and Post-run: *p=0.044, paired Student’s t-test; RTT: p=0.47. Pre-run coactivity between WT and RTT mice: *p=0.039, Wilcoxon ranksum test; Post-run: p=0.65.
Figure 5—figure supplement 1

CA1 cells displayed an overall baseline hypersynchrony in RTT mice.
The plot shows cumulative distribution of coactivity of all putative pyramidal cell pairs in WT and RTT mice within ripple events in Pre-run before running the novel track. Number of pairs: N = 204 (WT), 105 (RTT). ***p=0.0007, Wilcoxon ranksum test.
Figure 5—figure supplement 2

Run-active cells in RTT mice displayed enhanced firing synchrony before (Pre-run) and after (Post-run) running on the familiar track.
The plot shows coactivity of all run-active cell pairs in WT and RTT mice within ripple events in Pre-run and Post-run. Solid lines: median values. Number of pairs recorded during all sessions of Pre-run, Run 1, and Post-run: N = 32 (WT), 119 (RTT). WT coactivity between Pre-run and Post-run: **p=0.0076, paired Student’s t-test; RTT: **p=0.0014. Pre-run coactivity between WT and RTT mice: **p=0.0015, Wilcoxon ranksum test; Post-run: *p=0.012.
Figure 5—figure supplement 3

Run-silent cells in RTT mice displayed enhanced firing synchrony in ripple events.
The plot shows cumulative distribution of coactivity for pairs of run-silent cells in WT and RTT mice within ripple events, combined from Pre-run and Post-run in both the novel and familiar environments. Number of pairs: N = 268 (WT), 107 (RTT). *p=0.017, Wilcoxon ranksum test.
Figure 6
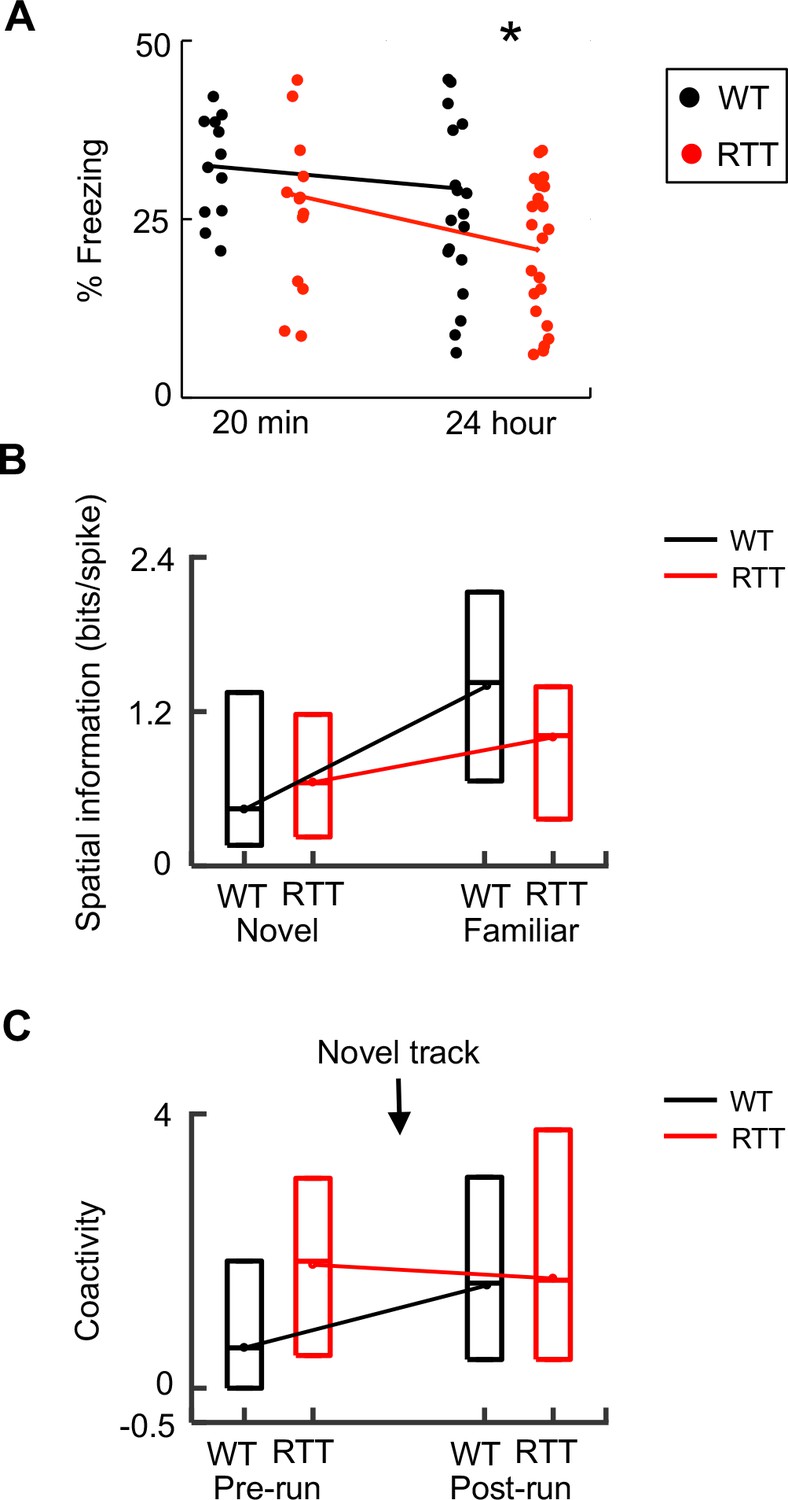
Dynamics of memory deficits paralleled those of neurophysiological deficits.
(A) Change in memory deficit from short- to long-term memory. Percentages of freezing time in a fear conditioning box, tested 20 min and 24 hr after WT and RTT animals were foot-shocked in the box, are plotted. Each dot represents an animal. Lines are median values. Two-way ANOVA for the effect of genotype: F(1,66) = 4.2; p=0.044. Post-hoc Wilcoxon ranksum test at 20 min: p=0.78, N = 12 WT, 14 RTT; at 24 hr: *p=0.034, number of animals: N = 20 WT, 22 RTT. (B) Change in spatial information from novel to familiar track in WT and RTT mice. Data are shown as median and [25–75%] range values (same below, see Figure 2). (C) Change in coactivity of run-active cells before (Pre-run) and after (Post-run) running on a novel track in WT and RTT mice (see Figure 5).
Tables
Table 1
WT and RTT animals used in the experiment and number of putative pyramidal cells recorded from each animal on the novel and familiar track.
Putative interneurons were not included. x: no recording was made, -: behavioral and neural data not analyzed because of insufficient number of laps during running.
| Genotype | Novel track cells | Familiar track cells | ||
|---|---|---|---|---|
| Putative pyramidal | Active | Putative pyramidal | Active | |
| WT | 23 | 12 | 36 | 27 |
| WT | - | - | 1 | 1 |
| WT | 21 | 15 | 8 | 5 |
| WT | 8 | 6 | 6 | 4 |
| WT | 10 | 6 | 26 | 11 |
| WT | 1 | 1 | 7 | 6 |
| WT | 9 | 4 | 18 | 11 |
| WT | 12 | 9 | x | x |
| RTT | - | - | 36 | 29 |
| RTT | 5 | 5 | 5 | 4 |
| RTT | 6 | 5 | 8 | 6 |
| RTT | 6 | 5 | 34 | 27 |
| RTT | 7 | 3 | 19 | 14 |
| RTT | 10 | 8 | 30 | 23 |
| RTT | 1 | 1 | 3 | 0 |
| RTT | 1 | 1 | 0 | 0 |
| RTT | 0 | 0 | x | x |
| RTT | 3 | 3 | x | x |
| WT total | 84 | 53 | 102 | 65 |
| RTT total | 39 | 31 | 135 | 103 |
Key resources table
| Reagent type | Designation | Source or reference | Identifiers | Additional information |
|---|---|---|---|---|
| Gene (mouse) | Mecp2 | DOI: 10.1038/85899 | RRID:MGI:3624717 | |
| Strain (mouse) | Wild-Type control | Source (public (Taconic Farms, Inc., Germantown, NY, USA)); Source (DOI: 10.1038/85899) | 129SvEv: RRID:MGI:5653381; FVB: RRID:IMSR_TAC:fvb | |
| Strain (mouse) | RTT | PMID: 11242117; DOI: 10.1038/85899 | RRID:IMSR_JAX:003890 | |
| Software | Neuralynx Cheetah | https://neuralynx.com/software/cheetah | ||
| Software | MatLab | https://www.mathworks.com/products/matlab.html | ||
| Software | xclust2 | https://github.com/wilsonlab/mwsoft64/tree/master/src/xclust | ||
| Software | DataManager | https://github.com/DaoyunJiLab/DataManager | Copy archived at https://github.com/elifesciences-publications/DataManager |
Additional files
-
Transparent reporting form
- https://doi.org/10.7554/eLife.31451.017
Download links
A two-part list of links to download the article, or parts of the article, in various formats.
Downloads (link to download the article as PDF)
Open citations (links to open the citations from this article in various online reference manager services)
Cite this article (links to download the citations from this article in formats compatible with various reference manager tools)
Impaired spatial memory codes in a mouse model of Rett syndrome
eLife 7:e31451.
https://doi.org/10.7554/eLife.31451


