A disassembly-driven mechanism explains F-actin-mediated chromosome transport in starfish oocytes
- European Molecular Biology Laboratory, Germany
Figures
Figure 1 with 1 supplement
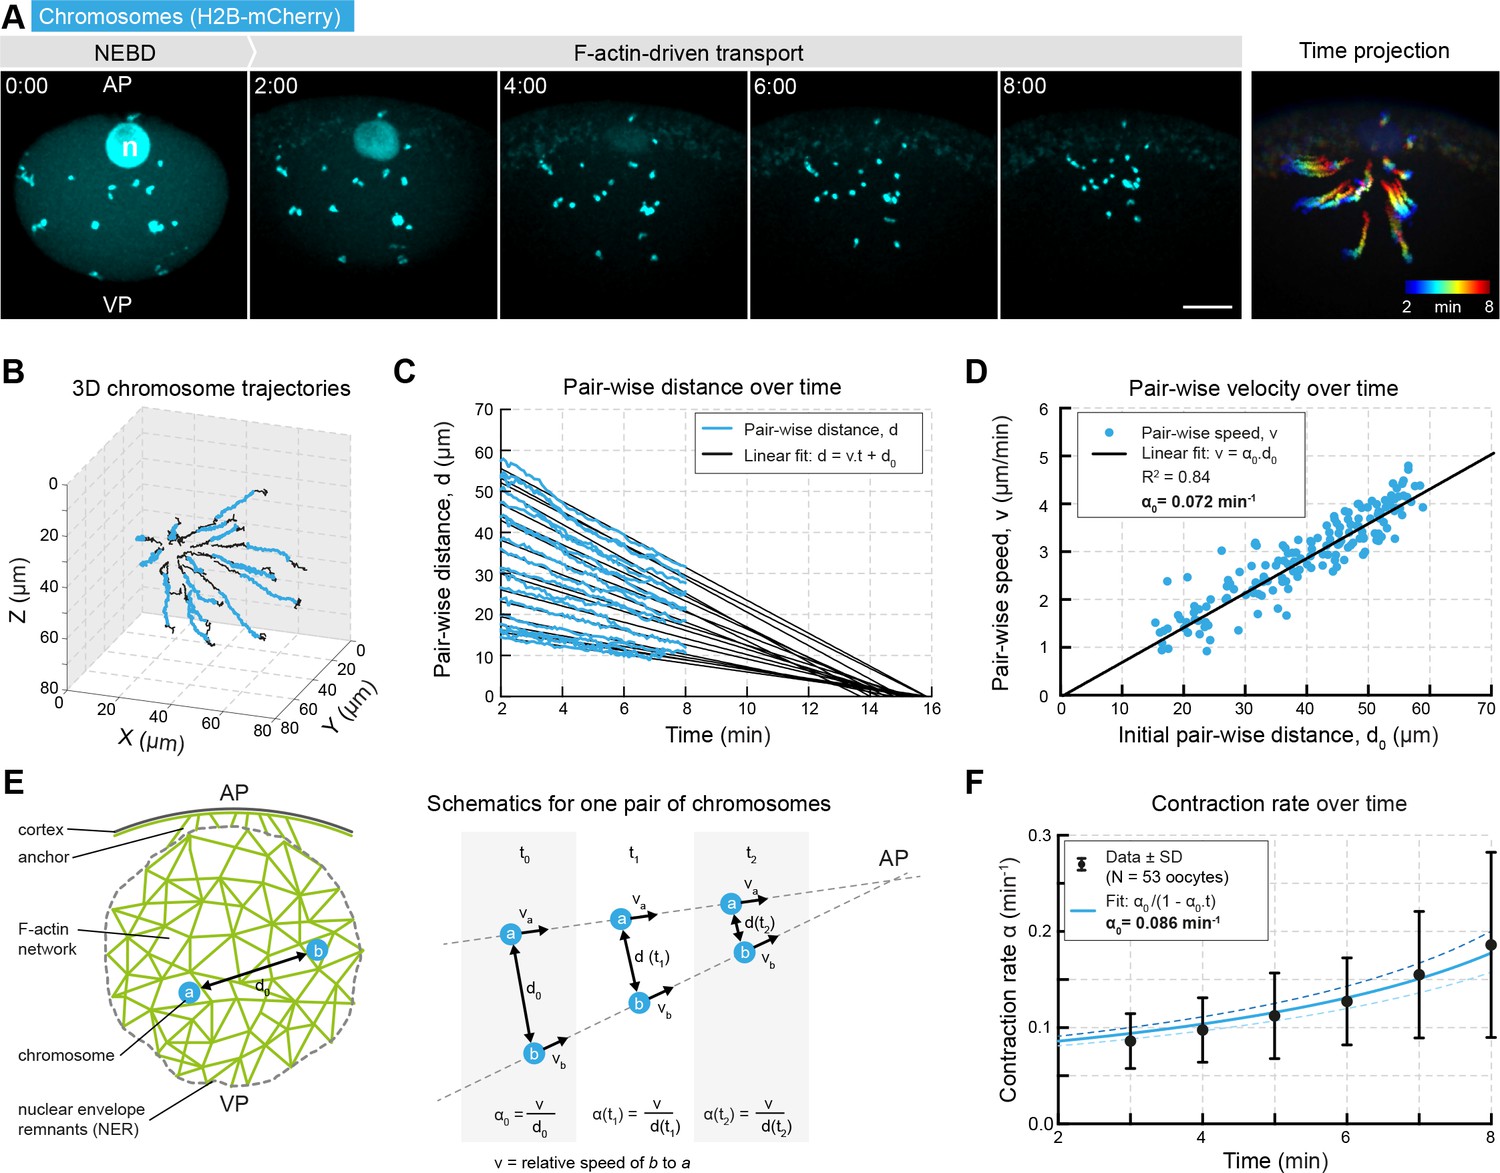
Network contraction is characterized by a single rate.
(A) Maximum z-projections of selected time points through the nuclear region of live starfish oocytes expressing H2B-mCherry (cyan) to label chromosomes during actin-driven chromosome congression. n: disassembling nucleolus; AP: animal pole; VP: vegetal pole; right: pseudo-color time projection of z-projections. (B) 3D plot of chromosome trajectories derived from the data set in (A) during chromosome congression (2–8 min after NEBD highlighted in cyan). (C) Plot of pair-wise distances of chromosomes, d versus time for the same data set. The pair-wise approach speed was determined by a linear fit, as shown, and extrapolated to visualize ‘congression time’. (D) Pair-wise chromosome approach speeds depend linearly on the initial distance, d0 for all chromosome pairs. (E) Schematics for one pair of chromosomes while being transported to the AP with a constant speed and decreasing distance. Thus, the contraction rate, α is increasing through the process. (F) Contraction rates calculated for 2 min intervals from 2 to 8 min after NEBD and fitted with Equation 3 to determine the initial approach rate, α0. Best fit α0 is shown in solid line, α0 ± 5% is shown in dashed lines. Scale bars, 20 μm; time is given as mm:ss relative to NEBD. N indicates the number of oocytes.
Figure 1—figure supplement 1
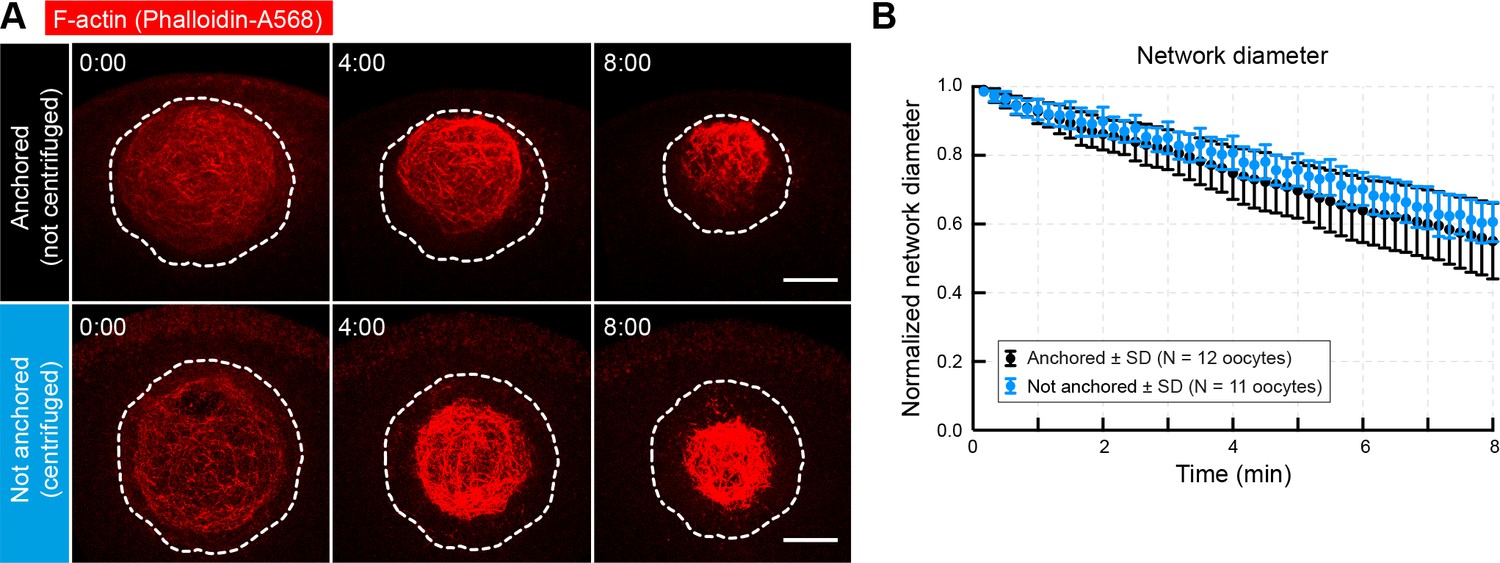
Contraction is independent of anchoring at the animal pole.
(A) Oocytes were injected with phalloidin-AlexaFluor 568 to label the initial contracting network ~ 2 min after the start of NEBD. Prior to injection, oocytes were centrifuged (bottom panel) in order to relocate the nucleus away from the cortex. Selected maximum-intensity z projections of the nuclear region are shown. Dashed contour delineates the nuclear region. (B) Change of network diameter in centrifuged versus non-centrifuged control oocytes shows no significant difference of contraction rates. Scale bar, 20 μm. Time is given as mm:ss relative to injection. Data were collected from at least two independent experiments.
Figure 2

Concomitant with network contraction new filaments polymerize along its boundary.
(A) A pulse of phalloidin-AlexaFluor 568 (red) was injected into the nuclear region ~2 min after NEBD in an oocyte expressing 3mEGFP-UtrCH (grays) to label the population of F-actin present at the time of injection. AP: animal pole; VP: vegetal pole. Selected sum-intensity z projections are shown. (B) Intensity profiles along the dashed line in (A) (2 μm wide, rolling average of 0.5 μm). Gray dashed lines indicate the position of the nuclear boundary; asterisks mark the edge of the phalloidin-labeled old network. (C) Kymograph-like plots of the region marked by a dashed rectangle in (A). (D) Similar to (A) except that chromosomes were additionally labeled by H2B-3mEGFP (cyan) in oocytes injected with phalloidin-AlexaFluor 568 (red). z-projections of selected time points are shown. (E) The diameter of the pulse labeled network (D as shown on (D)) decreases linearly during the F-actin-driven chromosome transport. Data were collected from five independent experiments. (F) Contraction speeds calculated by measuring network diameter corresponding to contraction speeds calculated from chromosome approach. Data were collected from two independent experiments. N indicates the number of oocytes. Scale bar: 20 μm; time is given as mm:ss relative to NEBD.
Figure 3 with 1 supplement
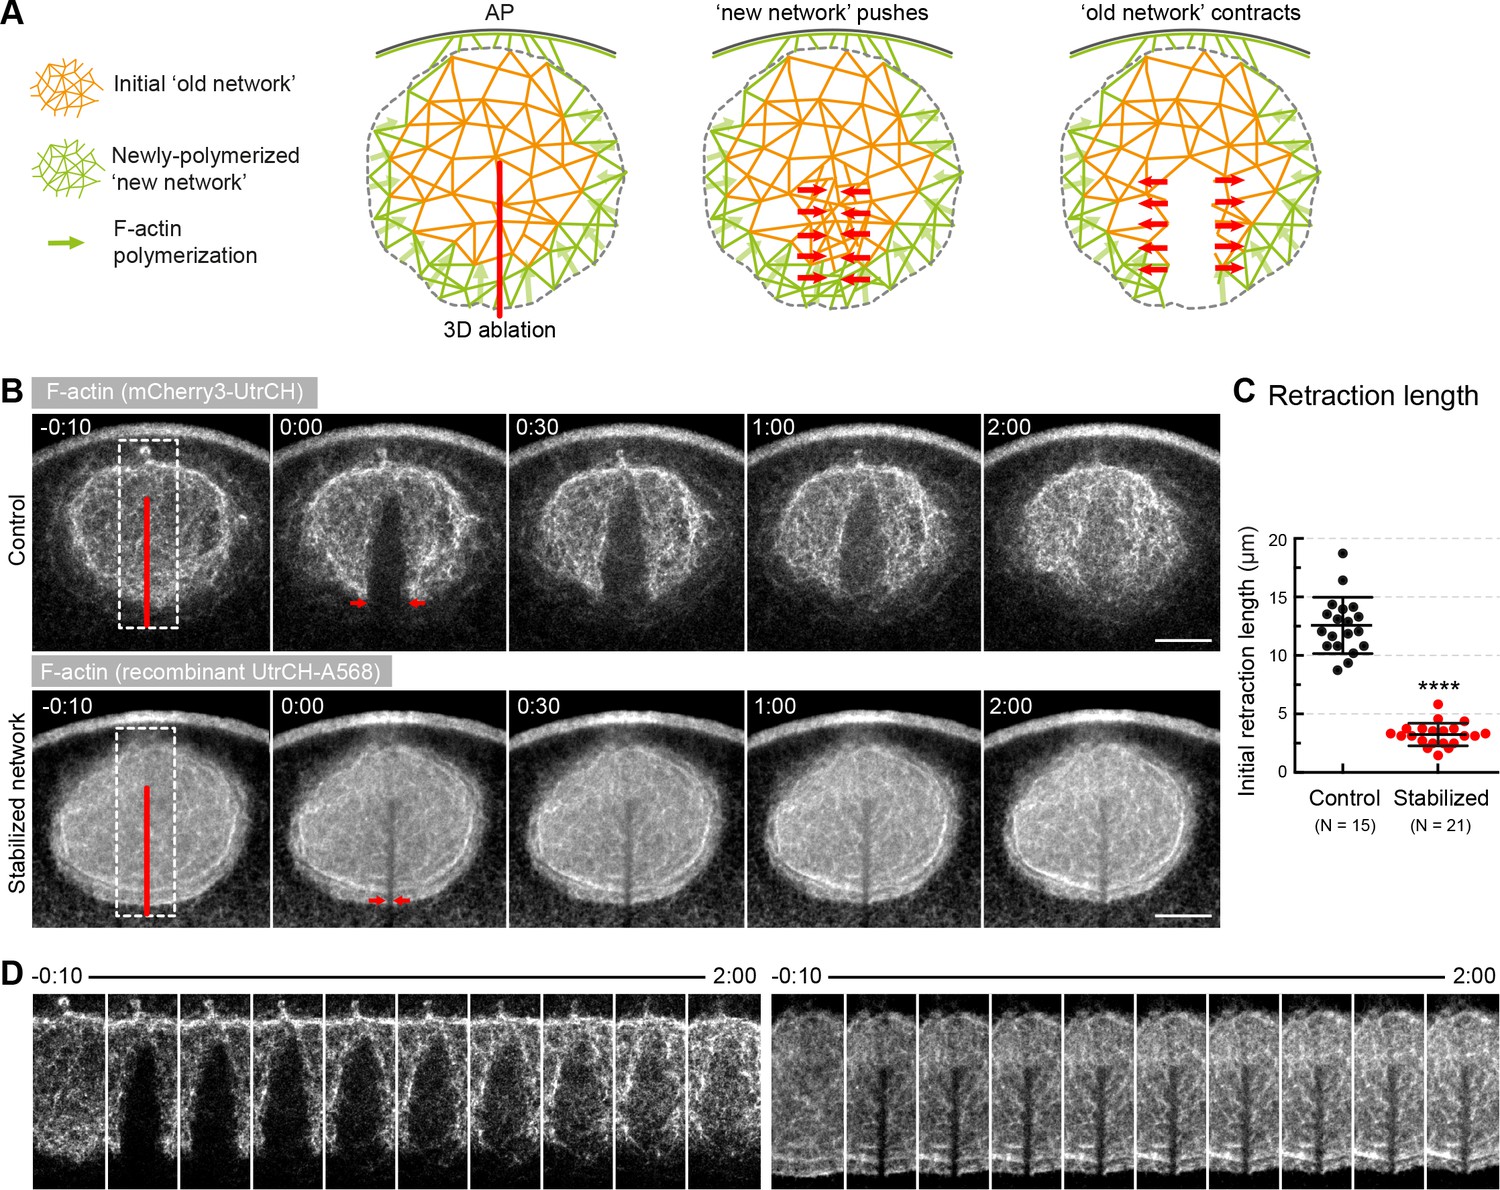
Forces in the network, rather than pushing by polymerization generate contractility.
(A) Schematics illustrating the expected response to ablation in case of a ‘pushing’ mechanism vs. active contraction of the network. (B) Selected sum-intensity z-projections through the nuclear region of live oocytes expressing 3mCherry-UtrCH. Top row: untreated control; bottom row: injected with a large amount of recombinant UtrCH to stabilize F-actin. One frame just before and frames after 3D ablation along the animal-vegetal axis (red line) are shown. (C) Initial retraction distance as marked by red arrows in (B) in control and stabilized oocytes. Data were collected from three independent experiments. N indicates the number of oocytes. Mann-Whitney’s test, ****p<0.0001. (D) Cut regions outlined by dashed boxes in (B) are shown zoomed and for several time points. Scale bar, 20 μm. Time is given as mm:ss relative to NEBD.
Figure 3—figure supplement 1
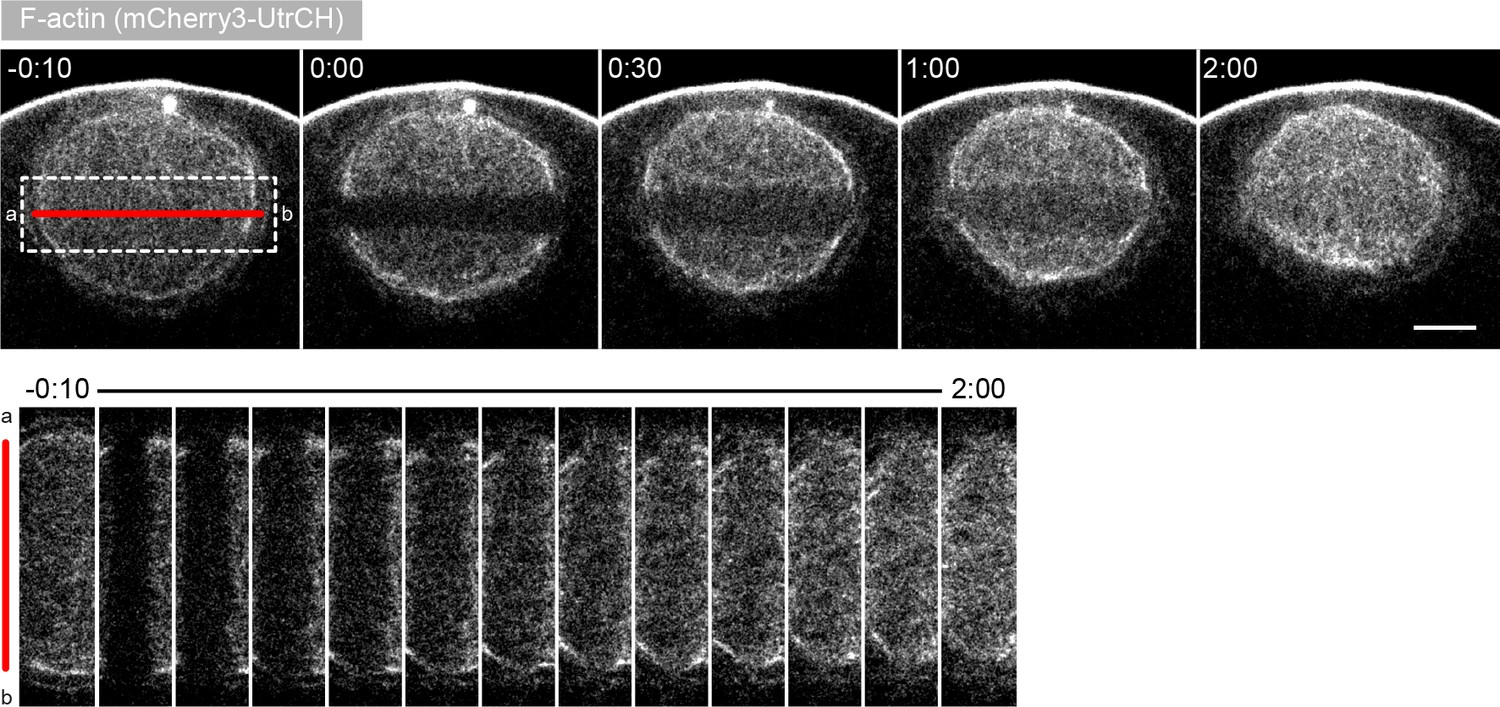
Effects of laser ablation are independent of the direction of the cut.
Selected sum-intensity z-projections through the nuclear region of live oocytes expressing 3mCherry-UtrCH. One frame just before and frames after 3D ablation perpendicular to the animal-vegetal axis (red line) are shown. At the bottom, cut region outlined by the dashed box is shown zoomed and for several time points. Scale bar: 20 μm. Time is given as mm:ss relative to the ablation.
Figure 4 with 1 supplement
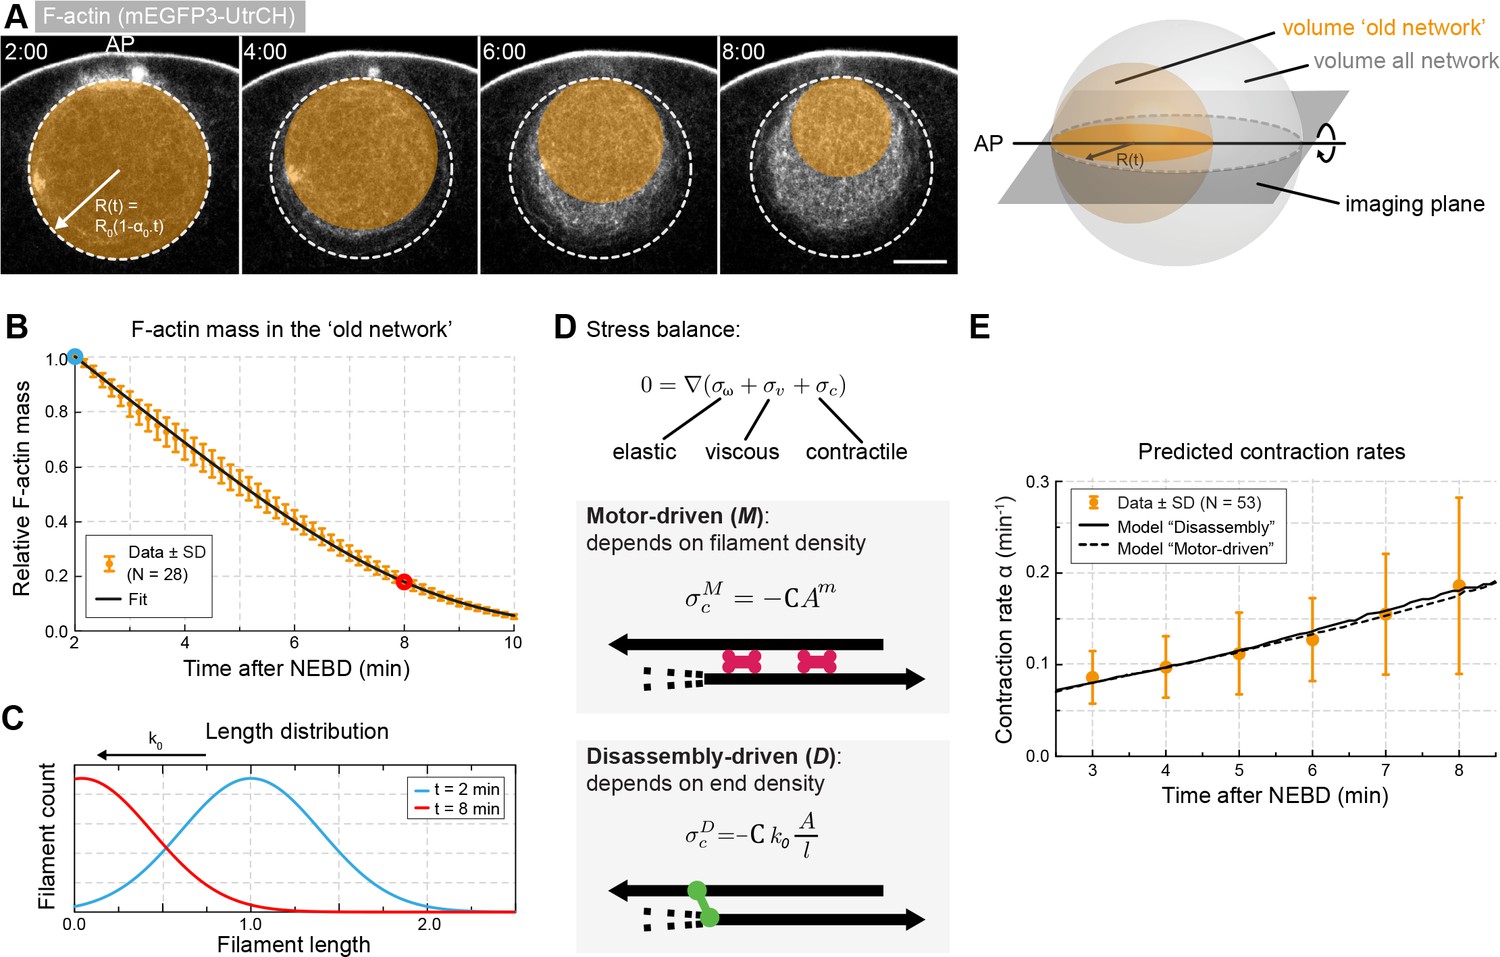
Network contraction is correlated with its disassembly.
(A) Quantification of F-actin mass by measuring 3mEGFP- or 3mCherry-UtrCH intensities in the region corresponding to the old network (orange circle). Right: scheme illustrating extrapolation of the intensities measured in the imaging plane to the 3D volume. (B) Relative changes in F-actin mass (normalized between 0 and 1) over time calculated as explained in (A) for several oocytes. Equation 5 was used to fit the data (black curve). Data were collected from five independent experiments. (C) Filament size distribution at the start (cyan) and end (red) of the contraction process: filament length decreases as set by the depolymerization rate k0. (D) Schematic representations and equations for the two viscoelastic models, motor-driven (M) and disassembly-driven (D). (E) Fits of the two models, D in continuous line, M: dashed line to the contraction rates measured experimentally as shown in Figure 1F. N indicates the number of oocytes. Scale bar, 20 μm; time is given as mm:ss relative to NEBD.
Figure 4—figure supplement 1
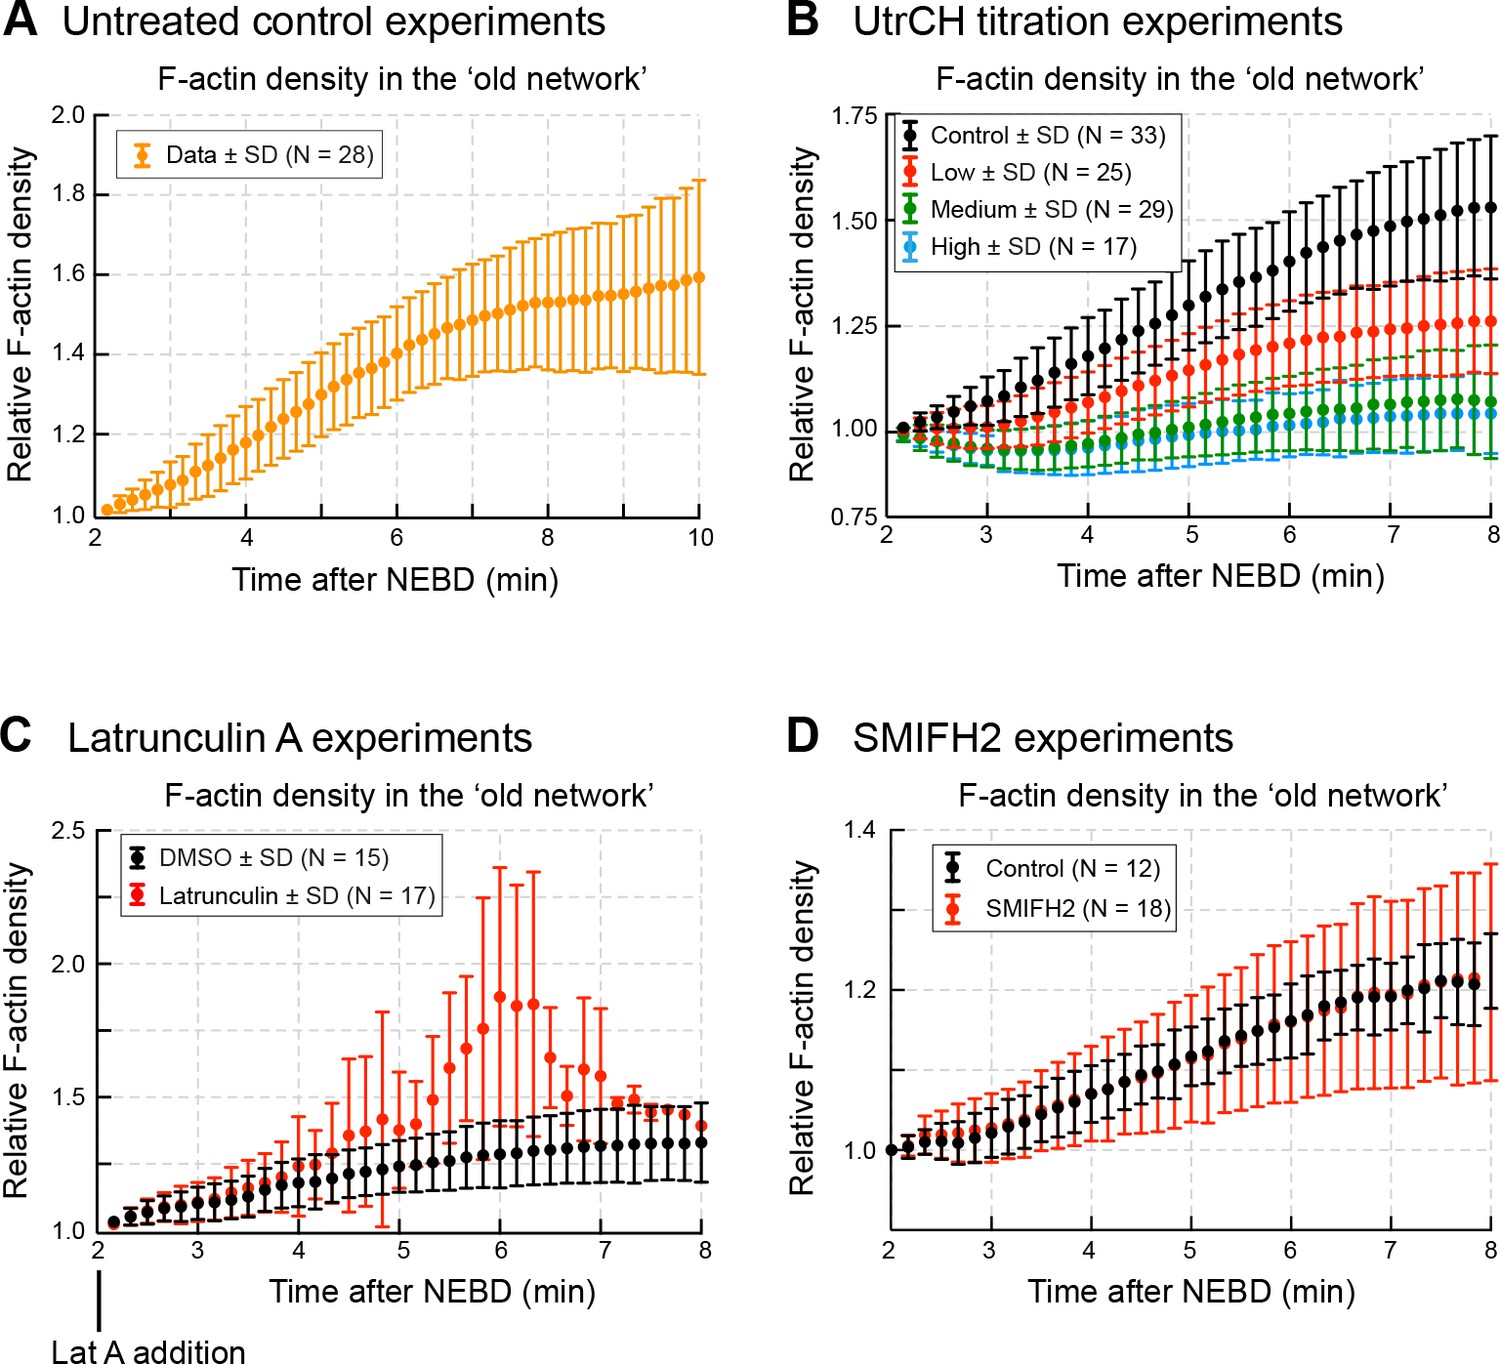
F-actin densities in the old network.
Quantification of F-actin density (mean fluorescence intensity) in the old network in different experiments: (A) in untreated control oocytes (related to Figure 4); (B) in oocytes injected with different amount of UtrCH (related to Figure 6); (C) in Latrunculin A-treated oocytes (related to Figure 7); and (D) in SMIFH2-treated oocytes (related to Figure 9). N indicates the number of oocytes. Data were collected from at least three independent experiments.
Figure 5 with 1 supplement
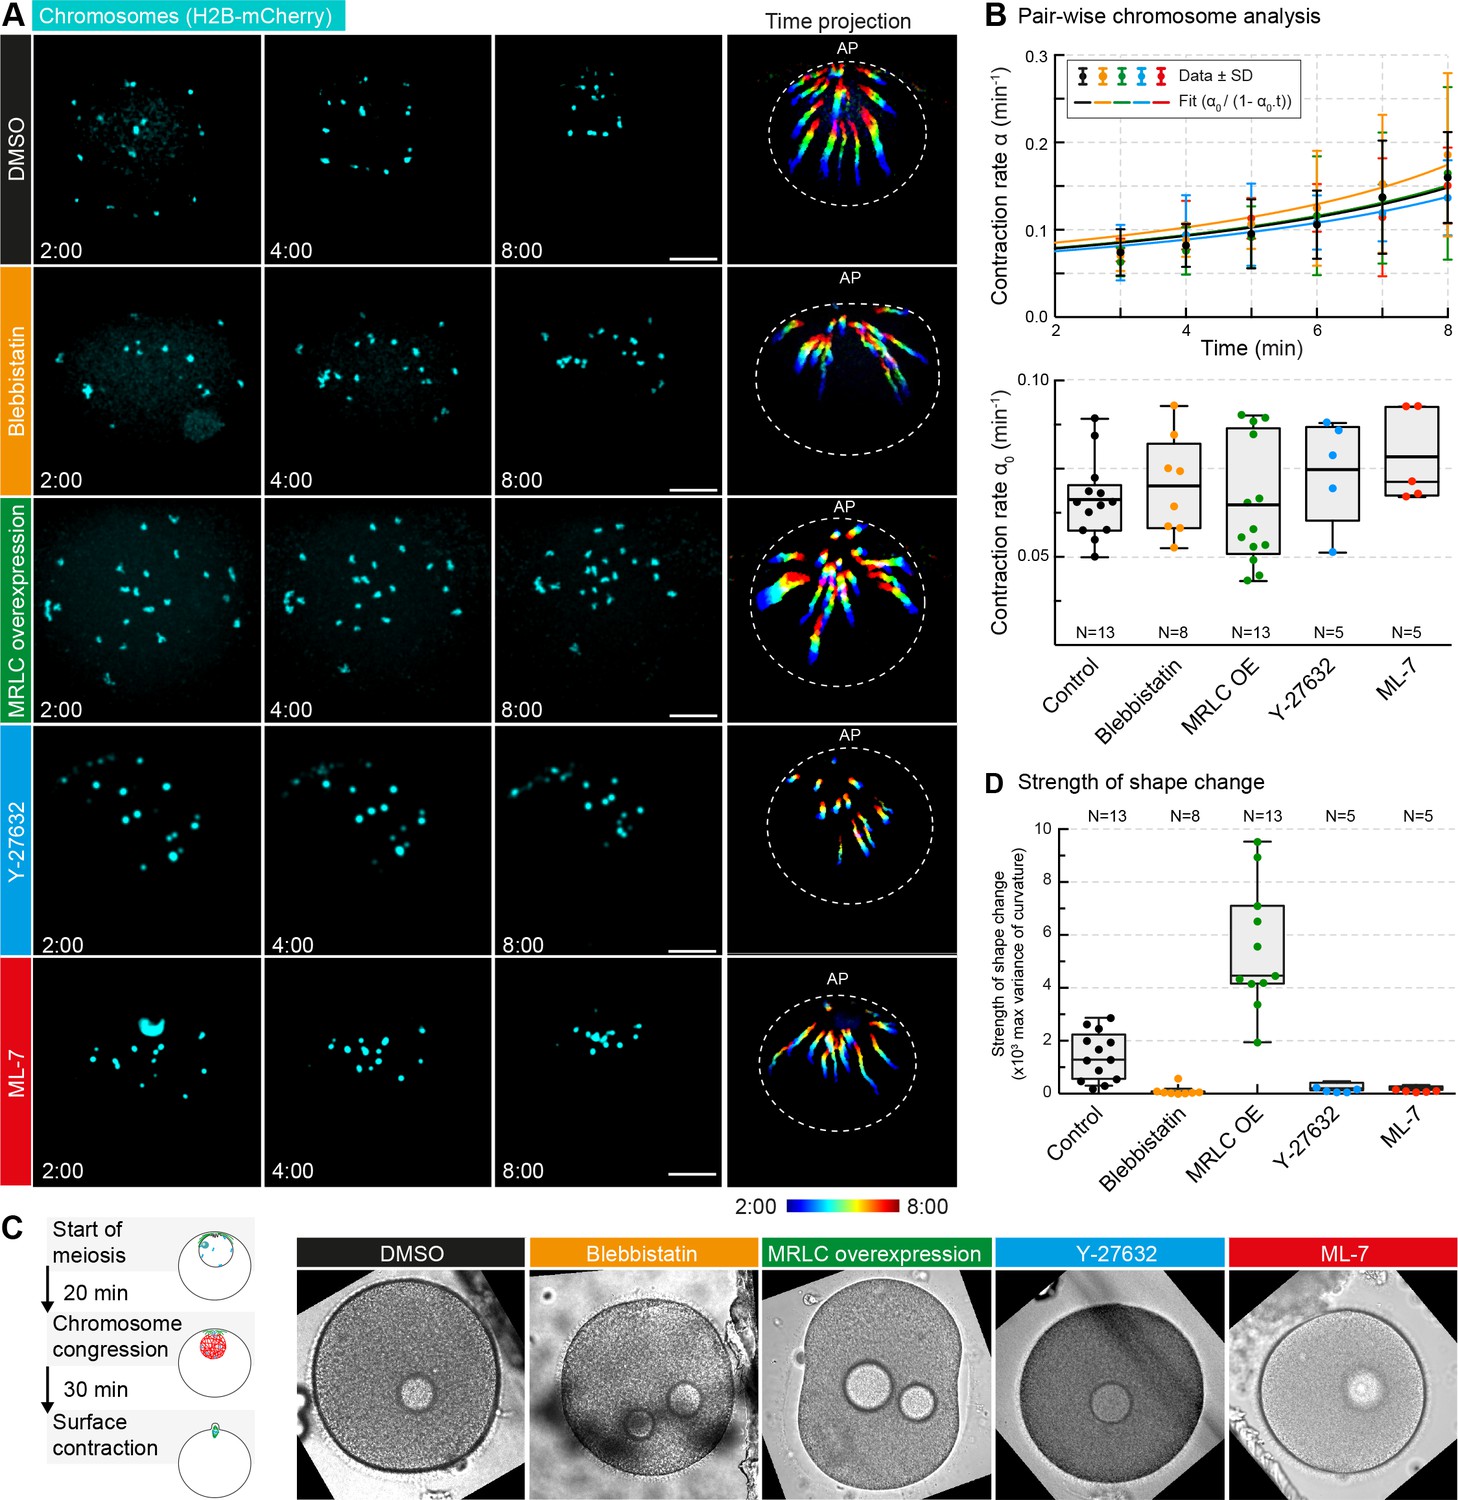
Non-muscle myosin II perturbations do not affect the rate of contraction.
(A) Maximum-intensity z-projection through the nuclear region of oocytes expressing H2B-mCherry (cyan), either incubated for 3 hr with blebbistatin (300 μM), for 1 hr with ML-7 (100 μM) or Y-27632 (100 μM), or expressing MRLC-mEGFP, or treated with DMSO at a concentration corresponding to that of the blebbistatin treatment. Dashed circles represent the initial nuclear contour. Right: pseudocolored time projection of z-projections. Scale bar, 20 μm; time is given as mm:ss relative to NEBD. (B) Top: contraction rate over time for each condition with fits for determining α0 done as for Figure 1F. Bottom: box plots combined with dot plots of derived values of α0 for multiple oocytes. N indicates the number of oocytes. ANOVA: p<0.26. (C) Left: schematic of starfish meiosis to illustrate the relative times of NEBD, chromosome congression and surface contraction waves. Right: transmitted light frames at the maximum deformation during the surface contraction wave of oocytes treated exactly as for (A). (D) Quantification of the strength of the shape change (maximum variance of surface curvature) during the surface contraction wave performed on the same oocytes treated with blebbistatin, Y-27632 and ML-7 and injected with MRLC and corresponding DMSO control, confirming the effectiveness of the treatments. Dot plots of measurements on individual oocytes overlaid with box plots of the same data. N indicates the number of oocytes. ANOVA, p<0.0001. Data were collected from three independent experiments.
Figure 5—figure supplement 1
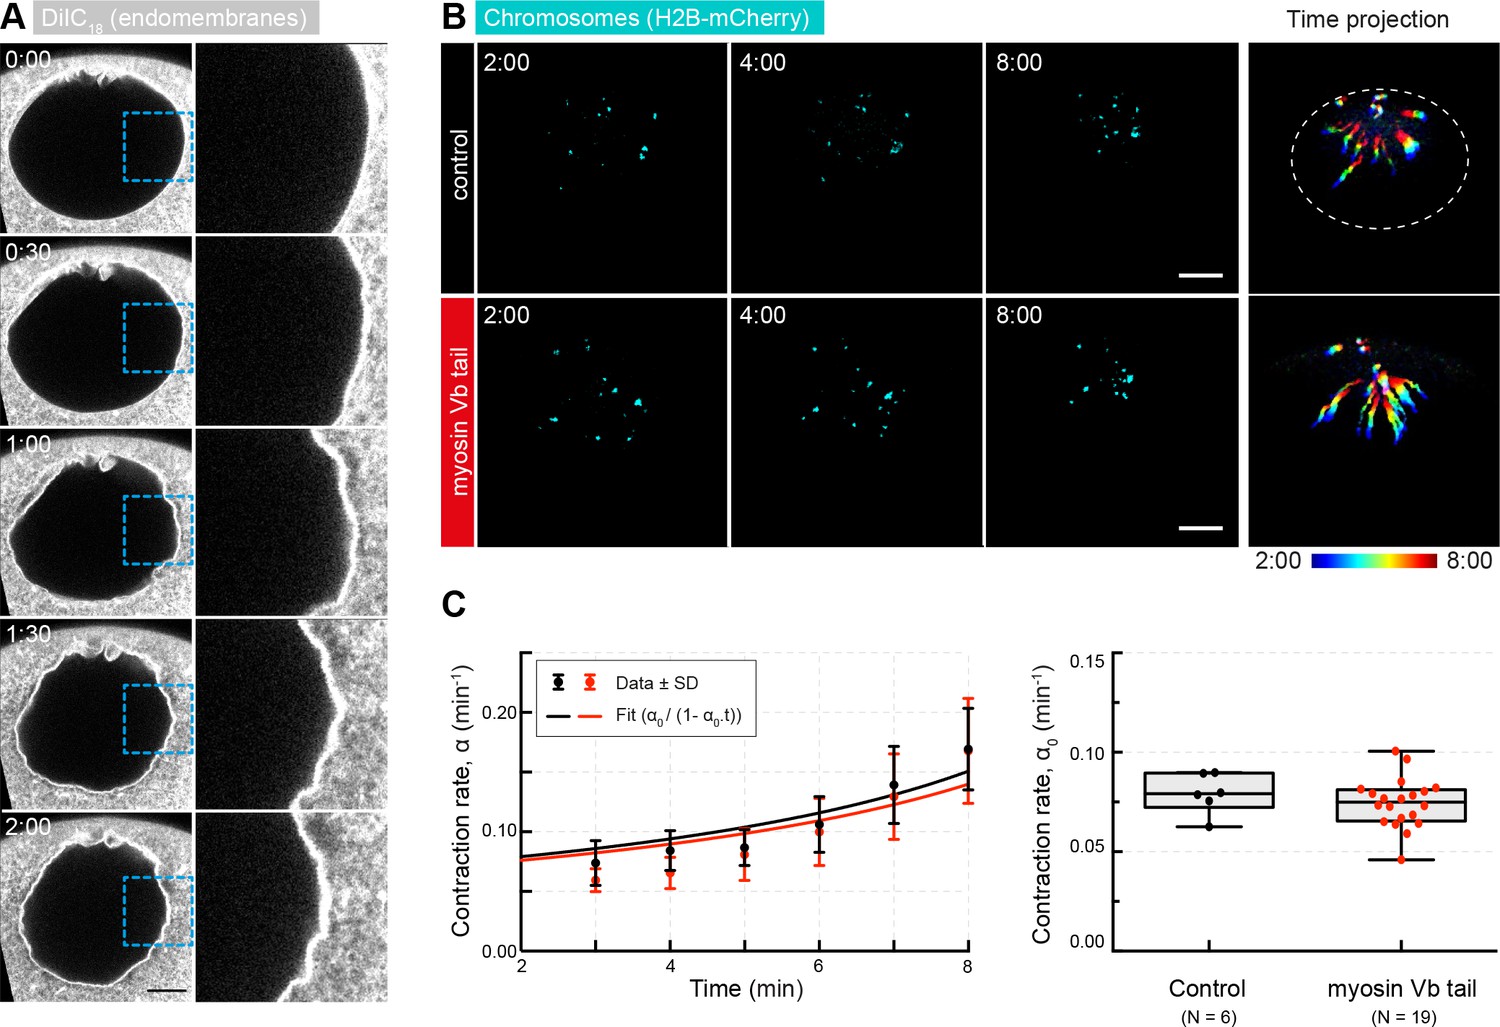
Myosin Vb tail overexpression does not affect the rate of contraction.
(A) Selected frames from a time lapse of confocal sections through the nuclear region of live oocyte injected with DiIC16(3) to label endomembranes showing the absence of membranous structures in the nuclear region. Right: zoomed regions outlined by dashed boxes. (B) Maximum-intensity z-projection through the nuclear region of oocytes expressing H2B-mCherry (cyan), either injected with PBS (control) or expressing mEGFP-myosin Vb tail. Right: pseudocolored time projection of z-projections. (C) Left: contraction rates over time for each condition fitted by Equation 3 to determine α0 as for Figure 1F. Right: box plots combined with dot plots of derived values of α0 for multiple oocytes. Mann-Whitney’s test, p<0.4. Scale bar, 20 μm; time is given as mm:ss relative to NEBD. N indicates the number of oocytes. Data were collected from two independent experiments.
Figure 6 with 1 supplement

Stabilization of filaments slows disassembly and contraction rate.
(A) Maximum-intensity z projections of the nuclear region of oocytes expressing H2B-mCherry (cyan) and injected with different amounts of recombinant UtrCH or PBS as control. Dashed circles represent the initial nuclear contour. Right: pseudocolored time projection of z-projections. (B) Selected confocal sections through the nuclear regions of live oocytes expressing mCherry3-UtrCH. The extrapolated size of the old network shown by colored dashed circles that were used for calculation of F-actin mass. Region of constant size shown by colored solid circles is used to calculate F-actin density. (C) Contraction rates (α0) were calculated as for Figure 1F. Box plots combined with dot plots. Kruskal-Wallis’ post hoc test, **p<0.008; ****p<0.0001. (D) Quantification of F-actin mass in the old network in the different conditions shown in (B) and calculated as illustrated in Figure 4A. (E) Quantification of F-actin density in a constant size region shown in (B). (F) Fit of observed contraction rates to motor- and disassembly-driven models of contraction (dashed and continuous lines, respectively). Scale bars: 20 μm; time is given as mm:ss relative to NEBD. N indicates the number of oocytes. Data were collected from at least three independent experiments.
Figure 6—figure supplement 1
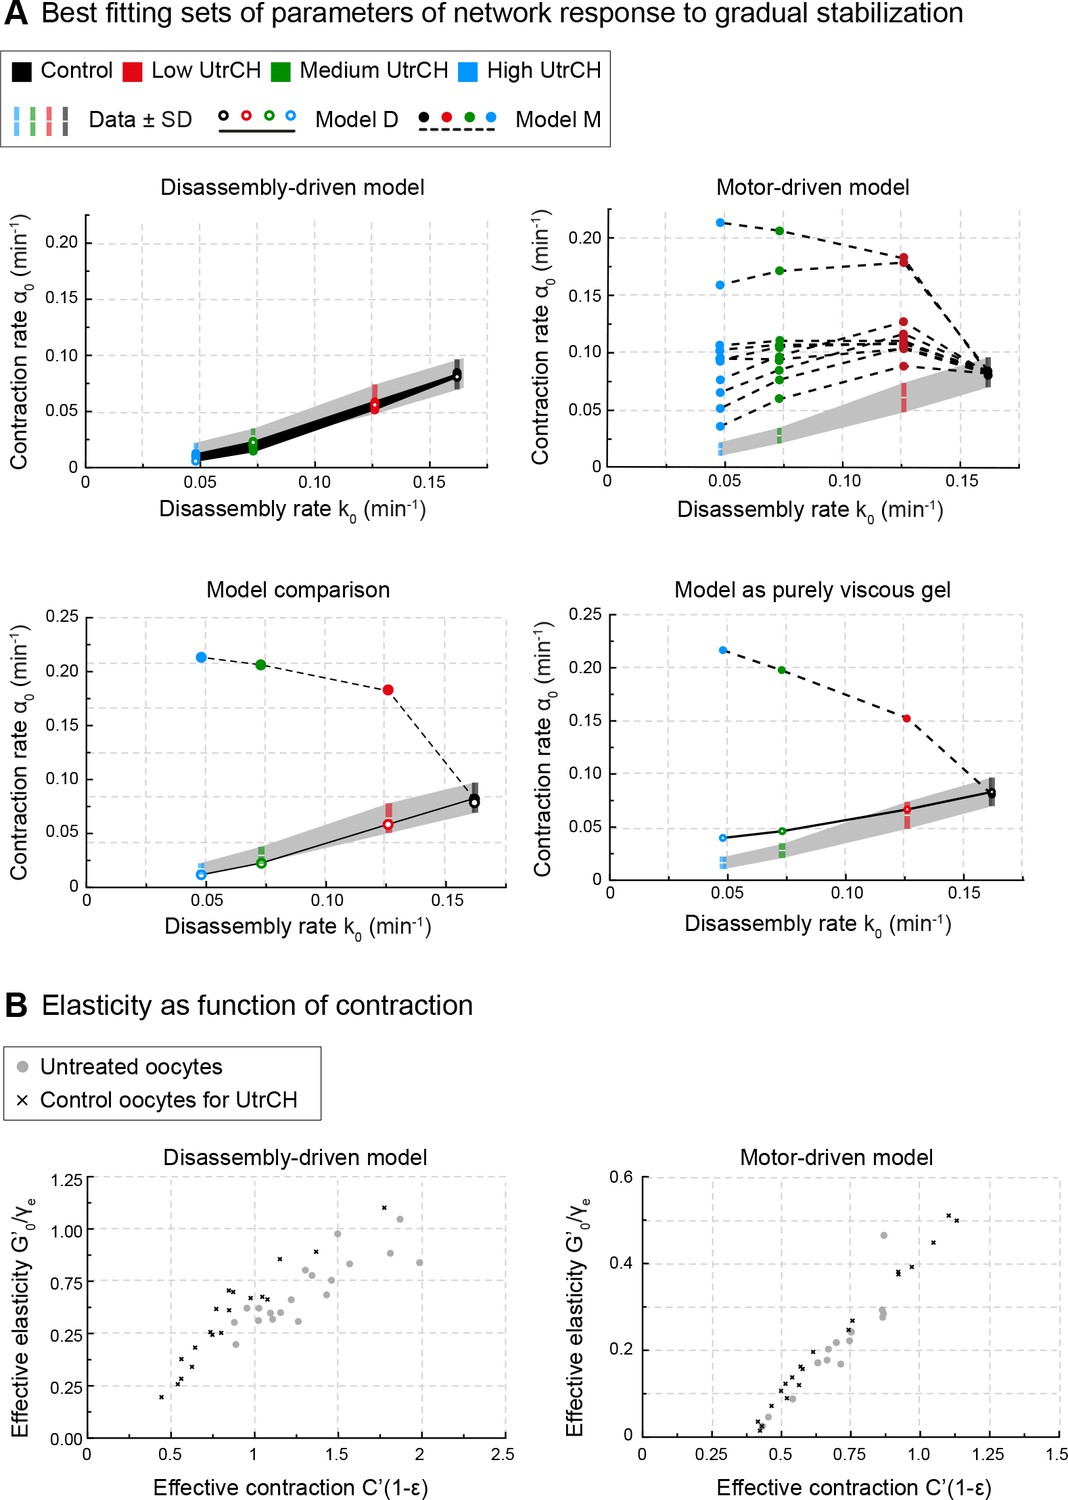
The rates of disassembly and contraction are coupled, and predicted by disassembly-driven model.
(A) Model predictions for contraction rate, α0 as a function of the depolymerization rate k0 are compared to experimental data derived from oocytes injected with varying amounts of UtrCH. Top: 10 best fitting parameter sets for disassembly-driven (left) and motor-driven (right) viscoelastic models. Bottom: comparison of the best fitting parameter sets for the two viscoelastic models (left) and purely viscous gel models (right). (B) Parameter space for the 20 best fitting parameter sets of the motor- and disassembly-driven viscoelastic models, for untreated oocytes (gray circles) and PBS injected UtrCH controls (black crosses).
Figure 7 with 1 supplement
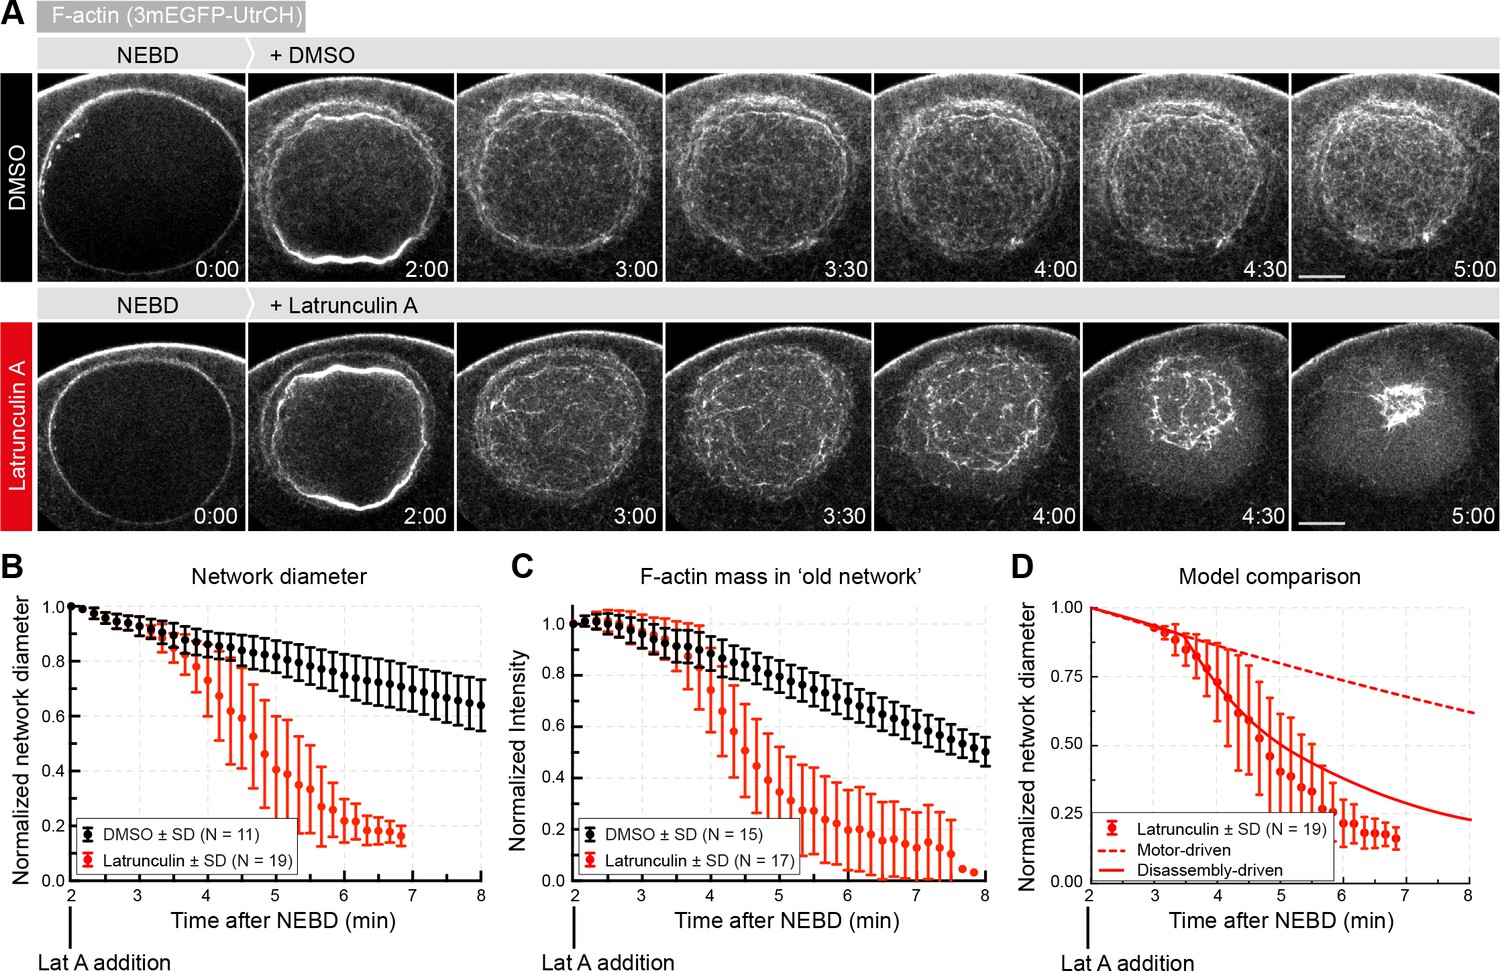
Enhancing disassembly speeds up contraction.
(A) Selected frames from a time lapse of confocal sections through the nuclear region of live oocytes expressing mEGFP3-UtrCH (gray). Oocytes were treated with either Latrunculin A (2.5 μM) or a corresponding amount of DMSO ~2 min after the start of NEBD. (B) The size of the contracting network was calculated similar to Figure 2D. (C) Quantification of F-actin mass in the old network as described in Figure 4A. (D) Comparison of fits of motor- and disassembly-driven models to the observed network contraction rate (dashed and continuous lines, respectively). N indicates the number of oocytes. Data were collected from at least three independent experiments.
Figure 7—figure supplement 1
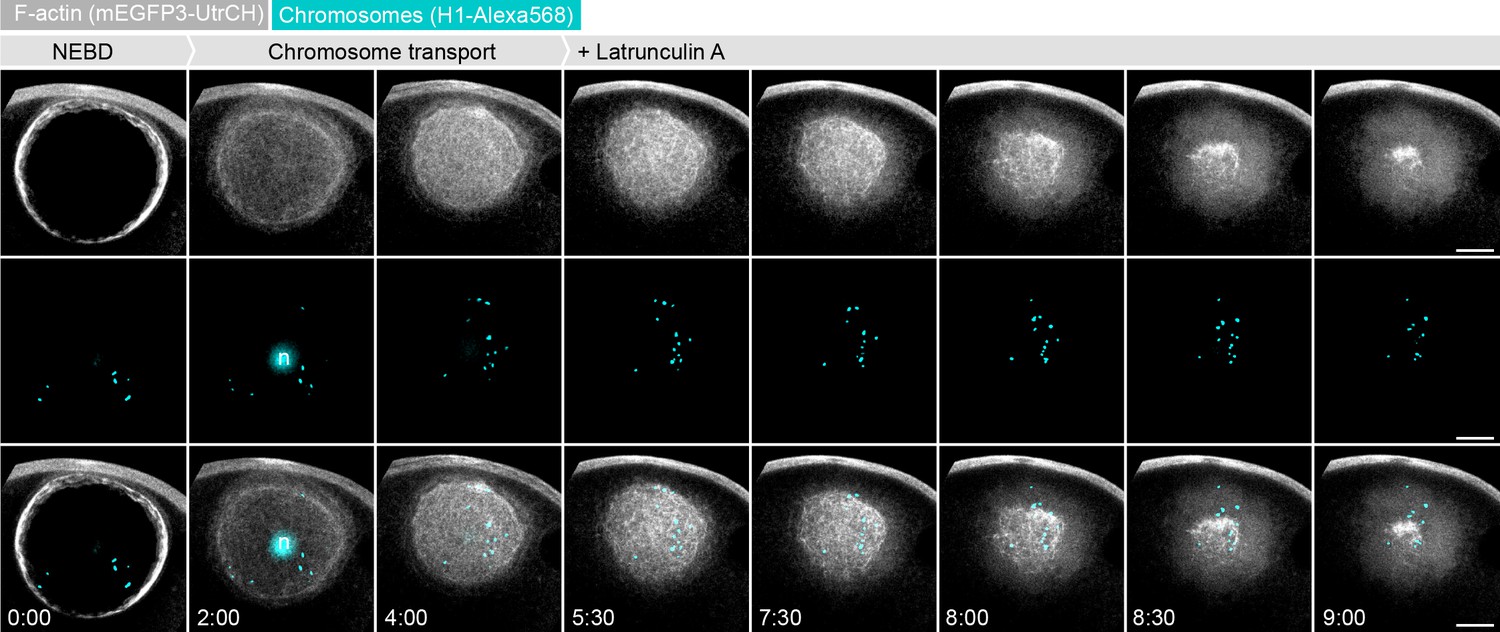
Enhancing filament disassembly by Latrunculin A leads to chromosome loss during contraction.
Maximum z-projections of selected time points through the nuclear region of oocytes expressing mEGFP3-UtrCH (gray) and injected with H1-AlexaFluor 568 to visualize chromosomes (cyan). Latrunculin A (2.5 μM) was added ~ 5:30 min after NEBD. n: nucleolus. Scale bar, 20 μm; time is given as mm:ss relative to NEBD.
Figure 8 with 1 supplement
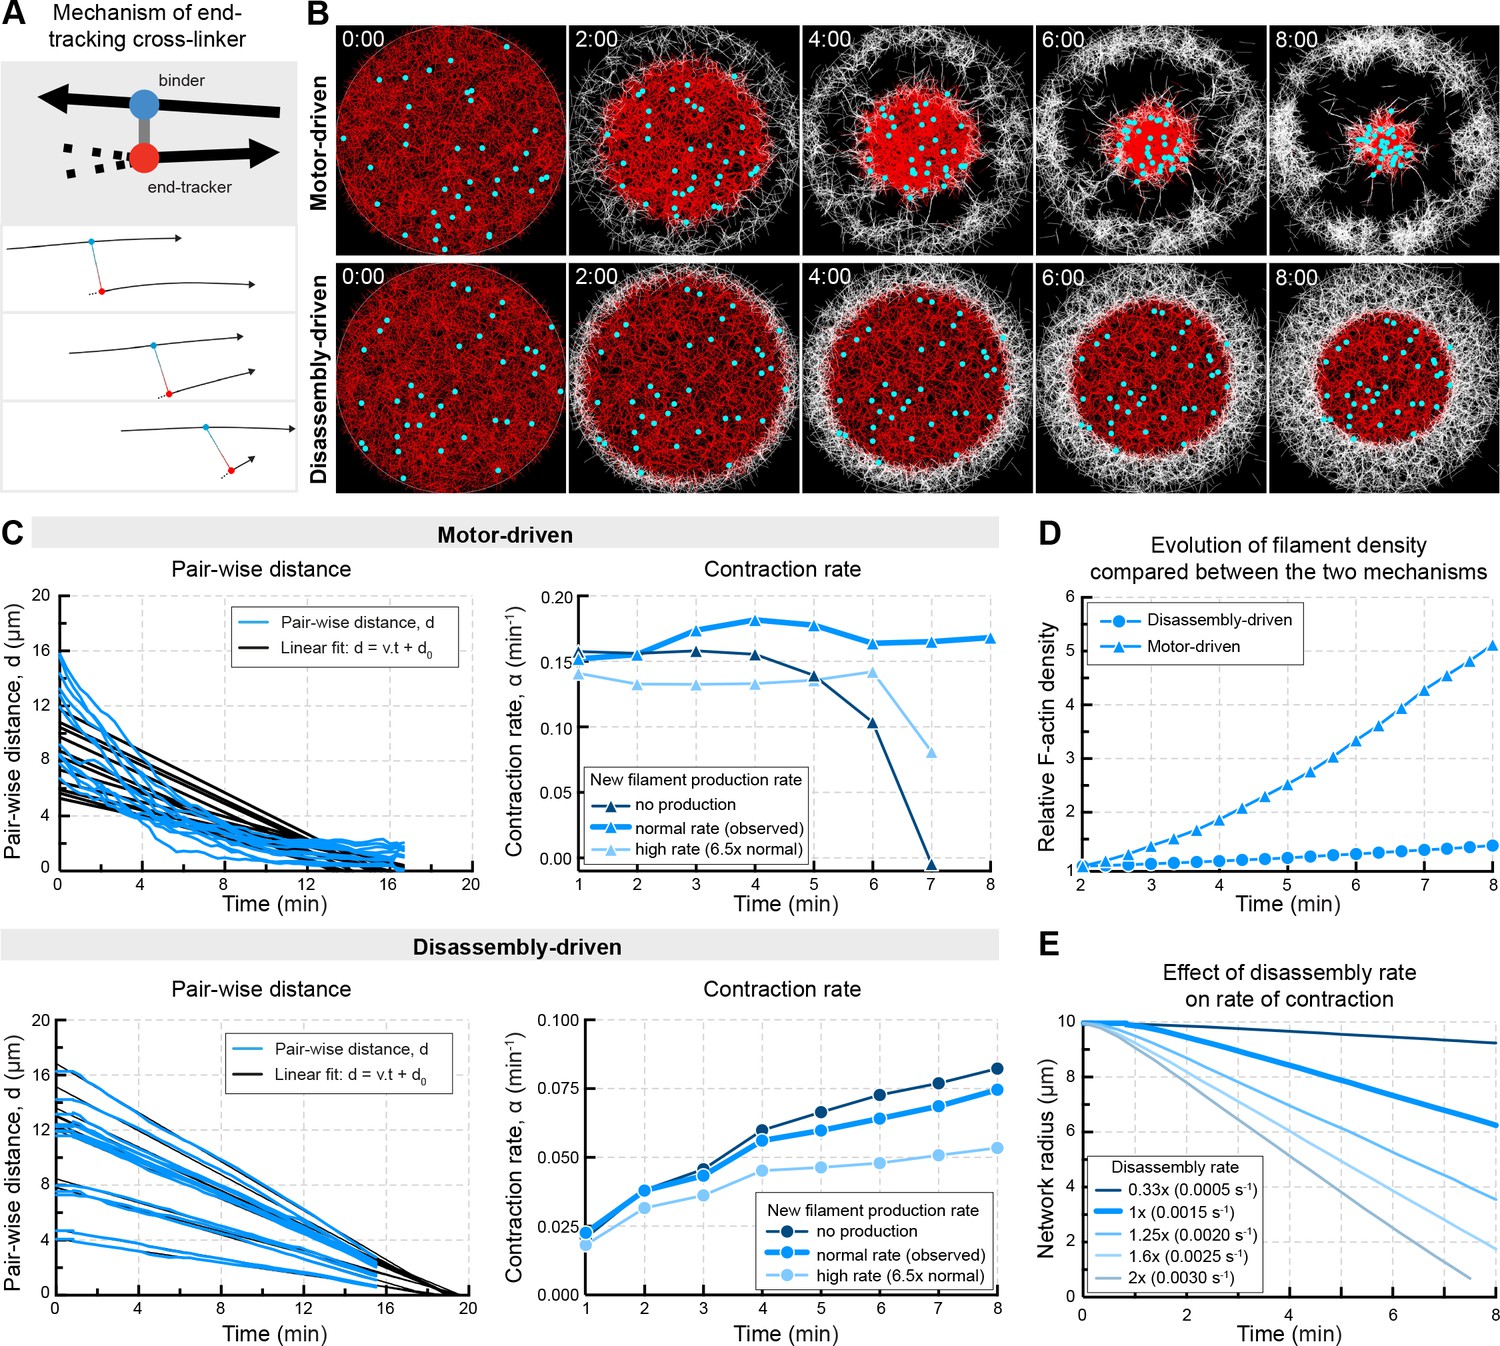
In silico reconstruction of a disassembly-driven contractile system.
(A) Top: schematic representation of the mechanism by a hypothetical end-tracking cross-linker serving as ‘depolymerization harnessing factor’. Bottom: zoom on two filaments linked by such end-tracking cross-linker as implemented in simulations in (B). The blue ‘head’ corresponds to a binder subunit, the red head binds and tracks the depolymerizing end. (B) Snapshots of 2D Cytosim simulations for motor- and disassembly-driven mechanisms. Simulations start with 5000 filaments (red) of a length of 1.5 μm and a disassembly rate of 0.0015 μm/s for all filaments. New filaments (white) are added at the boundary at a constant rate of 12 filaments per second. Chromosomes attached to the network are shown in cyan. (C) Left panels: plot of pair-wise distances of chromosomes, d versus time derived from simulations in (B). Right panels: Contraction rates calculated for 2 min intervals, similar to Figure 1E,F, for different rates of filament production. (D) Filament density derived from the simulations shown in (A). (E) The radius of the contracting ‘old’ network was extracted from simulations similar to that shown in (A) testing the effect of disassembly rates in the disassembly-driven mechanism.
Figure 8—figure supplement 1
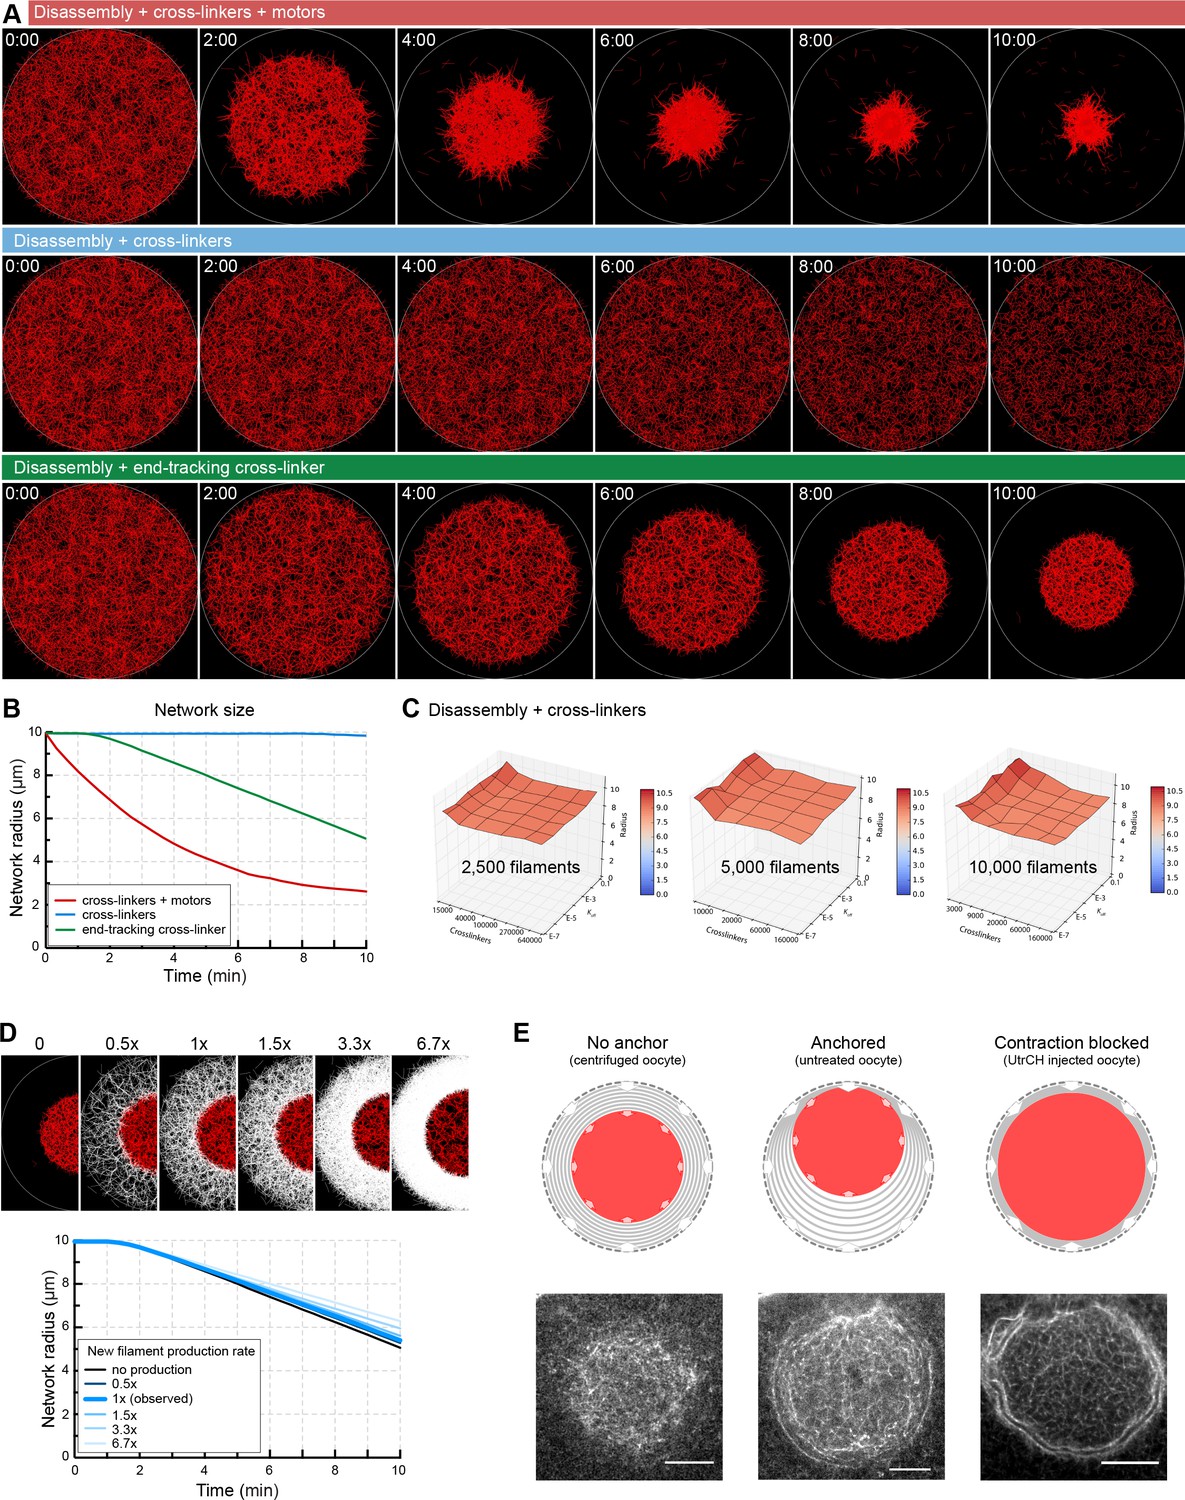
Network contraction is independent of the rate of filament production at the boundary.
(A) Selected snapshots of Cytosim simulations for different mechanisms of contraction. Actin filaments are shown in red. (B) Plot of the network radius over time for each simulation shown in (A). (C) Surface plots of the network radius after 10 min of simulation in the scenario with disassembly combined with cross-linkers only. Contraction is not observed for a wide range of cross-linker number, depolymerization rate (koff) and initial number of filaments. (D) Top: selected snapshots of contracting networks after 10 min of simulation for different rates of new filament production at boundary. Initial ‘old network’ in red, filaments of the new network in white. Bottom: the radius of the contracting network over time for different rates of filament production. (E) Filament production at the boundary and ‘old network’ contraction is balanced in centrifuged oocytes (no visible accumulation of filaments at the boundary of old and new network). When contraction and filament production is imbalanced either by stabilization (UtrCH) or by anchoring the network to the animal pole, accumulation of new filaments can be observed at the boundary of old and new networks, consistent with simulation results. Scale bar: 20 μm.
Figure 9
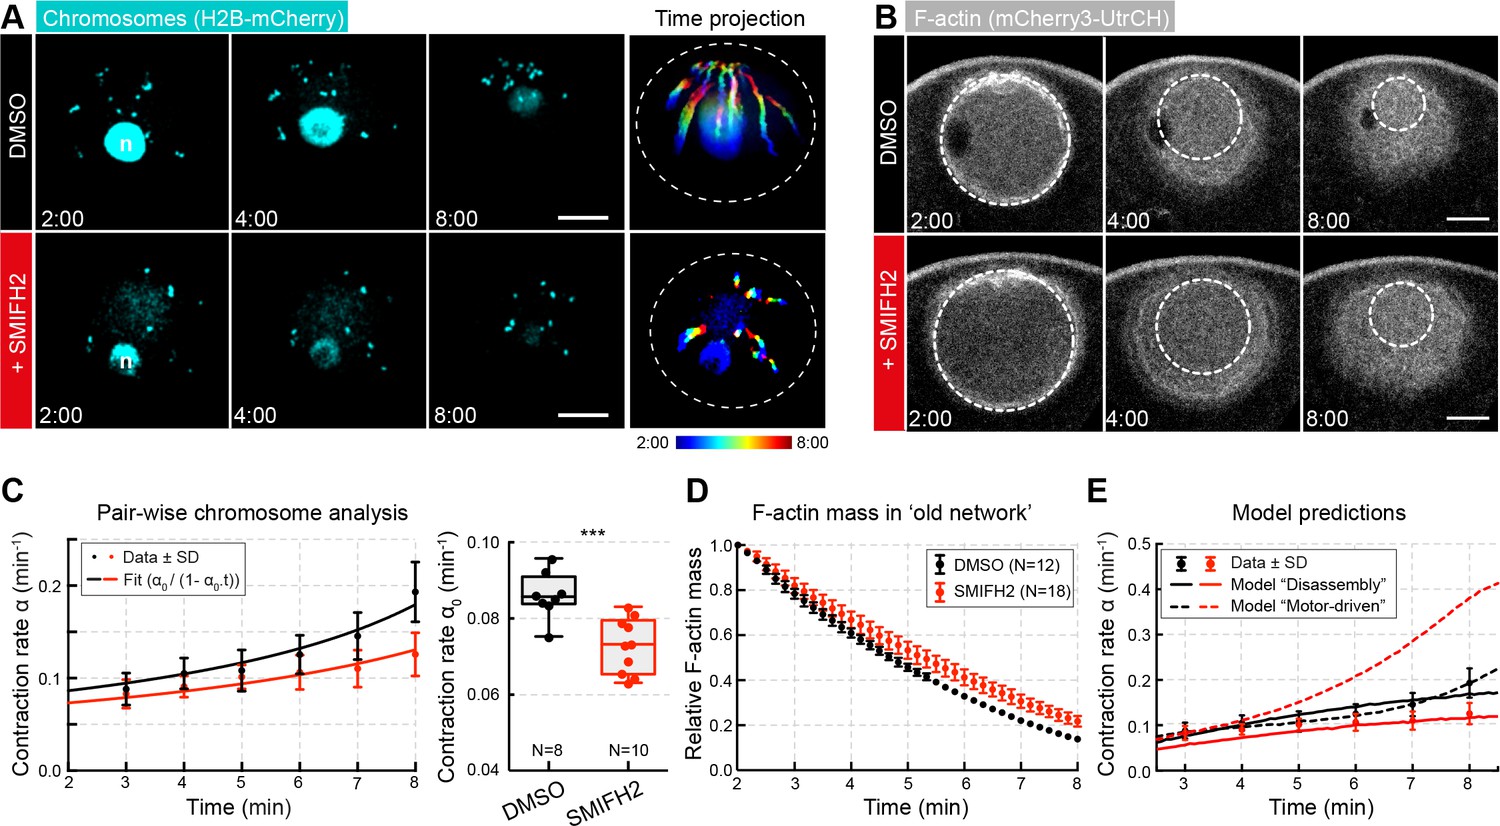
Inhibiting formin FH2 domain activity slows contraction.
(A) Maximum-intensity z-projection through the nuclear region of oocytes expressing H2B-mCherry (cyan), either incubated with DMSO or SMIFH2 (50 μM). Right: pseudocolored time projection of z-projections. Dashed circles outline the initial nuclear contour. Scale bar: 20 μm; time is given as mm:ss relative to NEBD. (B) Selected confocal sections through the nuclear regions of live oocytes expressing mCherry3-UtrCH. The extrapolated size of the old network shown by dashed circles is used for calculation of F-actin mass. (C) Left: contraction rate over time for each condition with fits for determining α0 as in Figure 1F. Right: box plots combined with dot plots of α0 for multiple oocytes. N indicates the number of oocytes. Mann-Whitney’s test, ***p<0.0005. Data collected from three independent experiments. (D) Quantification of F-actin mass in the old network calculated as in Figure 4A. (E) Fit of observed contraction rates to motor- and disassembly-driven models of contraction (dashed and continuous lines, respectively).
Videos
Video 1
Pulse labeling of the contracting F-actin network.
Oocyte expressing 3mEGFP-UtrCH (gray) was injected with phalloidin-AlexaFluor 568 to label the population of F-actin present at the time of injection. Scale bar: 20 μm.
Video 2
The response of the F-actin network to 3D laser ablation.
3D laser ablation was performed in oocytes expressing mCherry3-UtrCH without (left) or with recombinant UtrCH-AlexaFluor 568 nm (right) injection. Scale bar: 20 μm.
Video 3
Contraction of the F-actin network accelerates upon acute treatment with Latrucunlin A.
Oocytes expressing 3mEGFP-UtrCH to visualize F-actin were acutely treated either with DMSO (left) or Latrunculin A (right). Scale bar: 20 μm.
Video 4
Cytosim simulations of motor- and disassembly-driven mechanisms to generate contraction.
Simulations show production of filaments (gray) while initially present filaments (red) are contracting to transport chromosomes (cyan).
Tables
Table 1
Dimensionless viscoelastic parameters for untreated oocytes.
https://doi.org/10.7554/eLife.31469.011| Parameter name | Symbol | Model M | Model D |
|---|---|---|---|
| Elasticity | 2.1264 | 1.4778 | |
| Contractility | 1.1961 | 1.3082 | |
| Adhesion to boundary | ϵ | 0.6232 | 0.7838 |
| Strain relaxation factor | 9.5898 | 2.3754 | |
| Elastic power law exponent | 2 | 1 | |
| Contractile power law exponent | m | 2 | 1 |
| Viscous power law exponent | 1 | 1 |
Table 2
Disassembly rates k0 (min−1) and dispersion of F-actin length distributions.
https://doi.org/10.7554/eLife.31469.016| UtrCH-stabilized | Lat A-treated* | SMIFH2-treated | ||||||
|---|---|---|---|---|---|---|---|---|
| Control | Low | Medium | High | Control | Lat A | Control | SMIFH2 | |
| k0 | 0.162 | 0.126 | 0.073 | 0.048 | 0.0819 | 0.5106 | 0.1995 | 0.1650 |
| 0.677 | 0.889 | 6.946 | 709.4 | 0.0671 | 14.66 | 1.555 | 1.540 | |
-
*The solvent, DMSO had an effect on the viscolelastic parameters even in controls (Supplementary file 3).
Table 3
Contraction rates (min−1 ± S.D.) in response to increasing stabilization (UtrCH).
https://doi.org/10.7554/eLife.31469.017| UtrCH injection | ||||
|---|---|---|---|---|
| Control | Low | Medium | High | |
| Experiment | 0.0831 ± 0.012 | 0.0612 ± 0.011 | 0.0280 ± 0.006 | 0.0164 ± 0.005 |
| Model M | 0.0818 | 0.1821 | 0.2063 | 0.2133 |
| Model D | 0.0825 | 0.0586 | 0.0226 | 0.0117 |
Table 4
Contraction rates (min−1 ± S.D.) in response to SMIFH2 treatment.
https://doi.org/10.7554/eLife.31469.025| Control | SMIFH2 | |
|---|---|---|
| Experiment | 0.086 ± 0.006 | 0.073 ± 0.007 |
| Model M | 0.0859 | 0.1139 |
| Model D | 0.0848 | 0.0675 |
Key resources table
| Reagent type or resource | Designation | Source or reference |
|---|---|---|
| Biological sample | ||
| Patiria miniata | Patiria miniata | https://scbiomarine.com/ |
| Transfected construct | ||
| MRLC (Patiria miniata) | MRLC-mEGFP | doi:10.1038/s41467-017-00979-6 |
| H2B (human) | H2B-mCherry, H2B-3mEGFP | doi:10.1038/nmeth876 |
| Utrophin CH domain (human) | mEGFP3-UtrCH, 3mCherry-UtrCH | doi:10.1002/cm.20226 |
| myosinVb tail domain (mouse) | myosinVb-Tail | doi:10.1038/ncb2802 |
| Peptide, recombinant protein | ||
| Histone H1 (calf) | H1 | Merck |
| Utrophin CH domain (human) | UtrCH | doi:10.1002/cm.20226 |
| Commercial assay or kit | ||
| AmpliCap-Max T7 High Yield Message Maker | AmpliCap-Max T7 High Yield Message Maker | CellScript |
| Poly(A) tailing kit | Poly(A) tailing kit | CellScript |
| Gel filtration column PD-10 | Gel filtration | GE Healthcare |
| Ni-NTA resin | Ni-NTA resin | Qiagen |
| Vivaspin column 10,000 MW | Vivaspin column | Sartorius |
| Alexa Fluor 568 succinimidyl ester | Alexa Fluor 568 succinimidyl ester | Invitrogen |
| Alexa Fluor 488 succinimidyl ester | Alexa Fluor 488 succinimidyl ester | Invitrogen |
| Chemicals, drugs | ||
| DiIC16(3) | DiI | Invitrogen |
| 1-methyladenine | 1-MA | ACROS organics |
| Phalloidin-AlexaFluor 568 | Phalloidin-AlexaFluor 568 | Invitrogen |
| LatrunculinA | Lat A | Abcam |
| SMIFH2 | SMIFH2 | Tocris |
| Y-27632 | Y-27632 | Enzo Life Sciences |
| ML-7 | ML-7 | Tocris |
| Blebbistatin | BB | Abcam |
| Software, algorithm | ||
| Matlab | Matlab | Mathworks |
| Cytosim | Cytosim | doi:10.1088/1367-2630/9/11/427 |
Additional files
-
Supplementary file 1
Theory of the viscoelastic gel model for F-actin network.
- https://doi.org/10.7554/eLife.31469.026
-
Supplementary file 2
Dimensionless viscoelastic parameters for UtrCH injections.
- https://doi.org/10.7554/eLife.31469.027
-
Supplementary file 3
Dimensionless viscoelastic parameters for Latrunculin A treatments.
- https://doi.org/10.7554/eLife.31469.028
-
Supplementary file 4
Dimensionless viscoelastic parameters for SMIFH2 treatments.
- https://doi.org/10.7554/eLife.31469.029
-
Supplementary file 5
Cytosim configuration file to simulate a contracting F-actin network.
- https://doi.org/10.7554/eLife.31469.030
-
Supplementary file 6
Matlab scripts used to analyze chromosome tracks.
- https://doi.org/10.7554/eLife.31469.031
-
Transparent reporting form
- https://doi.org/10.7554/eLife.31469.032
Download links
A two-part list of links to download the article, or parts of the article, in various formats.
Downloads (link to download the article as PDF)
Open citations (links to open the citations from this article in various online reference manager services)
Cite this article (links to download the citations from this article in formats compatible with various reference manager tools)
A disassembly-driven mechanism explains F-actin-mediated chromosome transport in starfish oocytes
eLife 7:e31469.
https://doi.org/10.7554/eLife.31469


