Mutations in L-type amino acid transporter-2 support SLC7A8 as a novel gene involved in age-related hearing loss
- Meritxell Espino Guarch

- Mariona Font-Llitjós
- Silvia Murillo-Cuesta
- Ekaitz Errasti- Murugarren
- Adelaida M Celaya
- Giorgia Girotto
- Dragana Vuckovic
- Clara Vilches
- Susanna Bodoy
- Ignasi Sahún
- Laura González
- Esther Prat
- Antonio Zorzano
- Mara Dierssen
- Manuel Palacín
- Virginia Nunes
- Sidra Medical and Research Center, Qatar
- Molecular Genetics Laboratory - IDIBELL, Spain
- Institute for Research in Biomedicine (IRB Barcelona), The Barcelona Institute of Science and Technology, Spain
- Institute of Health Carlos III, Spain
- Alberto Sols Biomedical Research Institute (CSIC/UAM), Spain
- Hospital La Paz Institute for Health Research (IdiPAZ), Spain
- University of Trieste, Italy
- Institute for Maternal and Child Health – IRCCS “Burlo Garofolo”, Italy
- The Barcelona Institute of Science and Technology, Spain
- University of Barcelona, Spain
- Biomedical Research Networking Centre on Diabetes and Associated Metabolic Diseases (CIBERDEM), Spain
Figures
Figure 1 with 5 supplements
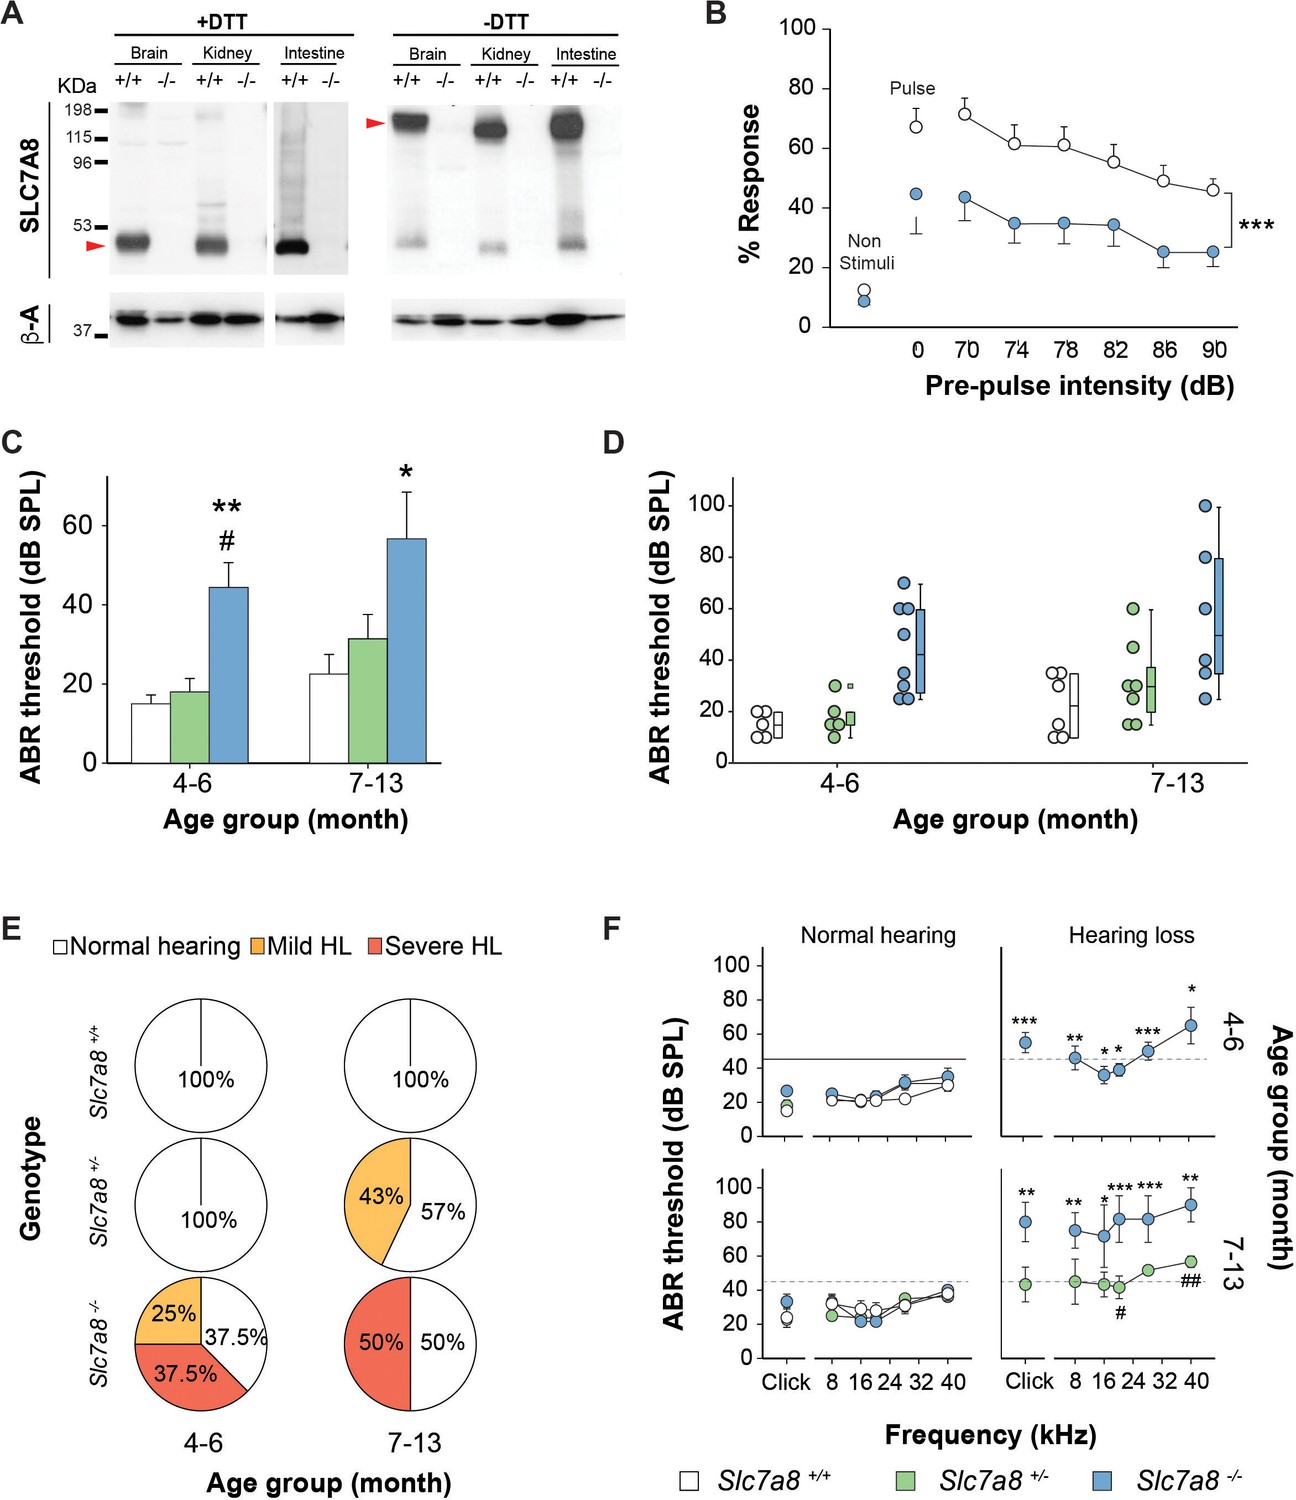
Hearing phenotype of C57BL6/J-129Sv Slc7a8 knockout mice.
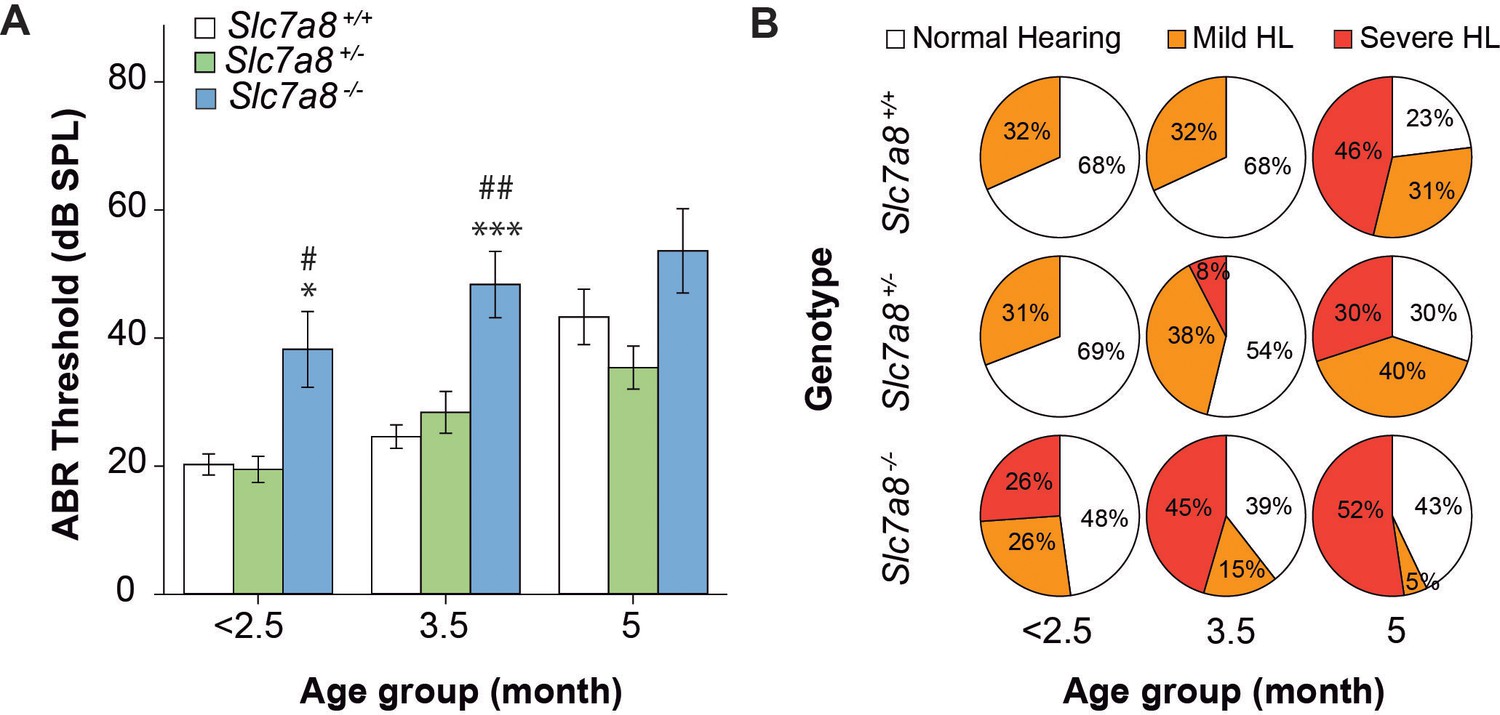
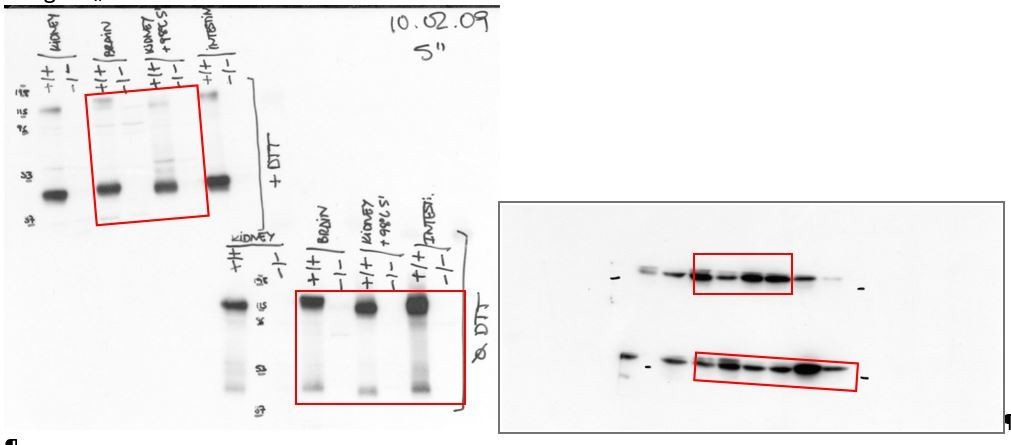
(A) Representative image of western bloting of total membranes from kidney, brain and intestine of wild-type (+/+) and Slc7a8 knock out (-/-) mice in the absence (-) or presence (+) of 100 mM dithiothreitol reducing agent (DTT) of three independent biological samples for both sexes (male and female). Protein (50 μg) were loaded in 7% acrylamide SDS-PAGE gel. Molecular mass standard (KDa) are indicated. Red arrows point SLC7A8/CD98hc heterodimer band as well as the light subunit SLC7A8. Upper panel: Rabbit anti-SLC7A8. Bottom panel: Mouse anti-βactin. (B) Pre-Pulse Inhibition of the acoustic startle response (PPI). Mean and SEM are represented. Pulse: 120 dB single pulse. Pre-pulse inhibition test: six different pre-pulse intensities (70 to 90 dB) in pseudo random order with 15 s inter-trial intervals. Wild type (white circles, n = 19) and Slc7a8 −/− (blue circles, n = 15) from 4- to 7-month-old are represented. Significant differences were determined using paired Student’s t-test, ***p<0.001 (C–F) Hearing phenotype in wild-type (Slc7a8+/+, white, n = 11), heterozygous (Slc7a8+/−, green, n = 12) and knockout (Slc7a8−/−, blue, n = 14) mice, grouped by age (4–6 and 7–13 month old). (C,D) Auditory Brainstem Response (ABR) threshold in response to click, expressed as mean ±standard error (C), individual value (scatter plot, (D) and median (boxplot, (D). The significance of the differences was evaluated using ANOVA test, *p<0.05, **p<0.01 (Slc7a8−/− versus Slc7a8+/+) and # p<0.05 (Slc7a8−/− versus Slc7a8+/−). (E) Pie plot showing the percentage of normal hearing (all thresholds <45 dB SPL, white) mice and mice with mild (at least two tone burst threshold >45 dB SPL, orange) and severe (at least two tone burst threshold >60 dB SPL, red) hearing loss (HL), within each genotype and age group. (F) ABR thresholds in response to click and tone burst stimuli (8, 16, 24, 32 and 40 kHz) in mice from three genotypes separated by age group and hearing phenotype (normal hearing or hearing loss). Significant differences were determined using ANOVA test, *p<0.05, **p<0.01, ***p<0.001 (hearing impaired Slc7a8−/− versus normal hearing Slc7a8+/+) and # p<0.05 (hearing impaired Slc7a8−/− versus Slc7a8+/−).
Figure 1—figure supplement 1
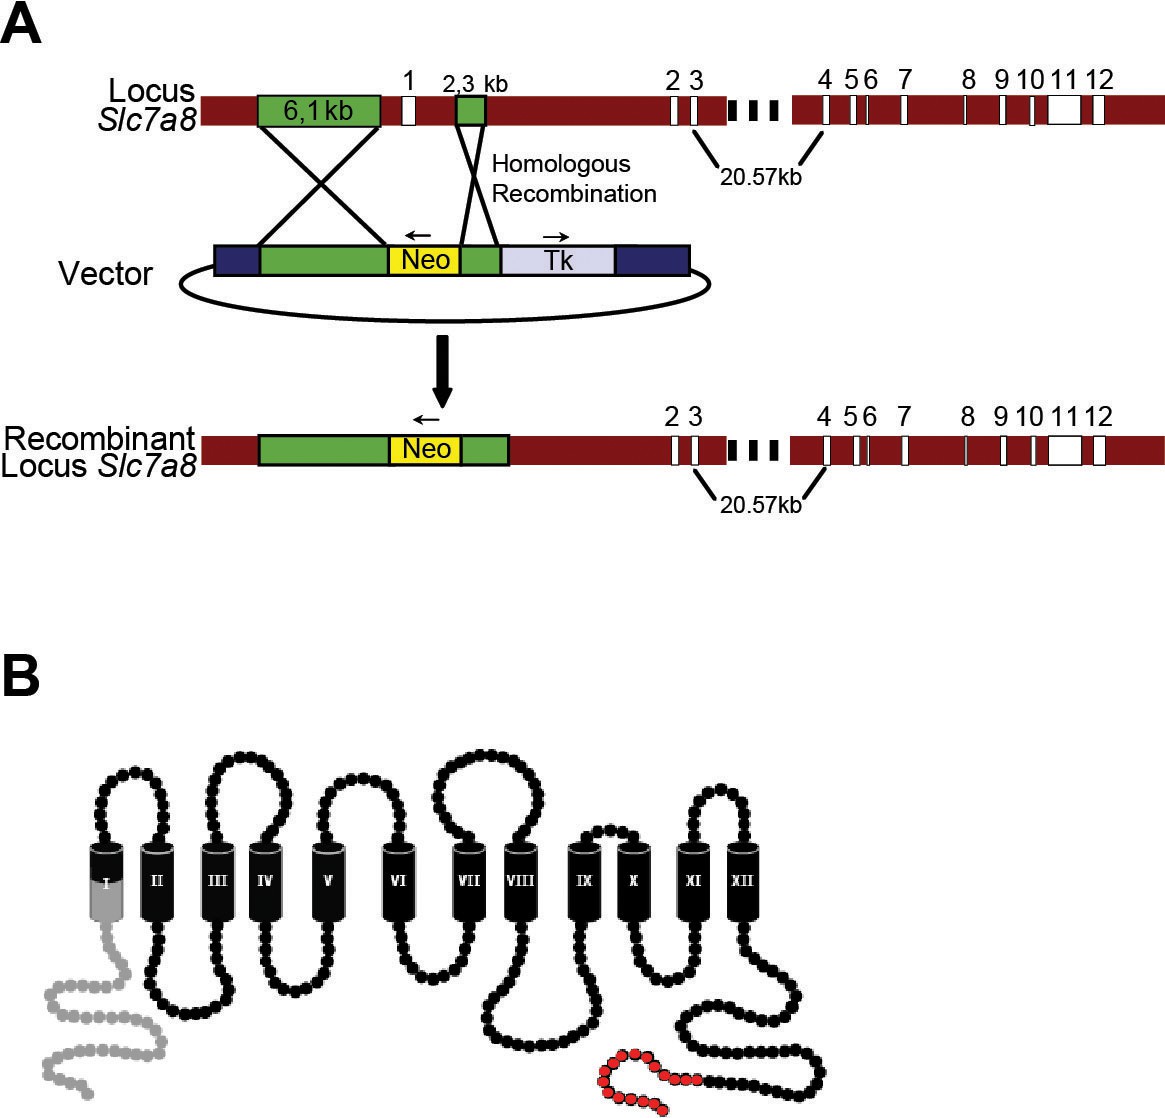
Scheme of Slc7a8 knockout mouse generation.
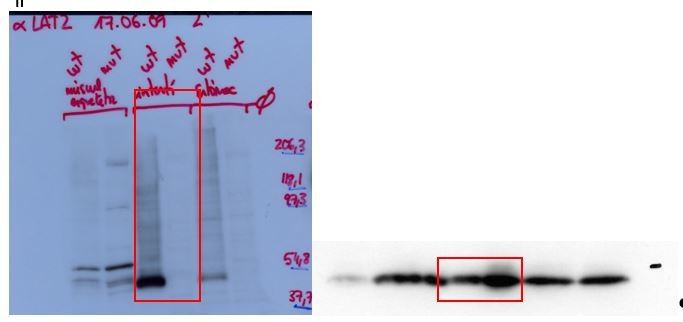
(A) Diagram of the homologous recombination in Slc7a8 locus, the vector used to replace the coding region of the gene for a neomycin (Neo) resistance and the resulting recombinant locus. (B) Scheme of LAT2 protein, in gray deleted region in the Slc7a8 −/− mouse and in red is represented the epitope which anti-SLC7A8 antibody was generated.
Figure 1—figure supplement 2
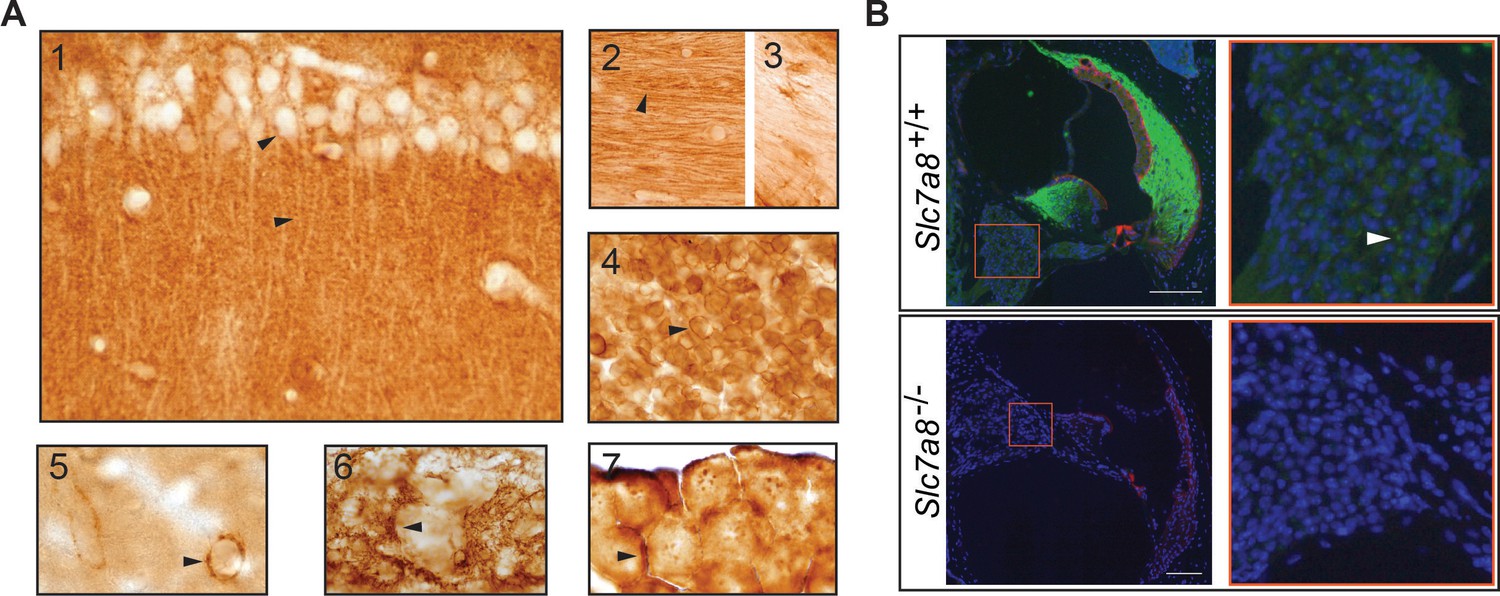
SLC7A8 expression in mouse brain.
(A) Wild-type mouse brain immunohistochemistry against SLC7A8 in wild type 4- to 7 months of age in mixed C57BL6/J-129Sv genetic background mice. Arrow is pointing SLC7A8 expression in cell membranes. (1) Cerebral cortex, SLC7A8 expression is localized to apical dendrites and synaptic area. (2 and 3) Preoptic Area. SLC7A8 expression in fibers. (4) Hypophysis. (5) Brain blood vessel. (6) Subfornical organ. (7) Choroid plexus. (B) Representative Image from the scan (Nanozoomer, Hamamatsu Photon) of the whole cochlea immunofluorescence. SLC7A8 (green), phalloidin (red) and DAPI (blue) markers of wild type (upper row) and Slc7a8−/− (bottom row) adult mice (4- to 7 months of age in mixed C57BL6/J-129Sv genetic background) are represented. The selected spiral ganglion areas (orange square) are magnified on the right, where white arrow points SLC7A8 signal in the spiral ganglia neurons that is specific as it fades completely in the Slc7a8−/− mice. Scale bar 100 μm.
Figure 1—figure supplement 3
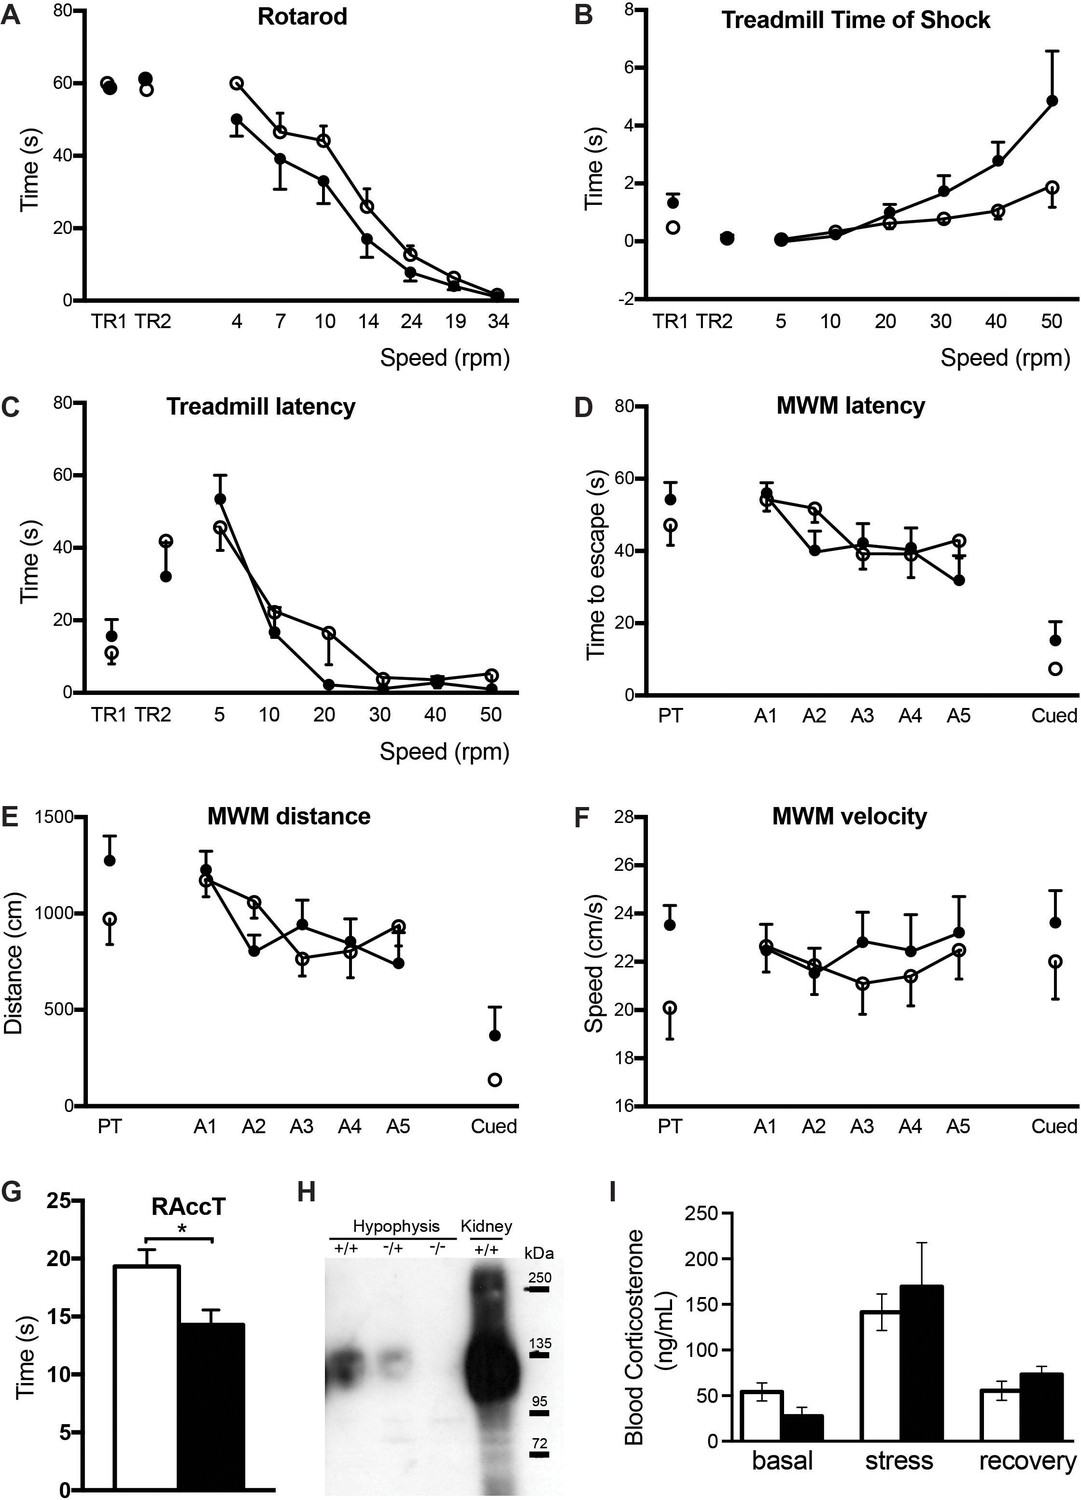
Behavior phenotype.
(A to G) Behavior tests data (mean ±SEM) of wild type (open circles) and Slc7a8−/− (black circles) mice of 4- to 7 months of age in mixed C57BL6/J-129Sv genetic background. (A) Latency to fall off the rod in the rotarod test at increasing fixed rotating speed (rpm) (n = 16 wild type and 14 Slc7a8−/−); (B and C) Time of exposure to shock in the treadmill test. Higher values indicate poorer performance (n = 8 wild type and 8 Slc7a8−/−). (D to F) Morris Water Maze (MWM) test of 5 wild type and 8 Slc7a8−/− mice. (G) Represents Rotarod Acceleration Time from 4 to 40 rpm in 60 s. Unpaired Student’s t-test statistical analysis, p-value: *, ≤0.05. (H) Western blot against SLC7A8 of 50 µg of total membranes from hypophysis of wild type (+/+), Slc7a8+/− (+/-) and Slc7a8−/− (-/-) mice. Kidney sample from wild-type mice was used as a positive control. Samples were loaded in 7% acrylamide SDS-PAGE gel in non-reducing conditions. SLC7A8/CD98hc heterodimers (120 kDa) were detected. (I) Plasma corticosterone levels after acute stress. Data (mean ±SEM) from four wild type (open bars) and 5 Slc7a8−/− mice (black bars) are represented. Basal: time 0, Stress: just after mice were exposed to a 15 min restraint stress and Recovery: 90 min after the stress.
Figure 1—figure supplement 4
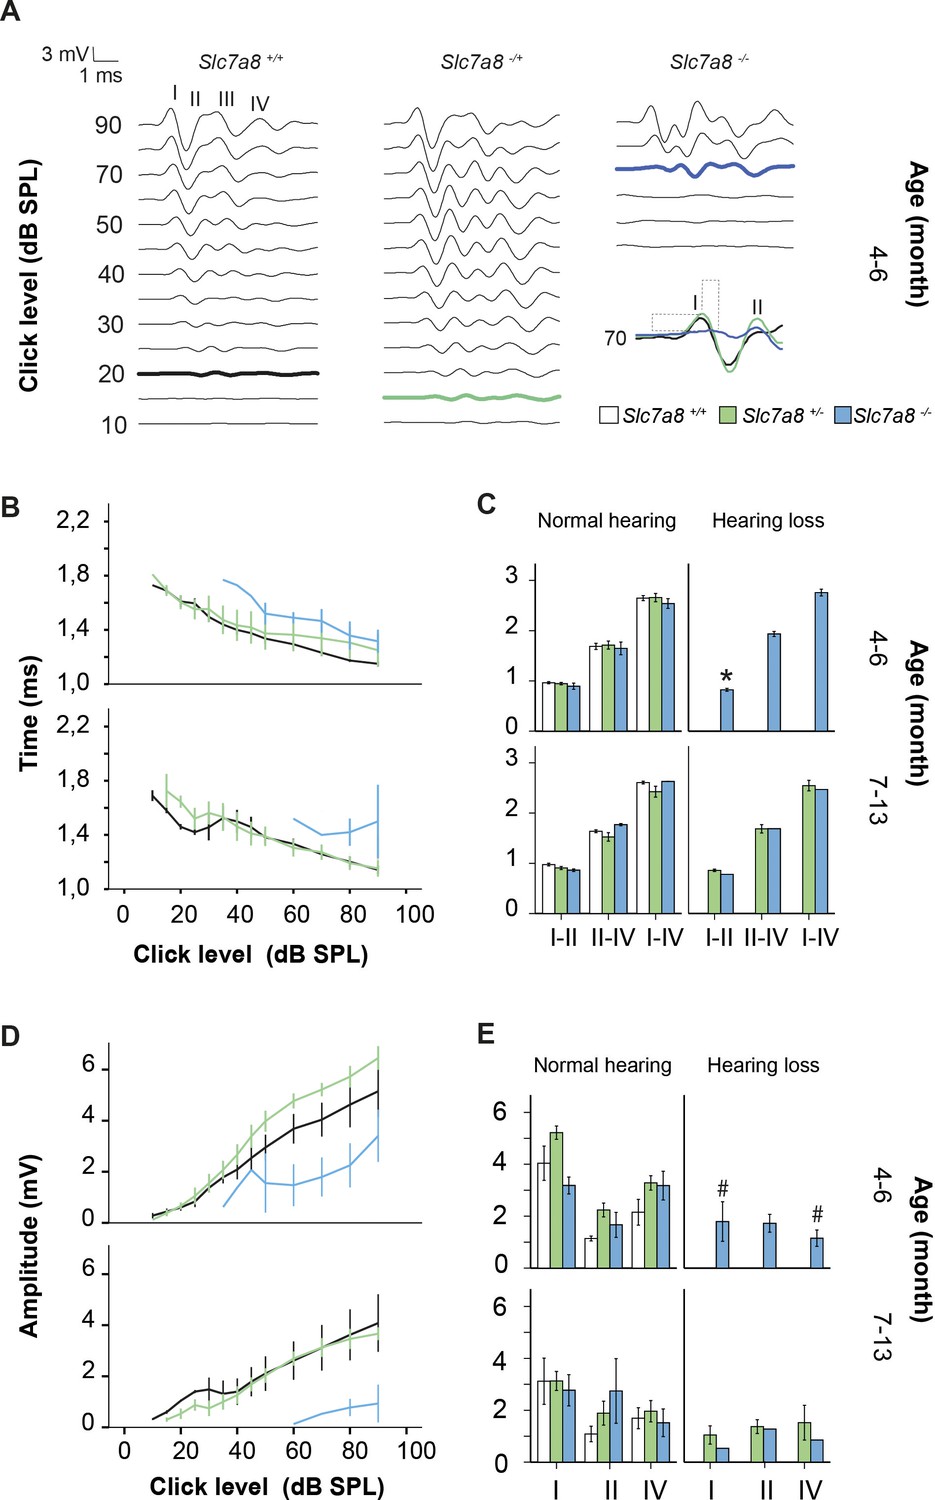
ABR latencies and amplitudes of C57BL6/J-129Sv Slc7a8 knockout mice.
(A) Representative ABR recordings in response to click at decreasing intensities from 90 to 10 dB SPL from wild type (Slc7a8+/+, white, n = 11), heterozygous (Slc7a8+/−, green, n = 12) and knockout (Slc7a8−/−, blue, n = 14) mice, grouped by age (4–6 and 7–13 month old). ABR waves I to IV are indicated and thresholds highlighted in bold. Detail of the first ms of the ABR recording in response to 70 dB SPL click showing the differences in the wave I latency and amplitude among genotypes (dashed lines). (B–E) Latency and amplitude of ABR waves, expressed as mean ±SE, in wild type (Slc7a8+/+, white, n = 14), heterozygous (Slc7a8+/−, green, n = 12) and knockout (Slc7a8−/−, blue, n = 11) separated by age group (4–6 and 7–13 month old) and hearing phenotype (normal hearing and hearing loss). (B) Latency-intensity curves for ABR wave I. (C) Interpeak latencies I-II, II-IV and I-IV in response to 70 dB SPL click. Significant differences were determined using ANOVA test, *p<0.05 (Slc7a8−/− versus Slc7a8+/+ mice). (D) Amplitude-intensity curves for ABR wave I. (E) Amplitudes of ABR wave I, II and IV. Significant differences were determined using ANOVA test, #p<0.05 (hearing loss Slc7a8−/− vs normal hearing Slc7a8+/−mice).
Figure 1—figure supplement 5
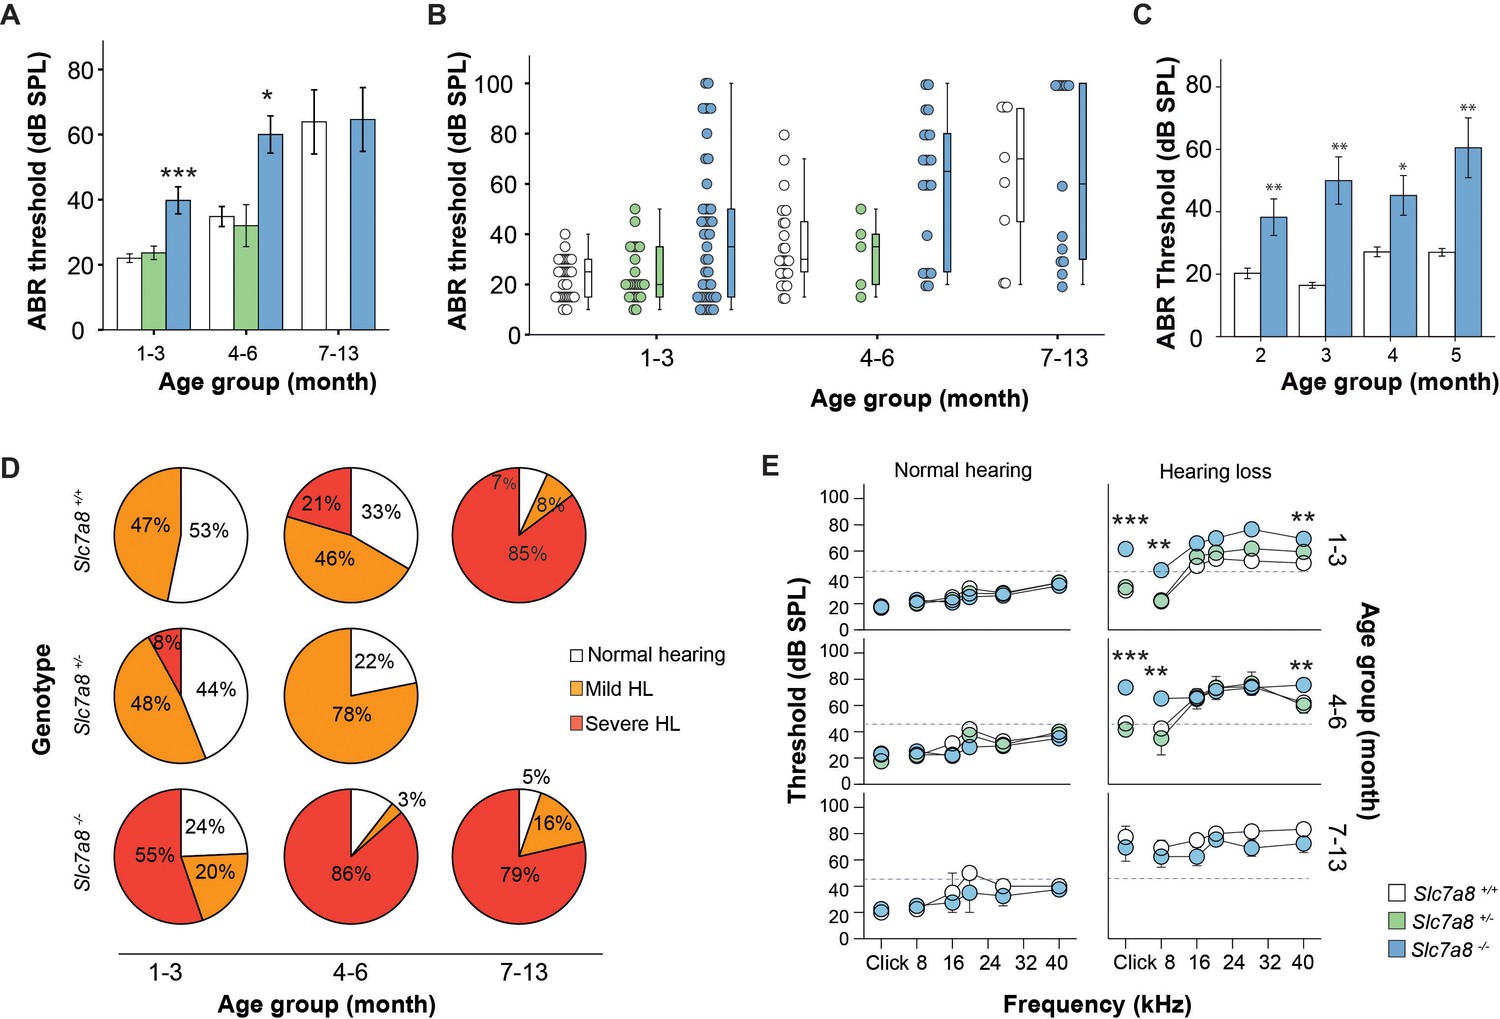
Hearing phenotype of C57BL/6J Slc7a8 knockout mice.
(A, B) Auditory Brainstem Response (ABR) thresholds in response to click stimuli in from wild type (Slc7a8+/+, white, n = 18), heterozygous (Slc7a8+/−, green, n = 5) and knockout (Slc7a8−/−, blue, n = 15) mice, grouped by age (1–3, 4–6 and 7–13 month-old) and expressed as mean ±standard error (A), individual value (scatter plot, B) and median (boxplot, B). The significance of the differences was evaluated using ANOVA test, *p<0.05 (Slc7a8−/−, vs Slc7a8+/+). (C) Auditory Brainstem Response (ABR) thresholds in response to click stimuli in from wild type (Slc7a8+/+, white, n = 18) and knockout (Slc7a8−/−, blue, n = 15) mice at 2-, 3-, 4- and 5-month life. (D) Pie chart showing the percentage of mice showing normal hearing (all thresholds < 45 dB SPL, white), mild hearing loss (at least two tone burst threshold >45 dB SPL, orange) and severe (at least two tone burst threshold >60 dB SPL, red) hearing loss (HL), within each genotype and age group. (E) ABR thresholds in response to click and tone burst stimuli (8, 16, 24, 32 and 40 kHz) in mice from three genotypes separated by age group and hearing phenotype (normal hearing or hearing loss). Significant differences were determined using ANOVA test, **p<0.01, ***p<0.001 (hearing impaired Slc7a8−/− versus Slc7a8+/+).
Figure 2 with 2 supplements
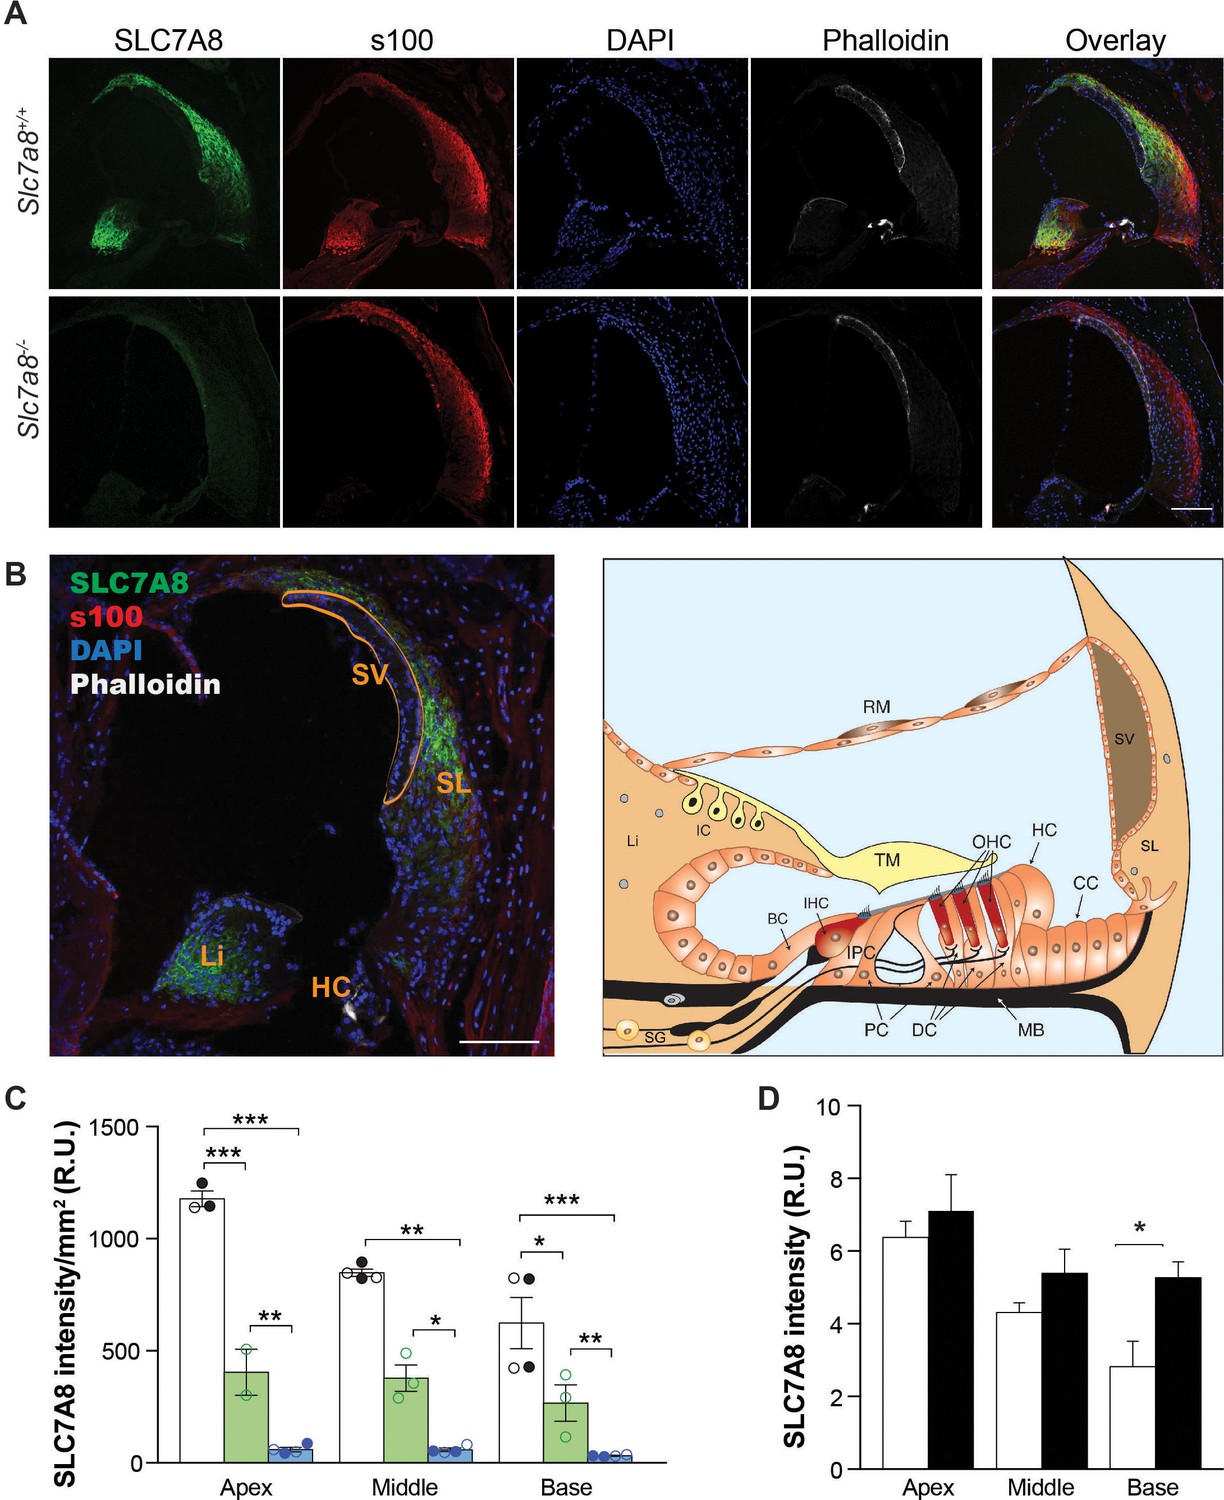
Immunolocalization of SLC7A8 in the mouse cochlea.
(A) Representative photomicrographs of cryosections of the base of the cochlea showing immunodetection for SLC7A8 (green) and s100 (red); and staining for DAPI (blue) or phalloidin (white) of wild type (upper row) and Slc7a8−/− mice (lower row). Scale bar, 100 µm. (B) On the left overlay image of a wild-type section indicating cochlea areas. Scale bar, 100 µm. On the right schematic drawing of the adult scala media adapted from Sanchez-Calderon et al. (2010). BC, border cells; CC, Claudius's cells; DC, Deiter's cells; HC, Hensen's cells; IC, intermediate cells; IHC, inner hair cells; IPC, inner phalangeal cells; Li, spiral limbus; MB, Basilar Membrane; OHC, outer hair cells; PC, pillar cells; RM, Reisner's membrane; SG, spiral ganglion; SL, spiral ligament; SV, stria vascularis; TM, tectorial membrane. (C) Quantification of SLC7A8 expression. Intensity of SLC7A8 immunofluorescence was normalized per mm2. Mean ±SEM from quadruplicates for each section, taken from apex, middle and basal cochlear turns of 4 wild-type (black), 3 Slc7a8+/− (green) and 4 Slc7a8−/− (blue) young (4- to 7-month-old) mice. Open and closed circles represent individual mice from C57BL6/J-129Sv or C57BL6/J backgrounds, respectevely. Unpaired Student’s t-test statistical analysis, p-values: *,≤0.05; **,≤0.01 and ***,≤0.001. (D) Quantification of SLC7A8 protein expression in the apex, middle and basal cochlear turns normalized per nuclei of young (2 month-old) (open bars) and old (12 month-old) (black bars) wild-type CBA mice. Data (mean ±SEM) were obtained from four cochlear sections obtained from three mice per group. Unpaired Student’s t-test statistical analysis, p-value: *,≤0.05.
Figure 2—figure supplement 1
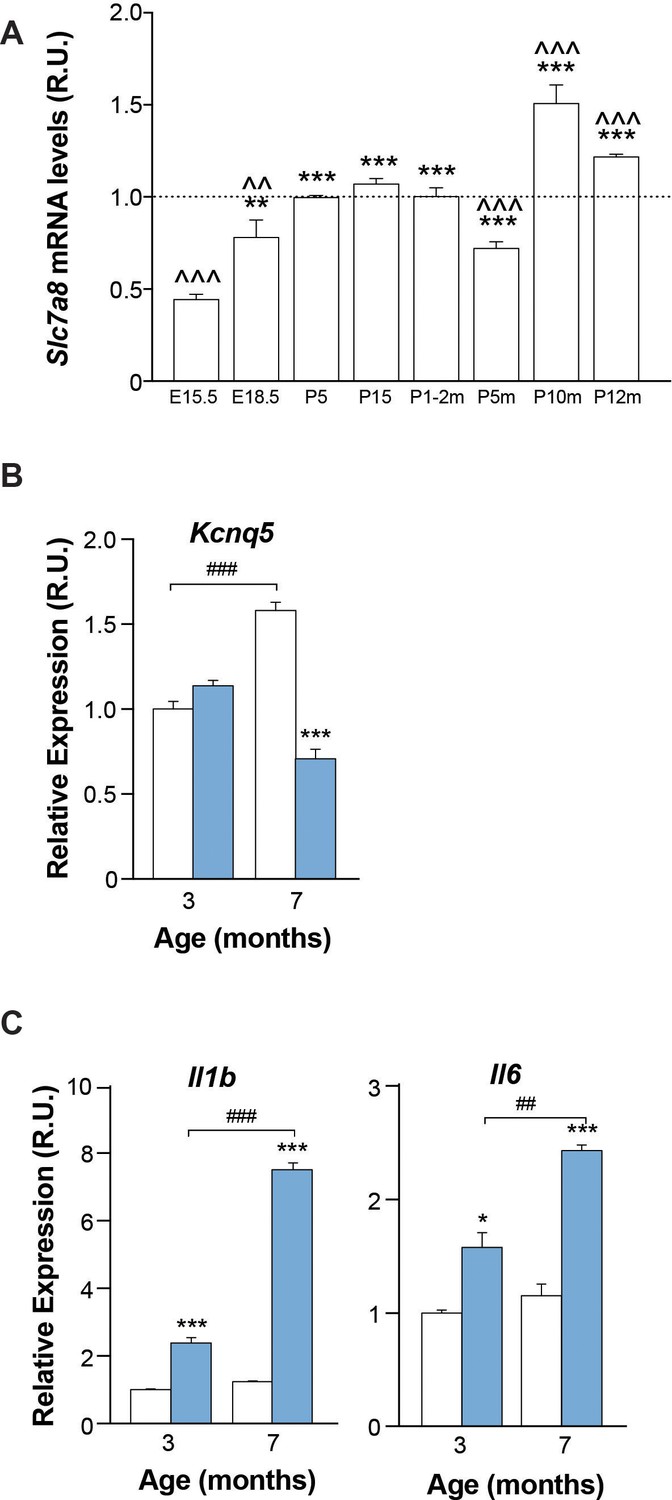
Quantification of transcripts in the Slc7a8−/− mouse cochlea.
(A) Slc7a8 mRNA expression in cochlea at different ages in mice in MF1/129Sv genetic background. Expression levels, normalized by Hrpt1 gene expression, are represented as n-fold relative to control group (1 to 2-month-old). Values are presented as mean ±SEM of triplicates from pooled sample of 3 mice per group. Unpaired Student’s t-test statistical analysis (*: E18.5 versus other groups. ^: 1–2 months versus other groups) p-values: *,^ p≤0.05; **,^^ p≤0.01; ***,^^^p≤0.001. (B and C) mRNA levels were determined by RT-qPCR in the cochlea of 3 wild-type and 3 Slc7a8−/− young (3 to 7-month-old) C57BL6/J mice run in triplicates. Data (mean ±SEM) correspond to relative value normalized with Rplp0 gene expression. Unpaired Student’s t-test statistical analysis, p-values: *,≤0.05, **, &&≤0.01, ***, &&&≤0.001 and ****, &&&&≤0.0001. (B) Potassium voltage-gated channel subfamily Q member 5 (Kcnq5), (C) interleukin-1 (Il1) and interleukin-6 (Il6).
Figure 2—figure supplement 2
Progression of hearing phenotype of C57BL/6J Slc7a8 knockout mice.
(A) Longitudinal analysis of Auditory Brainstem Response (ABR) thresholds in response to click stimuli in wild-type (Slc7a8+/+, white, n = 19), heterozygous (Slc7a8+/−, green, n = 13) and knockout (Slc7a8−/−, blue, n = 23) mice, through 2 to 5 months of age, and expressed as mean ±standard error. The significance of the differences was evaluated using ANOVA test, p<0.05 (Slc7a8−/− versus Slc7a8+/+ [*] or versus Slc7a8+/− [#]). (B) Pie chart showing the percentage of mice with normal hearing (all thresholds < 45 dB SPL, white), mild hearing loss (HL) (at least two tone burst threshold >45 dB SPL, orange) and severe HL (at least two tone burst threshold >60 dB SPL, red), within each genotype and age group.
Figure 3 with 1 supplement
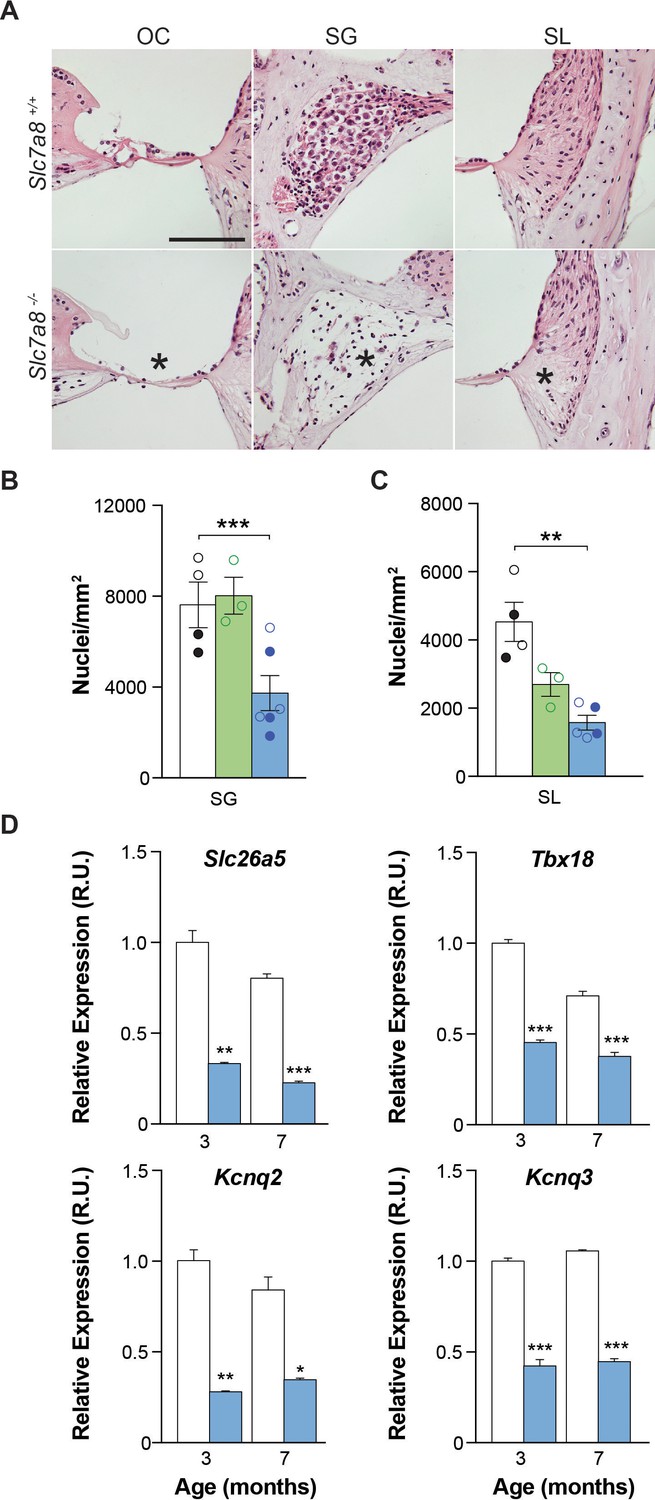
Cytoarchitecture of the Slc7a8−/− mouse cochlea.
(A) Hematoxylin and Eosin staining of the base of the cochlea. Representative photomicrographs taken from paraffin sections of wild-type and hipoacusic Slc7a8−/− mice. OC, Organ of Corti; SG, spiral ganglia region; and SL, spiral ligament. * Indicates loss of hair cells in the organ of Corti (first column), loss of neurons in the spiral ganglia (second column) and lower nuclei density in the spiral ligament (third column). Scale bar 100 μm. (B) Quantification of the number of neurons in the spiral ganglia (SG) in the basal turns of the cochlea. Y axis represents the mean nuclei quantification of 5 to 10 areas in SG. (C) Quantification of the number of nuclei in the spiral ligament (SL) of the basal turns of the cochlea by immunofluorescence using DAPI staining. For each sample, 12 overlaps of Z-stacks areas were used to quantify number of nuclei. Unpaired Student’s t-test statistical analysis: **, p≤0.01 (A to C) 4 wild-type (black), 3 Slc7a8+/− (green) and 4 Slc7a8−/− (blue) mice at 4 to 7-month-old are represented. Circles represent the average of the quadruplicate analysis performed in each mouse of C57BL6/J-129Sv (open) and C57BL6/J (filled) background. (D) Quantification of mRNA markers by RT-qPCR PCR. Cochlear gene expression of Slc26a5, Tbx18, Kcnq2 and Kcnq3 in the cochlea at 3-month-old and 7 months wild-type (white bars) and Slc7a8−/− (blue bars) C57BL6/J mice. Expression levels, normalized with Rplp0 gene expression, are represented as n-fold relative to control group. Values are presented as mean ±SEM of triplicates from pool samples of three mice per condition. Unpaired Student’s t-test statistical analysis, p-values: *p≤0.05; **p≤0.01; ***p≤0.001.
Figure 3—figure supplement 1
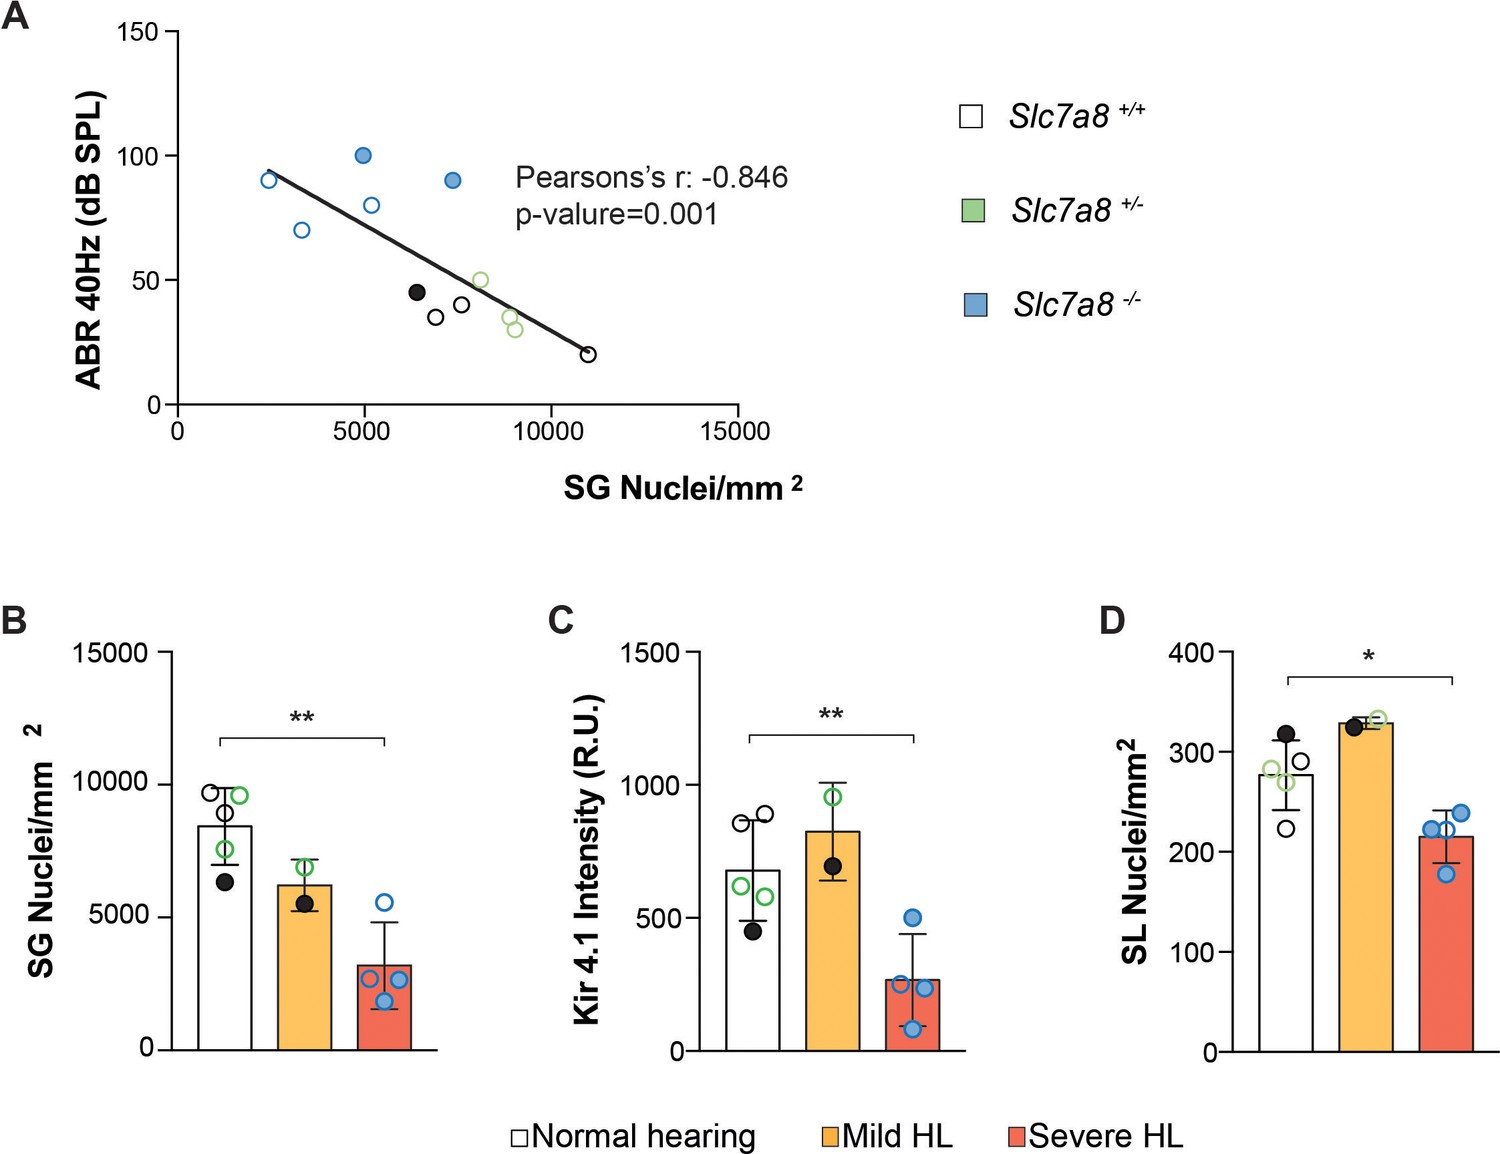
Correlations of the cell numbers and cell type biomarkers with HL phenotype.
(A) Pearson’s correlation (CI 95%) between ABR threshold and Spiral Ganglia (SG) nuclei number with a p-value of 0.001 is represented. (B–D) Individual mouse representation of SG nuclei number (B), Intensity of Kir4.1 marker (C) and number or fibrocytes in the spiral ligament (D) categorized by mouse phenotype: normal (open bars), mild (orange bars) and severe (red bars) hearing loss. Individual circles represent the average of the replicates for each analysis from wild-type (black bars), Slc7a8+/− (green bars) and Slc7a8−/− (blue bars) adult mice (4- to 7-month-old); either C57BL6/J-129Sv (open) or C57BL6/J (filled) backgrounds. Paired Student’s t-test statistical analysis, p-value: *,≤0.05 and **,≤0.01.
Figure 4 with 1 supplement
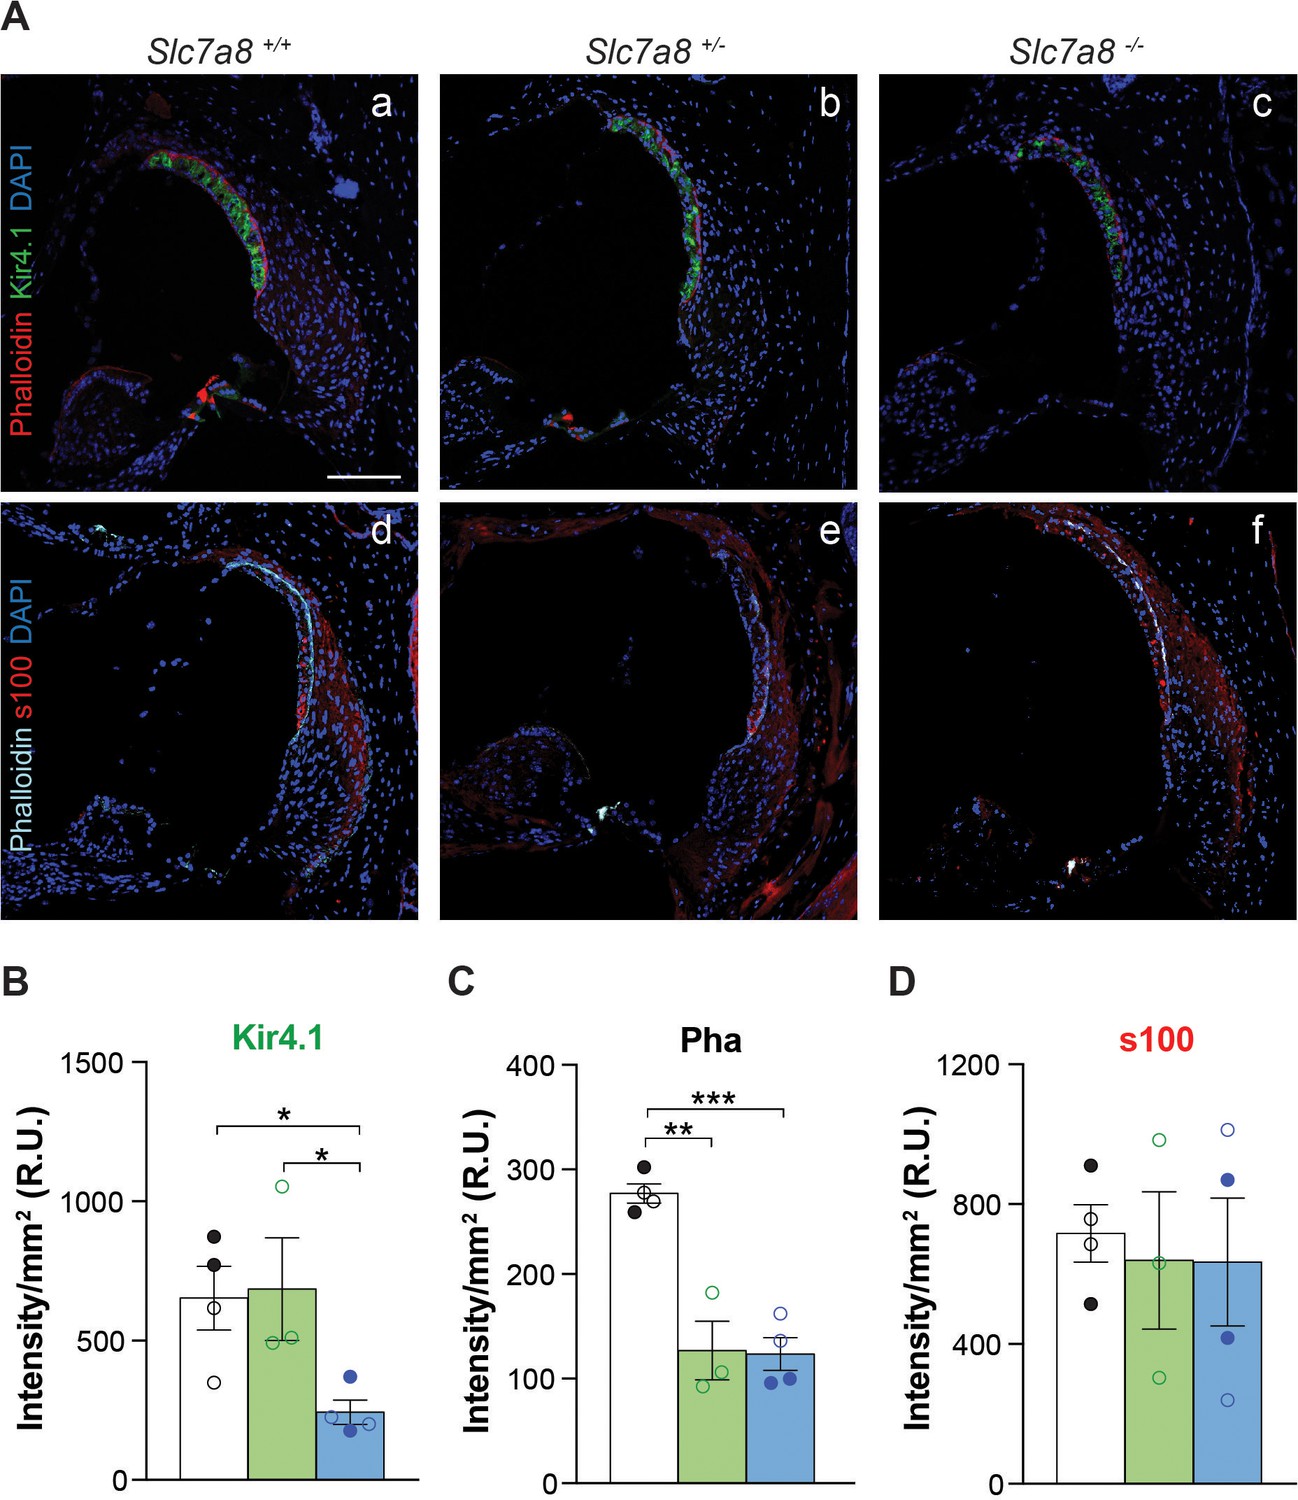
Immunofluorescence of cochlear markers in the Slc7a8−/− mouse.
(A) Representative photomicrographs of cryosections (10 μm) from the basal turn of the cochlea from wild type (1 and 4), Slc7a8+/− (2 and 5) and Slc7a8−/− (3 and 6) mice labeled for Kir4.1 (green), phalloidin (red) and DAPI (blue) (1 to 3), or for s100 (red), phalloidin (cyan) and DAPI (blue) (4 to 6). Scale bar, 100 µm. (B, C and D) Graph representing the quantification of Kir4.1, s100 and phalloidin (Pha) labeling intensity in the basal turn of the cochlea. Means ± SEM, normalized per mm2 of 4 wild type (black bars), 3 Slc7a8+/− (green bars) and 4 Slc7a8−/− (blue bars) young (4- to 7-month-old) mice are represented. Individual circles represent the average of the quadruplicate analysis of sections from each mice of either C57BL6/J-129Sv (open) or C57BL6/J (filled) backgrounds. Unpaired Student’s t-test statistical analysis, p-value: *,≤0.05.
Figure 4—figure supplement 1
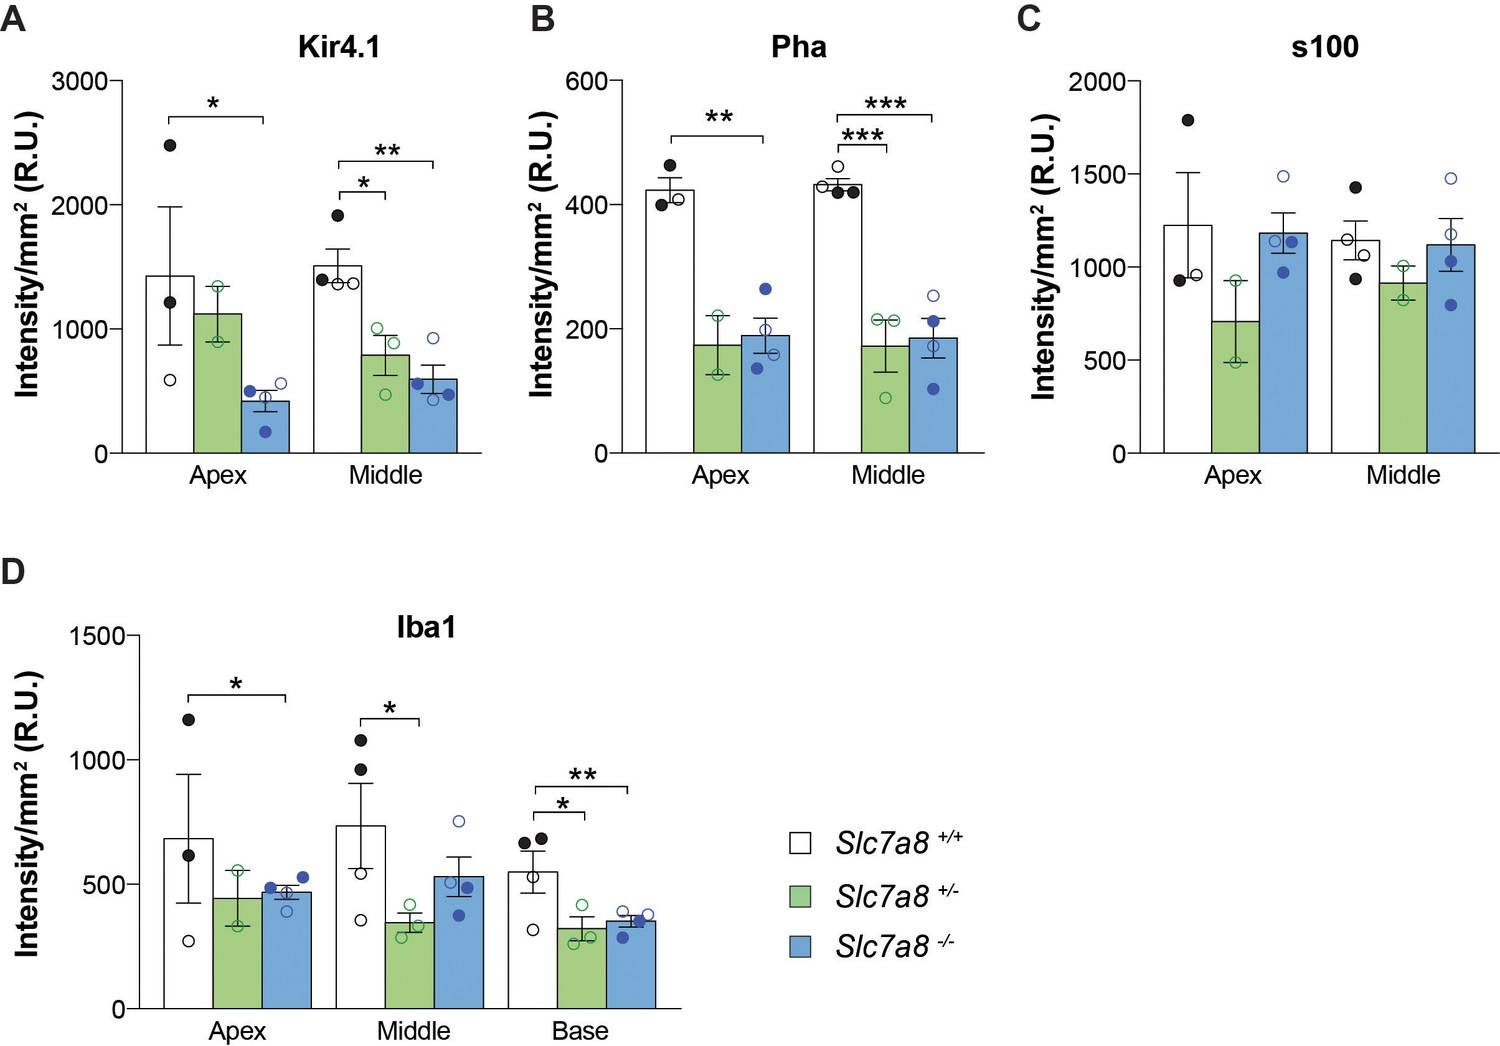
Quantification of the intensity of cell type biomarkers in apical and middle cochlear regions.
Quantification of immunofluorescence labeling normalized per mm2 of Kir4.1 (A), s100 (B), phalloidin (Pha) (C) and IBA1 (D) in apical, middle and basal turns cryosections of the cochlea. Mean ±SEM data were compiled from 3 to 4 wild type (black bars), 3 Slc7a8+/− (green bars) and 4 Slc7a8−/− (blue bars) adult (4- to 7-month-old) mice. Individual circles represent the average of the quadruplicate analysis of sections from mice of either C57BL6/J-129Sv (open) or C57BL6/J (filled) backgrounds. Unpaired Student’s t-test statistical analysis, p-value: *,≤0.05.
Figure 5 with 1 supplement

In vitro characterization of SLC7A8 mutants.
(A) Panel showing representative images of immunofluorescence of wild type and the indicated SLC7A8 mutants overexpressed in HeLa cells. Overlay of SLC7A8 (green), wheat germ agglutinin (WGA, membrane marker) (red) and the nuclear marker DAPI (blue) labeling. All SLC7A8 variants, except V460E, reached the plasma membrane. (B) Alanine (Ala) and tyrosine (Tyr) transport activity of human SLC7A8 wild type (WT) and mutants in transfected HeLa cells. SLC7A8 transport activity, corrected by SLC7A8-GFP expression, is presented as percentage of wild-type SLC7A8 transport activity. Data (mean ±SEM) corresponds to three independent experiments with quadruplicates. Mutants activity comparing with its, respectively, wild-type transport unpaired Student’s t-test statistical analysis is represented, p-values: *,≤0.05; **,≤0.01 and ***,≤0.001.
-
Figure 5—source data 1
Mutants expression and oligonucleotides for Site-Directed Mutagenesis (5’-3’).
Percentage of overexpressed mutated protein compared to the wild type (% Prot.).
- https://doi.org/10.7554/eLife.31511.019
Figure 5—figure supplement 1
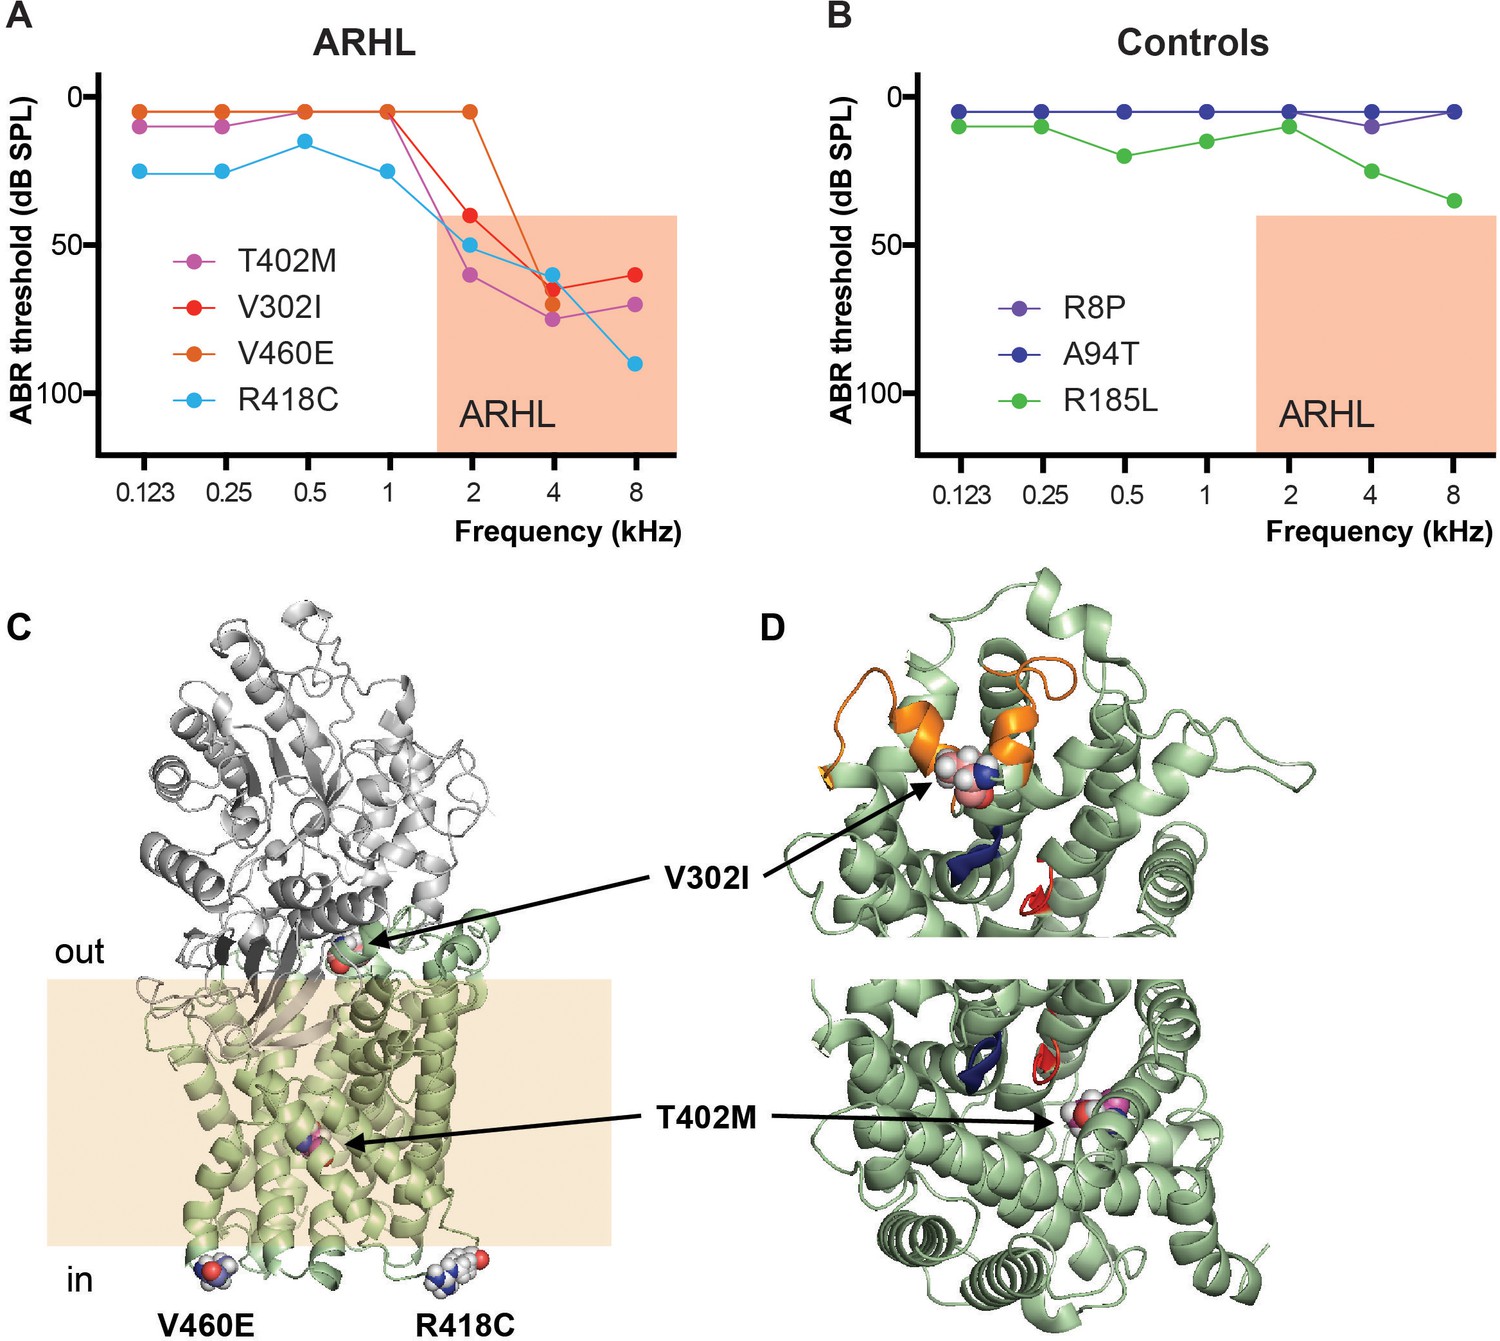
Audiogram of patients with ARHL and localization of the mutations in SLC7A8 protein.
(A and B) Graphs representing the pure-tone audiometry performed using standard audiometers in ARHL patients and controls carrying SLC7A8 mutations. The analysis of hearing functions was performed by determining the pure tone average of air conduction (PTA) at different frequencies: lower (0.125, 0.25 and 0.5 kHz), medium (1 and 2 kHz), and high (4, 8 kHz). Audiometry of the best hearing ear is shown for each individual. Salmon box indicates the inclusion criteria considered for ARHL phenotype. (A) ARHL cases (threshold >40 dB at PTA-H) and (B) Controls (threshold <25 dB at PTA-H). (C–D) Cartoon representation of the actual structural model of SLC7A8/CD98hc heterodimer. (C) The ectodomain of human CD98hc (gray) and human SLC7A8 (pale-green) in an outward-facing conformation are shown. The transmembrane (TM) domain of CD98hc is not shown because there is no structural information about its localization. Residues involved in sequence variants identified in patients with ARHL are highlighted (atoms represented by spheres). Atoms are colored according to: O (red), N (blue) and C-atoms depending on the residue (V302, pale-pink; T402, magenta; R418, gray and V460, slate-blue). The pale-yellow band is shown to visualize the insertion of SLC7A8 in the membrane. Residue R418 is located in the intracellular loop between TM domains 10 and 11, and residue V460 is located at the end of the TM domain 12, just before the intracellular C-terminus that is not depicted. (D) Top view close-up from outside the cell showing the localization of residues V302 and T402, respectively. To facilitate the view, the extracellular domain of CD98hc has been deleted. Unwound segments of TM domains 1 and 6 that interact with the α-amino-carboxyl end of the amino acid substrates are colored in blue and red respectively. Residue V302 is located in the extracellular loop 4 (EL4) (orange), which contains a double α helix structure that closes the substrate binding cavity in the inward-facing conformations. Residue T402 is located in TM domain 10 facing the substrate binding cavity.
Author response image 1
Author response image 2
Tables
Table 1
SLC7A8 Humans mutations found in ARHL and controls individuals.
https://doi.org/10.7554/eLife.31511.016| Phenotype | Age | Sex | Chr. 14 | Variant | Consequence | Code | Frequency | ||||
|---|---|---|---|---|---|---|---|---|---|---|---|
| Esp6500siv2 | 1000 g | Campion | ExAC | Studied cohort | |||||||
| ARHL | 75 | Female | 23597290 | 14:23597291 C / T | p.Val460Glu | V460E | NA | NA | 0.0013 | 0.00002475 | 0.015 |
| ARHL | 57 | Male | 23598917 | 14:23598917 G / A | p.Thr402Met | T402M | NA | NA | 0.0047 | 0.00002471 | 0.015 |
| ARHL | 75 | Male | 23608641 | 14:23608641 C / T (rs142951280) | p.Val302Ile | V302I | 0.0005 | NA | 0.0047 | 0.0004613 | 0.015 |
| ARHL | 86 | Female | 23598870 | 14:23598869 C / T | p.Arg418His | R418C | 0.0005 | NA | 0.002 | 0.00002477 | 0.015 |
| control | 50 | Male | 23652101 | 14:23652101 C / G (rs141772308) | p.Arg8Pro | R8P | 0.0008 | NA | 0.0013 | 0.0008156 | 0.012 |
| control | 50 | Male | 23635621 | 14:23635621 C / T (rs139927895) | p.Ala94Thr | A94T | 0.0012 | 0.002 | 0.0013 | 0.00202 | 0.012 |
| control | 90 | Female | 23612368 | 14:23612368 C / T (rs149245114) | p.Arg185Gln | R185L | NA | NA | 0.002 | 0.00002471 | 0.012 |
-
ARHL (age-related hearing loss). The age (years) of the subject when the Audiogram was performed is indicated. Variant [CHR: position reference/alternate (dbSNP135rsID)]. Consequence [HGUS annotation (protein change)]. Code [short description of the alternate variant]. Frequency of the mutations: Esp6500siv2 (NHLBI Exome Sequencing Project), 1000 g (1000 Genomes Project), Campion (The Allele Frequency Net Database) and ExAC (The Exome Aggregation Consortium).
Table 2
Key resources table.
https://doi.org/10.7554/eLife.31511.020| Reagent type (species) or resource | Designation | Source or reference | Identifiers | Additional information |
|---|---|---|---|---|
| Antibody | SLC7A8 antibody | Custom made | NA | Anti-Rabbit peptide sequence: PIFKPTPVKDPDSEEQP WB: 1:1000, IHC: 1/5000 and IF:1/200 |
| s100 | Sigma-Aldrich | Ref: S2532 | IF: 1/1000 | |
| Kir4.1 | Merck Millipore | Ref: AB5818 | IF: 1/200 | |
| BA1 | Abcam | Ref: ab5076 | IF: 1/200 | |
| Phalloidin | Thermo Fisher Scientific | Ref: A22287 | IF: 1/100 | |
| Donkey anti-Goat Alexa Fluor 546 | Thermo Fisher Scientific | Ref: A-11056 | IF: 1/300 | |
| Donkey anti-Rabbit Alexa Fluor 488 | Thermo Fisher Scientific | Ref: A-21206 | IF: 1/300 | |
| Goat anti-Mouse Alexa Fluor 546 | Thermo Fisher Scientific | Ref: A-11030 | IF: 1/300 | |
| Goat anti-Rabbit Alexa Fluor 488 | Thermo Fisher Scientific | Ref: A-11034 | IF: 1/300 | |
| WGA | Thermo Fisher Scientific | Ref: W21405 | labeled with Texas-Red IF: 1 mg/mL | |
| Anti-Strep Tag GT517 | Abcam | Ref: ab184224 | IF: 1/100 | |
| Goat-anti-mouse-FITC | Abcam | Ref: ab6785 | IF: 1/300 | |
| Behavior | Rotarod | Panlab | Ref:LE8500 | |
| Treadmill | Panlab | E8710MTS | ||
| Morris water maze | Panlab | SMART camera | circular tank (150 cm diameter, 100 cm high) | |
| PPI | Panlab | LE116 | ||
| Restrain stressor | Lab Research | Ref:G05 | ||
| ABR | Tucker Davis Technologies TDT | System 3 Evoked | ||
| Mouse | C57BL6/J wild type | Harlam | Ref: 057 | C57BL/6JOlaHsd |
| C57BL6/J wild type | Jackson laboratory | Ref: 000664/Black | ||
| Slc7a8-/- chimera | Genoway | Customized Model Development | Strategy Figure 1—figure supplement 1 | |
| Cell Line | HeLa | Sigma Aldrich | Ref: 93021013 | |
| Chemical compound, drug | DTT dithiothreitol | SigmaAldrich | Ref:D9779 | |
| L- [3H]-labeled alanine | Perkin Elmer | Ref: NET348250UC | 1 μCi/ml | |
| [3 hr]-tyrosine | Perkin Elmer | Ref: NET127250UC | 1 μCi/ml | |
| Commercial assay or kit | Pierce BCA Protein Assay Kit | Thermo Scientific | Ref:23225 | |
| ECL | GE Healthcare | Ref:RPN2232 | ||
| Corticosterone EIA kit | Enzo | Ref:ADI900097 | ||
| A + B conjugate | Vectastain | Ref: ABC kit | ||
| Rneasy | Qiagen | Ref: 74104 | ||
| High-capacity cDNA Reverse Transcription Kit | Applied Biosystems | Ref: 4368813 | ||
| TaqMan Gene Expression Assay | Applied Biosystems | potassium voltage-gated channel subfamily Q member 2 (Kcnq2) Mm00440080_m1; potassium voltage-gated channel subfamily Q member 3 (Kcnq3) Mm00548884_m1; potassium voltage-gated channel subfamily Q member 5 (Kcnq5) Mm01226041_m1; prestin (Slc26a5) Mm00446145_m1; T-box transcription factor TBX18 (Tbx18) Mm00470177_m1; interleukin one beta (Il1b) Mm00434228m1; interleukin 6 (Il6) Mm00446190m1; solute carrier family 7 (cationic amino acid transporter, y + system), member 8 (Slc7a8) Mm01318971m1 | ||
| QuikChange site-directed mutagenesis kit | Stratagene | Ref: 200524 | ||
| Gene (human) | SLC7A8 | NCBI | NM_012244.3 | Protein NP_036376.2 (535AA) |
| Slc7a8 | NCBI | NM_016972.2 | Protein NP_058668.1 (531AA) | |
| Sequence-based reagent | whole genome sequence | Illumina | HiSeq 2000 | Data coverage was ranging from 4 to 10X |
| Sanger sequencing | Life Technologies | 3500 Dx Genetic Analyzer | ||
| BigDye | Life Technologies | ABI PRISM 3.1 Big Dye terminator | ||
| Software, algorithm | BioSig | Tucker Davis Technologies TDT | NA | |
| Graph Pad Software | GraphPad Software, Inc | Prism 4 | https://www.graphpad.com/scientific-software/prism/ | |
| SeqMan Pro software | DNAstar | https://www.dnastar.com/t-seqmanpro.aspx | sequencing assembly and analysis | |
| Annotations tools | ANNOVAR | http://annovar.openbioinformatics.org/en/latest/ | functional annotation of genetic variants DOI:10.1093 | |
| Genome Research | Bcftools | http://samtools.github.io/bcftools/ | ||
| SPSS 23.0 statistic software package | IBM | NA | https://www.ibm.com/analytics/data-science/predictive-analytics/spss-statistical-software | |
| Transfected construct | Slc7a8 construct | Agilent | Catalog #212205 | Resistances: Neomycin and thymidine kinase |
| pcDNA3.1-StrepTag | ThermoFisher | Ref: V79020 | fused SLC7A8 or SLC3A2 | |
Additional files
-
Transparent reporting form
- https://doi.org/10.7554/eLife.31511.021
Download links
A two-part list of links to download the article, or parts of the article, in various formats.
Downloads (link to download the article as PDF)
Open citations (links to open the citations from this article in various online reference manager services)
Cite this article (links to download the citations from this article in formats compatible with various reference manager tools)
Mutations in L-type amino acid transporter-2 support SLC7A8 as a novel gene involved in age-related hearing loss
eLife 7:e31511.
https://doi.org/10.7554/eLife.31511


