A selective role for ventromedial subthalamic nucleus in inhibitory control
- University of Pittsburgh, United States
- CNRS UMR 5229, France
Figures
Figure 1
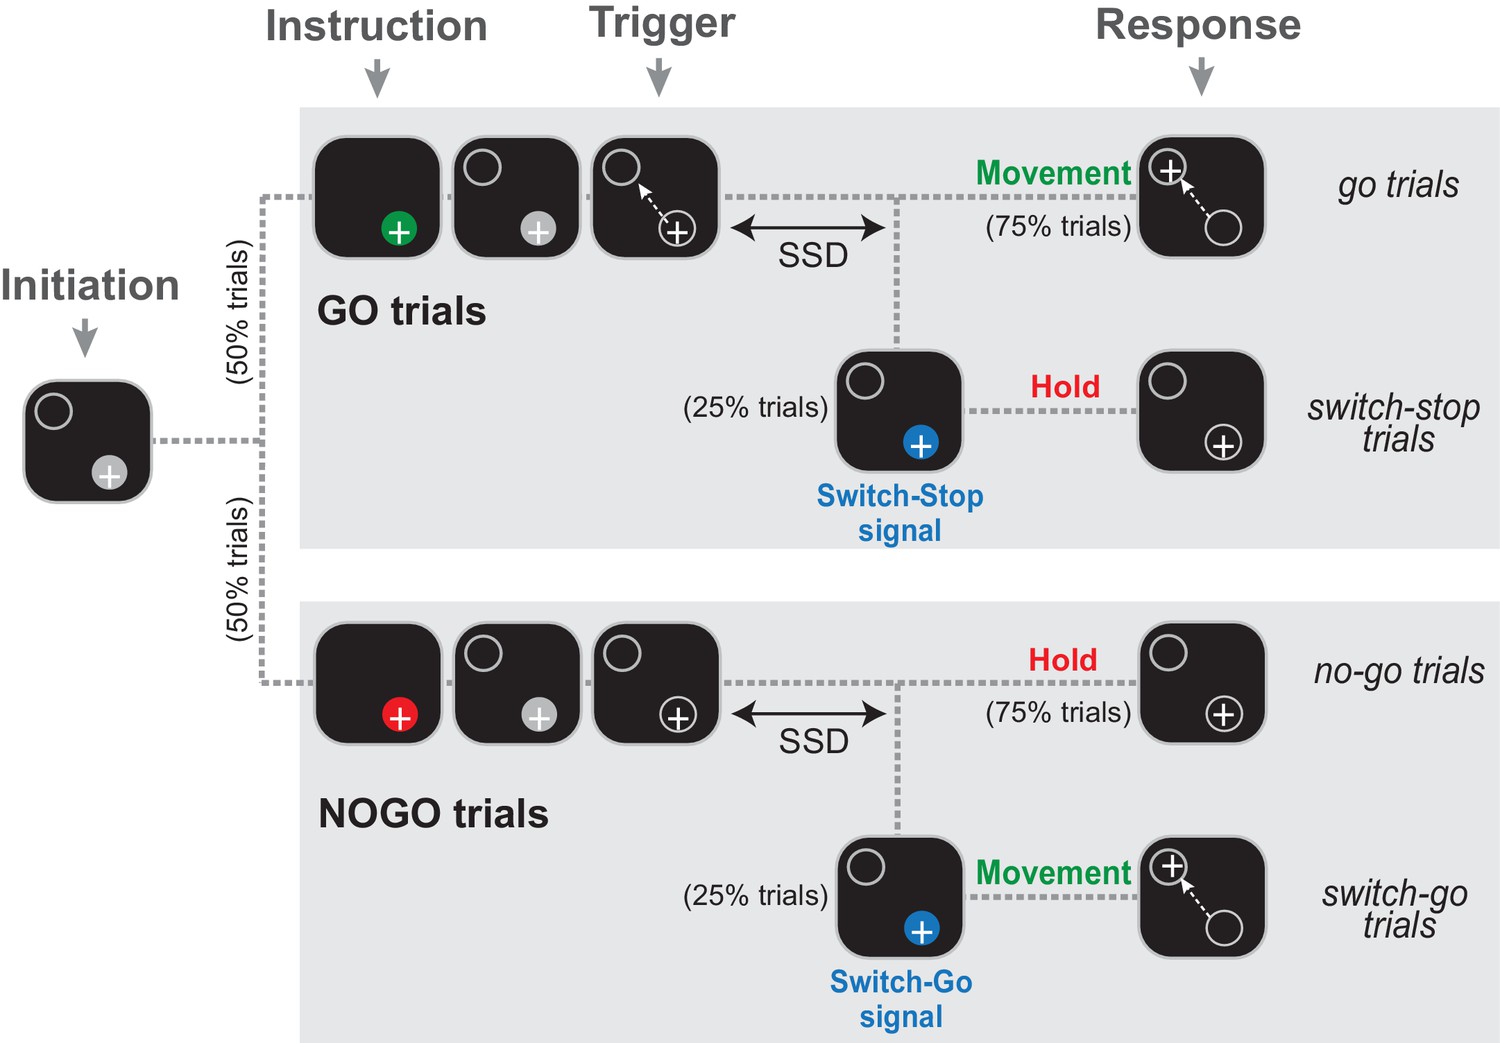
The Go/NoGo-countermanding task.
Temporal sequence of visual displays for the four trial types. After the animal initiated a trial by moving the hand-controlled cursor (+) to the start position (gray circle), one of two possible instruction cues (selected at random between trials) were presented briefly. A green cue indicated a Go condition, while a red cue indicated a NoGo condition. Depending the condition, the animal was then required to respond to the Trigger stimulus by moving to the target (go trials) or continuing to hold the cursor in the start position (no-go trials). On a small fraction of trials (25%), the Trigger stimulus was followed after a variable delay (the switch-signal delay, SSD) by a switch-signal (blue cue) that instructed the animal to countermand the initially planned response.
Figure 2
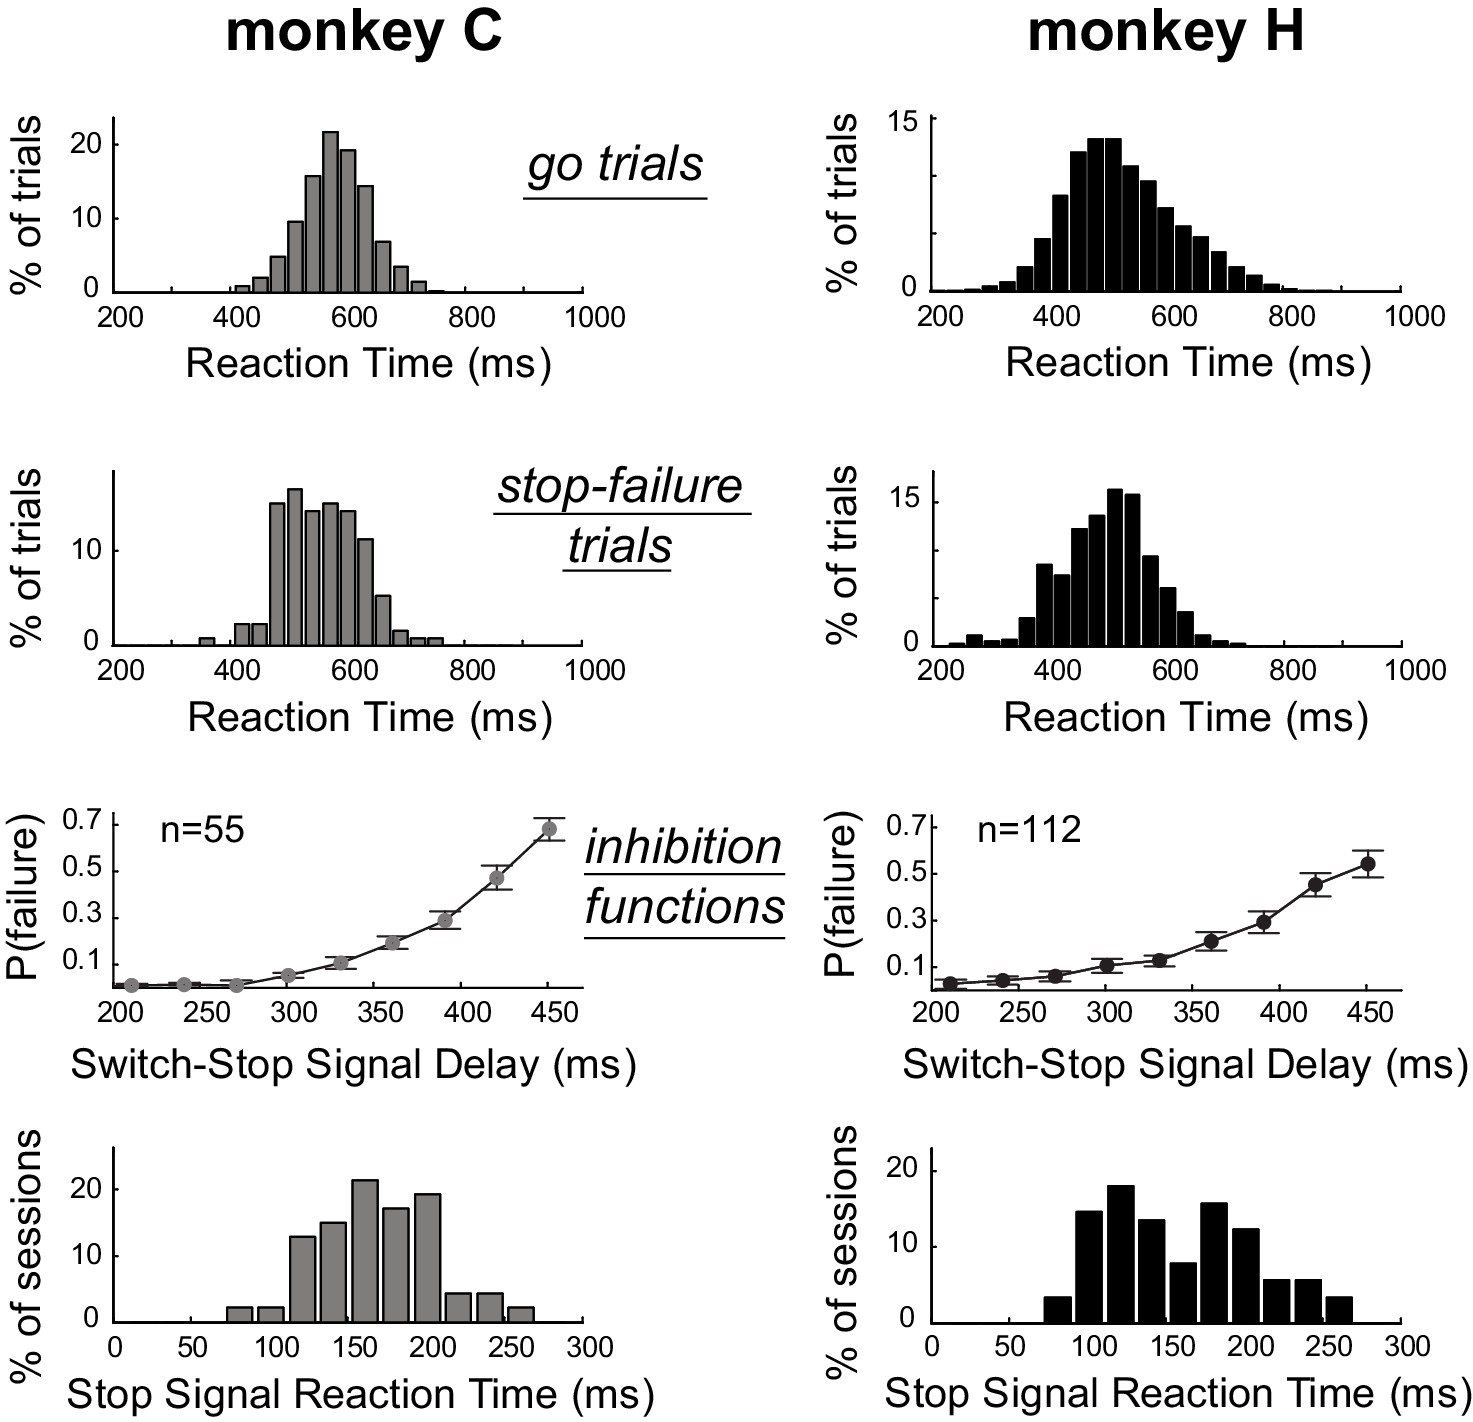
Estimation of the time required to inhibit the planned response.
Subject performance in our version of the stop-signal task. The reaction time distributions for go trials and stop-failure trials were calculated across recording sessions. Stop-failure trials corresponded to those on which the animal failed to inhibit the planned response. Inhibition functions averaged across sessions were obtained by plotting the proportion of stop-failure trials as a function of the switch-signal delay (mean ±SEM). By combining inhibition functions with the reaction time distributions, we estimated the stop-signal reaction times (SSRT) for each session. The bottom row of plots show the distributions of SSRT estimates for each monkey across recording days.
Figure 3
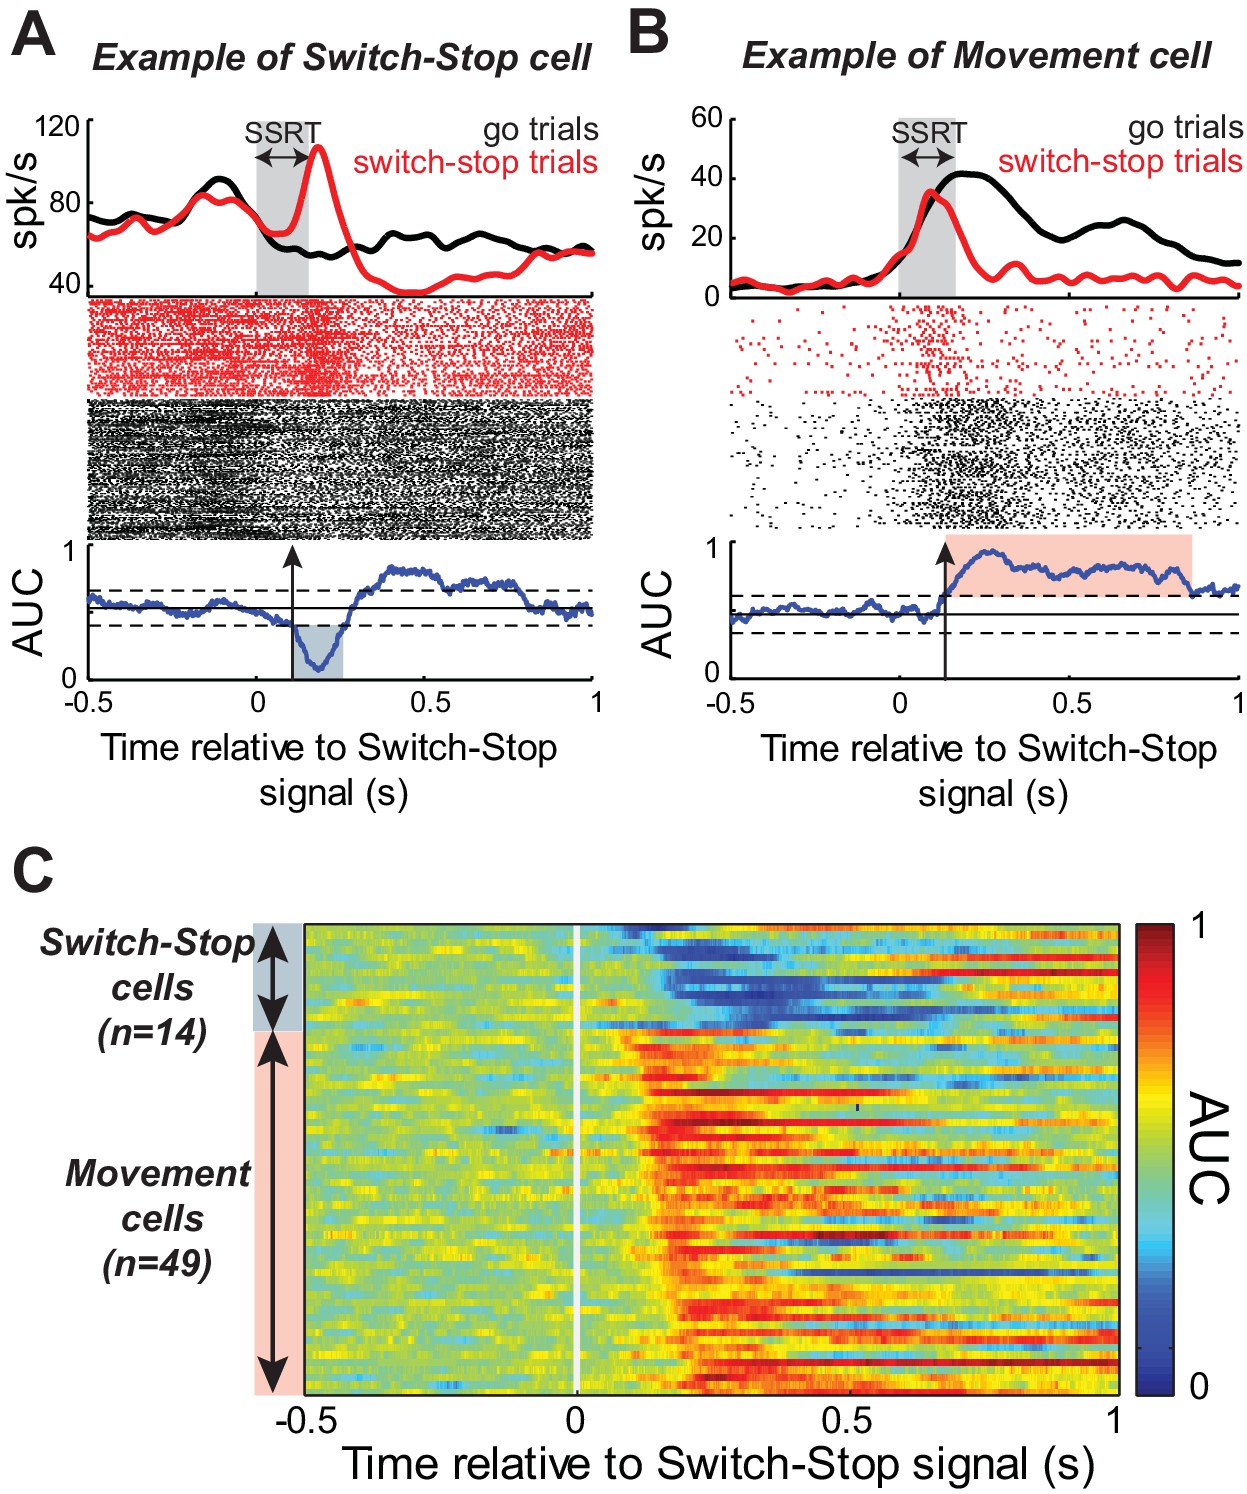
Response of STN neurons to switch-stop signal.
The activity of two exemplar neurons that were classified as a (A) Switch-stop cell and (B) Movement cell. Spike density functions and rasters were constructed around the presentation of the switch-stop signal (red) and latency-matched go trials (black). In the spike density functions, the gray shading indicates the stop-signal reaction time (SSRT) estimated from concurrent behavior. A sliding window ROC analysis compared firing rates between successful switch-stop trials and latency-matched go trials. Blue lines (below rasters): areas under the ROC curve (AUC) reflecting statistical difference between spike count distributions for each time step (60 ms window-width with a step of 1 ms). Horizontal lines: baseline ± threshold for significant AUC (2-tailed t-test, p<0.01). Vertical arrow: detected neural cancellation time. Only a subset of trials is shown in the raster of go trials to aid visualization of spike occurrences. (C) Color plot of all AUC values for neurons in which the neural cancellation time occurred within the SSRT. Colors reflect the relative direction and intensity of the stop-related response (blue = stop related relative increase in firing; red = stop related relative decrease in firing; AUC scale in the bar).
Figure 4 with 1 supplement
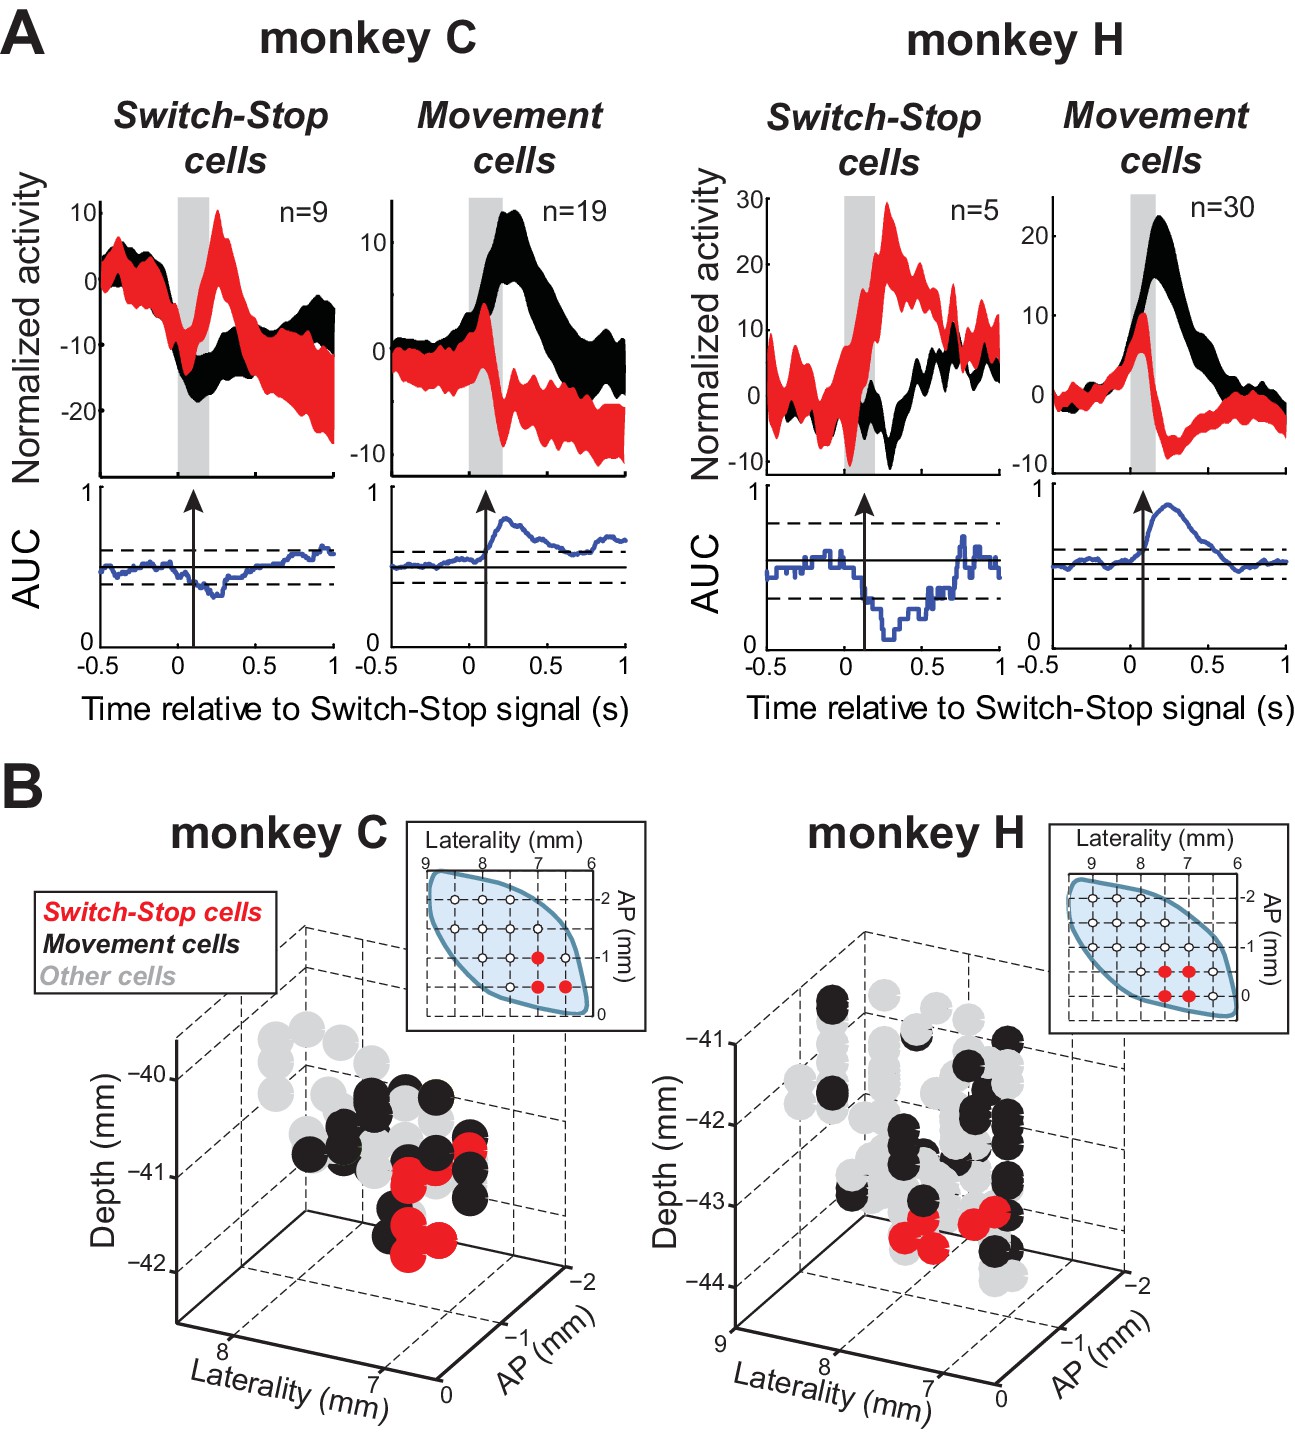
Two types of STN response during stopping.
(A) Population-averaged activities of STN neurons that showed a neural cancellation time within the SSRT. Spike density functions aligned on switch-stop signal presentation (red) and the equivalent time in latency-matched go trials (black) were normalized by subtracting the baseline activity (500 ms before the signal) and grouped according to the response pattern evoked in neuronal activity during stopping: increase or decrease in firing relative to latency-matched go trials (Switch-stop and Movement cells, respectively). The width of the spike density function line indicates the population SEM. Otherwise, these figures follow the conventions of Figure 3. (B) Topography of cell types in the STN. Two- and three-dimensional plots of cell type distributions based on coordinates from the recording chamber. AP: anterior-posterior plane.
Figure 4—figure supplement 1
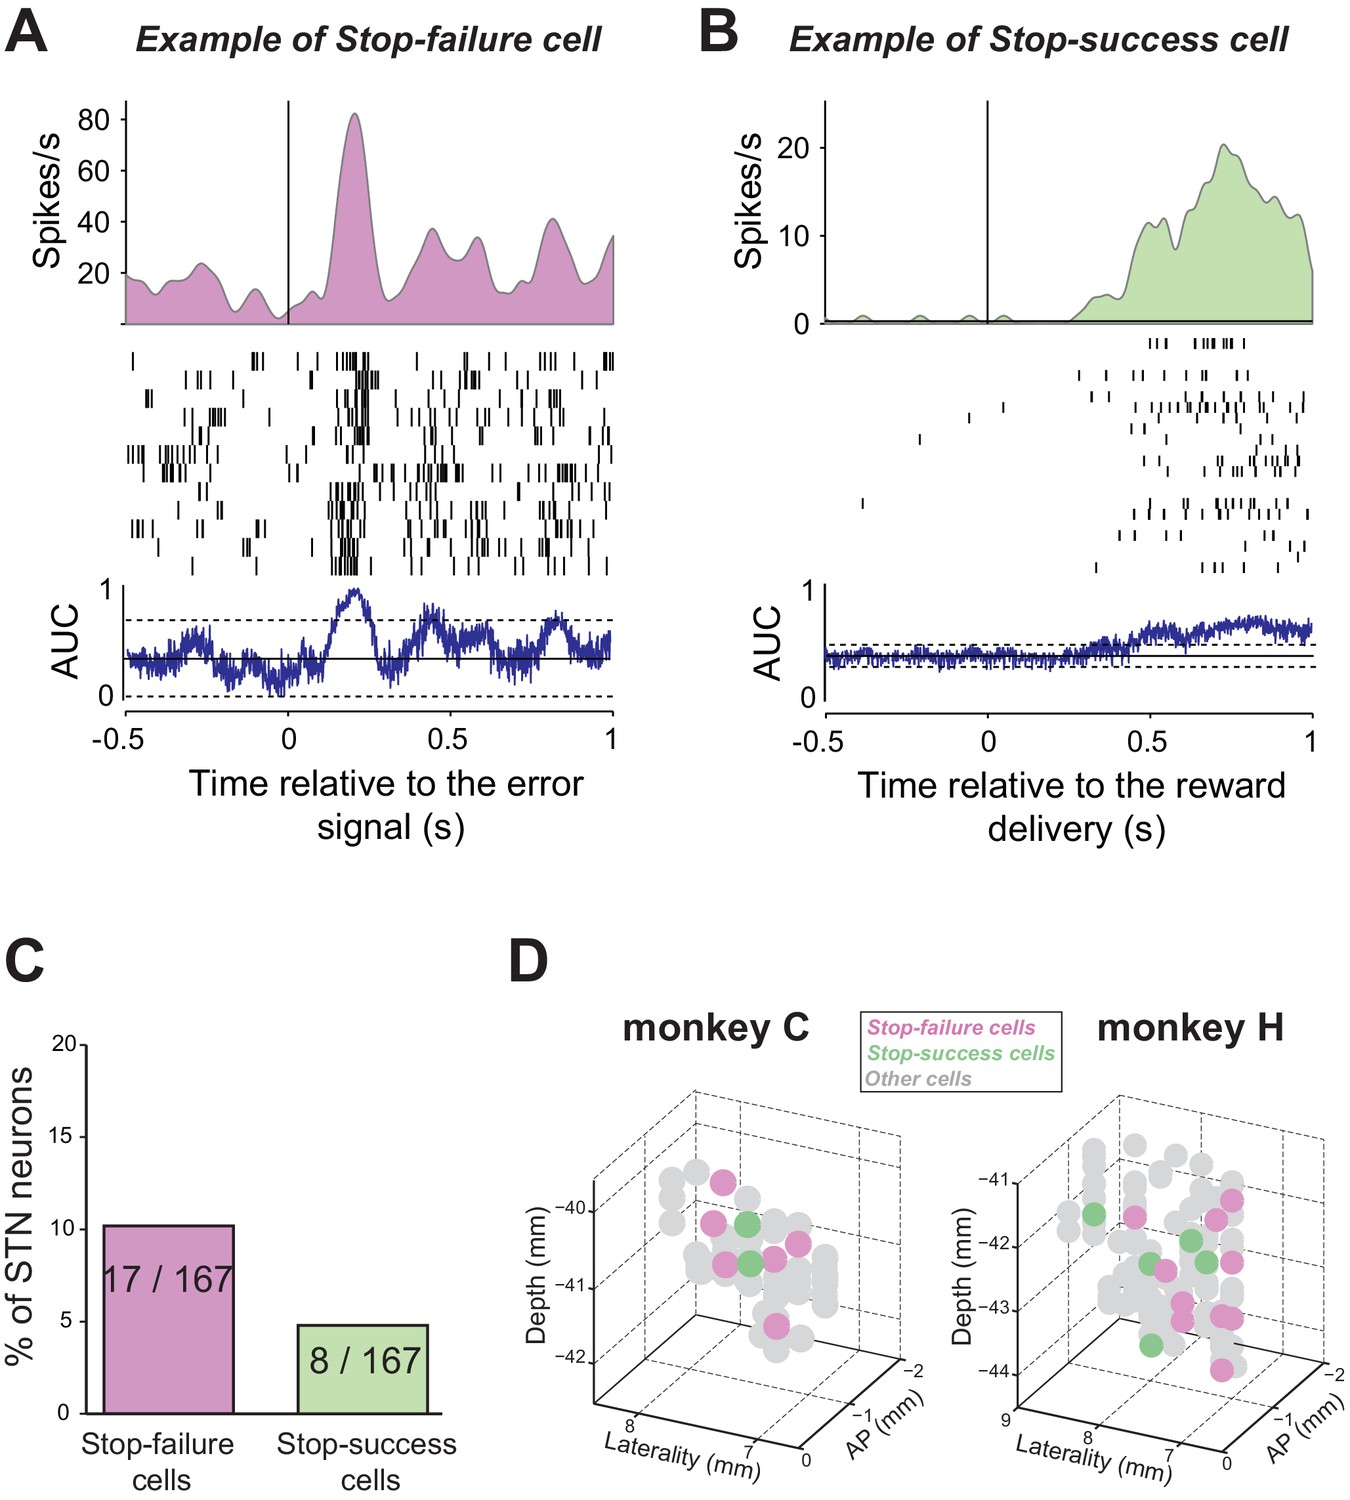
Response of STN neurons to error and successful trials.
The activity of two exemplar neurons that were classified as a (A) Stop-failure cell and (B) Stop-success cell. Spike density functions and rasters were constructed around the presentation of the error signal (black screen; stop-failure trials) or reward delivery (stop-success trials), respectively. AUC values were calculated by comparing spike counts in a 60 ms test window to spike counts time-shuffled. Horizontal lines: baseline ± threshold for significant AUC (2-tailed t-test, p<0.01). (B) Proportion and (C) topography of cell types in the STN. Three-dimensional plots of cell type distributions based on coordinates from the recording chamber. Notably, the stop-failure and stop-success cells were not segregated to the ventromedial part of STN. AP: anterior-posterior plane.
Figure 5
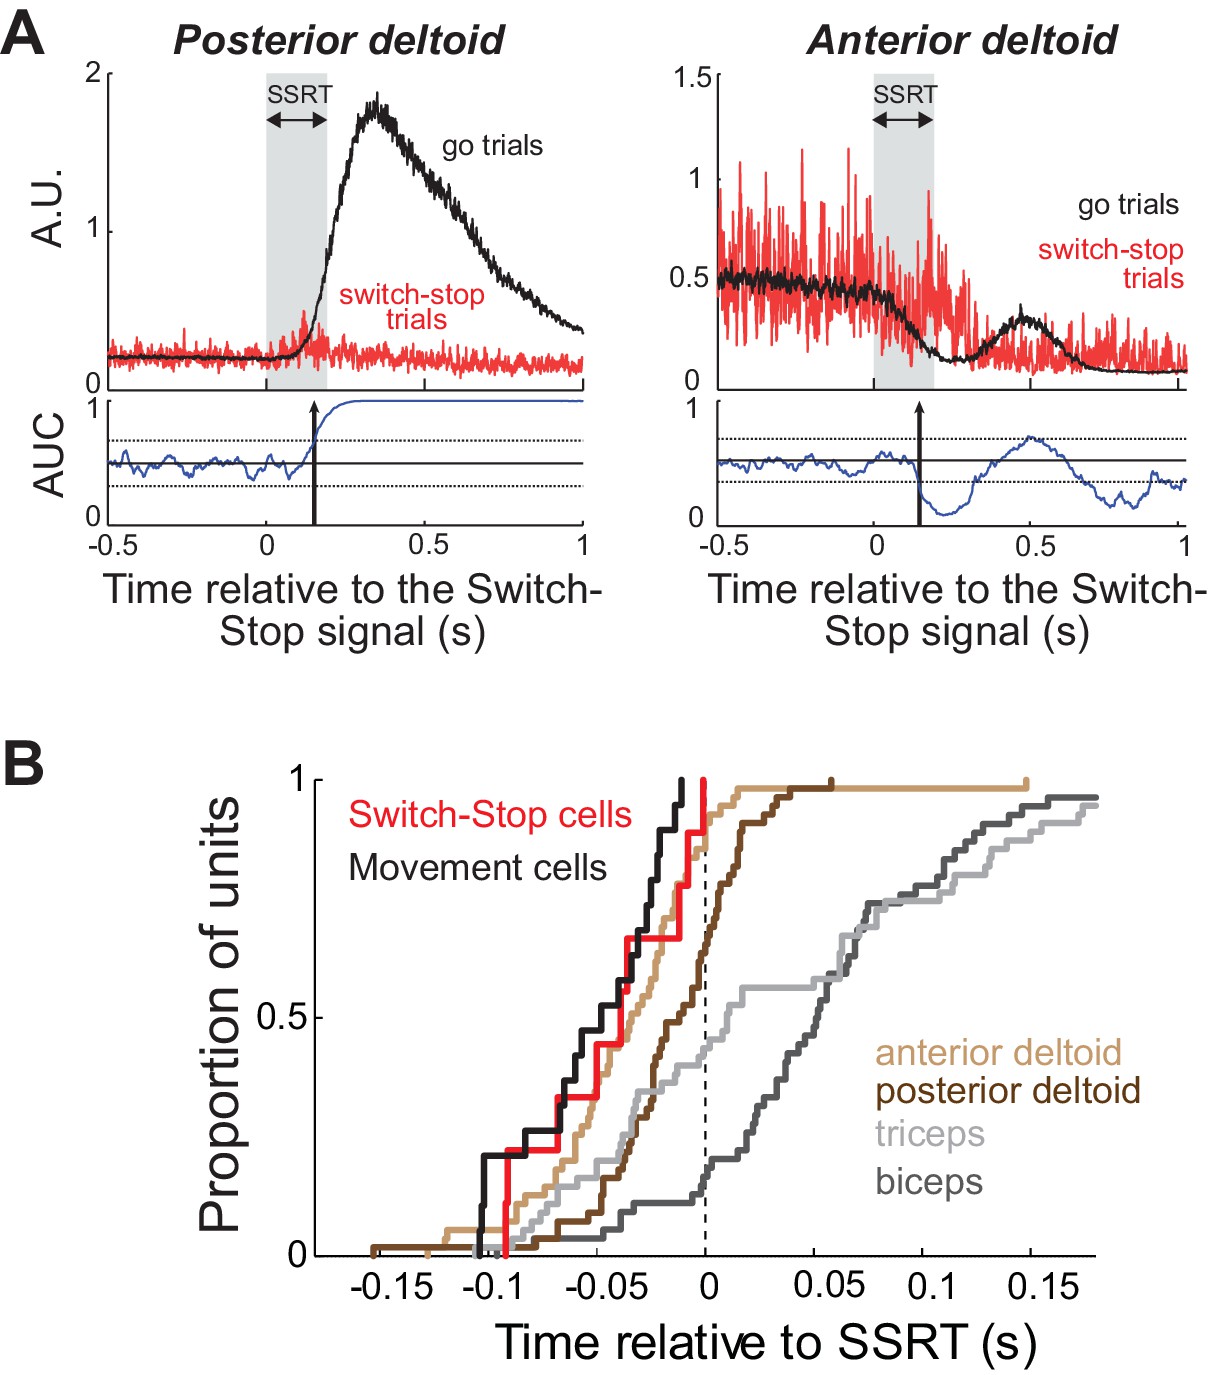
Muscle and neural cancelation times in monkey C.
(A) EMG signals collected from agonist (left) and antagonist (right) muscles were aligned on the presentation of the switch-stop signal and latency-matched go trials. Vertical arrow: detected muscle cancellation time. (B) Cumulative proportion of STN neurons (Switch-stop vs. Movement cells) and muscles with cancelation times relative to the SSRT boundary. The average cancelation time of the anterior deltoid (−34 ms before SSRT) preceded the other EMG activities in the stop process (Mann-Whitney U-test, p<0.05).
Figure 6 with 1 supplement

A subset of STN neurons encode a selective stop signal.
(A–B) Population-averaged activities of STN neurons that showed short-latency increases of discharge in response to the switch-stop signal presentation. Spike density functions (mean ±SEM) were aligned on (A) the switch-stop signal or (B) the switch-go signal. These figures follow the conventions of Figure 3. (C–D) The activity of two exemplar neurons classified as (C) Stop cell and (D) Switch cell. These spike density functions and rasters were constructed around the presentation of both types of switch signal (switch-stop and switch-go). To compare the firing rate between trials, we used the same ROC analysis (p<0.01). (E–F) The maximum deviation of AUC values was used to categorize STN neurons as Stop cells (AUC values significantly reduced relative to the control period) or Switch cells (AUC values not significantly reduced relative to the control period).
Figure 6—figure supplement 1
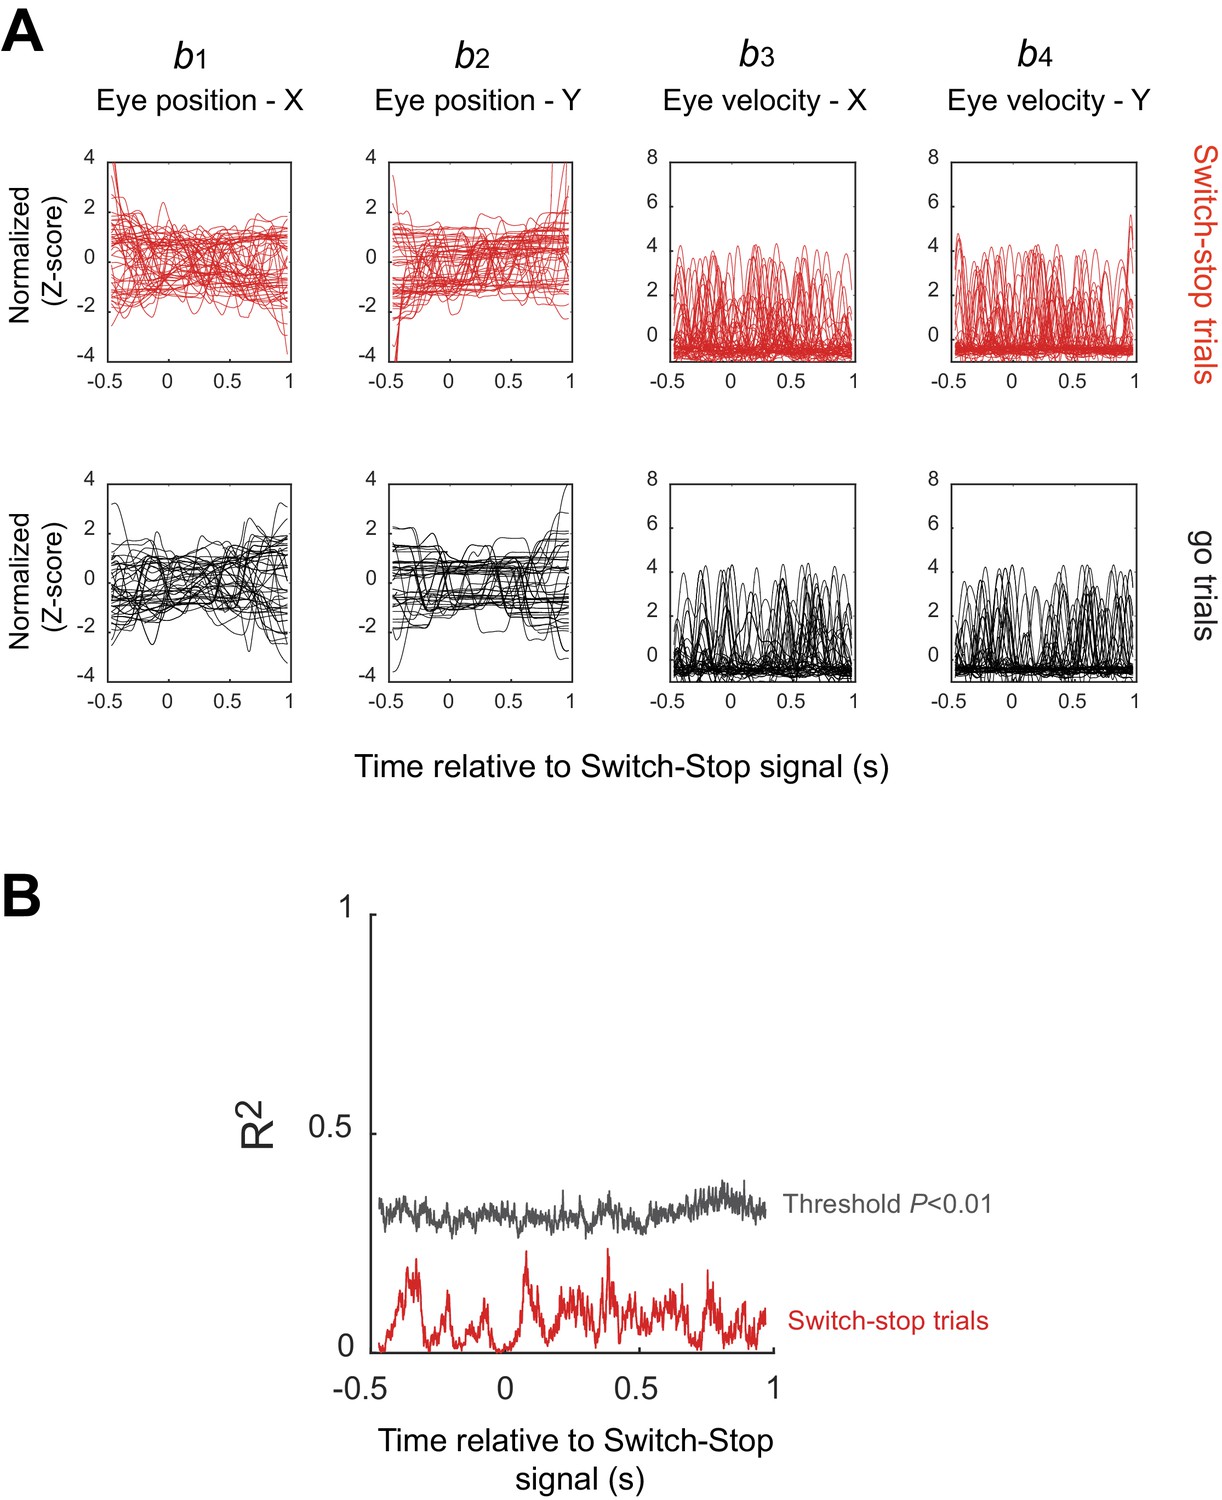
STN activities independent to eye position or saccade.
A multiple regression analysis was used to test for relations between neuronal activity and measures of eye position (b1 and b2 corresponded to the horizontal and vertical components) and velocity (b3 and b4). (A) Examples of continuously-sampled eye position (left) and velocity (right) recorded simultaneously with the neuronal activity shown in Figure 6. Single trial traces are Z-score normalized and plotted relative to the time of switch-stop signal presentation. (B) Coefficients of determination calculated from a series of regressions around the switch-stop signal (50 ms with a step of 1 ms). Results obtained with this example neuron remained non-significant, with R2 values (red) below the threshold for significance (black) (Permutation test, p>0.01).
Figure 7
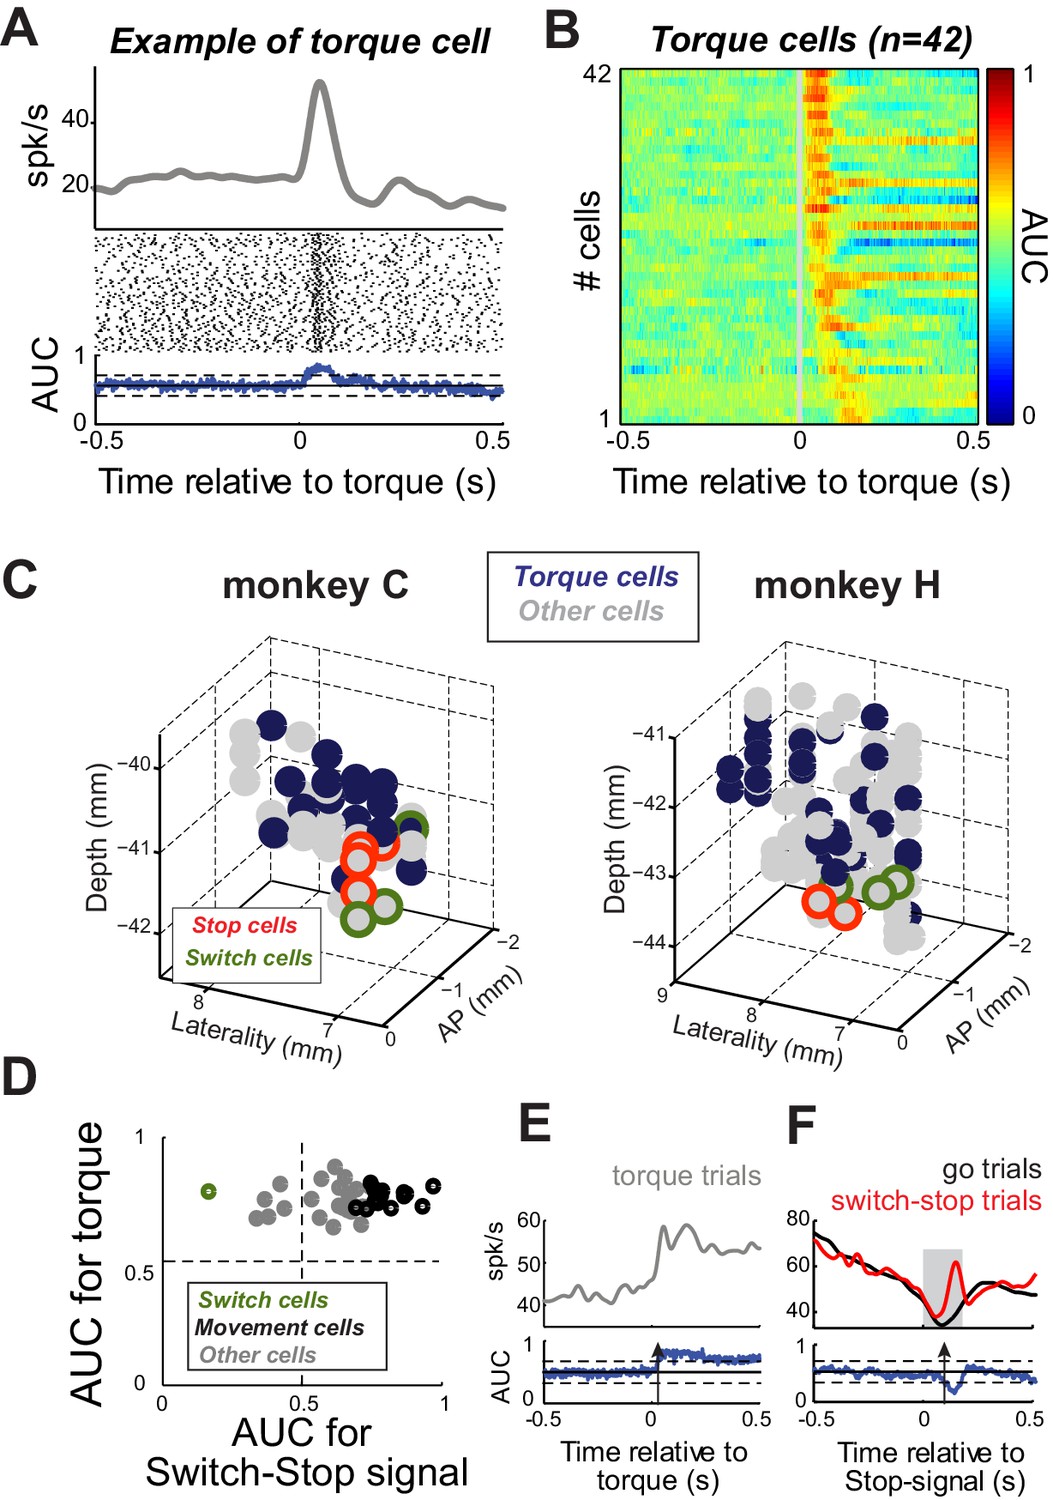
Proprioceptive stimulation evokes STN responses.
(A) Example of STN neuron that exhibited a rapid change of activity in response to torque-induced proprioceptive stimulation (2-tailed t-test, p<0.01). (B) Color plot of AUC values calculated over time for each neuron responding at short-latency to torque pulses (<200 ms; p<0.01; AUC color scale in the bar). (C) Topography of cell types in the STN. Note that torque-responsive neurons were located primarily in the dorso-lateral STN and did not overlap with switch-stop neurons. (D) For each neuron with a significant torque response, the peak AUC for the torque response is plotted versus the peak AUC for the effect of stopping. Note that only one torque-responsive neuron had a switch-type response (green symbol). (E–F) For this one Torque cell also categorized as a Switch cell, spike density functions and AUC values are separately aligned on (E) torque pulses and (F) switch-stop signals. The methods and conventions used to compare muscle or neuronal activities were described in Figure 3. The arrows in AUC values indicate the times of first differential activity.
Figure 8 with 2 supplements
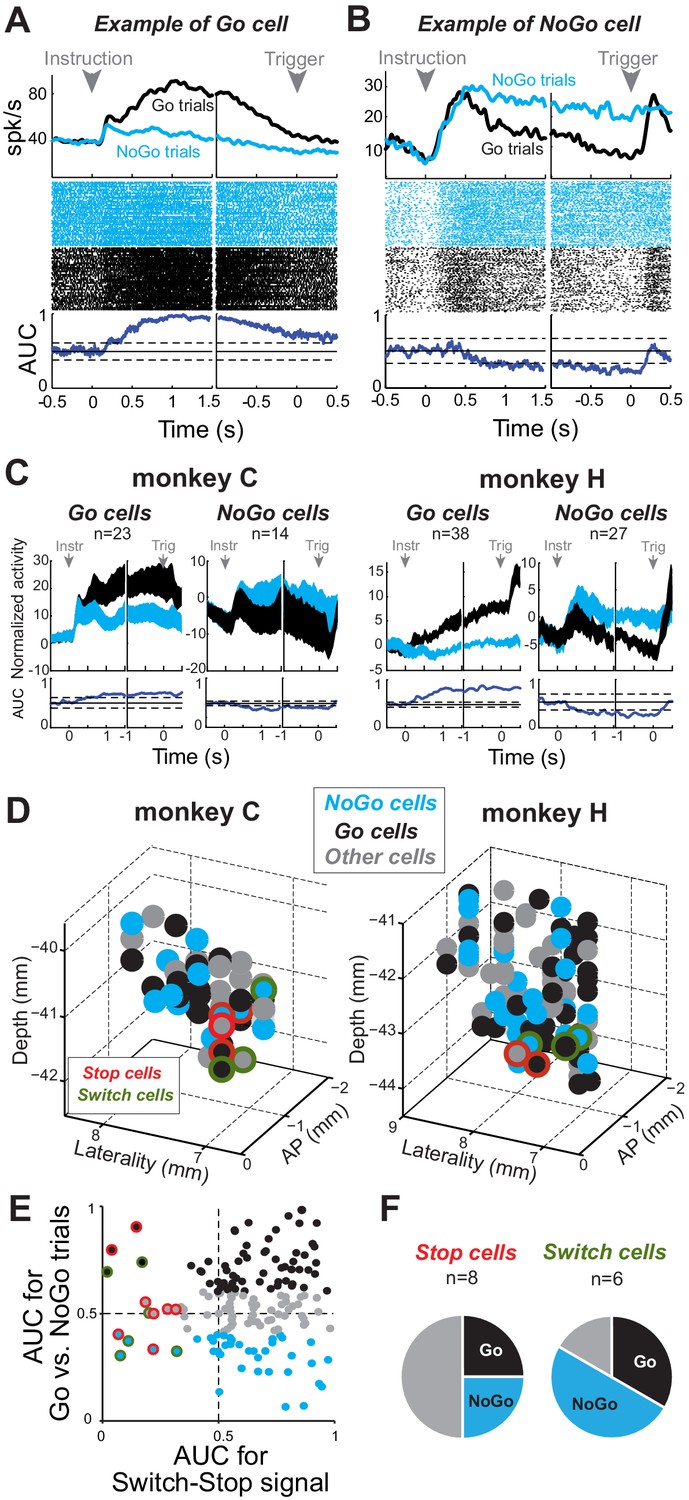
Proactive encoding of action suppression in STN.
(A–B) The activity of two exemplar neurons that were classified as a Go cell (A) and a NoGo cell (B). Spike density functions, rasters and AUC values were constructed around the presentation of the instruction cue and the time of the response trigger. The categorization was determined according to the AUC values present during the time interval between those task events (thresholds: p<0.01). (C) Population-averaged activities for STN Go and NoGo neurons (p<0.01). Spike density functions were normalized by subtracting the baseline activity (500 ms before the instruction). (D) Topography of cell types in the STN. (E–F) Distribution of peak AUC values for the Go/NoGo comparison plotted versus the AUC values for the switch-stop comparison. (F) No relationship was observed in the STN between both reactive and proactive encodings (χ2=1.75, p=0.42).
Figure 8—figure supplement 1
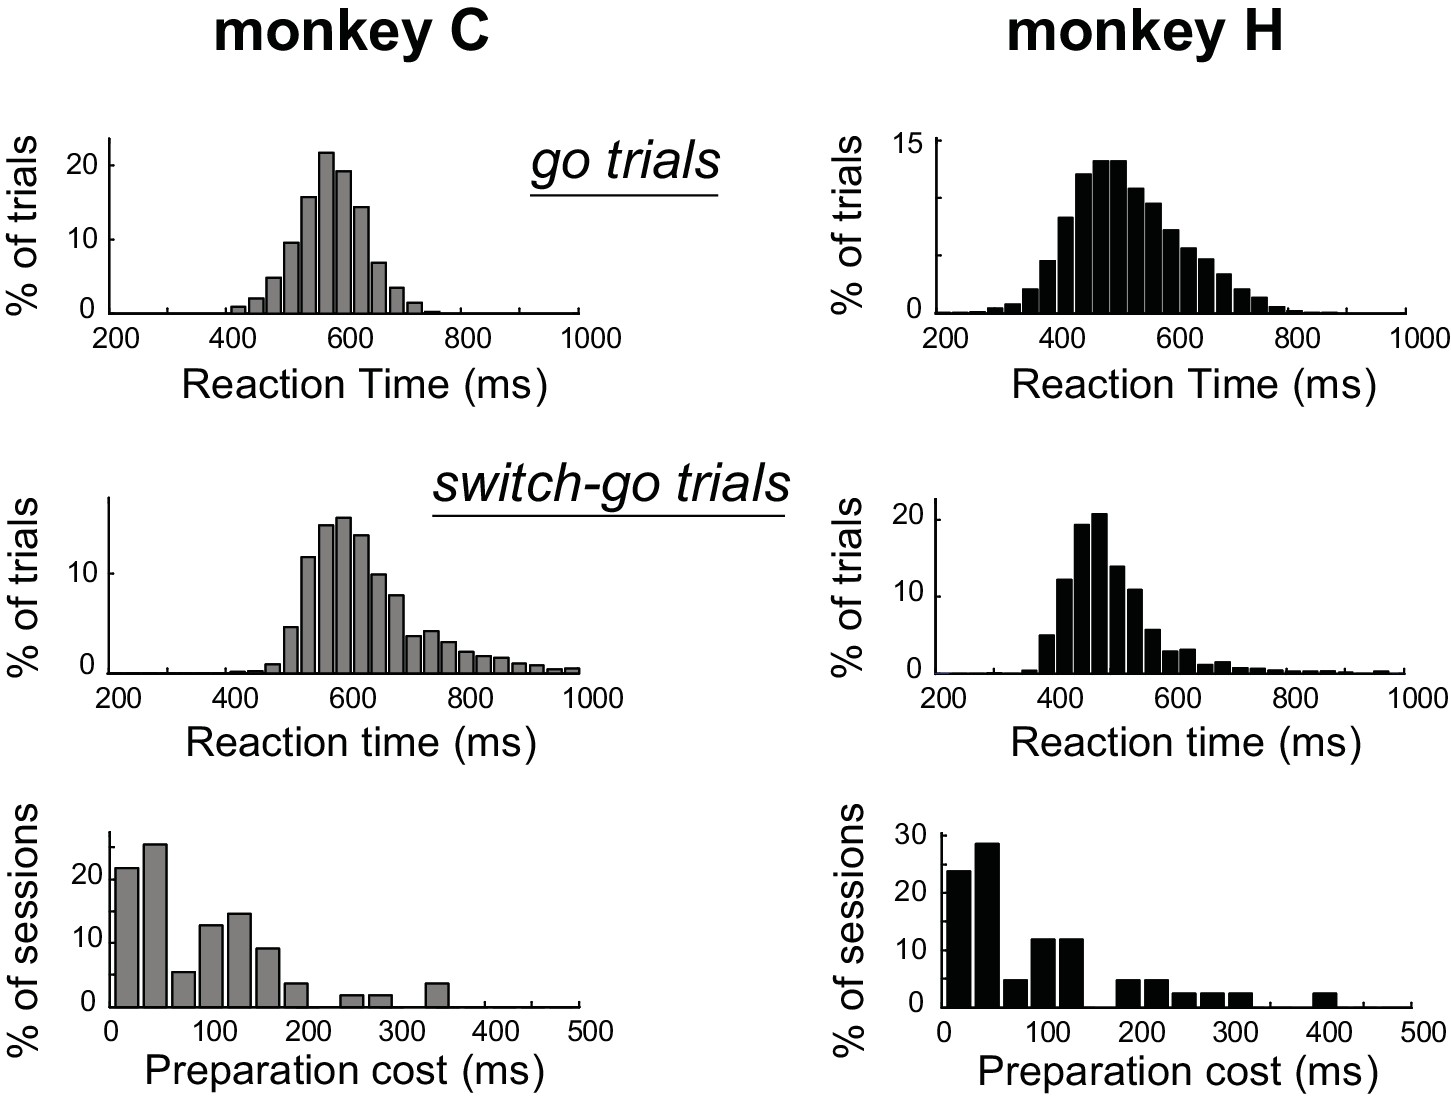
Estimation of the preparation cost.
Behavioral evidence for the monkeys’ employment of proactive planning across the Go/NoGo dimension of the task. The distribution of reaction times for go trials (top) and switch-go trials (middle) were calculated across recording sessions. By comparing those reaction times, we estimated for each session the added time required to initiate a movement when it was not prepared proactively (i.e., the ‘preparation cost’; bottom). This behavioral index revealed the influence of proactive processes during the task performance. The distributions did not differ between monkeys (Mann-Whitney U-test, p=0.82).
Figure 8—figure supplement 2
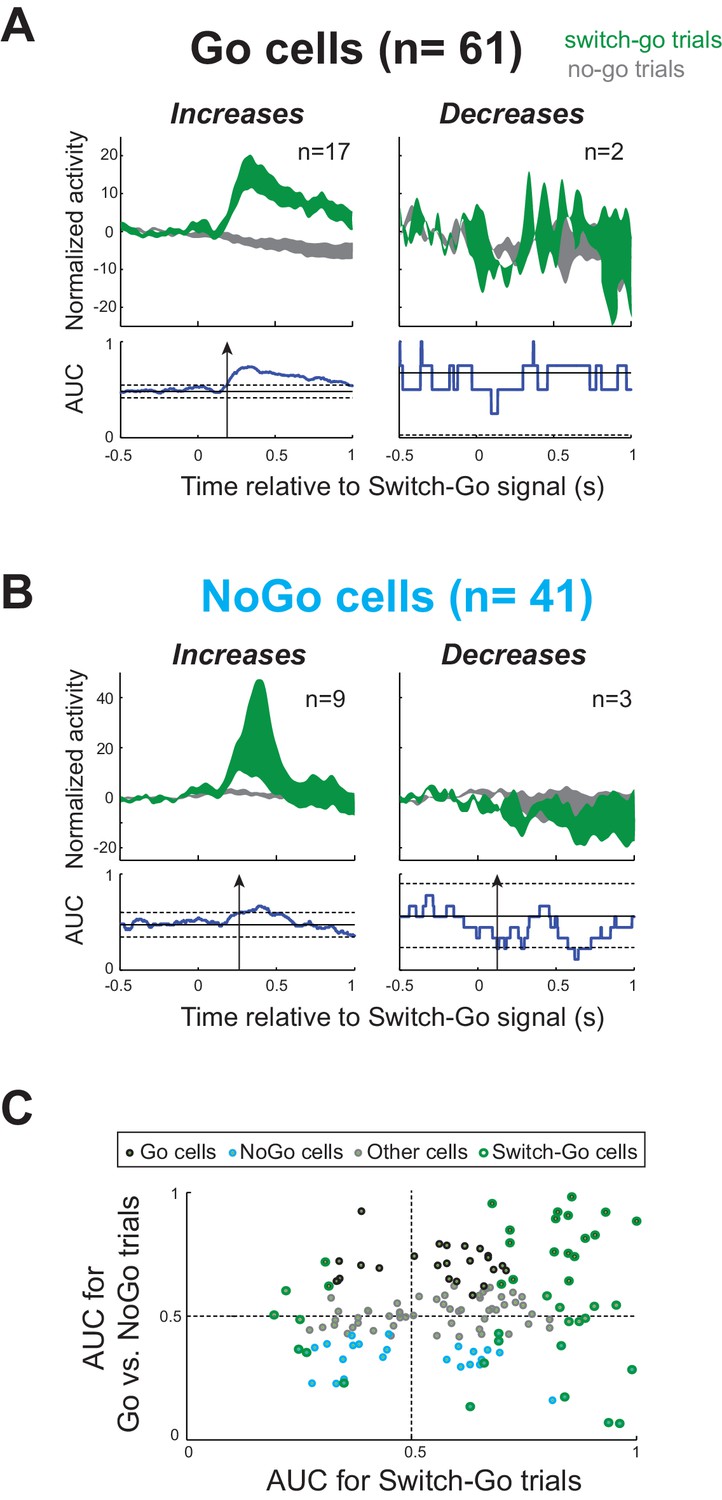
Response of STN neurons to switch-go signal.
(A–B) Population-averaged activities of (A) Go cells and (B) NoGo cells that showed a short-latency response (<300 ms) to the Switch-go signal. Spike density functions aligned on switch-go signal presentation (green) and the equivalent time in no-go trials (gray) were normalized by subtracting the baseline activity (500 ms before the signal) and grouped according to the response pattern evoked in neuronal activity: increase (left) or decrease (right) in firing relative to no-go trials. The vertical width of the spike density function line indicates the population SEM. To compare the firing rate between trials, we used the same ROC analysis (p<0.01). The arrows in AUC values indicate the times of first differential activity. (C) Distribution of peak AUC values for the Go/NoGo comparison plotted versus the AUC values for the switch-go comparison. No relationship was observed in the STN between both reactive and proactive encodings (χ2=1.14, p=0.29).
Additional files
-
Supplementary file 1
Table showing numbers of STN neurons found in each category per monkey.
- https://doi.org/10.7554/eLife.31627.014
-
Supplementary file 2
Validation of the method used to detect the neural cancelation time.
(A-B) Population-averaged activities of (A) Go cells and (B) NoGo cells that showed a short-latency response (<300 ms) to the Switch-go signal. Spike density functions aligned on switch-go signal presentation (green) and the equivalent time in no-go trials (gray) were normalized by subtracting the baseline activity (500 ms before the signal) and grouped according to the response pattern evoked in neuronal activity: increase (left) or decrease (right) in firing relative to no-go trials. The vertical width of the spike density function line indicates the population SEM. To compare the firing rate between trials, we used the same ROC analysis (p<0.01). The arrows in AUC values indicate the times of first differential activity. (C) Distribution of peak AUC values for the Go/NoGo comparison plotted versus the AUC values for the switch-go comparison. No relationship was observed in the STN between both reactive and proactive encodings (χ2=1.14, p=0.29).
- https://doi.org/10.7554/eLife.31627.015
-
Source code 1
Custom Matlab code for analysis.
- https://doi.org/10.7554/eLife.31627.016
Download links
A two-part list of links to download the article, or parts of the article, in various formats.
Downloads (link to download the article as PDF)
Open citations (links to open the citations from this article in various online reference manager services)
Cite this article (links to download the citations from this article in formats compatible with various reference manager tools)
A selective role for ventromedial subthalamic nucleus in inhibitory control
eLife 6:e31627.
https://doi.org/10.7554/eLife.31627


