Astrocytic modulation of excitatory synaptic signaling in a mouse model of Rett syndrome
- Oregon Health & Science University, United States
Figures
Figure 1
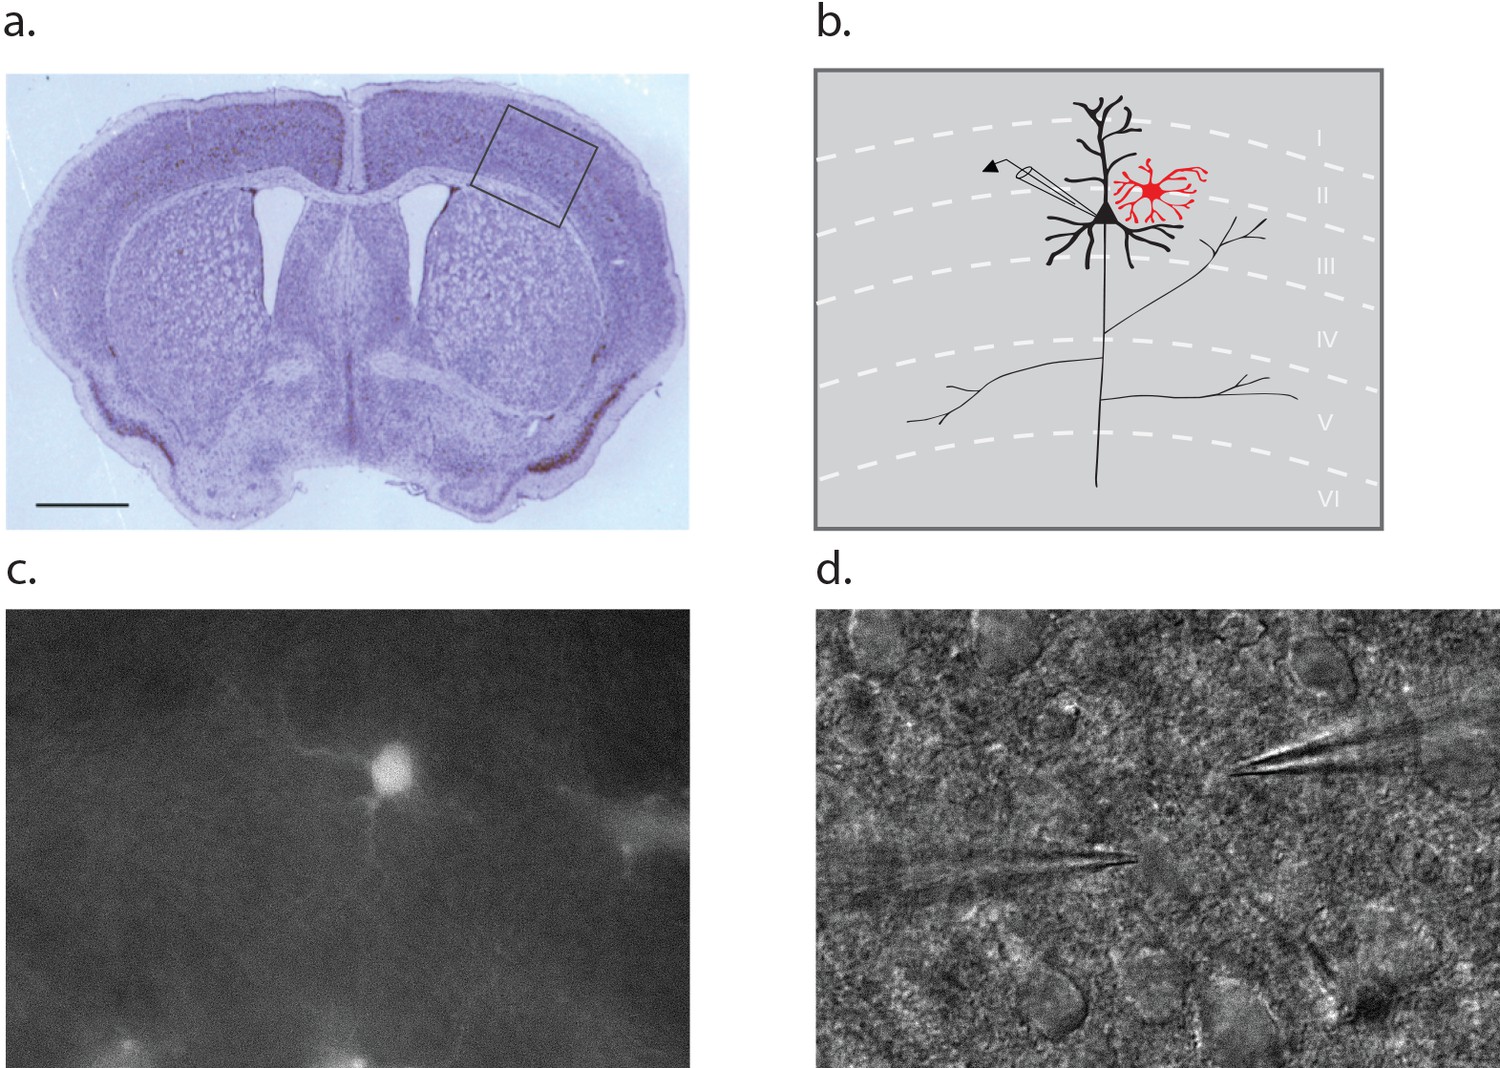
Dual patch clamp recording configuration.
(a) Cross section of a p10 mouse brain through the barrel cortex region with an inset indicating the region from which astrocyte-neuron pairs were obtained for recording. Scale bar 1 mm. (b) Schematic representation of the inset area in A, noting the position of a neuron (black) and astrocyte (red) within the layers of the cortex. (c) Fluorescence image of a cortical slice showing an SR101 loaded astrocyte. (d) The counterpart DIC image showing a typical recording configuration with the neuron electrode on the left and astrocyte electrode on the right.
Figure 2 with 1 supplement
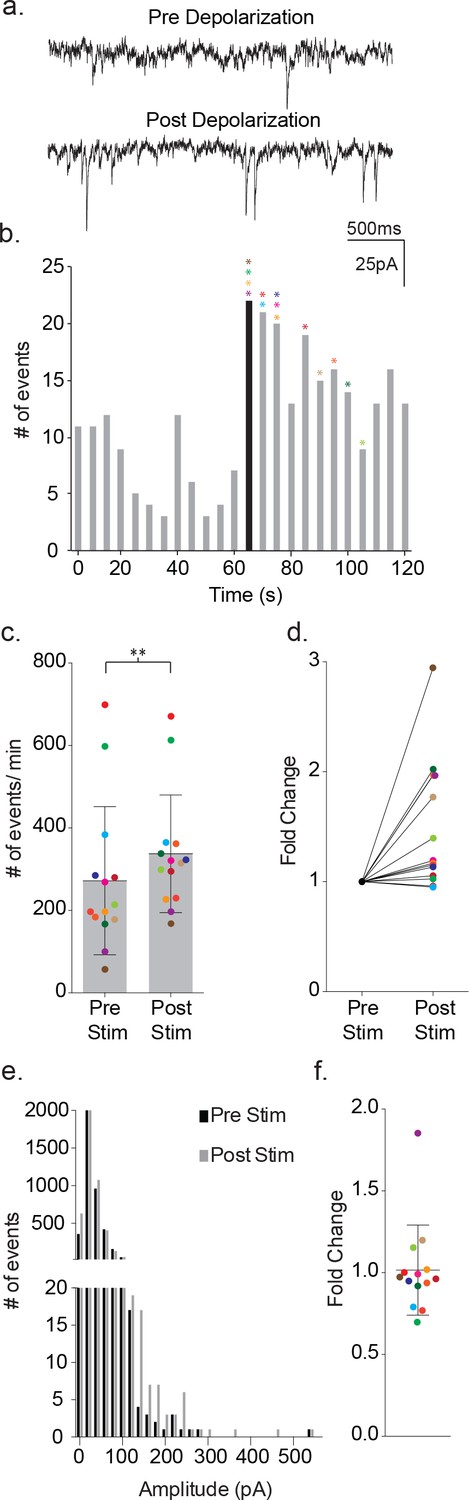
Depolarization of astrocytes leads to increased frequency of synaptic currents in cortical neurons of wild-type mice.
(a) Representative traces (3 s) of synaptic currents recorded from a wild-type neuron before (top) and after (bottom) administrating 20, 10 ms steps from −80 mV to +60 mV to the astrocyte. (b) The corresponding temporal sequence for wild-type synaptic current occurrence 60 s prior to and 60 s following astrocyte depolarization. The time of stimulation is indicated by the black bin. The colored asterisks denote the bins where the peak frequency occurred for each respective recording shown in c, d and f. (c) The cumulative results from wild-type recordings showing the pre- and post-stimulus event frequencies (mean ± SD, n = 14 recordings, p=0.002, 5 males and 4 females, Wilcoxon matched-pairs signed rank test, two-tailed). (d) The fold change in frequency for the individual color-coded recordings. (e) Amplitude histograms for pooled recordings measured before (black) and after (gray) astrocyte stimulation. (f) The fold change in mean event amplitude ± SD for each color-coded recording is indicated.
Figure 2—figure supplement 1
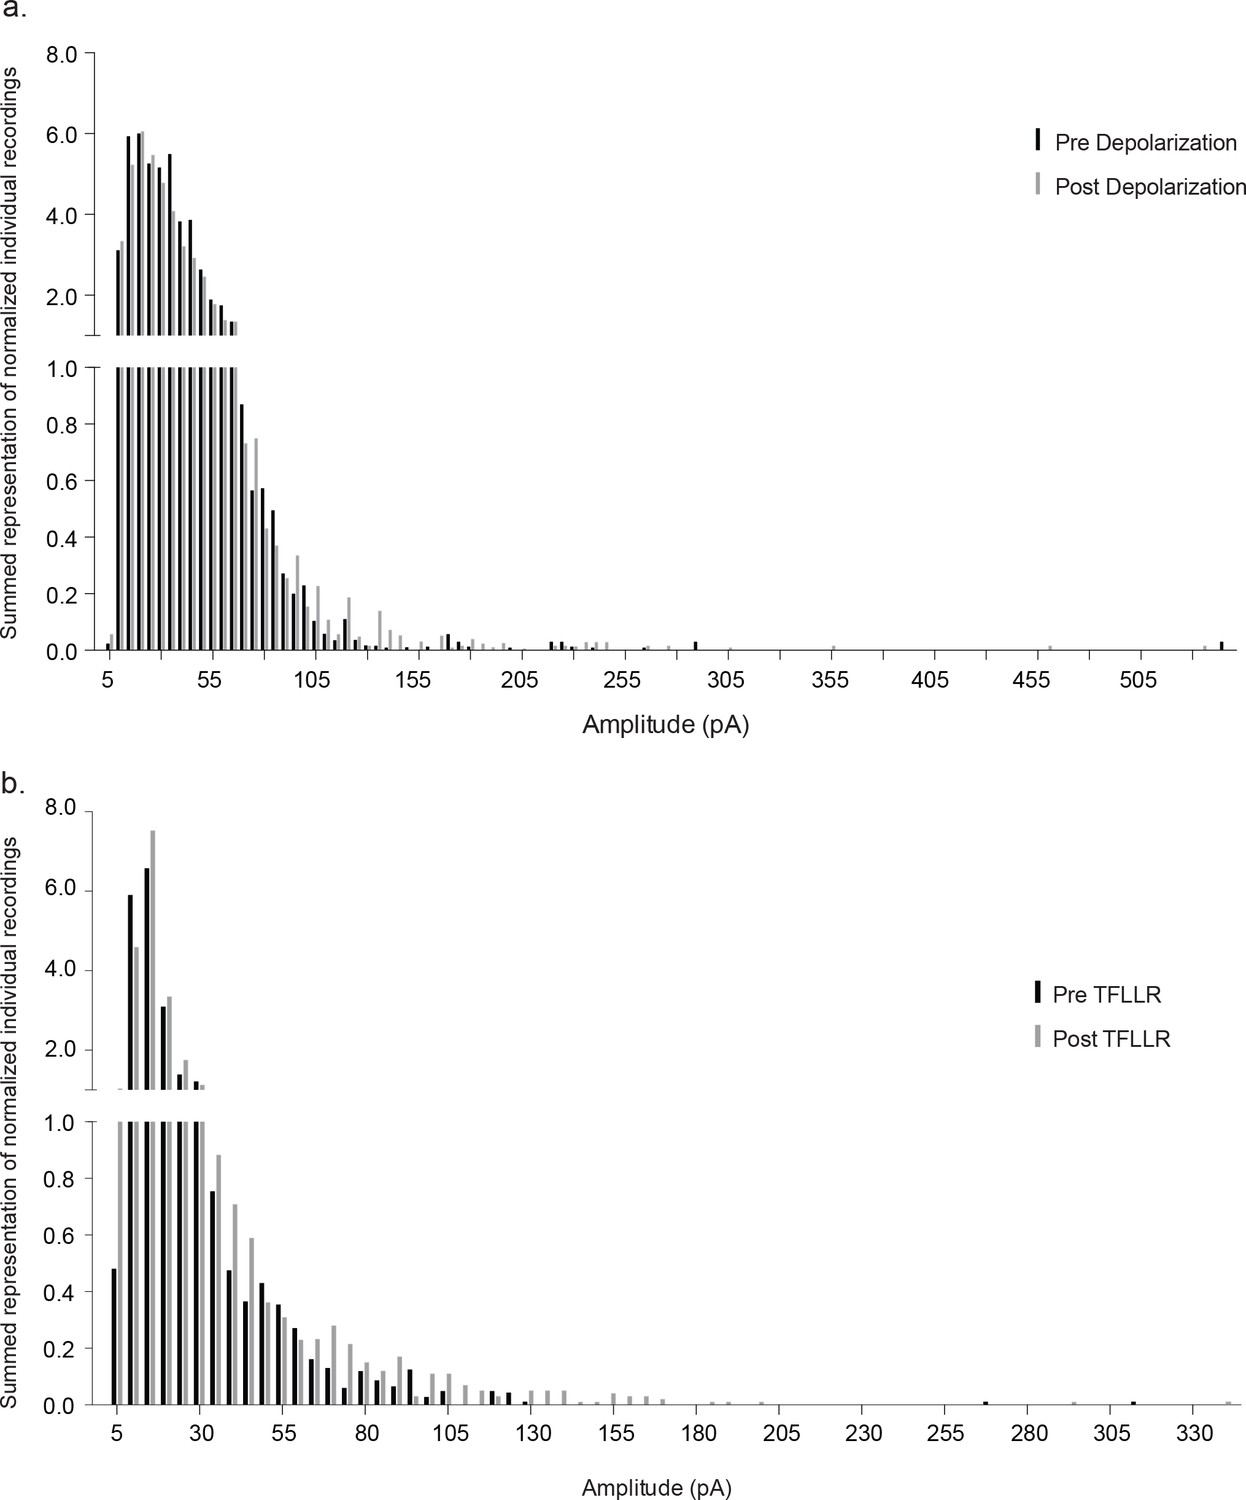
Normalized event number versus amplitude histograms.
Histograms for each individual recording were normalized to the largest event number bin and all of the normalized histograms were summed separately for pre- versus post-depolarization (a) and TFLLR (b). (a) The amplitude of synaptic currents induced by astrocyte depolarization (pre-stim: 0.46 ± 1.32, post-stim: 0.42 ± 1.20, n = 14, 5 males and 4 females, Mann-whitney test, p=0.2963). (b) The amplitude of synaptic currents induced by TFLLR application (pre-stim: 0.38 ± 1.16, post-stim: 0.41 ± 1.21, n = 10, 3 males and 2 females, Mann-whitney test, p=0.08).
Figure 3
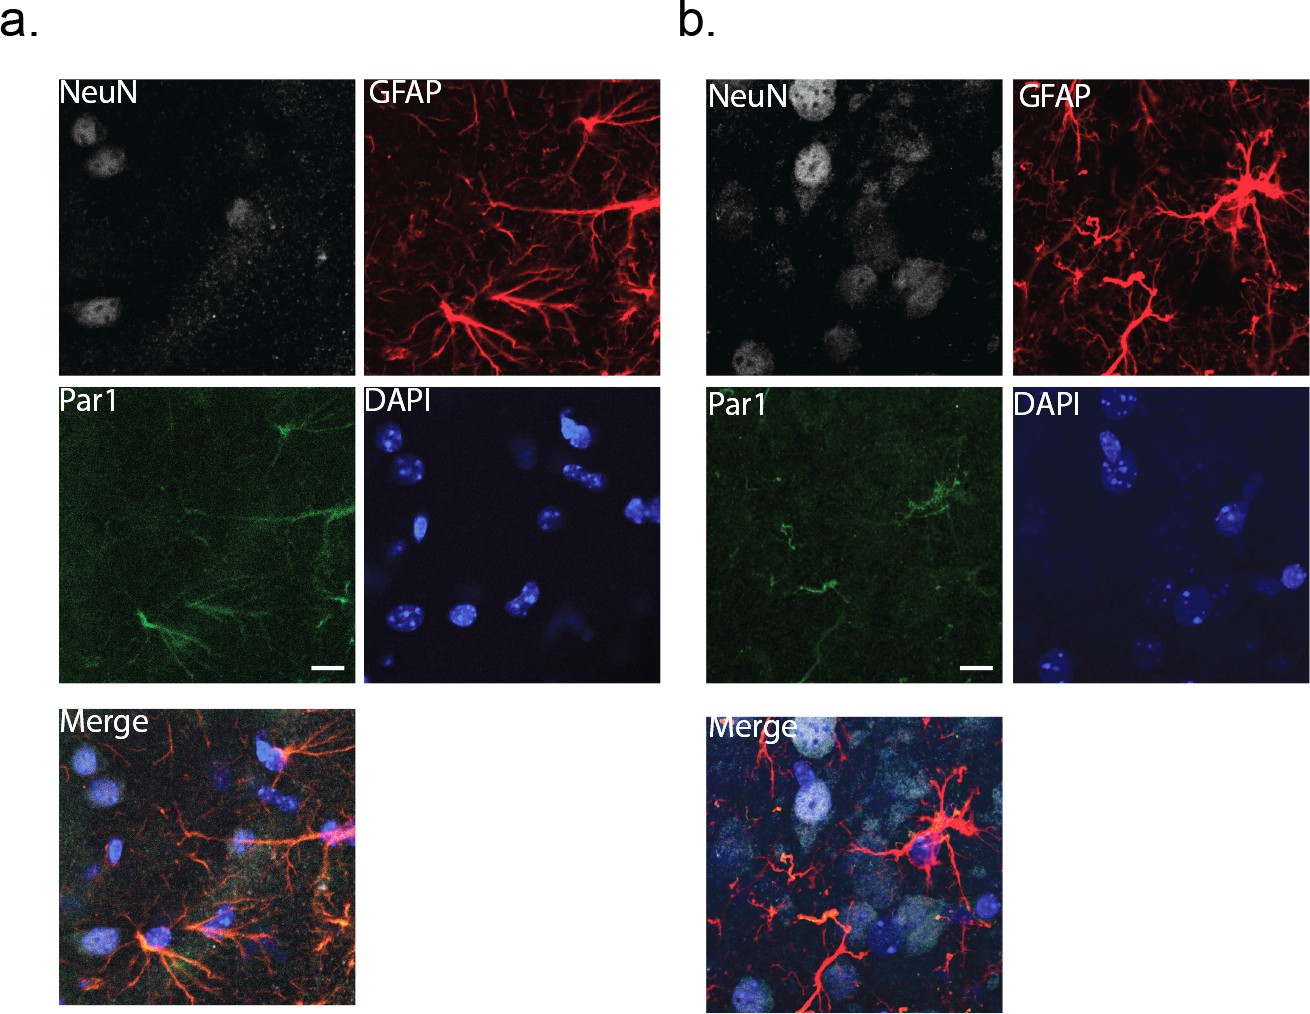
Immunohistochemical labeling for the membrane protein, Par1.
Cortical slices (80 μm thick) were co-stained with NeuN and GFAP as markers for neurons and astrocytes, respectively. DAPI was used to identify nuclei. (a) wild-type cortex (male). (b) MeCP2-null cortex (male). Scale bar is 20 μm.
Figure 4
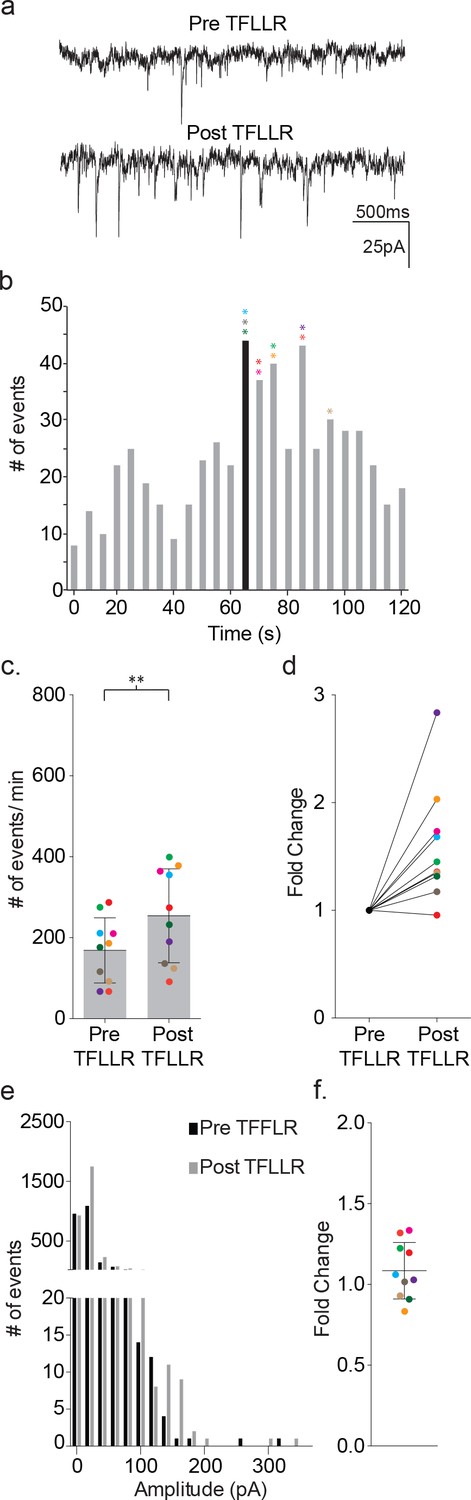
TFLLR applied to astrocytes leads to increased frequency of synaptic currents in cortical neurons of wild-type mice.
(a) Representative traces (3 s) of synaptic currents recorded from a wild-type neuron before (top) and after (bottom) puffer application of 500 μM TFLLR to the astrocyte. (b) The corresponding time line for wild-type synaptic current frequency with the time of application indicated by the black bin. The colored asterisks denote the bins where the peak frequency occurred for each respective recording color-coded in c, d and f. (c) The cumulative results from wild-type color-coded recordings showing the pre- and post-application event frequencies (mean ± SD, n = 10 recordings, p=0.004, 3 males and 2 females, Wilcoxon matched-pairs signed rank test, two-tailed). (d) The fold change for the individual color-coded recordings. (e) Amplitude histograms for pooled recordings measured before (black) and after (gray) TFLLR application. (f) The fold change in mean event amplitude ± SD for each color-coded recording.
Figure 5
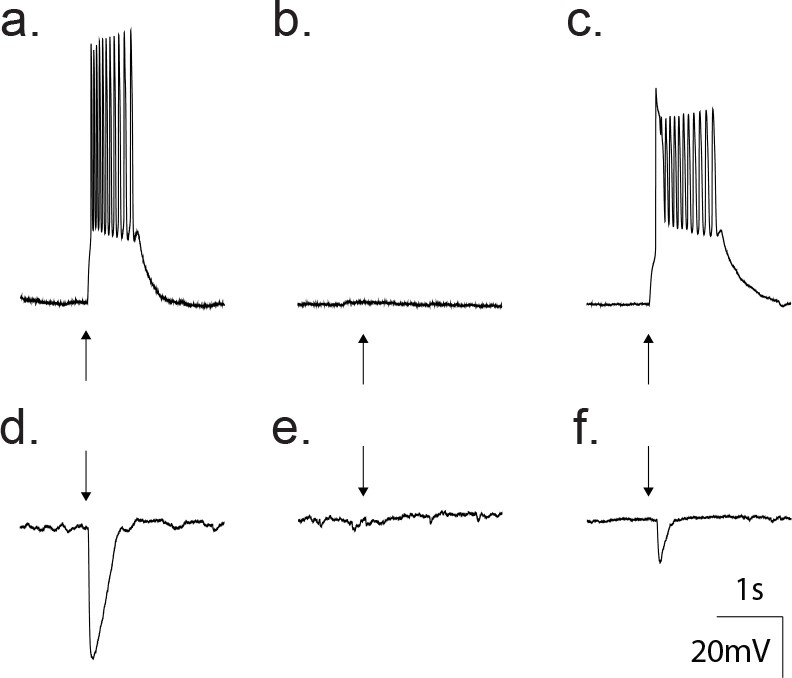
Gramicidin perforated patch whole cell recordings from a cortical neuron confirm GABA as an excitatory transmitter at this developmental age.
(a) Current clamp traces showing that direct application of 50 μM GABA (arrow) depolarized the neuron from −80 mV to threshold for action potentials. (b) Treatment with 20 μM gabazine blocked the GABA response. (c) Wash out of gabazine restored the ability of GABA to depolarize. (d) Current clamp traces where the membrane potential was set to 0 mV. Application of 50 μM GABA (arrow) produced a hyperpolarization. (e) The hyperpolarization was blocked by treatment with 20 μM gabazine. (f) Wash out of gabazine restored the ability of GABA to hyperpolarize the neuron.
Figure 6 with 2 supplements
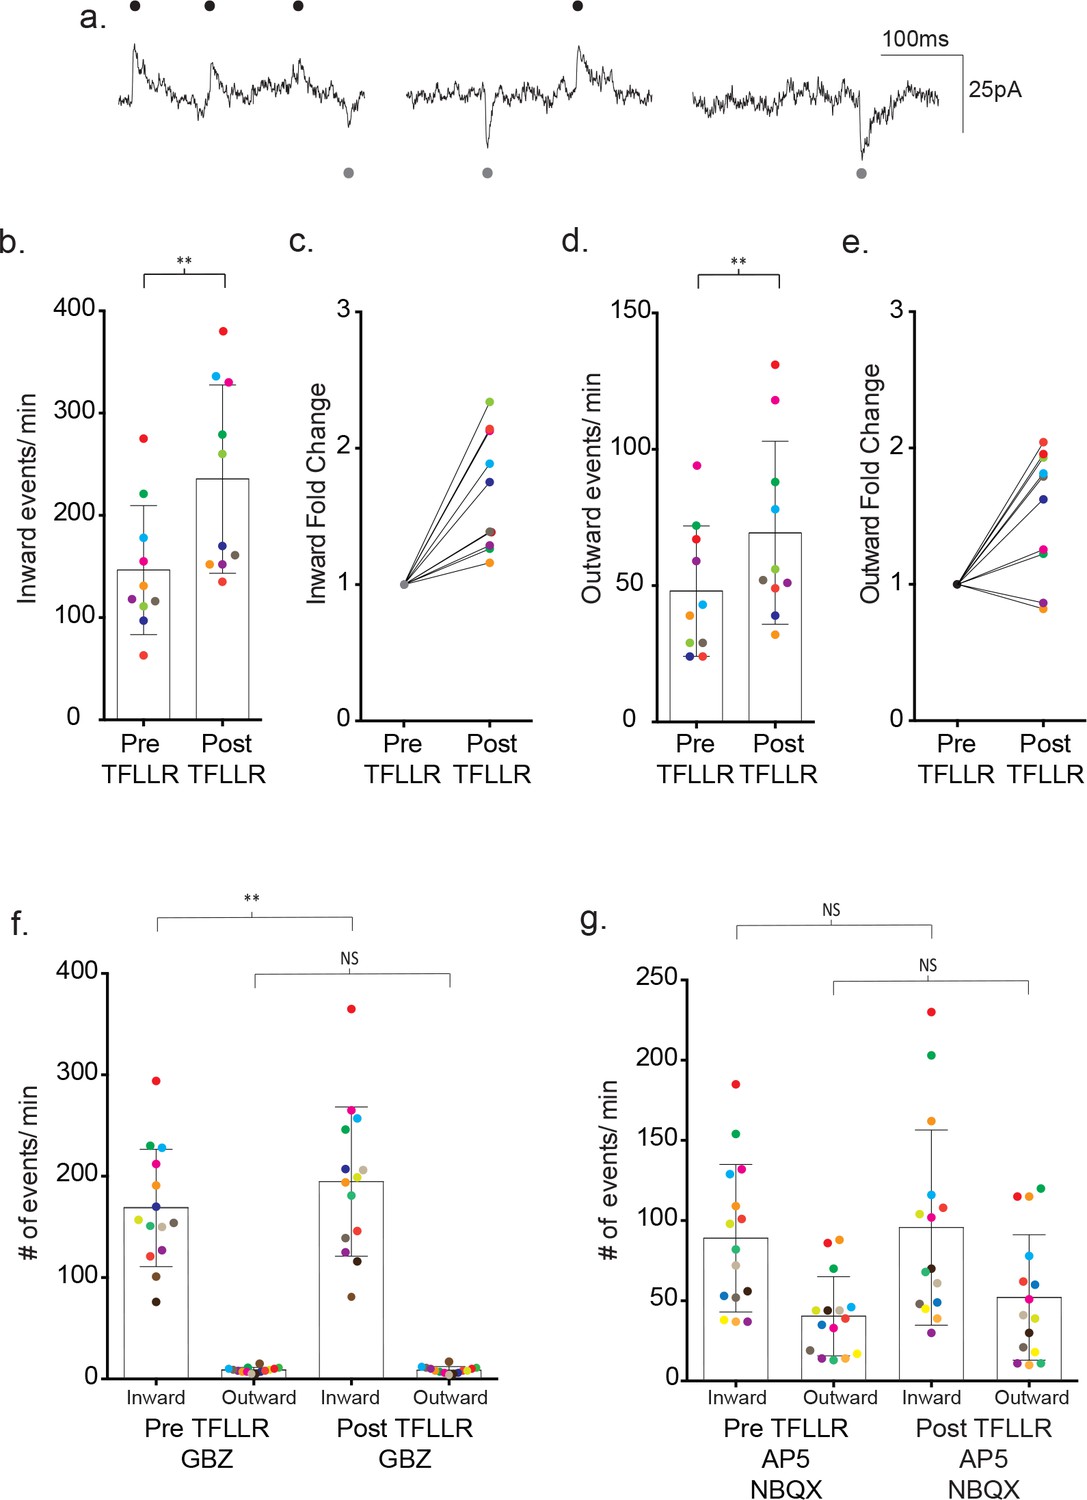
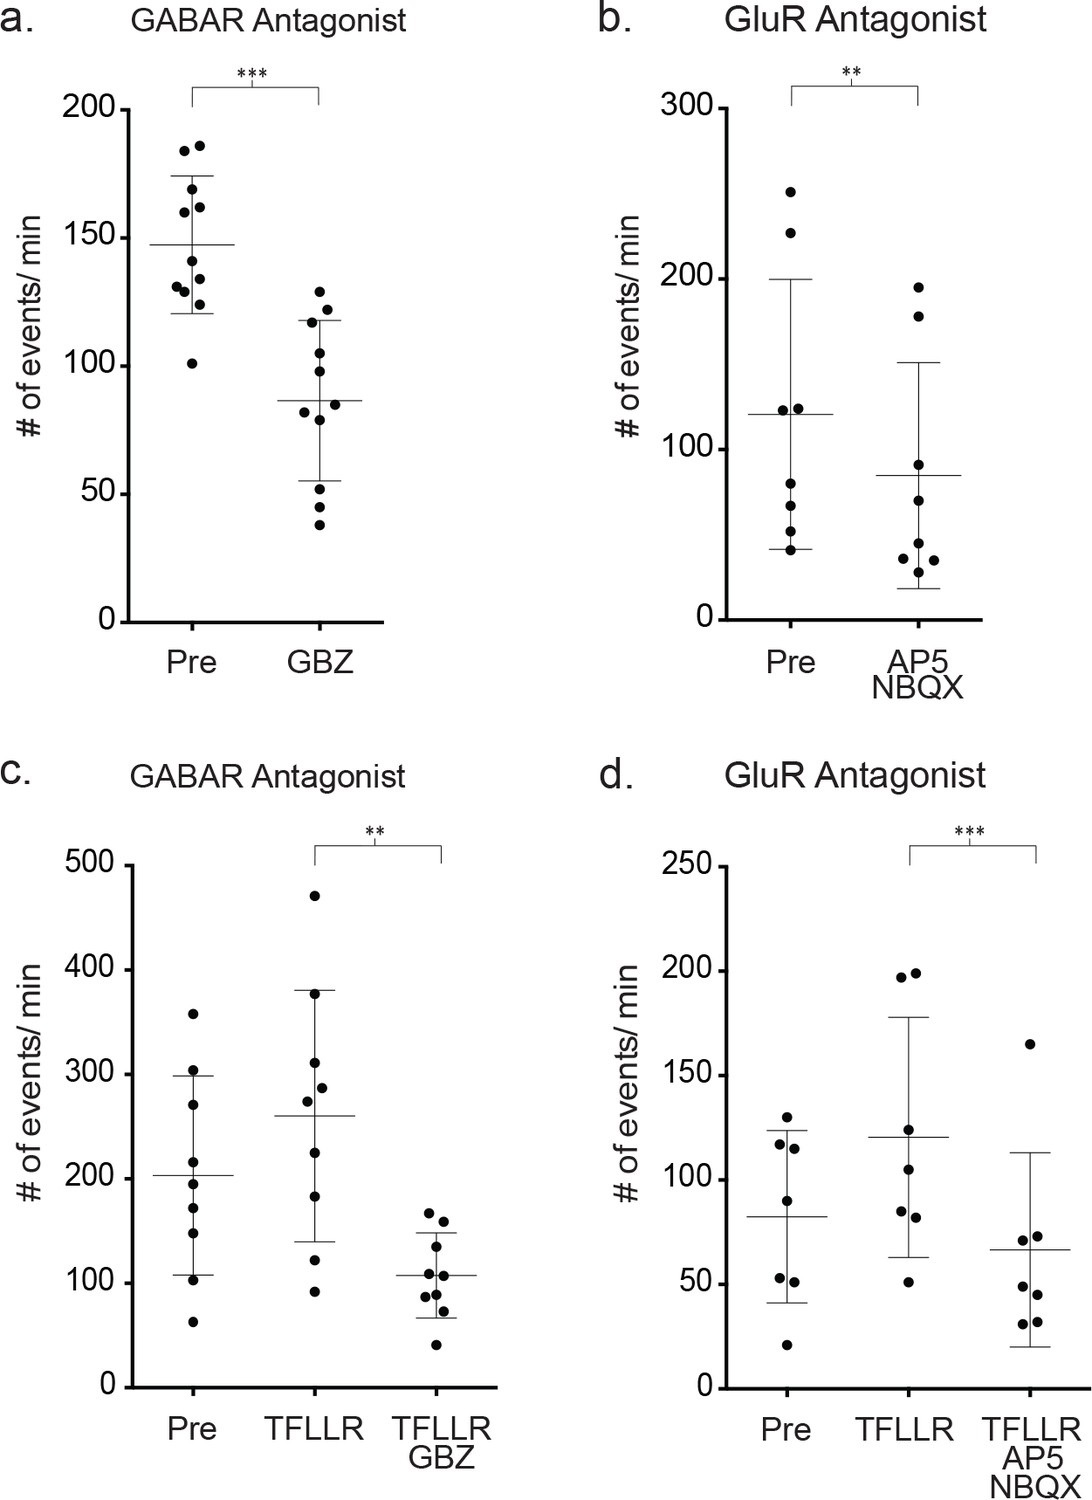
Bi-directional currents reveal the individual contributions of GABAergic and glutamatergic signaling.
(a) Low chloride internal solution produces inward and outward currents in cortical neurons when held at −35 mV. Three 300 ms representative traces are shown. (b) The frequency of inward events is quantified for each color-coded recording before and after 500 μM TFLLR application, (mean ± SD, p=0.002, n = 10 recordings, 3 males and 2 females, Wilcoxon matched-pairs signed rank test, two-tailed). (c) The corresponding fold change for the individual color-coded recordings. (d) The frequency of outward events for each color-coded recording before and after 500 μM TFLLR application, (mean ± SD. p=0.009, n = 10, 3 males and 2 females, Wilcoxon matched-pairs signed rank test, two-tailed). (e) The fold change for the individual color-coded recordings. (f) The frequency of inward and outward events before and after 500 μM TFLLR application in the presence of 20 μM gabazine (GBZ)(inward currents: p=0.004, n = 14 recordings; outward currents: p=0.732, n = 14, 2 males and 2 females Wilcoxon matched-pairs signed rank test, two-tailed). Individual recordings are color-coded. (g) Frequency of inward and outward events before and after 500 μM TFLLR application in the presence of 50 μM AP5 and 5 μM NBQX (inward currents: p=0.61, n = 15 recordings; outward currents: p=0.124, n = 15, 2 males and 3 females Wilcoxon matched-pairs signed rank test, two-tailed). Box and bars indicate the mean ± SD respectively.
Figure 6—figure supplement 1
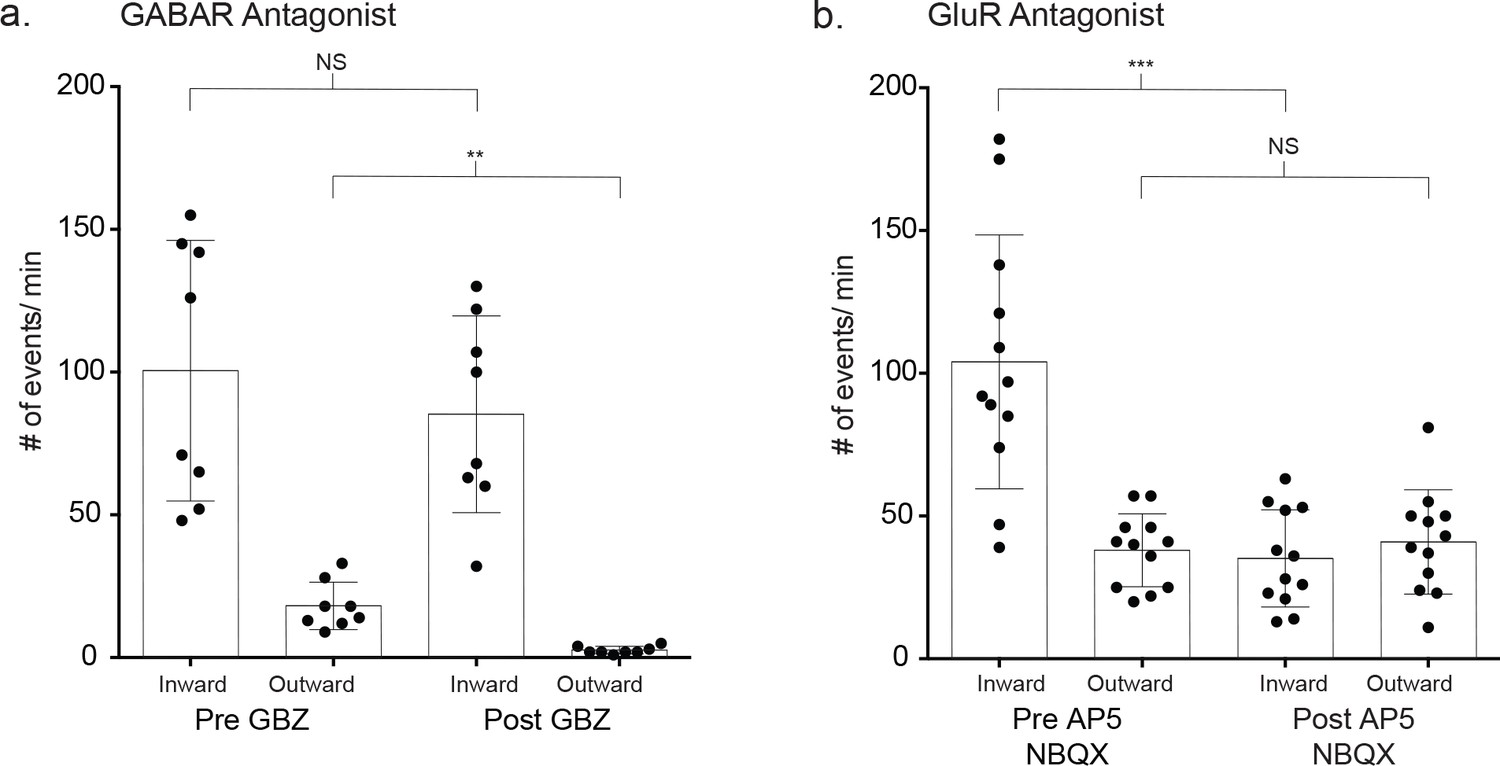
Pharmacological identification of basal, non-stimulated inward and outward currents.
(a) The baseline event frequency was determined for a 60 s pretreatment period. Slices were incubated in 20 μM gabazine (GBZ) for 10 m and the frequency of outward and inward events was measured (outward: p=0.008, inward: p=0.117, n = 8, 2 males and 1 females, Wilcoxon matched-pairs signed rank test, two-tailed). (b) Similar testing for GluR receptor currents using the inhibitors AP5 (50 μM) and NBQX (5 μM) (inward: p=0.0005, outward: p=0.386, n = 12 recordings, 2 males and 2 females, Wilcoxon matched-pairs signed rank test, two-tailed).
Figure 6—figure supplement 2
- Effects of GABAR and GluR inhibitors on the frequency of both basal and TFLLR- mediated inward synaptic currents using symmetrical chloride.
(a,b) The decrease in basal event frequency following incubation in 20 μM gabazine for 10 min (p=0.001, n = 11, 2 male, 1 female; Wilcoxon matched-pairs signed rank tests) and following incubation in GluR receptor inhibitors AP5 (50 μM) and NBQX (5 μM) (p=0.008, n = 8 recordings, 2 male and 1 female). (c,d) The effect of gabazine (GBZ) (p=0.004, n = 9 recordings, 1 male and 2 female) and AP5 (50 μM) and NBQX (5 μM) (p=0.0156, n = 7 recordings, 1 male and 1 female) on TFFLR stimulated changes in inward synaptic current frequency. TFFLR was first puffer applied and the increase in frequency determined. Then, TFLLR application was repeated following a 10 min incubation period in the receptor specific antagonists and the Wilcoxon matched-pairs signed rank test was used to determine significance . In these experiments the inhibitor was included along with TFLLR in the puffer pipette.
Figure 7
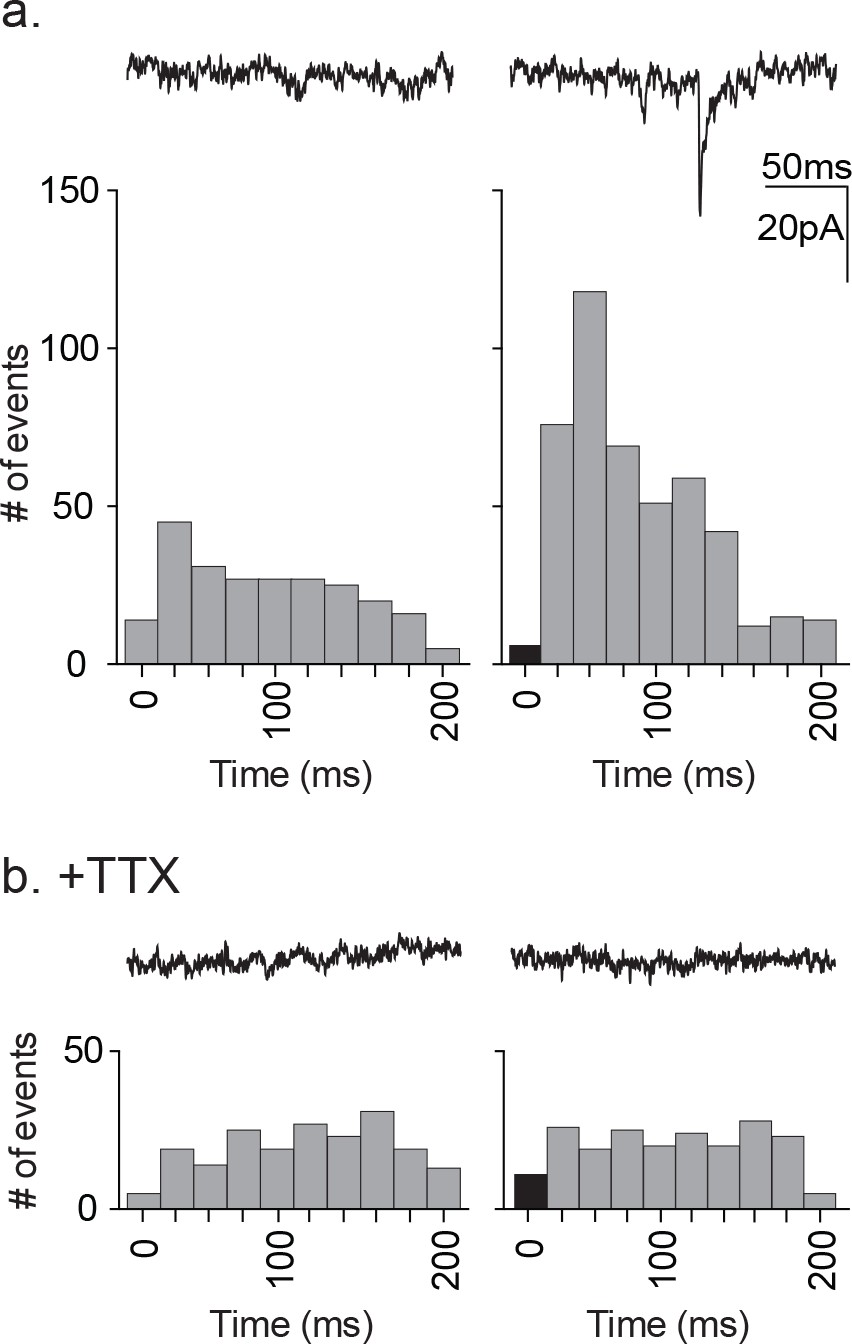
Distribution of time-locked neuronal events in response to astrocyte depolarization.
(a) Two 200 ms representative traces are shown, left: pre-depolarization; right: post-depolarization. Sample frequency histograms from a single recording showing the timing of synaptic events recorded over a 200 ms period prior to (left) and after (right) the astrocyte depolarization (a single 20 ms voltage step to +60 mV). Event number is based on 20 ms bins. Data represents accumulated events from 100 trials, each separated by 1 s (n = 15 neurons, 4 males and 5 females). (b) Two 200 ms representative traces are shown, left: pre-depolarization, right: post-depolarization. Sample frequency histograms from a single recording made in the presence of 1 μM TTX (left: pre-depolarization, right: post-depolarization; n = 6 neurons, 2 males and 1 female). Recordings were taken at −100 mV and with symmetrical chloride internal solution.
Figure 8 with 2 supplements
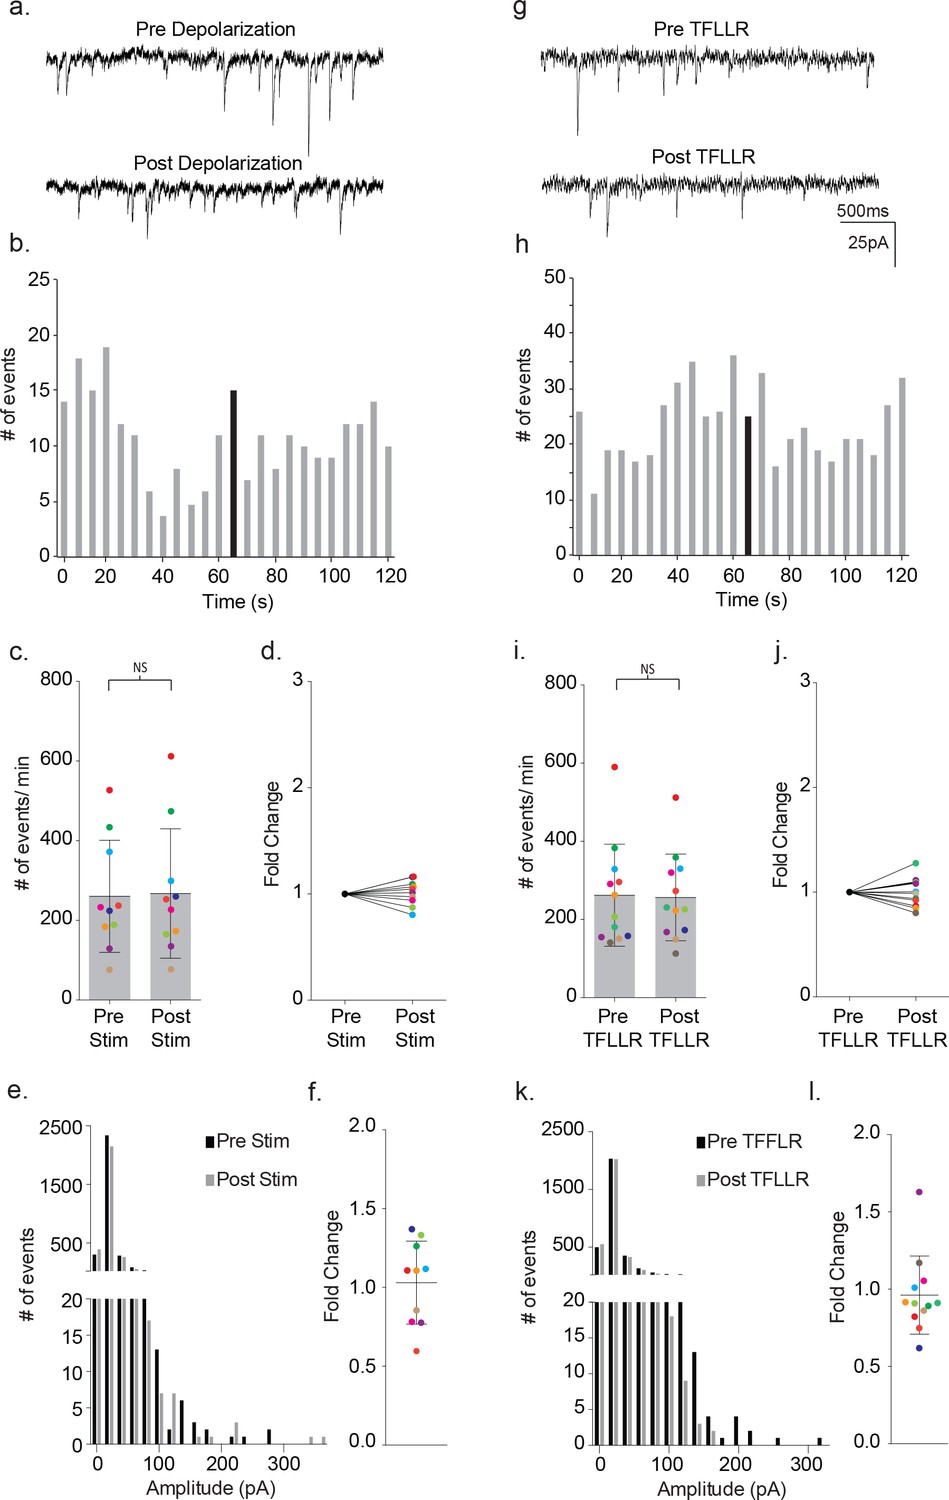
Astrocyte-mediated modulation of neuronal signaling is absent in MeCP2-deficient mice.
(a) Representative traces (3 s) of synaptic currents recorded from a MeCP2 null neuron before (top) and after (bottom) administrating to the MeCP2 null astrocyte 20, 10 ms steps to +60 mV. (b) The corresponding temporal sequence for MeCP2 null synaptic currents 60 s prior to and 60 s following astrocyte depolarization. Time of stimulation is indicated by the black bin. (c) The results from ten color-coded MeCP2 null recordings (mean ± pre and post-stimulus event frequencies. p=0.57, n = 10, 8 males, Wilcoxon matched-pairs signed rank test, two-tailed). (d) The fold change in mean event frequency for the individual color-coded recordings. (e) Amplitude histograms for pooled recordings measured before (black) and after (gray) astrocyte stimulation. (f) The fold change in mean event amplitude for each color-coded recording (mean ± SD). (g, h) Complementary sample recordings, time course histograms obtained from MeCP2 null male mice using TFLLR application. (i) The results from 12 color-coded MeCP2 null recordings pre and post TFLLR application (mean ± SD, p=0.68, n = 12, 5 males, Wilcoxon matched-pairs signed rank test, two-tailed). (j) The fold change in mean event frequency for each color-coded recordings. (k) Amplitude histograms for pooled recordings measured before (black) and after (gray) astrocyte stimulation. (l) The fold change in mean event amplitude for each color-coded recording (mean ± SD). All recordings were performed using symmetrical trans-membrane chloride concentrations.
Figure 8—figure supplement 1
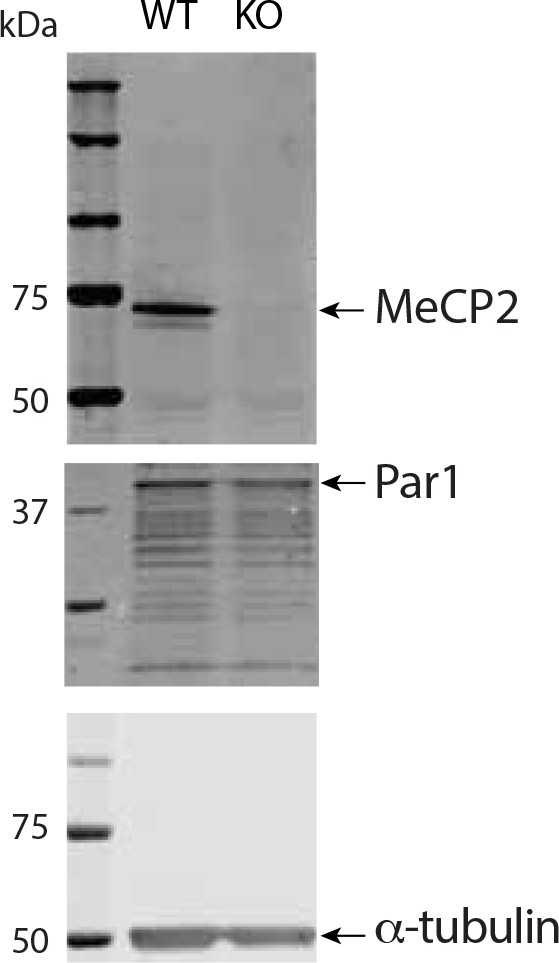
Western blot showing Par1 immunoreactivity in cortical lysates and similar Par1 levels in wild-type and MeCP2 null cortex.
Equal amounts of protein (40 μg) from wild-type and MeCP2 null cortical lysates were separated and probed for MeCP2 and Par1 epitopes. α-τubulin served as a loading control. α-τubulin and Par1 staining was performed on the same blot, but the blot was cut for simultaneous staining. MeCP2 staining was from the same lysate as that used for α-τubulin and Par1, but the lysate was run on a different gel for the blot.
Figure 8—figure supplement 2
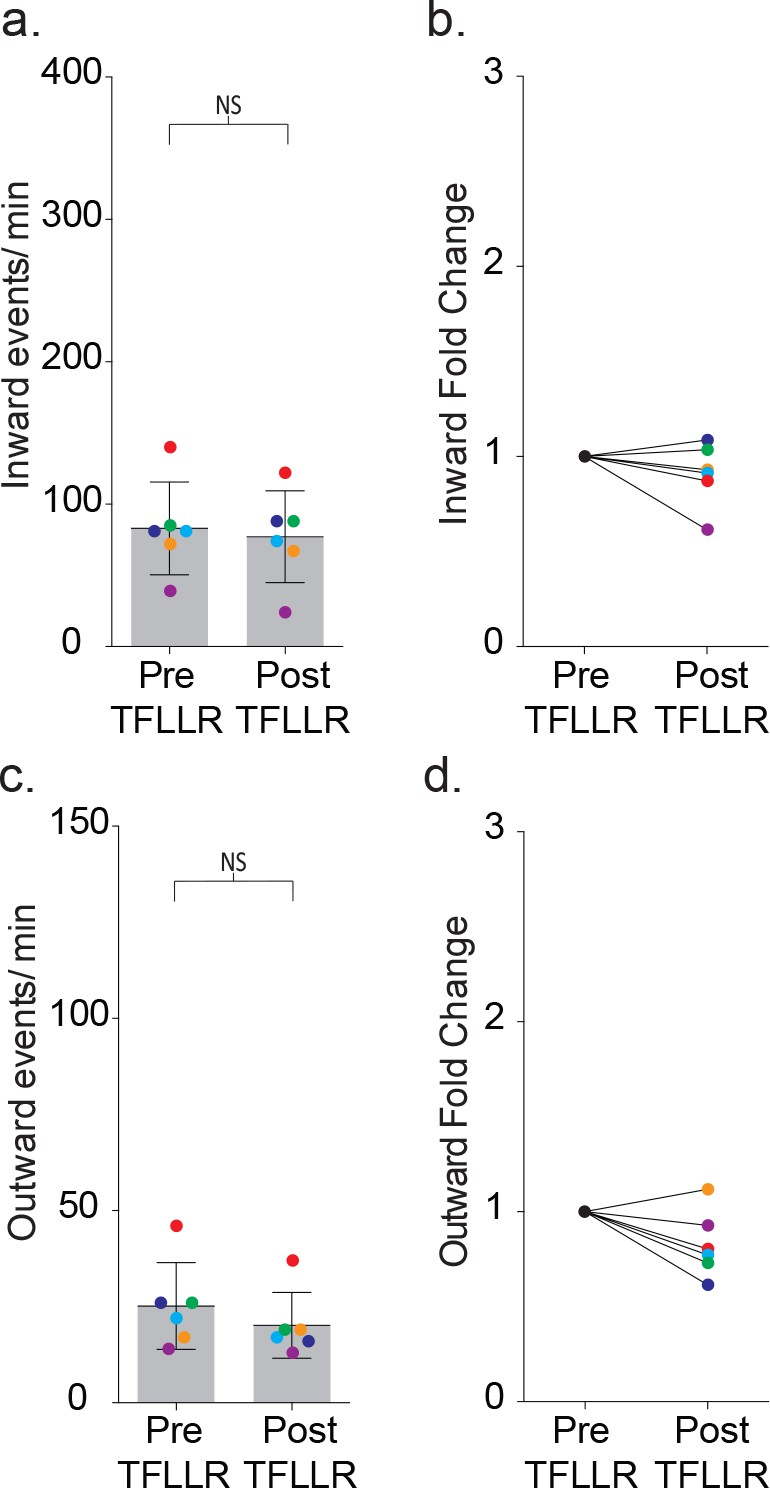
The relative contributions of inward and outward currents following TFLLR activation in MeCP2 null barrel cortex.
Low intracellular chloride concentrations were used while neurons were held at −35 mV. (a) The frequency of inward events was quantified before and after 500 μM TFLLR application (mean ± SD, p=0.25, n = 6, 2 males, Wilcoxon matched-pairs signed rank test, two-tailed). (b) The fold change in event frequency is shown for individual color-coded recordings. (c) The frequency of outward events was quantified before and after 500 μM TFLLR application (mean ± SD. p=0.09, n = 6, 2 males, Wilcoxon matched-pairs signed rank test, two-tailed). (d) The fold change in event frequency for the individual color-coded recordings.
Figure 9
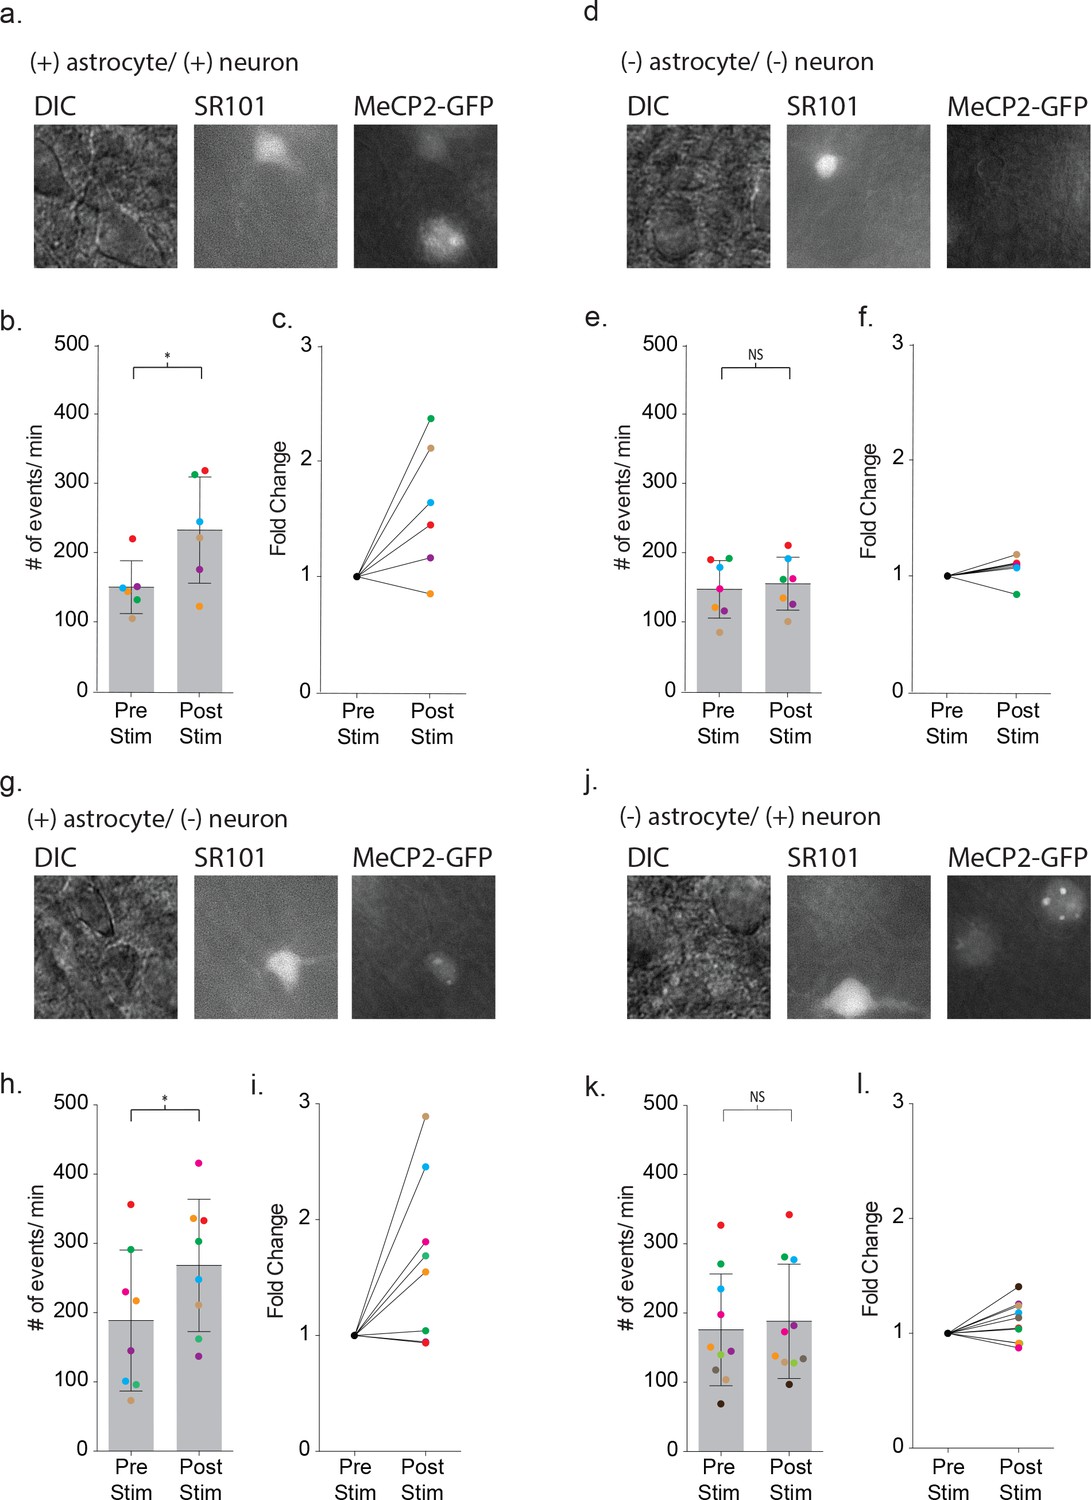
Defective signaling in astrocyte-neuron pairs results from the MeCP2 null astrocytes and not the neurons.
(a) Images shown the DIC image (left), SR101 + astrocyte (middle) and GPF + astrocyte and GFP + neuron (right). (b) The mean ± SD event frequency for each color-coded neuron recording pre and post depolarization of the astrocyte (p=0.04, n = 6, 4 females, Paired t test, two-tailed). (c) The fold changes in event frequency for each color-coded pair following depolarization. (d–f) Data obtained from GFP - astrocytes and GFP - neuron color-coded recordings (p=0.24, n = 7, 5 females, Paired t test, two-tailed). (g–i) Data obtained from GFP + astrocyte and GFP - neuron color-coded recordings (p=0.02, n = 8, 5 females, Paired t test, two-tailed). (j–l) Data obtained from GFP - astrocytes and GFP + neuron color-coded recordings (p=0.1176, n = 10, 6 females, Paired t test, two-tailed).
Figure 10
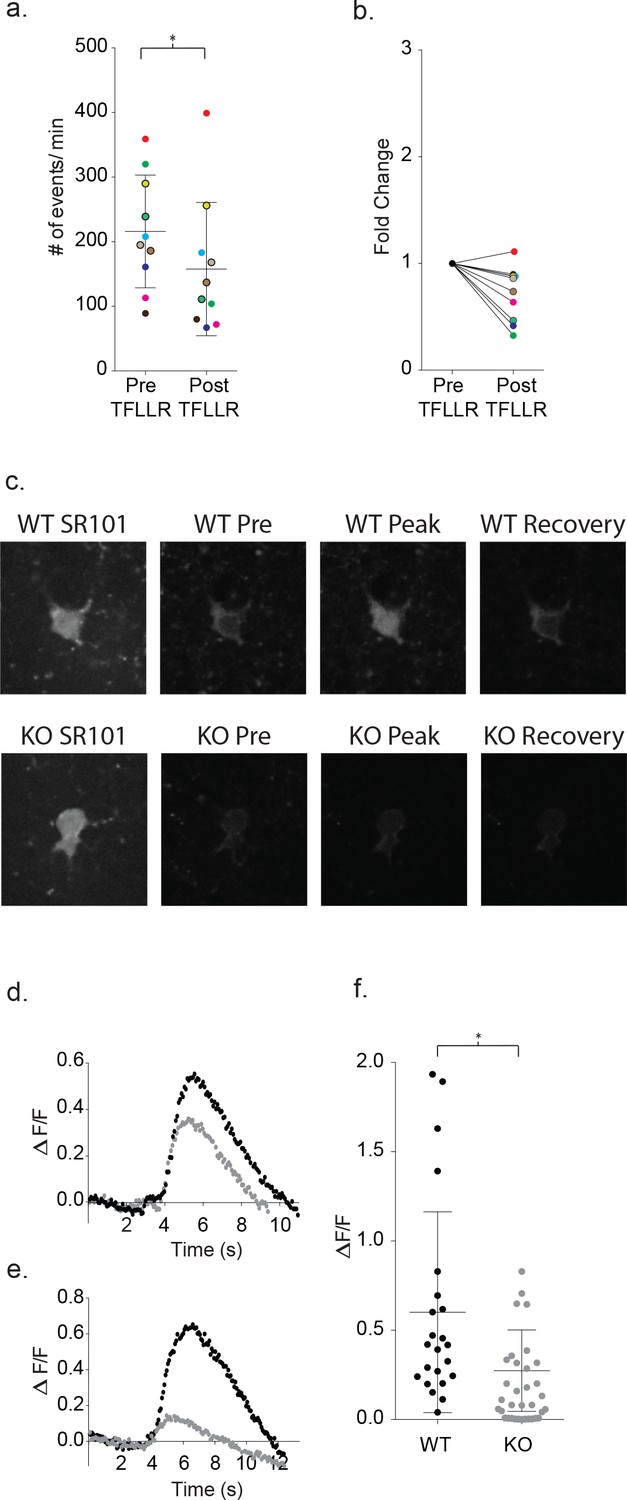
Increased astrocyte calcium is required for neuronal signaling and is blunted in Mecp2 deficient astrocytes.
(a) Clamping calcium to low intracellular levels prevents the TFLLR astrocyte-mediated increase in neuronal event frequency. Six of the recordings were made in 10 mM free BAPTA recordings and four in the calcium BAPTA buffer (black outlined circles). The mean event frequency from each color-coded recording, pre- and post-application of 500 μM TFLLR (p=0.02, n = 10, 2 males and 2 females, Wilcoxon matched-pairs signed rank test, two-tailed). (b) The fold change for each of the color-coded recordings. (c) Images showing SR101 labeled wild-type (top; WT) and Mecp2 null (lower; KO) astrocytes loaded with the calcium indicator fluo4FF-AM. Selected images of calcium responses corresponding to before the peak response and after recovery from 500 μM TFLLR application. (d, e) Two sample data sets showing ΔF/F0 measurements from wild-type astrocytes (black) and MeCP2 null astrocytes (gray) during a round of TFLLR application. The top sample reflects one of the strongest null responders and the bottom sample is representative of the overall mean. The time courses for wild-type and null recordings are similar and the dip below baseline following recovery reflects the time-dependent bleaching of the calcium indicator. (f) The scatterplot of ΔF/F0 for individual recordings comparing wild-type (mean ΔF/F0 = 0.60 ± 0.56, n = 23, 5 males and 4 females) and MeCP2 null recordings (mean ΔF/F0 = 0.27 ± 0.23, n = 23, 8 males; p=0.012, Mann Whitney test, two-tailed). Only those MeCP2 null astrocytes that responded to TFLLR were included in the statistical analysis. Mean +/- SD for the overall data are indicated.
Figure 11 with 1 supplement
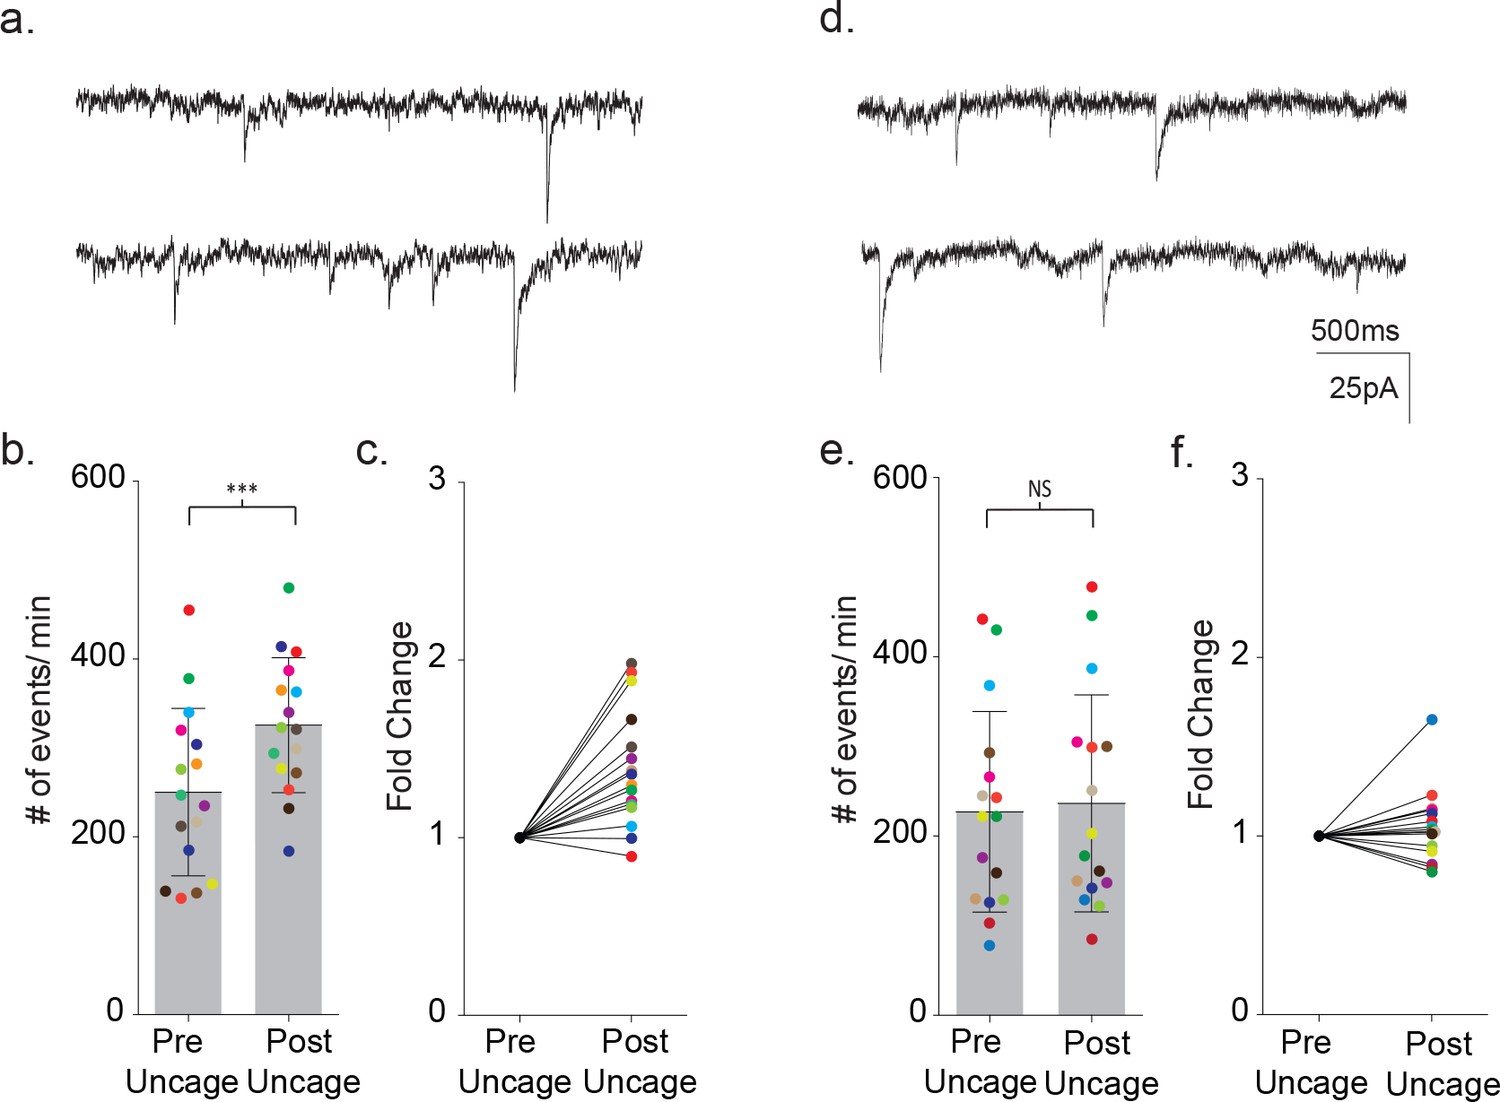
Uncaging intracellular calcium does not rescue astrocyte-neuron signaling.
(a) Sample recordings (3 s) from a neighboring cortical neuron before (upper) and after (lower) flash uncaging of intracellular calcium in the astrocyte. (b) The scatterplot of pre- and post-flash color-coded responses showing the mean ± SD (p=0.0003, n = 16, 3 males and two female, Wilcoxon matched-pairs signed rank test, two-tailed). (c) The associated fold change in event frequency for each of the color-coded recordings. (d–f) Measurements made from MeCP2 null neurons when MeCP2 null astrocytes were loaded with caged calcium showing, in all but one recording, no significant increase in neuronal event frequency upon uncaging of calcium (p=0.23, n = 16, four males Wilcoxon matched-pairs signed rank test, two-tailed).
Figure 11—figure supplement 1
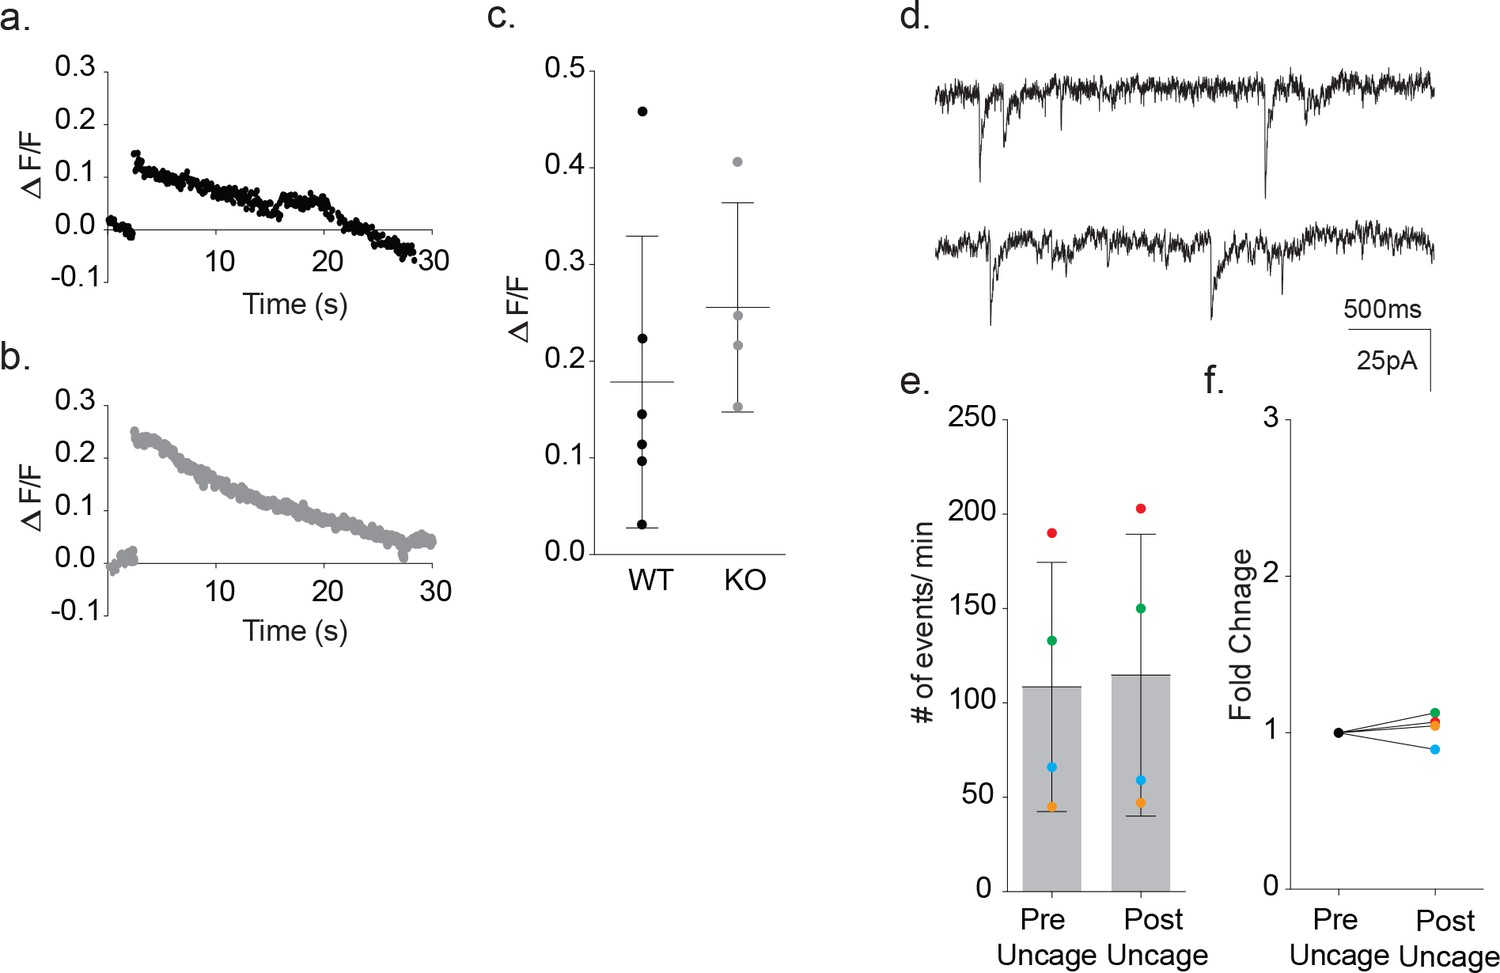
Fluo4FF-AM calcium imaging of astrocytic somatic calcium signals (ΔF/F0) from photolysis of DMNP-EDTA caged calcium in wild-type and MeCP2 null slices.
Slices were incubated in Fluo4FF-AM and DMNP-EDTA caged calcium was subsequently loaded in the astrocyte via patch pipette. (a) Representative calcium signal from photolysis at 2 s in wild-type astrocyte (black). (b) Representative calcium signal from photolysis at 2 s in MeCP2-null astrocyte (gray). (c) Cumulative data showing photolysis protocol effectively increased the somatic calcium levels for both wild-type (ΔF/F0 = 0.18 ± 0.06, n = 6, 2 males) and MeCP2 null (ΔF/F0 = 0.26 ± 0.05, n = 4, 1 male) recordings. (d) Representative traces before and after photolysis of an astrocyte loaded with an empty DMNP-EDTA cage. (e) Individual color-coded imaging showing frequency of events before and after uncaging with empty cage (1 male). (f) Fold change in event frequency in astrocytes loaded with empty cage.
Additional files
-
Transparent reporting form
- https://doi.org/10.7554/eLife.31629.019
Download links
A two-part list of links to download the article, or parts of the article, in various formats.
Downloads (link to download the article as PDF)
Open citations (links to open the citations from this article in various online reference manager services)
Cite this article (links to download the citations from this article in formats compatible with various reference manager tools)
Astrocytic modulation of excitatory synaptic signaling in a mouse model of Rett syndrome
eLife 7:e31629.
https://doi.org/10.7554/eLife.31629


