Hedgehog signaling via Gli2 prevents obesity induced by high-fat diet in adult mice
- Washington University School of Medicine, United States
Figures
Figure 1
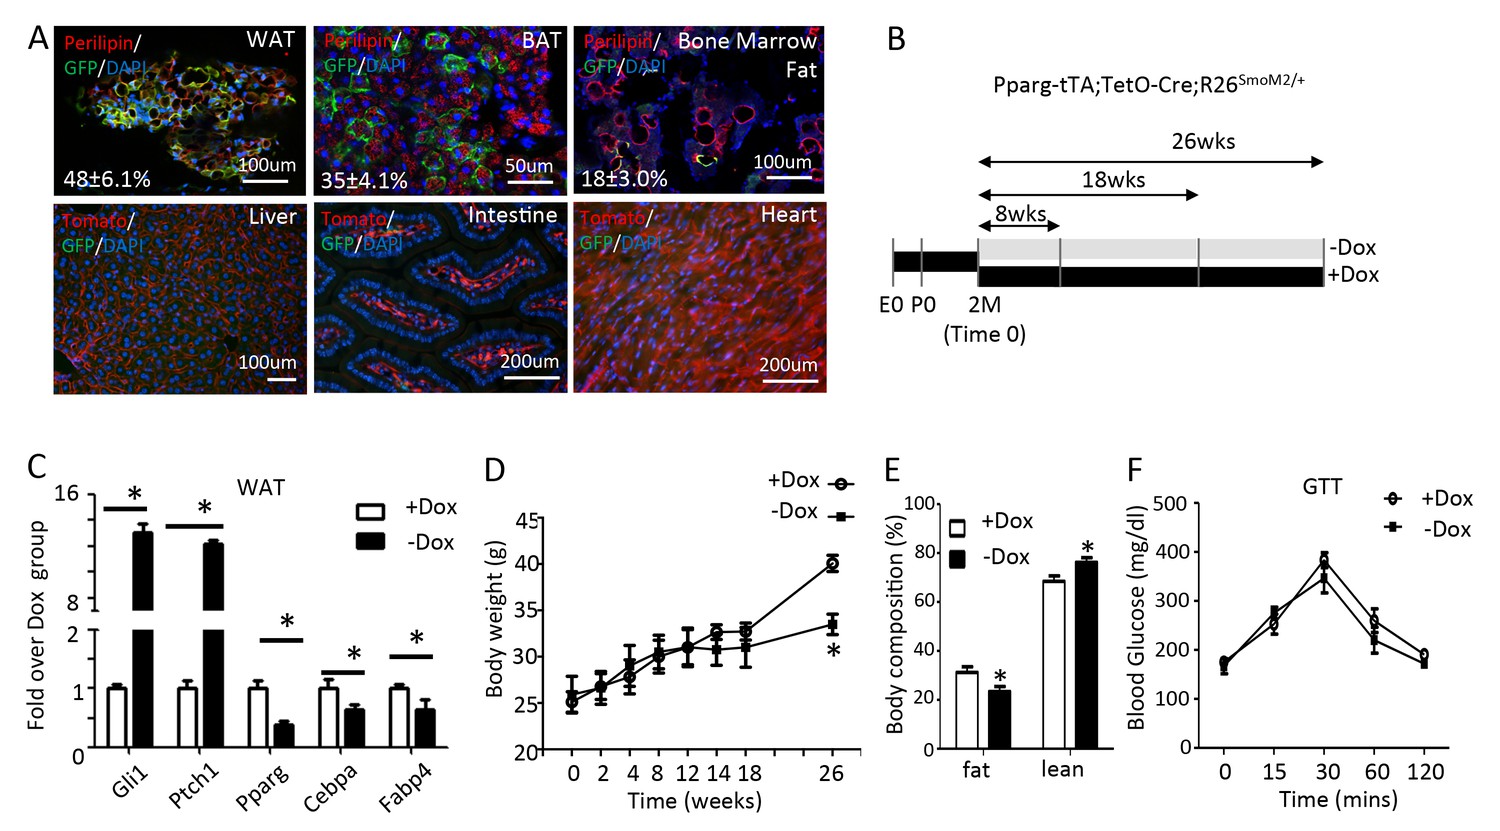
Long-term activation of Smo reduces fat accumulation without altering glucose metabolism in mice on regular chow diet.
(A) Pparg-tTA targets adipose tissues in adult mice. Pparg-tTA;TetO-Cre;mT/mG mice were analyzed after two months of Dox withdrawal starting at two months of age. GFP and perilipin were detected by immunofluorescence staining whereas tdTomato fluorescence was visualized directly on frozen sections of adipose tissues. Percentage of adipocyte targeted indicated for each fat depot. DAPI stains DNA. WAT: white adipose tissue (gonadal fat); BAT: brown adipose tissue (interscapular fat). (B) Experimental design for activating Smo in adipose tissue of adult mice. E0: embryonic day 0; P0: postnatal day 0; 2M: 2 months of age. (C) Expression of adipogenic genes in WAT after 8 weeks of Dox regimen. (D) Measurements of body weights at different time points of Dox regimen. (D, E) Body composition (D) and GTT (E) after 26 weeks of Dox. *p<0.05, n = 5 mice, males. Females show similar results.
Figure 2 with 3 supplements

Smo activation prevents obesity and improves glucose metabolism in mice on high fat diet.
(A) A schematic for experimental design. (B) Representative images after 8 weeks on HFD. (C) Measurements of body weight. (D) Body composition after 8 weeks on HFD. (E, F) Whole-mount images (upper) and histology (lower) of gonadal white fat (E) or interscapular brown fat (F) after 8 weeks on HFD. (G) Detection of bone marrow fat by perilipin immunofluorescence staining after 8 weeks on HFD. Boxed regions shown at higher magnification in insets. (H, I) Gene expression by qPCR in WAT (H) and BAT (I) after 8 weeks on HFD. (J) Gli1 expression in different tissues after 8 weeks on HFD. (K, L) Glucose tolerance test (GTT) (K) and insulin tolerance test (ITT) (L) after 8 weeks on HFD. *p<0.05, n = 5 mice, females. Males show similar results. Black scale bar: 100 μm; white scale bar: 200 μm.
Figure 2—figure supplement 1
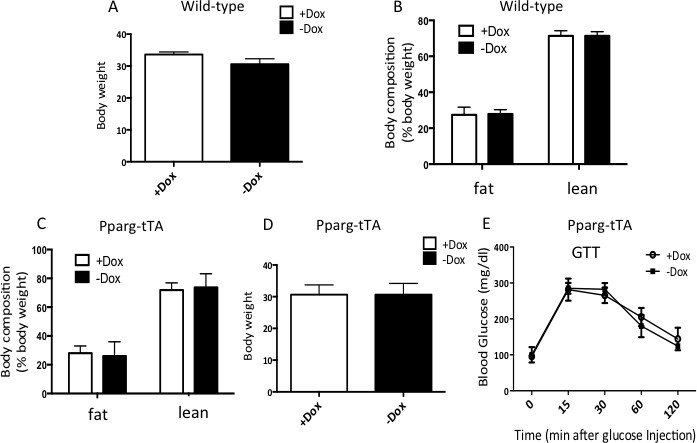
No obvious effect for Dox or Pparg-tTA alone on whole body metabolism.
(A–B) Body weight (A) and body composition (B) of wild-type mice (C57BL/6) fed with HFD and with or without Dox water starting at 2 months of age for two additional months. N = 3, males. (C–E) Body composition (C), body weight (D) and GTT (E) of Pparg-tTA mice raised on Dox from conception till 2 months of age before being fed with HFD and with or without Dox water for two additional months. N = 3, males.
Figure 2—figure supplement 2
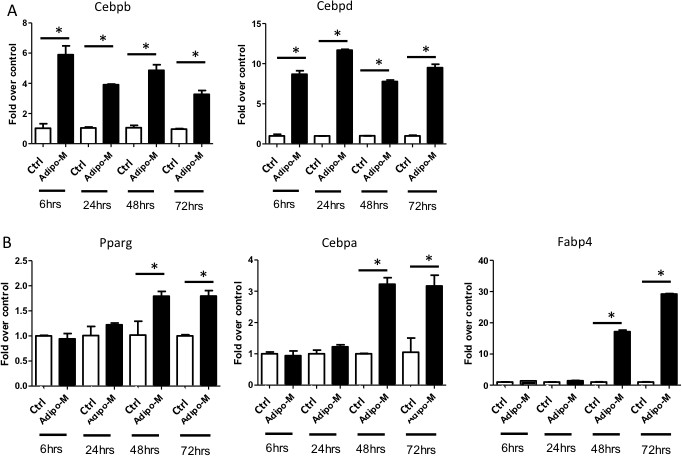
Characterization of adipogenesis in M2 cells.
The mRNA levels of early (A) and late (B) adipogenic genes were determined by qPCR from 6 hr through 72 hr in response to the adipogenic media (AdipoM) versus the growth media (Ctrl). 18S was used as the internal control. *p<0.05, n = 3 (biological replicates).
Figure 2—figure supplement 3
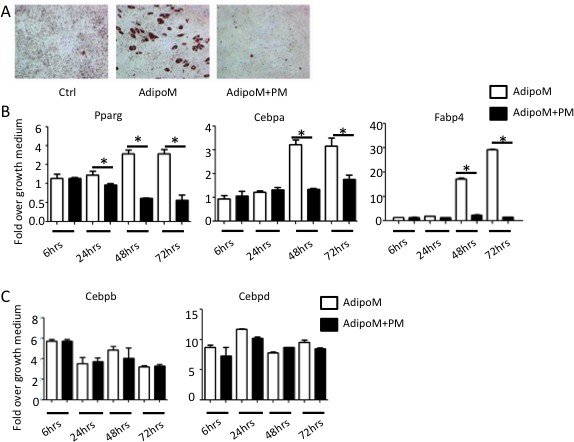
Hh signaling suppresses adipogenesis in M2 cells.
(A) Representative images of oil red O staining in M2 cells cultured in AdipoM with or without PM. (B, C) PM suppresses expression of Pparg, Cebpa and Fabp4 but not Cebpb or Cebpd. 18S was used as the internal control for all qPCR analyses. *p<0.05, n = 3 (biological replicates).
Figure 3 with 1 supplement

Gli2 mediates Hh inhibition of adipogenesis.
(A) Effects of Gli2 knockdown on the suppression of adipocyte marker genes by purmorphamine (PM). qPCR data normalized to 18S rRNA. (B) Effects of Gli1-3 knockdown on oil red O staining. Quantification was shown for number of positive cells per area. (C) Expression of adipocyte marker genes in R26ΔNGli2/+ MEF infected with Ad-Cre or Ad-GFP. (D) Quantification of oil red O staining in R26ΔNGli2/+ MEF infected with Ad-Cre or Ad-GFP. AdipoM: adipogenic medium. *p<0.05, n = 3.
Figure 3—figure supplement 1
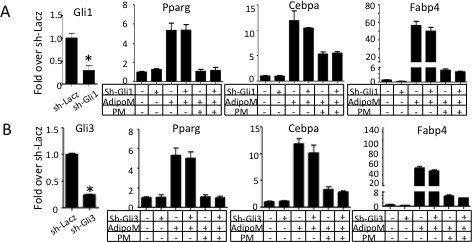
Knockdown of either Gli1 or Gli3 does not blunt the anti-adipogenic effect of PM.
RT-qPCR analyses in M2 cells with either Gli1 (A) or Gli3 shRNA knockdown (B). sh-LacZ was used as negative control. AdipoM: adipogenic media. PM: purmorphamine. qPCR data normalized to 18S rRNA. *p<0.05, n = 3.
Figure 4
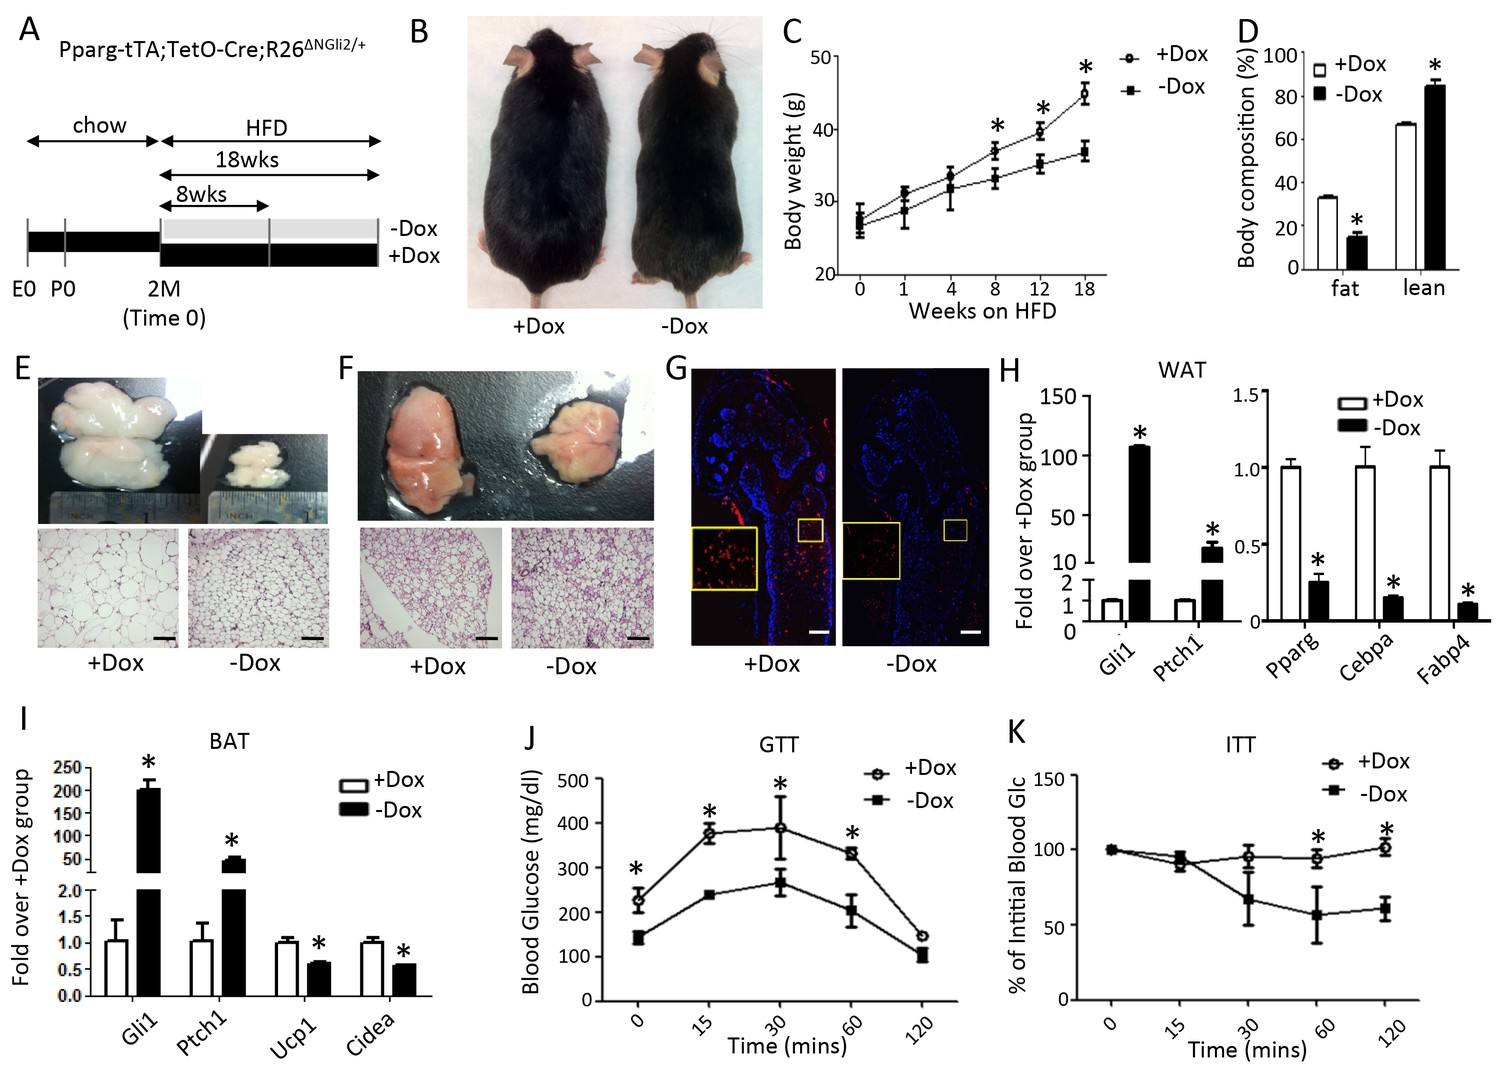
Constitutively active Gli2 prevents HFD-induced obesity and improves glucose metabolism.
(A) A schematic for experimental design. E0: embryonic day 0; P0: postnatal day 0; 2M: 2 months of age. (B) Representative images after 8 weeks of HFD. (C) Measurements of body weight. (D) Measurements of body composition after 8 weeks of HFD. (E, F) Whole-mount images (upper) and histology (lower) of gonadal white fat (E) or interscapular brown fat (F) after 8 weeks of HFD. (G) Detection of bone marrow fat by perilipin immunofluorescence staining after 8 weeks on HFD. Boxed regions shown at higher magnification in insets. (H, I) Detection of gene expression by qPCR in WAT (G) and BAT (H) after 8 weeks on HFD. (J, K) Glucose tolerance test (GTT) (I) and insulin tolerance test (ITT) (J) after 8 weeks on HFD. *p<0.05, n = 5 mice, males. Females show similar results. Black scale bar: 100 μm; white scale bar: 200 μm.
Figure 5
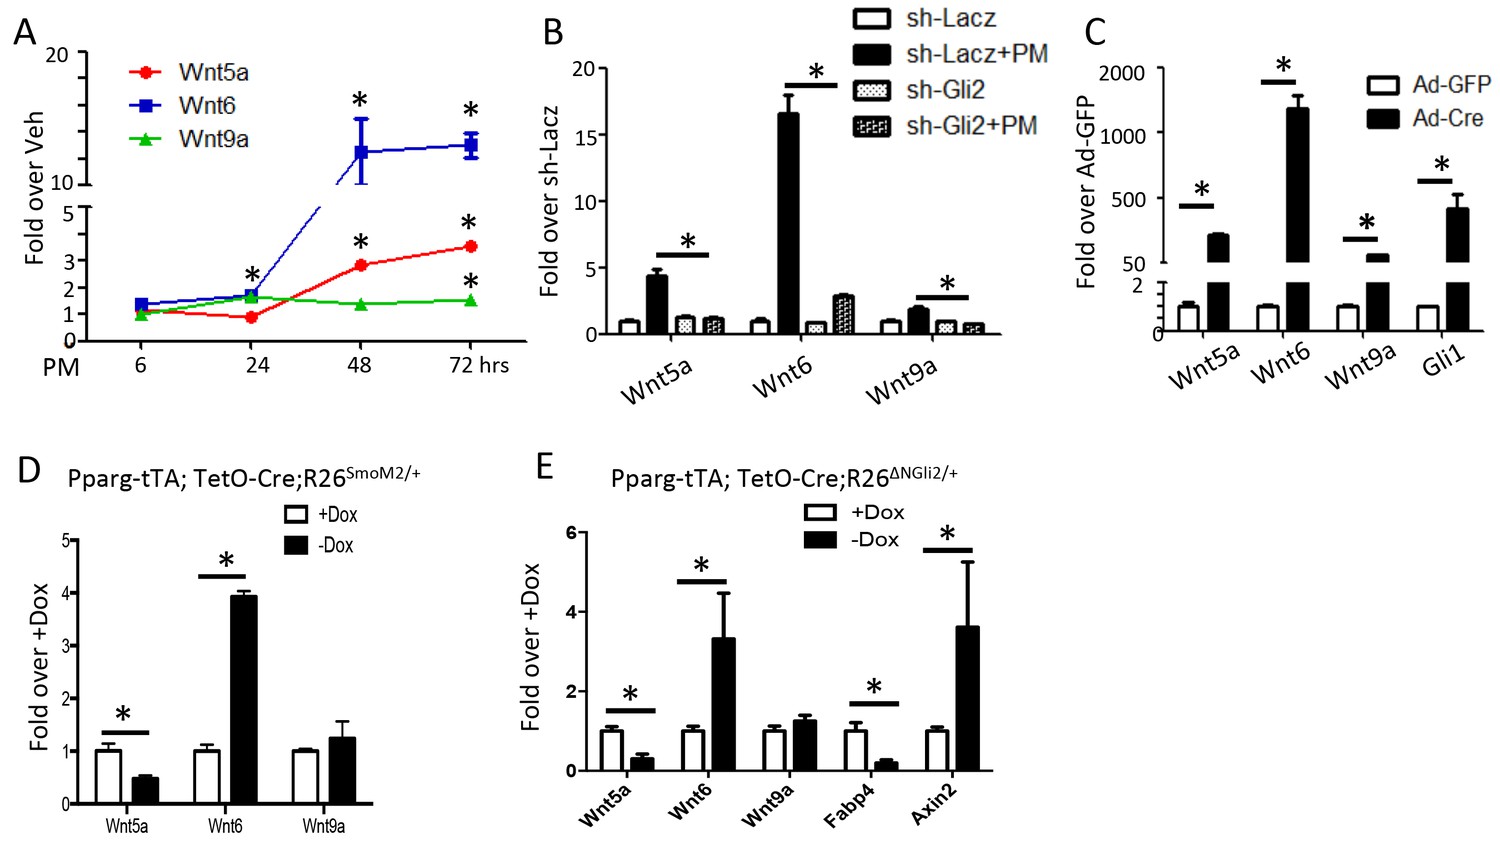
Wnt6 is a potential target of Gli2.
(A–E) qPCR analyses in M2 cells with PM treatment (A), in M2 cells with PM treatment and shRNA knockdown (B), in R26ΔNGli2/+ MEF cells infected with Ad-GFP or Ad-Cre (C), in gonadal fat pat isolated from Pparg-tTA;TetO-Cre;R26SmoM2/+ (D) or Pparg-tTA;TetO-Cre;R26ΔNGli2/+ mice (E) after 8 weeks of HFD with or without Dox. 18S rRNA was used as the internal control for all qPCR analyses. *p<0.05, n = 3.
Figure 6
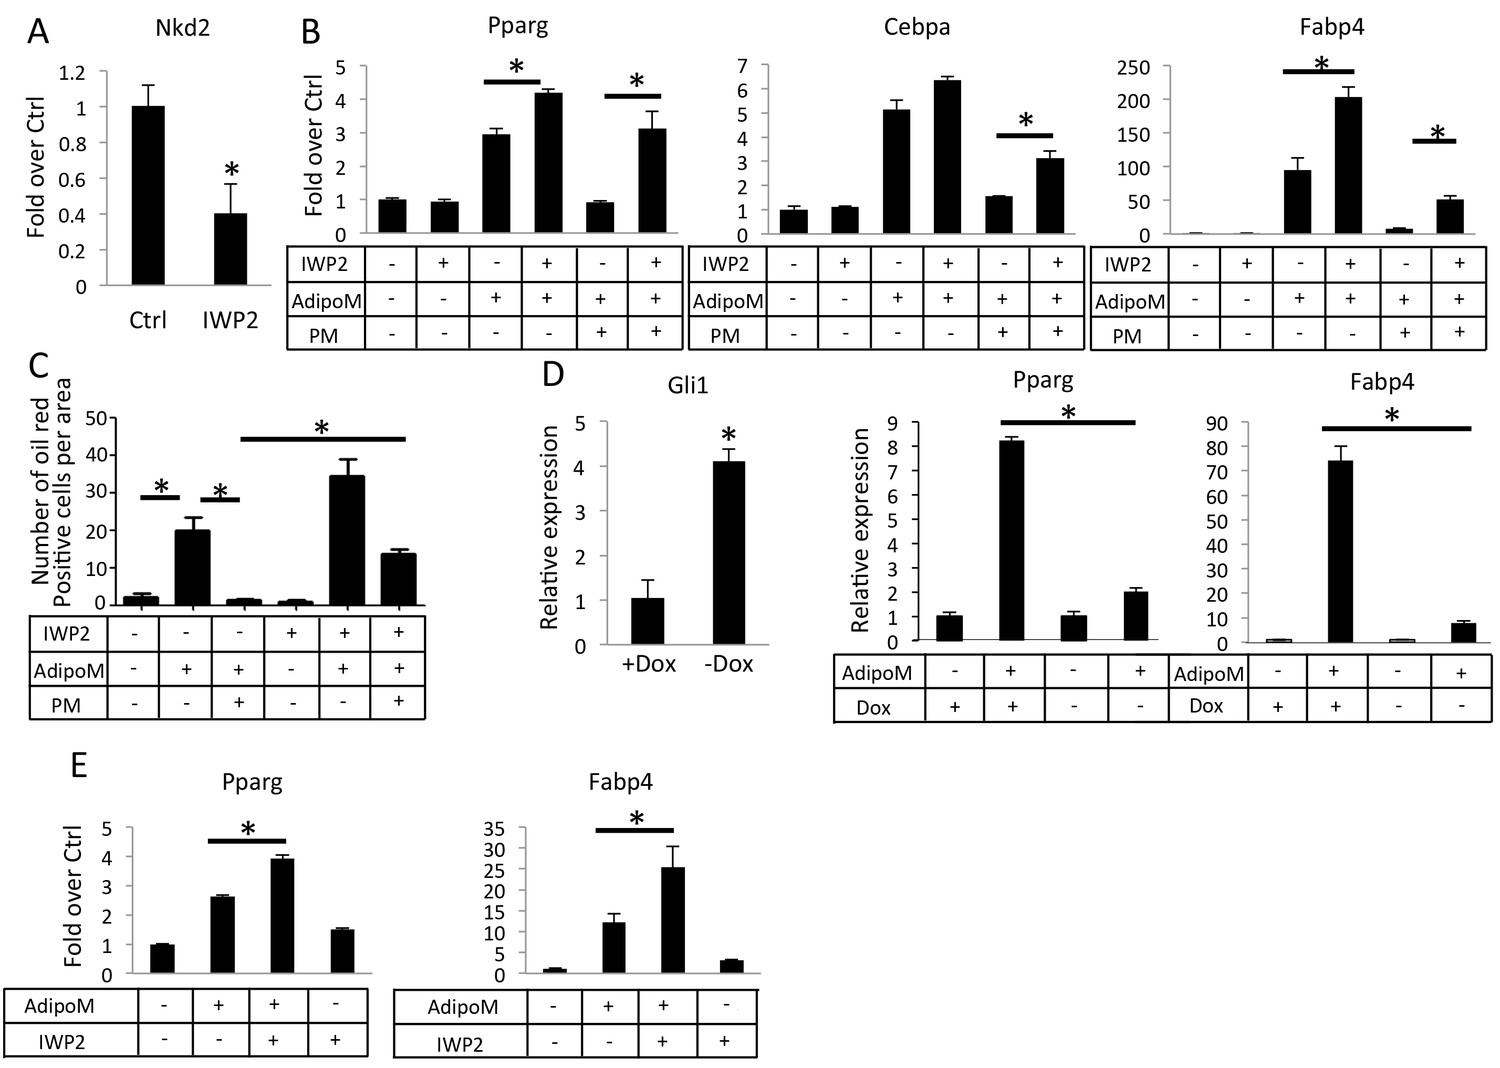
Inhibition of Wnt secretion ameliorates Hh suppression of adipogenesis.
(A) IWP2 reduces Nkd2 mRNA levels in M2 cells. (B) IWP2 partially rescued suppression of adipocyte gene expression by PM in M2 cells. (C) IWP2 partially rescued the number of oil red O positive cells suppressed by PM. (D) Expression of ΔNGli2 (-Dox) induced Gli1 but suppressed adipocyte marker genes in preadipocytes cultured from PPARgtTA;TetOcre;R26ΔNGli2/+ mice. (E) IWP2 partially rescued adipogenic differentiation in preadipocytes isolated from PPARgtTA;TetOcre;R26ΔNGli2/+ mice and cultured without Dox. 18S rRNA was used for normalization in all qPCR analyses. *p<0.05, n = 3.
Figure 7
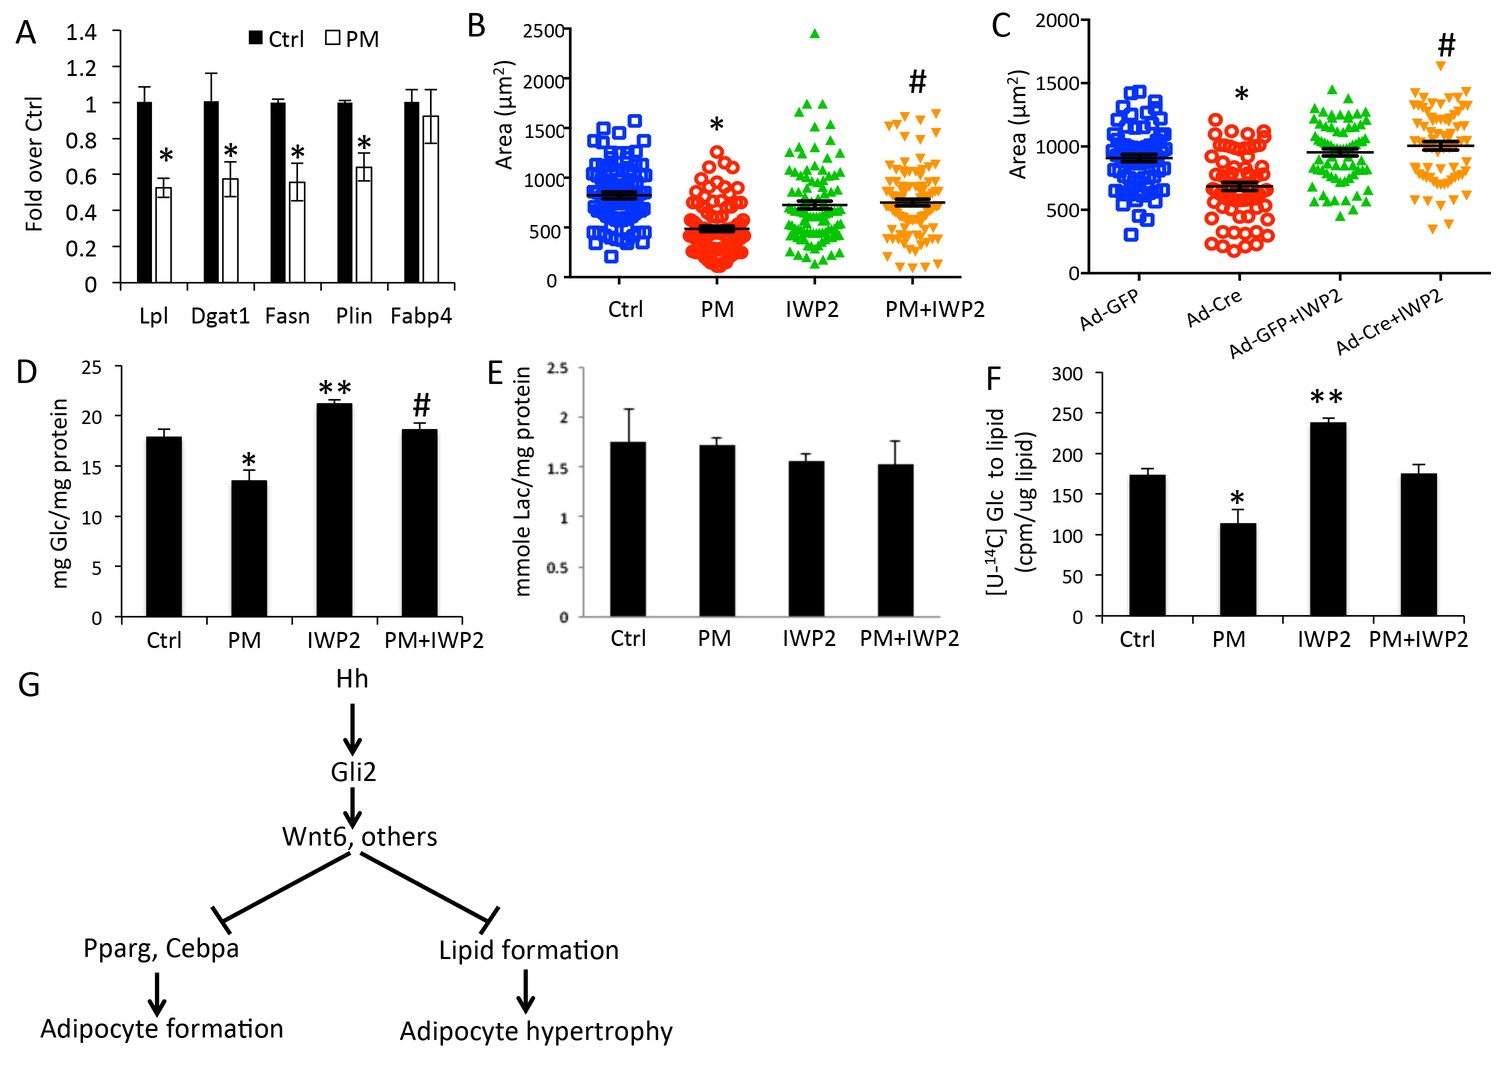
Hh signaling reduces glucose contribution to lipid in adipocytes.
(A) PM suppressed lipogenesis genes but not adipocyte markers in adipocytes. (B) PM reduced but IWP2 rescued lipid droplet size in adipocytes. (C) IWP2 relieved the suppression of lipid droplet size by ΔNGli2 over-expression. (D) PM suppressed but IWP2 rescued glucose consumption by adipocytes. (E) No effect on lactate secretion by PM or IWP2. (F) PM suppressed but IWP2 partially rescued glucose contribution to lipid in adipocytes. *, **, #p<0.05 for PM, IWP2 and PM-IWP2 interaction, respectively, based on two-way factorial ANOVA, n = 3. (G) A model depicting the role of Hh signaling in suppressing both adipogenesis and adipocyte hypertrophy.
Tables
Table 1
Nucleotide sequence of primers.
https://doi.org/10.7554/eLife.31649.013| pene | Primer F/R | Sequence 5' to 3' |
|---|---|---|
| 18S | F | CGGCTACCACATCCAAGGAA |
| 18S | R | GCTGGAATTACCGCGGCT |
| Glil | F | TACCATGAGCCCTTCTTTAGGA |
| Glil | R | GCATCATTGAACCCCGAGTAG |
| Gli2 | F | CACCTGCATGCTAGAGGCAAA |
| Gli2 | R | AGAAGTCTCCATCTCAGAGGCTCATA |
| Gli3 | F | CCCTGCATTGAGCTTCACCTA |
| Gli3 | R | AATGCGGAGCCTAAGCTTTG |
| Ptchl | F | GCCTTGGCTGTGGGATTAAAG |
| Ptchl | R | CTTCTCCTATCTTCTGACGGGT |
| c/ebp alpha | F | GAATCTCCTAGTCCTGGCTC |
| c/ebp alpha | R | GATGAGAACAGCAACGAGTAC |
| c/ebp beta | F | GCCACGGACACCTTCGAGG |
| c/ebp beta | R | CGGCTCCGCCTTGAGCTG |
| c/ebp delta | F | CGACTTCAGCGCCTACATTGA |
| c/ebp delta | R | CTAGCGACAGACCCCACA |
| Ppar gamma | F | GGAAAGACAACGGACAAATCAC |
| Ppar gamma | R | TACGGATCGAAACTGGCAC |
| Fabp4 | F | CGGCCCAATCCTATCCTGGA |
| Fabp4 | R | AGGTTGAAGTGGGTCAAGCAA |
| Wnt5a | F | GCGTGGCTATGACCAGTTTAAGA |
| Wnt5a | R | TTGACATAGCAGCACCAGTGAA |
| Wnt6 | F | GGTTTACACCAGCCCACGAA |
| Wnt6 | R | GCAACTAGCAAAGGGCCTTTC |
| Wnt9a | F | CGTGGGTGTGAAGGTGATAAG |
| Wnt9a | R | GCAGGAGCCAGACACACCAT |
| Nkd2 | F | CTTTCTGGGACGACAAGGGTT |
| Nkd2 | R | AGTGCGTCAATGTTCAAGTGC |
| Ucp1 | F | AGGCTTCCAGTACCATTAGGT |
| Ucp1 | R | CTGAGTGAGGCAAAGCTGATTT |
| Cidea | F | TGACATTCATGGGATTGCAGAC |
| Cidea | R | GGCCAGTTGTGATGACTAAGAC |
| Lpl | F | GGGAGTTTGGCTCCAGAGTTT |
| Lpl | R | TGTGTCTTCAGGGGTCCTTAG |
| Fasn | F | AAGTTGCCCGAGTCAGAGAA |
| Fasn | R | CGTCGAACTTGGAGAGATCC |
| Plin | F | CTGTGTGCAATGCCTATGAGA |
| Plin | R | CTGGAGGGTATTGAAGAGCCG |
| Dgat1 | F | GTGTGTGGTGATGCTGATCC |
| Dgat1 | R | GATGCAATAATCACGCATGG |
| Axin2 | F | TGAGCGGCAGAGCAAGTCCAA |
| Axin2 | R | GGCAGACTCCAATGGGTAGCT |
Additional files
-
Supplementary file 1
RNA-seq data for Hh signaling in M2-10B4 cells showing genes with a minimum of 2 fold change in mRNA level in response to PM after 72 hr.
- https://doi.org/10.7554/eLife.31649.014
-
Transparent reporting form
- https://doi.org/10.7554/eLife.31649.015
Download links
A two-part list of links to download the article, or parts of the article, in various formats.
Downloads (link to download the article as PDF)
Open citations (links to open the citations from this article in various online reference manager services)
Cite this article (links to download the citations from this article in formats compatible with various reference manager tools)
Hedgehog signaling via Gli2 prevents obesity induced by high-fat diet in adult mice
eLife 6:e31649.
https://doi.org/10.7554/eLife.31649


