Keratinocytes mediate innocuous and noxious touch via ATP-P2X4 signaling
- Medical College of Wisconsin, United States
Figures
Figure 1 with 1 supplement
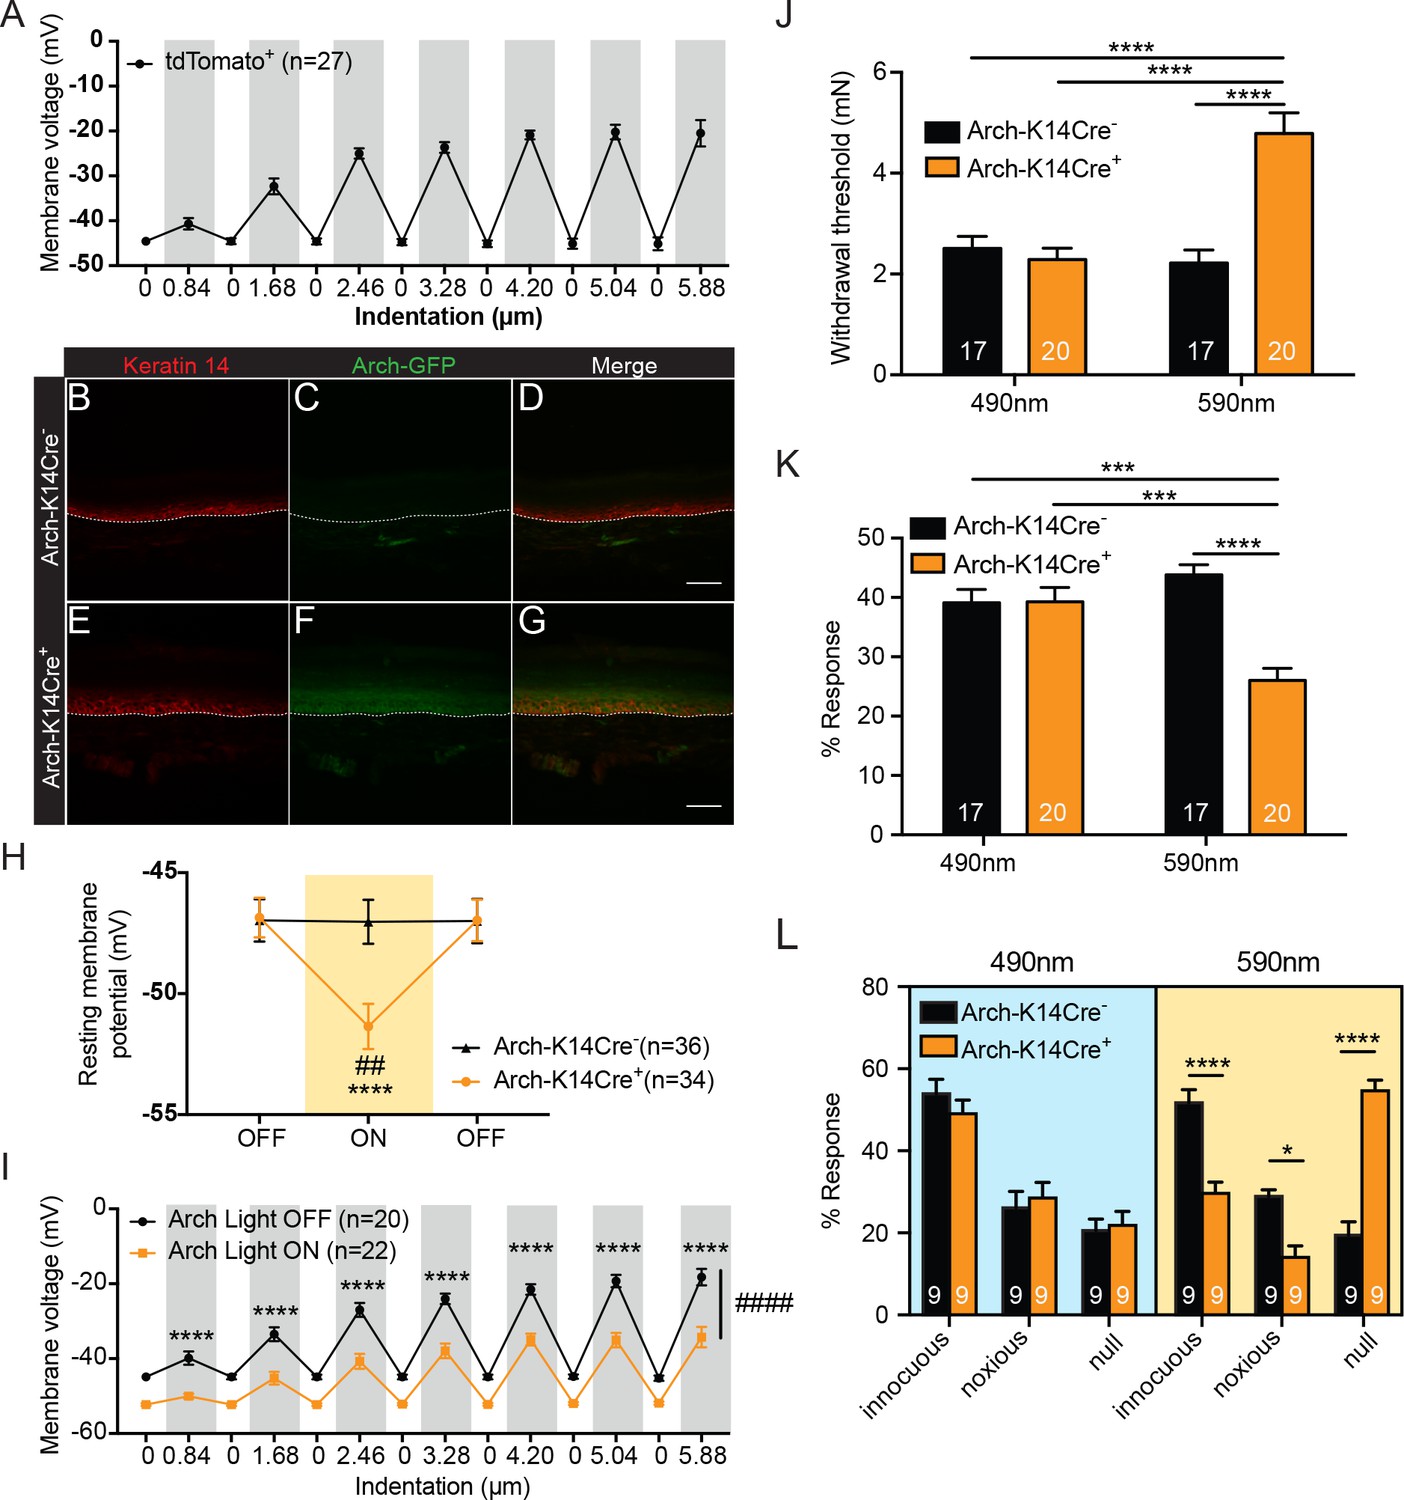
Keratinocytes depolarize upon mechanical stimulation, and optogenetic inhibition of keratinocytes decreases innocuous and noxious mechanical behavioral response.
(A) In current clamp mode, mechanical stimulation of keratinocytes caused membrane depolarization of the soma membrane, grey background: mechanical stimulation, white background: resting membrane potential of the cells. (B-D Arch-K14Cre-) the dotted line indicates epidermal to dermal border. (B) Immunoreactivity of the K14 marker can be seen in the deeper layers of the skin (C) Archaerhodopsin is tagged with GFP and no significant GFP immunoreactivity is present in Arch-K14Cre- skin. (D) Overlay shows that the Arch-K14Cre- animal has no GFP expression in K14-expressing cells. (E-G Arch-K14Cre+). (E) Immunoreactivity for K14 in red in the same areas as the Arch-K14Cre- animal. (F) GFP expression is observed throughout the layers of the skin. (G) Merging of the red and green channels shows overlap of Archaerhodopsin-3 and the K14 marker in the Arch-K14Cre+ animal. Representative images are shown for each genotype for the immunohistochemistry experiments (n = 3 animals/genotype), scale bar = 50 μm. (H) Arch-K14Cre+ keratinocytes had a more negative resting membrane potential when the LED light was turned on than when the light was off (****p<0.0001). Turning the LED (590 nm, 5 mW) on and off had no effect on the resting membrane potential of Arch-K14Cre- keratinocytes (n.s.p=0.9937). In the light on condition Arch-K14Cre- keratinocytes were significantly different from Arch-K14Cre+ keratinocytes (##p=0.0020), repeated measures two-way ANOVA, Tukey post-hoc test (n = 3–4 animals/genotype). (I) When the light (590 nm, 5 mW) was turned on in keratinocytes expressing Arch, the keratinocytes were hyperpolarized at baseline and showed an overall decrease (####p<0.0001) as well as a decrease at each indentation (0.84 μm:****p<0.0001, 1.68 μm:****p<0.0001, 2.46 μm:****p<0.0001, 3.28 μm:****p<0.0001, 4.20 μm:****p<0.0001 5.04 μm:****p<0.0001 and 5.88 μm:****p<0.0001) in the membrane depolarization upon increasing indentations of the cell membrane, two-way ANOVA, Sidak post-hoc. (J) Von Frey Up-Down method showed that the 590 nm light significantly decreased normal baseline mechanical paw withdrawal thresholds in Arch-K14Cre+ animals in comparison to the Arch-K14Cre- animals (****p<0.0001) as well as compared to the 490 nm control light (****p<0.0001). The 490 nm light had no effect on either genotype, two-way ANOVA, Tukey post-hoc. (K) Animals were stimulated 10 times with a supratheshold 3.61 mN von Frey filament and the percent response was determined. Arch-K14Cre+ animals also showed fewer responses to the 3.61 mN stimulation when the 590 nm light was on in comparison to the Arch-K14Cre- controls (****p<0.0001) and the 490 nm light stimulation (***p<0.001) two-way ANOVA, Tukey post-hoc. (L) The hindpaw of animals was stimulated 10 times with a spinal needle and the responses were categorized into innocuous/normal response (simple withdrawal), noxious response (flicking, licking of the paw and elevating the paw for extended time periods) and null response. Arch-K14Cre+ mice showed fewer noxious (*p=0.0383), and innocuous (****p<0.0001), and concomitantly more null responses (****p<0.0001) to the needle stimulus, when exposed to the 590 nm light. There was no difference between genotypes in the type and number of responses when the 490 nm light was used (innocuous n.s. p=0.9957; noxious n.s. p>0.9999; null n.s. p>0.9999), three-way ANOVA, Tukey post-hoc. Throughout all the studies, the experimenter was blinded to genotype and treatment where possible.. Data are represented as mean ± SEM. See also Figure 1—figure supplement 1.
Figure 1—figure supplement 1
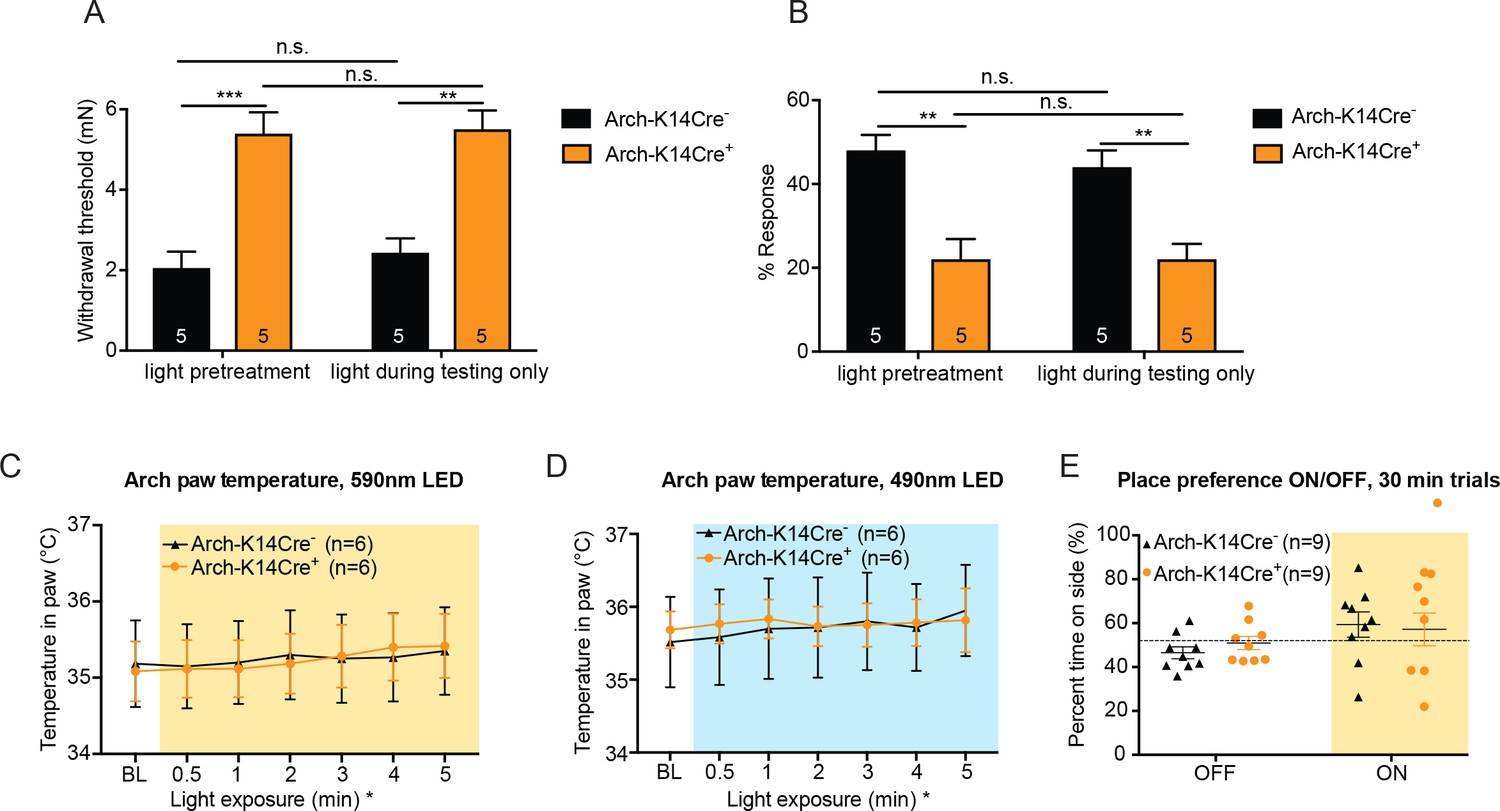
Light pre-treatment is not necessary to observe full behavior effects, and temperature increase in the skin due to fluorophore activation with the 590 nm LED is not responsible for the behavior responses observed in Arch-K14Cre+mice.
(A) Arch-K14Cre+ and Arch-K14Cre- animals were tested with and without the 1 min light pretreatment, where the light was only turned on while the mechanical stimulus was applied. No significant differences were found between Arch-K14Cre+ animals with and without light pretreatment (n.s.=p>0.9999). Arch-K14Cre+ animals had higher paw withdrawal thresholds than their controls in the light pretreatment group (***p=0.0005) and in the light during testing only group (**p=0.0011), two-way ANOVA, Tukey post-hoc. (B) No significant differences were found in the Arch-K14Cre+ animals between the two light treatments (n.s. p>0.9999). In both groups Arch-K14Cre+ animals exhibited fewer responses to the suprathreshold stimulus than Arch-K14Cre- animals (light pretreatment: **p=0.0020; light during testing only: **p=0.0081), two-way ANOVA, Tukey post-hoc C) The temperature within the hindpaw of Arch-K14Cre+ and Arch-K14Cre- animals increased slightly over a 5-min period of 590 nm LED light stimulation (less than 0.5°C) (*p=0.0100 overall significance, although no specific time point was significantly different after post-hoc analysis). Furthermore, no differences between the genotypes were observed, two-way ANOVA, Tukey post-hoc. (D) No difference between genotypes was observed over the 5-min stimulation with the 490 nm LED light, although a slight temperature increase over time occurred in both genotypes (*p=0.0433 overall significance), two-way ANOVA, Tukey post-hoc. (E) Animals were allowed to freely roam in a two-chamber set up for 10 min without LED floor light and then for 30 min with the LED floor light on to determine if the Arch-K14 mice preferred either wavelength of light. Neither genotype exhibited a place preference for either the light on or off condition; two-way ANOVA, Tukey post-hoc. Data are represented as mean ±SEM.
Figure 2 with 3 supplements
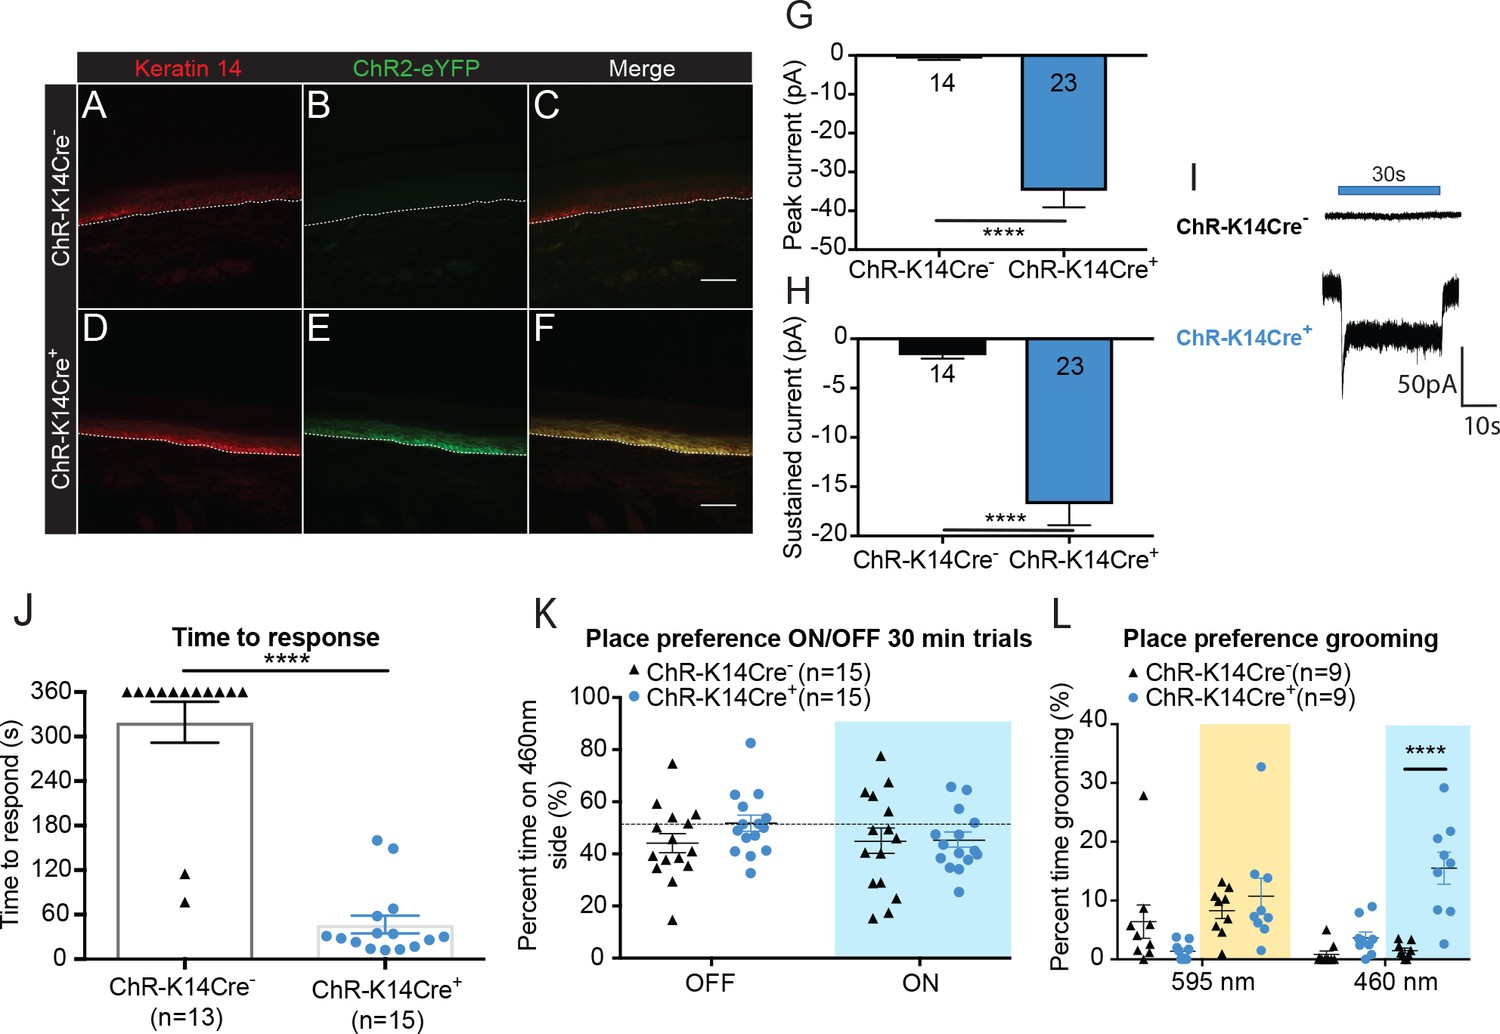
Optogenetic activation of keratinocytes elicits attending behavior responses.
(A-C ChR-K14Cre-) the dotted line indicates epidermal to dermal border. (A) K14 immunoreactivity was observed in the deep layers of the skin. (B) ChR2 is tagged with eYFP; minimal eYFP fluorescence was observed in ChR-K14Cre- skin. (C) Merging shows no overlay of K14 and ChR2 in the ChR-K14Cre- control animal. (D-F ChR-K14Cre+) (D) K14 immunoreactivity was observed in the deepest layers of keratinocytes. (E) eYFP fluorescence tag of the ChR2 expressing cells was observed all throughout the skin. (F) Merging of the red and green channels shows the overlap of the K14 marker with the eYFP expression of ChR2. Representative images are shown for each genotype for the immunohistochemistry experiments (n = 3 animals/genotype), scale bar = 50 μm. (G) Primary mouse keratinocytes were patch clamped in voltage clamp mode and stimulated for 30 seconds with a 3 mW 490 nm LED light (n = 4 animals/genotype). Keratinocytes cultured from ChR-K14Cre+ animals showed a significant increase in peak amplitude of the currents as compared to keratinocytes cultured from ChR-K14Cre- animals which showed only a leak current (****p<0.0001) unpaired t-test. (H) The sustained current was significantly higher in ChR-K14Cre+ keratinocytes as compared to the ChR-K14Cre- keratinocytes (****p<0.0001), unpaired t-test. (I) Example traces from ChR-K14Cre- keratinocytes show no inward current (top), whereas ChR-K14Cre+ keratinocytes show an inward current in response to the light (bottom). (J) Animal behavior responses to a 473 nm 6 min laser stimulation (10 Hz, 24 – 28 mW power) were analyzed by an observer blinded to genotype. ChR-K14Cre+ animals responded in less than a minute to the laser stimulation, whereas most control animals did not respond at all to the laser stimulation (****p<0.0001) unpaired t-test. (K) K14-ChR animals were tested in a 30 min trial, optogenetic place preference set up. Neither genotype displayed a significant preference for either side during the 30 min on trial or the 10 min off trial (Light on vs off: n.s. p=0.3469; Genotype: n.s. p=0.3800), two-way ANOVA, Sidak post-hoc. (L) During the place preference assay, ChR-K14Cre+ animals spent significantly more time grooming on the 460 nm side when the light was on than their ChR-K14Cre- controls (****p<0.0001). ChR-K14Cre+animals on the 460 nm side with the light on also spent significantly more time grooming on that side than when the light was off (***p=0.0009); three-way ANOVA, Tukey post-hoc. Data are represented as mean ± SEM. See also Figure 2—figure supplement 1 and Figure 2—video 1 and 2.
Figure 2—figure supplement 1
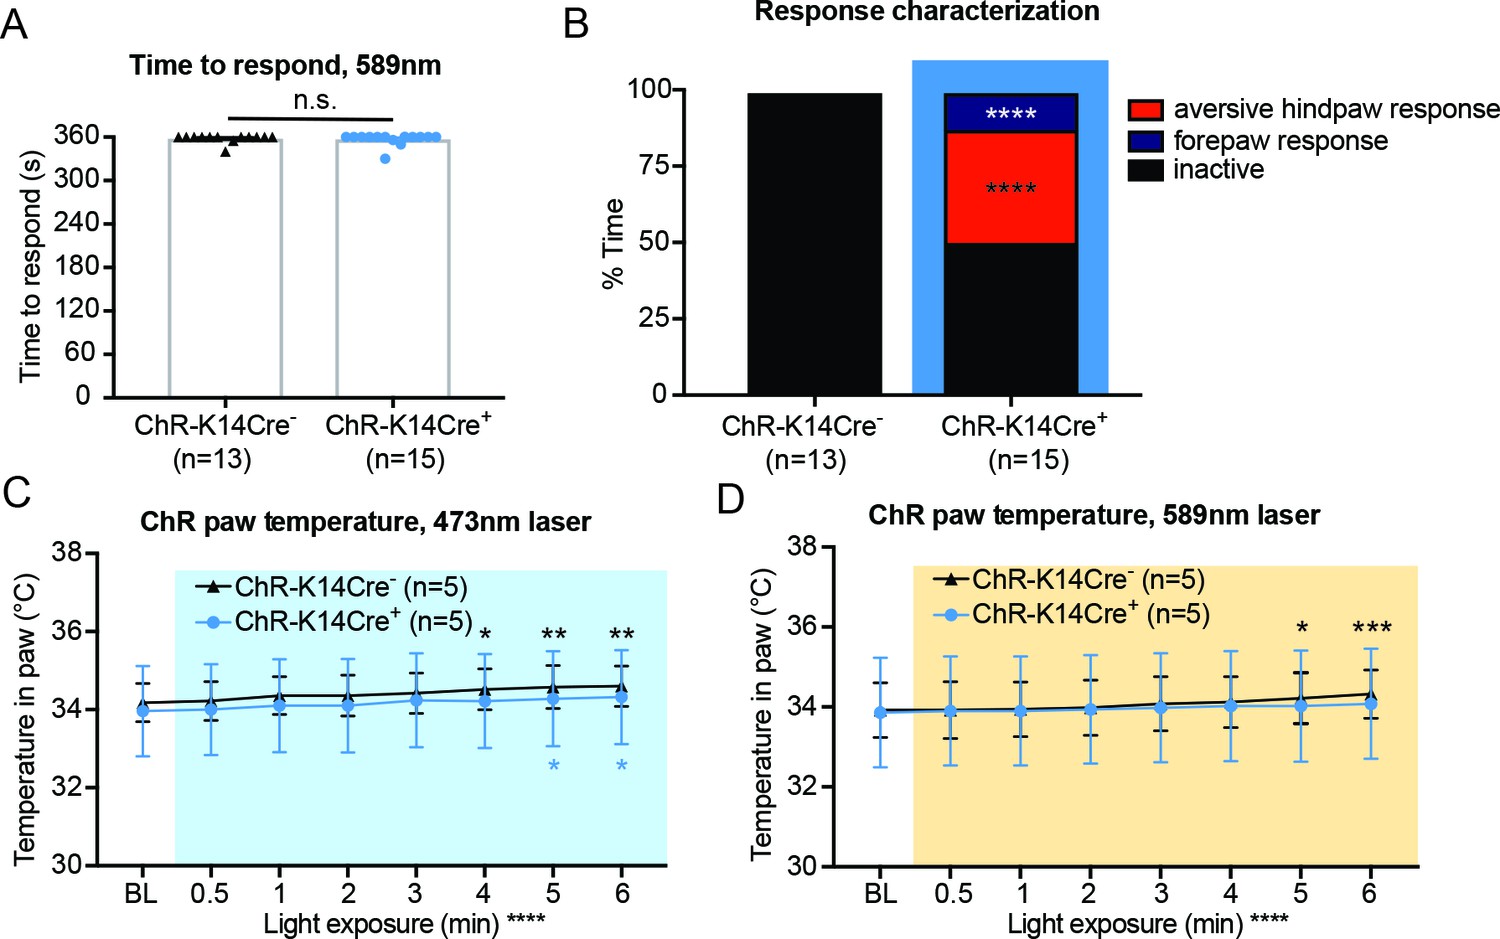
The 589 nm control laser does not elicit behavior responses, and attending behaviors are not due to heating of the skin.
(A) The 589 nm laser did not elicit behavior responses in either genotype (n.s. p=0.7053), unpaired t-test. (B) Behavior responses were categorized into attending to the hindpaw (licking and biting of hindpaw), a forepaw response (flicking and biting of forepaw), or no response (inactive). ChR-K14Cre+ animals displayed significantly more noxious responses than their controls and exhibited significantly more forepaw and noxious responses than null responses (Chi square ****p<0.0001, Fisher’s Exact inactive vs aversive hindpaw response ****p<0.0001, Fishers’s Exact inactive vs forepaw response ****p<0.0001, Fisher’s Exact aversive hindpaw vs forepaw response n.s. p>0.9999. (C) ChR-K14Cre+ and ChR-K14Cre- animals showed the same temperature increase over the 6 min of 473 nm laser light exposure (overall significance ****p<0.0001; Tukey post-hoc ChR-K14Cre- BL to 4 min *p=0.0204; ChR-K14Cre- BL to 5 min **p=0.0032; ChR-K14Cre- BL to 6 min **p=0.0017; ChR-K14Cre+ BL to 5 min *p=0.0357; ChR-K14Cre+ BL to 6 min *p=0.0113). (D) ChR-K14Cre+ and ChR-K14Cre- animals showed the same temperature increase over the 6 min of 589 nm laser light exposure within the hindpaw (overall significance ****p<0.0001; Tukey post-hoc ChR-K14Cre- BL to 5 min *p=0.0206; ChR-K14Cre- BL to 6 min ***p=0.0005), two-way ANOVA, Tukey post-hoc. Data are represented as mean ± SEM.
Figure 2—video 1
ChR-K14Cre+ animal responds to the 473 nm laser within 30 seconds of light stimulation.
In some cases, forepaw responses were observed in that after blue light stimulation to the hindpaw; animals picked up and lifted that hindpaw with their forepaws, thus exposing the forepaws to blue light.
Figure 2—video 2
ChR-K14Cre- animal does not respond to the 473 nm laser.
https://doi.org/10.7554/eLife.31684.008
Figure 3
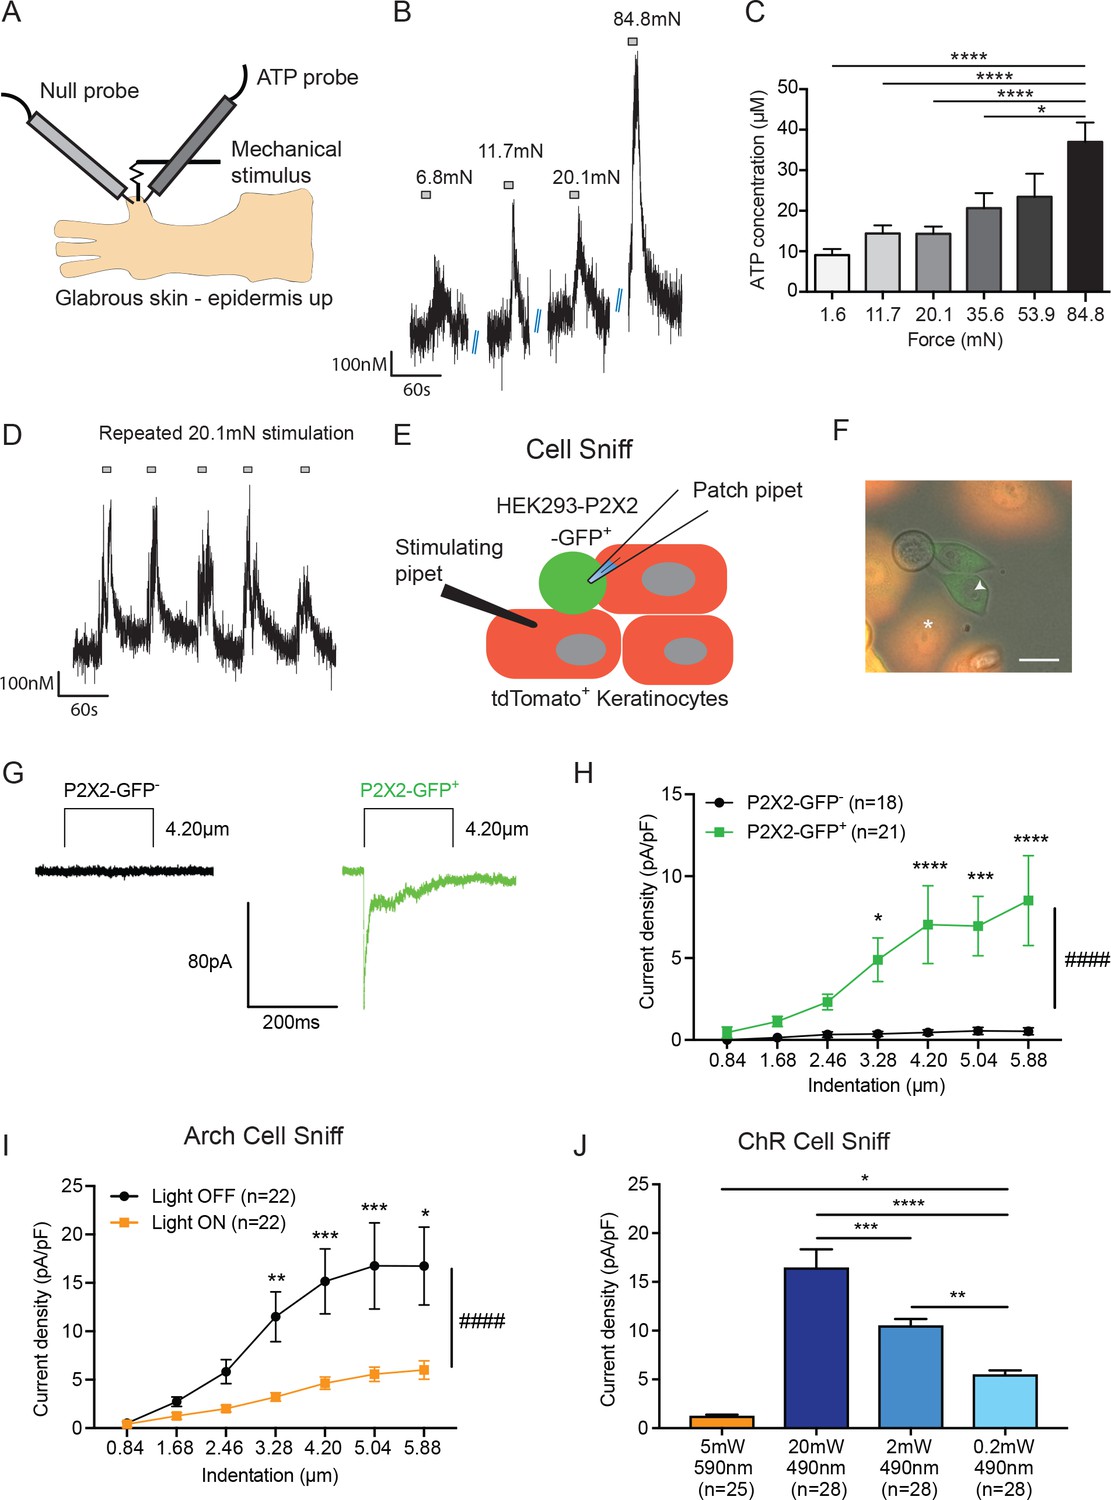
ATP is released from both mechanically- and optogenetically-stimulated keratinocytes, and optogenetic inhibition of keratinocytes dampens this ATP release.
(A) Schematic of ex vivo glabrous skin setup with ATP and null probes inserted into the skin. (B) Repeatable ATP release traces are shown upon skin stimulation with 6.8, 11.7, 20.1, and 84.8 mN von Frey filaments; for each filament, the skin was rapidly and repeatedly stimulated with the von Frey Filament for 10 seconds. (C) The area under the curve for ATP release was quantified. ATP release was significantly greater in response to the 84.8 mN stimulus than the 35.6 mN (*p=0.0220), 20.1 mN (****p<0.0001), 11.7 mN (****p<0.0001) and 1.6 mN stimuli (****p<0.0001) (n = 4 animals) one-way ANOVA, Tukey post-hoc test. (D) Traces of ATP release upon repeated mechanical stimulation with the same 20.1 mN force show approximately the same amount of ATP release for each stimulus. (E) Schematic of the cell sniff assay. P2X2 GFP HEK-293 cells (sniffer cells) were patch clamped and primary cultured keratinocytes were mechanically stimulated with a stimulating pipet with increasing increments. (F) Bright-field image merged with the red and green fluorescent channel shows P2X2-GFP+HEK-293 cells with K14-tdTomato-tagged keratinocytes. Star = keratinocyte that is mechanically stimulated; arrow head = P2X2-GFP+ HEK-293 cell that is patch clamped, scale bar 20 µm. (G) Current traces showing example currents of P2X2-GFP+ HEK-293 cells and P2X2 GFP- HEK-293 cells in response to mechanical probing (4.20 µm) of a keratinocyte. (H) P2X2-GFP+ HEK-293 cells show a gradual and significant increase in current density in response to increasing mechanical stimulation of the keratinocyte, which is not observed in P2X2 GFP- HEK-293 cells (####p<0.0001), (GFP- vs GFP+: 4.20 µm ***p=0.0009; 5.04 µm **p=0.0034; 5.88 µm ***p=0.0003; 6.72 µm ****p<0.0001; 7.56 µm ****p<0.0001) two-way ANOVA, Sidak’s post-hoc test. (I) Arch inhibition of K14-expressing cells during mechanical stimulation significantly decreased the current density in response to mechanical stimulation in P2X2-GFP+ HEK-293 cells (####p<0.0001); (Light OFF vs Light ON: 3.28 µm **p=0.0044; 4.20 µm ***p=0.0003; 5.04 µm ***p=0.0006; 5.88 µm *p=0.0233) two-way ANOVA, Sidak’s post-hoc test. (J) In the ChR cell sniff assay, the control light (590 nm) did not elicit significant currents in P2X2-GFP+ HEK-293 cells. Conversely, 490 nm light-induced depolarization of ChR keratinocytes via three different light intensities was sufficient to cause inward currents in P2X2-GFP+ HEK-293 cells, compared to the 590 nm light control (5 mW 590 nm vs 20 mW 490 nm: ****p<0.0001, 5 mW 590 nm vs 2 mW 490 nm: ****p<0.0001 and 5 mW 590 nm vs 0.2 mW 490 nm: *p=0.0249). The magnitude of response in the P2X2-GFP+ HEK-293 was light intensity dependent, where a greater light intensity elicited a greater current (20 mW 490 nm vs. 2 mW 490 nm: ***p=0.0004; 20 mW 490 nm vs. 0.2 mW 490 nm: ****p<0.0001 and 2 mW 490 nm vs. 0.2 mW 490 nm **p=0.0040) one-way ANOVA, Tukey post-hoc test. Data are represented as mean ± SEM.
Figure 4 with 1 supplement
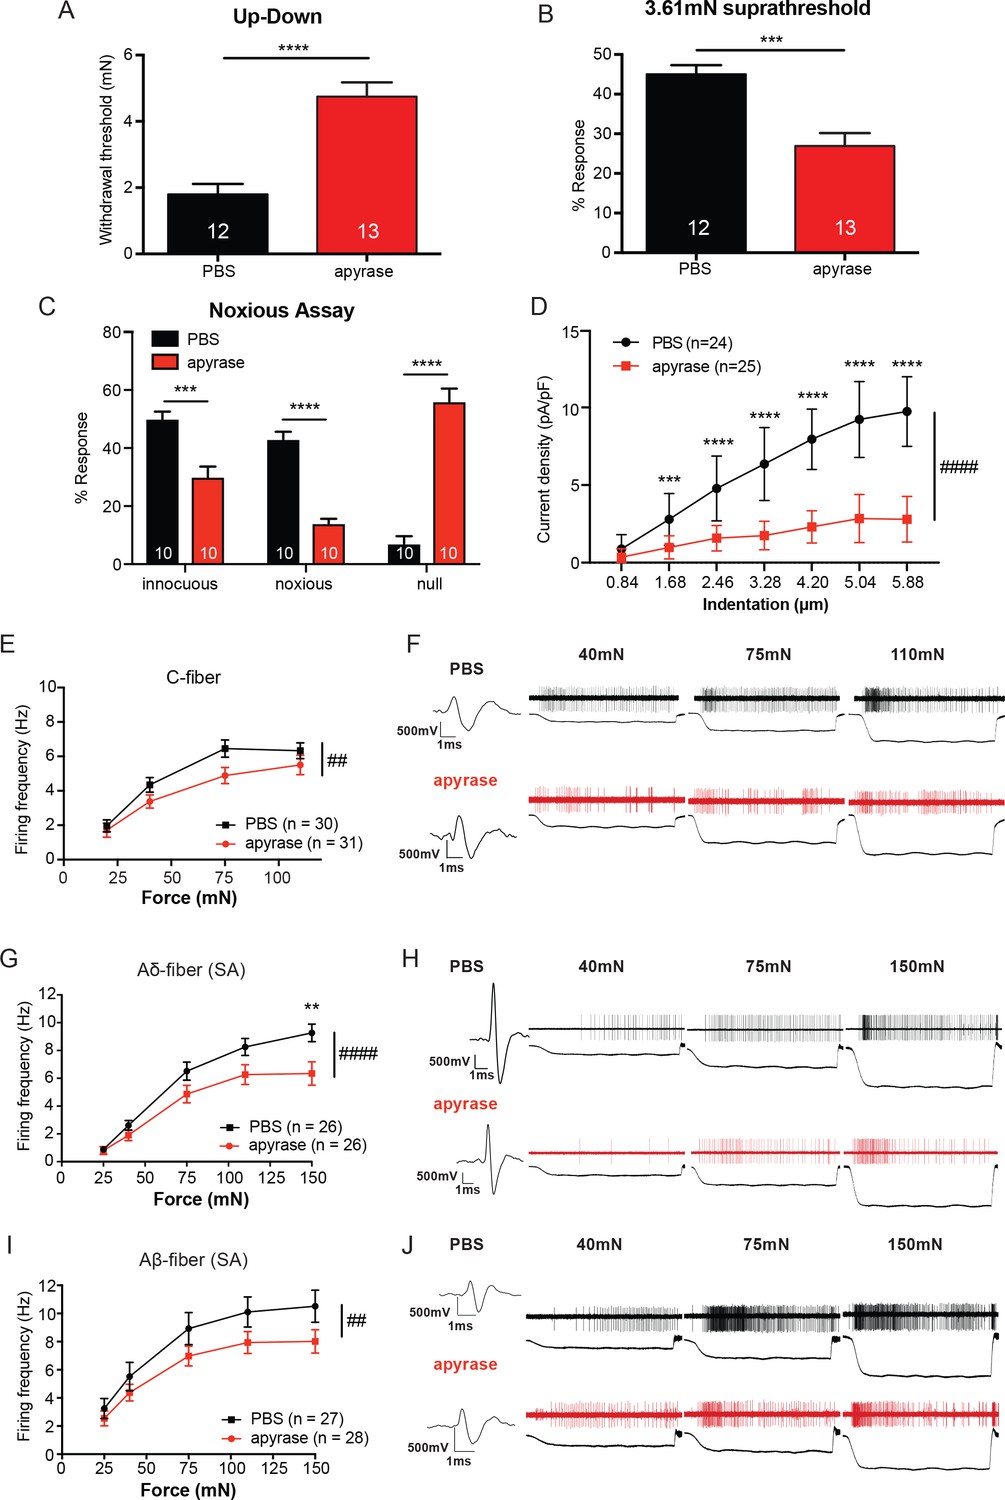
The degradation of ATP leads to decreased innocuous and noxious behavioral touch responses and decreased afferent firing of all fiber types.
(A) Animals injected with 0.4 units apyrase had a two-fold increase of the paw withdrawal threshold as compared to their vehicle controls (****p<0.0001), Mann-Whitney U-test. (B) Animals injected with apyrase had significantly lower percent responses than animals injected with the vehicle (***p=0.0004), Mann-Whitney U-test. (C) Apyrase treatment decreased both the innocuous (***p=0.0004) and noxious (****p<0.0001) responses and simultaneously increased the percent of null responses (****p<0.0001) as compared to the PBS treated animals, two-way ANOVA, Tukey post-hoc. (D) Keratinocytes co-cultured with P2X2-GFP+ HEK-293 cells were incubated with 20 units of apyrase or PBS. The presence of apyrase decreased the current density in response to mechanical stimulation of keratinocytes in P2X2-GFP+ HEK-293 cells (####p<0.0001); (PBS vs apyrase: 1.68 μm ***p=0.0007; 2.46 ****p<0.0001; 3.28 μm ****p<0.0001; 4.20 μm ****p<0.0001, 5.04 μm ****p<0.0001; 5.88 μm ****p<0.0001) two-way ANOVA, Sidak’s post-hoc test. (E) Ex vivo tibial skin nerve preparations were incubated with either 40 units of apyrase or PBS, for at least 10 min prior to any recordings. C-fibers were characterized based on their conduction velocity of <1.2 m/s. C-fiber action potentials in response to a force ramp of 20, 40, 75 and 110 mN over a 12 second period were recorded. Apyrase treatment overall significantly decreased the action potential firing rate of the C-fibers (##p=0.0051), two-way ANOVA, Sidak post-hoc test (n = 22 mice). (F) C-fiber traces on top with PBS and on the bottom with apyrase. (G) Slowly Adapting (SA) Aδ-fibers were characterized based on their conduction velocity of 1.2–10 m/s and repeated firing to sustained stimuli. Action potentials in response to a force ramp of 25, 40, 75, 110 and 150 mN over a 12 second period were recorded. Apyrase treatment overall decreased action potential firing over the different forces as compared to PBS treatment in the Aδ-Fibers (####p<0.0001), and at the 150 mN force, apyrase action potential firing was significantly decreased as compared to PBS (**p=0.0017), two-way ANOVA, Sidak post-hoc test. (H) SA-Aδ-fiber action potential traces, on the top with PBS treatment, bottom with apyrase treatment. (I) SA-Aβ-fibers were characterized based on their conduction velocities > 10 m/s and repeted firing to sustained stimuli. There was a significant decrease in action potential firing in the SA-Aβ-fibers treated with apyrase as compared to those incubated with PBS (##p=0.0025), two-way ANOVA, Sidak post -hoc test. (J) SA-Aβ-fiber action potential traces, on the top with PBS treatment, bottom with apyrase treatment. (n = 42 mice for Aδ and Aβ-fibers). Throughout all the studies, the experimenter was blinded to the treatment. Data are represented as mean ± SEM. See also Figure 4—figure supplement 1.
Figure 4—figure supplement 1
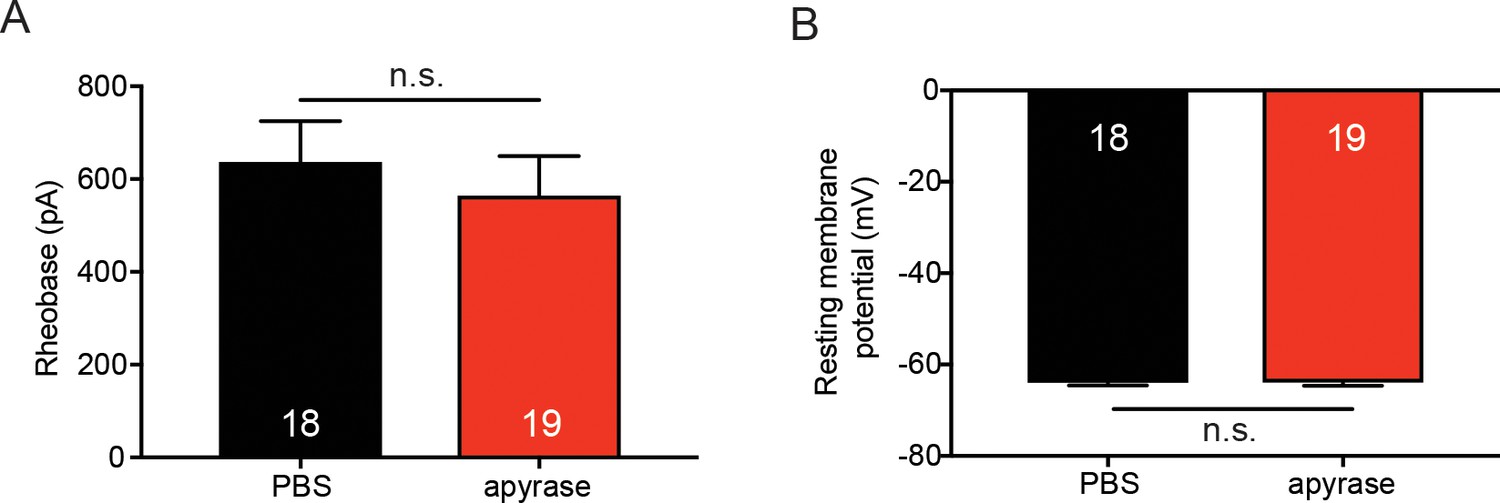
Apyrase treatment does not affect sensory neuron membrane excitability.
(A) 20 units of apyrase or PBS was added to the extracellular buffer. Sensory neurons were patch clamped in whole cell mode and the amount of current required to elicit the first action potential (rheobase) was recorded. Apyrase did not significantly change the rheobase as compared to PBS addition to the extracellular buffer (n.s. p=0.4934), Mann-Whitney U-test. (B) Apyrase did not significantly alter the resting membrane potential of sensory neurons when compared to PBS addition to the extracellular solution (n.s. p=0.9586) unpaired t-test. Data are represented as mean ± SEM.
Figure 5 with 1 supplement
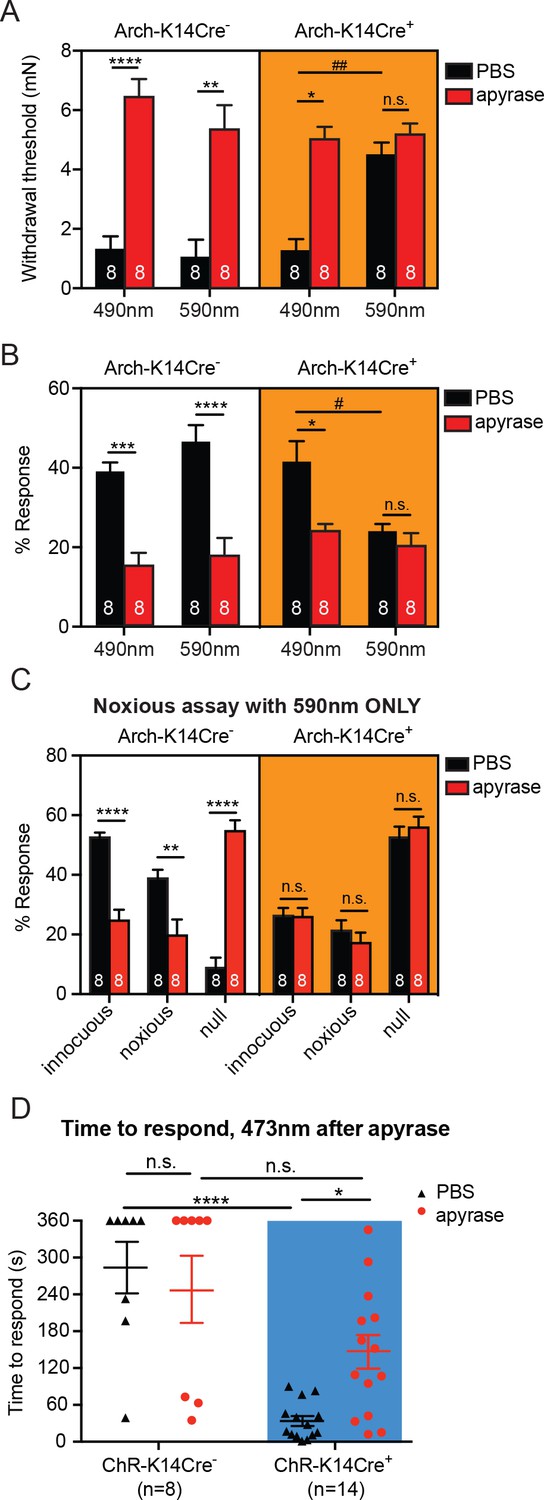
Degradation of ATP decreases touch sensitivity and responsiveness to a similar level as that with keratinocyte inhibition, and delays behaviors elicited by keratinocyte-activation..
(A) Animals were tested 45 min after apyrase/vehicle injection with either the 490 or 590 nm light on. Arch-K14Cre+ PBS animals showed significantly higher paw withdrawal thresholds with the 590 nm light on than with the 490 nm light on (##p=0.0093), and Arch-K14Cre+ animals treated with apyrase had significantly higher paw withdrawal thresholds than Arch-K14Cre+ animals treated with PBS (*p=0.0168), three-way ANOVA, Tukey post-hoc. (B) Arch-K14Cre+ animals treated with apyrase were not significantly different from the 590 nm light stimulation and PBS or apyrase treatment. Arch-K14Cre+ treated with apyrase had approximately half of the responses compared to Arch-K14Cre+ animals treated with PBS under the 490 nm light (*p=0.0175). Apyrase-treated animals did not differ from each other between genotypes or light wavelength; three-way ANOVA, Tukey post-hoc. (C) Graph shows 590 nm light treatment only. After apyrase treatment, Arch-K14Cre+ animals treated with apyrase were no longer significantly different from animals treated with PBS (innocuous: n.s. p>0.9999; noxious: n.s. p=0.9996; null: n.s. p=0.9996). Conversely, apyrase- treated Arch-K14Cre- animals exhibited significantly more null responses (****p<0.0001) and less innocuous (****p<0.0001) and noxious (**p=0.0064) responses when compared to their PBS-treated littermates, three-way ANOVA, Tukey post-hoc. (D) ChR-K14Cre+ animals treated with PBS responded significantly faster to the laser light stimulation than ChR-K14Cre+ animals injected with apyrase (*p=0.0368). ChR-K14Cre+ animals injected with PBS responded significantly sooner to the laser stimulation that ChR-K14Cre- animals injected with PBS (****p<0.0001). ChR-K14Cre+ animals injected with apyrase no longer differed from the ChR-K14Cre- controls injected with apyrase (n.s. p=0.1241), two-way ANOVA, Tukey post-hoc. Throughout all the studies, the experimenter was blinded to genotype as well as treatment. Data are represented as mean ± SEM. See also Figure 5—figure supplement 1.
Figure 5—figure supplement 1
Apyrase treatment in control behavior experiments does not differ between genotypes.
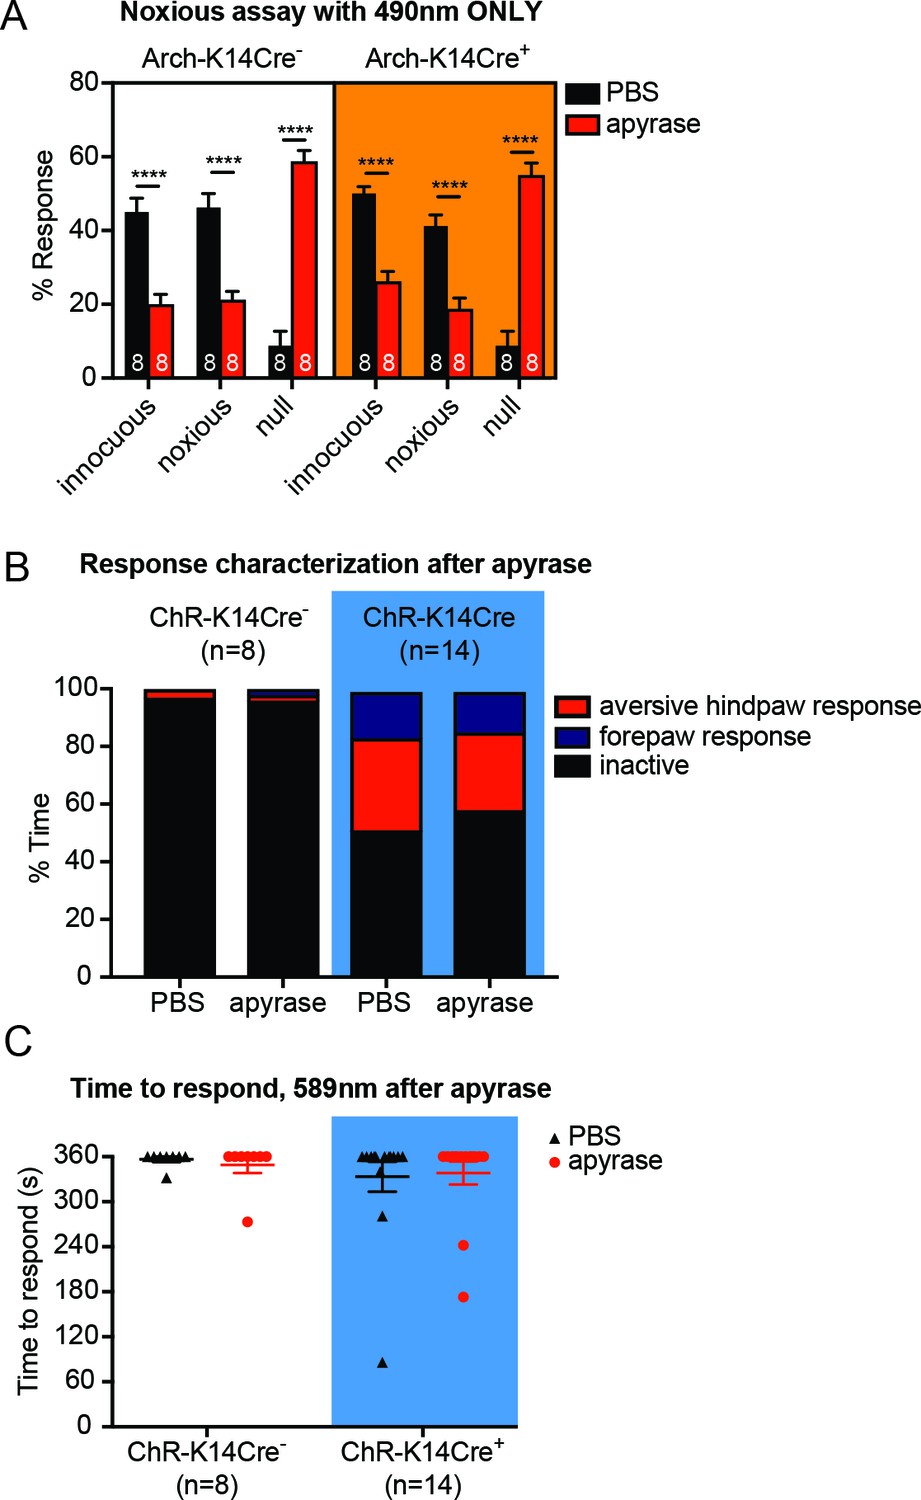
(A) Graph shows 490 nm light treatment only. Apyrase treatment elevated the null responses (****p<0.0001) and decreased the innocuous (****p<0.0001) and noxious responses (****p<0.0001) in both Arch-K14Cre- and Arch-K14Cre+ animals; three-way ANOVA, Tukey post-hoc. (B) ChR-K14Cre+ animals had increased proportions of both forepaw (**p=0.010) and aversive hindpaw (**p=0.0086) responses compared to being inactive; however, apyrase did not alter these proportions; Dirichlet-multinomial regression. (C) The 589 nm laser did not elicit a significant number of behavior responses regardless of treatment (n.s. p=0.9422) or genotype (n.s. p=0.3298), two-way ANOVA. Data are represented as mean ± SEM.
Figure 6 with 1 supplement
Pharmacological inhibition of peripheral P2X4 and not P2X2 and P2X3 receptors causes decreased mechanical responses in vivo.
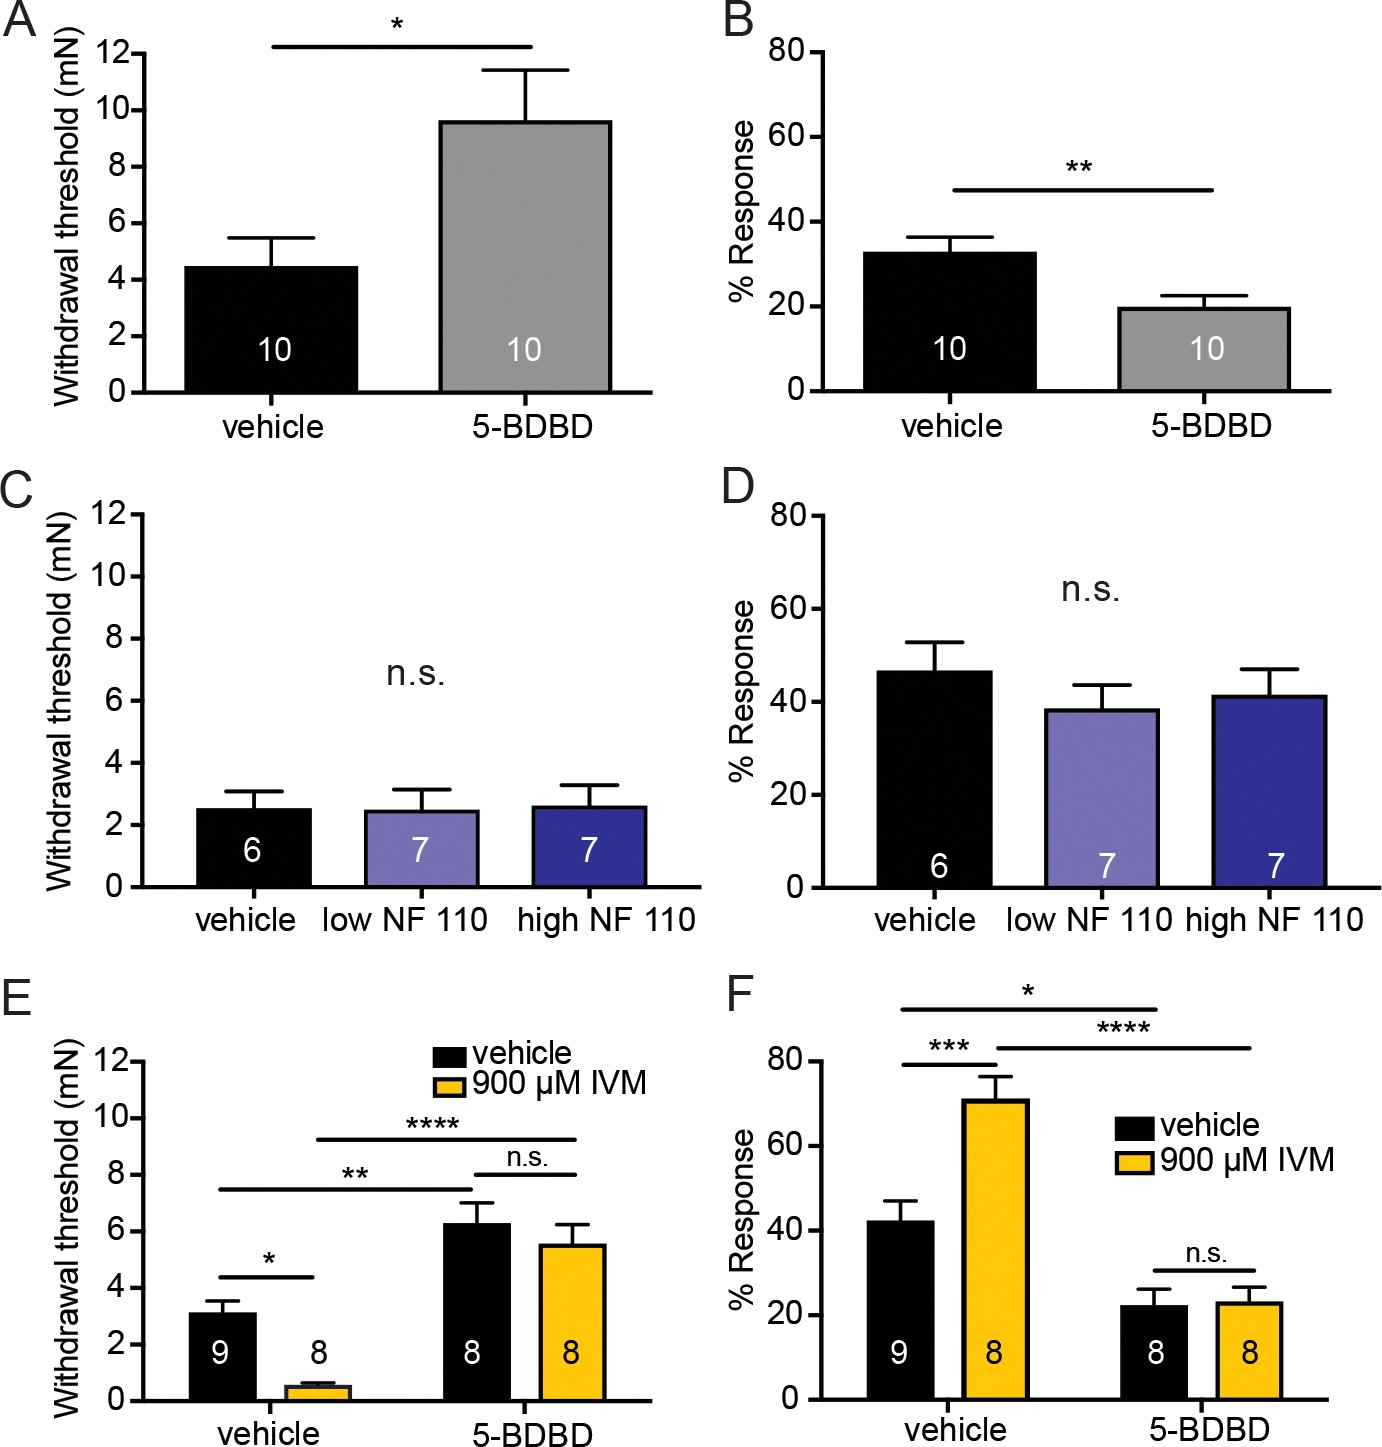
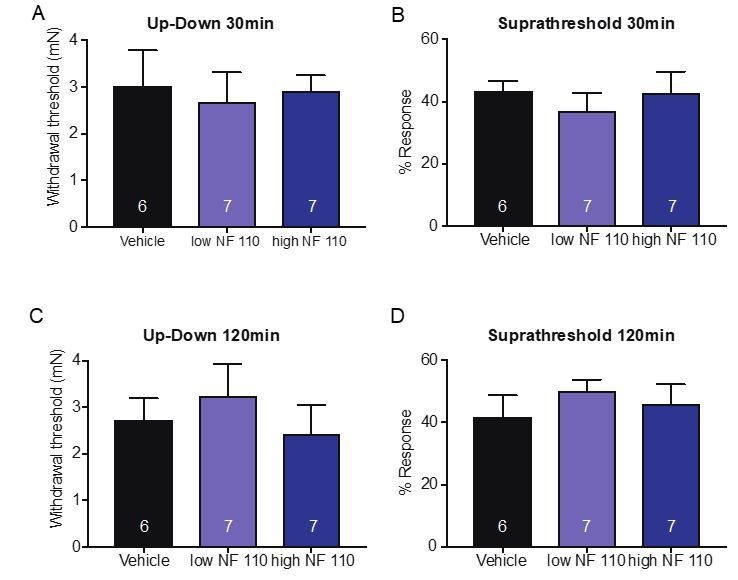
(A) Naive C57BL/6J mice were injected with either 5-BDBD (selective P2X4 antagonist) or vehicle, 1 hr prior to behavioral experiments. Animals injected with 5-BDBD had significantly higher paw withdrawal thresholds than their vehicle controls (*p=0.0190), Mann-Whitney U-test. (B) Animals injected with 5-BDBD showed fewer responses to the 3.61 mN stimulus than the vehicle control (**p=0.0033), Mann-Whitney U-test. (C) Naive C57BL/6J mice were injected with either vehicle, low NF 110 (500 nM) or high NF 110 (5 mM) 1 hr prior to behavior assays. Neither the low nor the high concentration of NF 110 had an effect on the paw withdrawal thresholds of the animals (n.s. p=0.9946), Kruskal-Wallis test. (D) Injection of low- or high concentration NF 110 had no effect on the percent response to a suprathreshold 3.61 mN stimulus (n.s. p=0.6083), Kruskal-Wallis test. (E) 5-BDBD or vehicle was injected 1 hr prior to the behavior assays and 20 min prior to the assays animals were also injected with 900 μM ivermectin or vehicle. Ivermectin with vehicle injection decreased the paw withdrawal thresholds significantly as compared to the ivermectin and 5-BDBD combined injection (****p<0.0001), two-way ANOVA, Tukey post-hoc. (F) Ivermectin injection with 5-BDBD caused significantly fewer responses than when ivermectin was injected with the vehicle control (****p<0.0001), two-way ANOVA, Tukey post-hoc. Furthermore, ivermectin with 5-BDBD was not significantly different from the 5-BDBD with vehicle control (n.s. p=0.9989), two-way ANOVA, Tukey post-hoc. Data are represented as mean ± SEM. The experimenter was blinded to compound treatment. See also Figure 6—figure supplement 1.
Figure 6—figure supplement 1
P2X4 inhibition (5-BDBD) or potentiation (ivermectin) does not affect membrane excitability in sensory neurons.
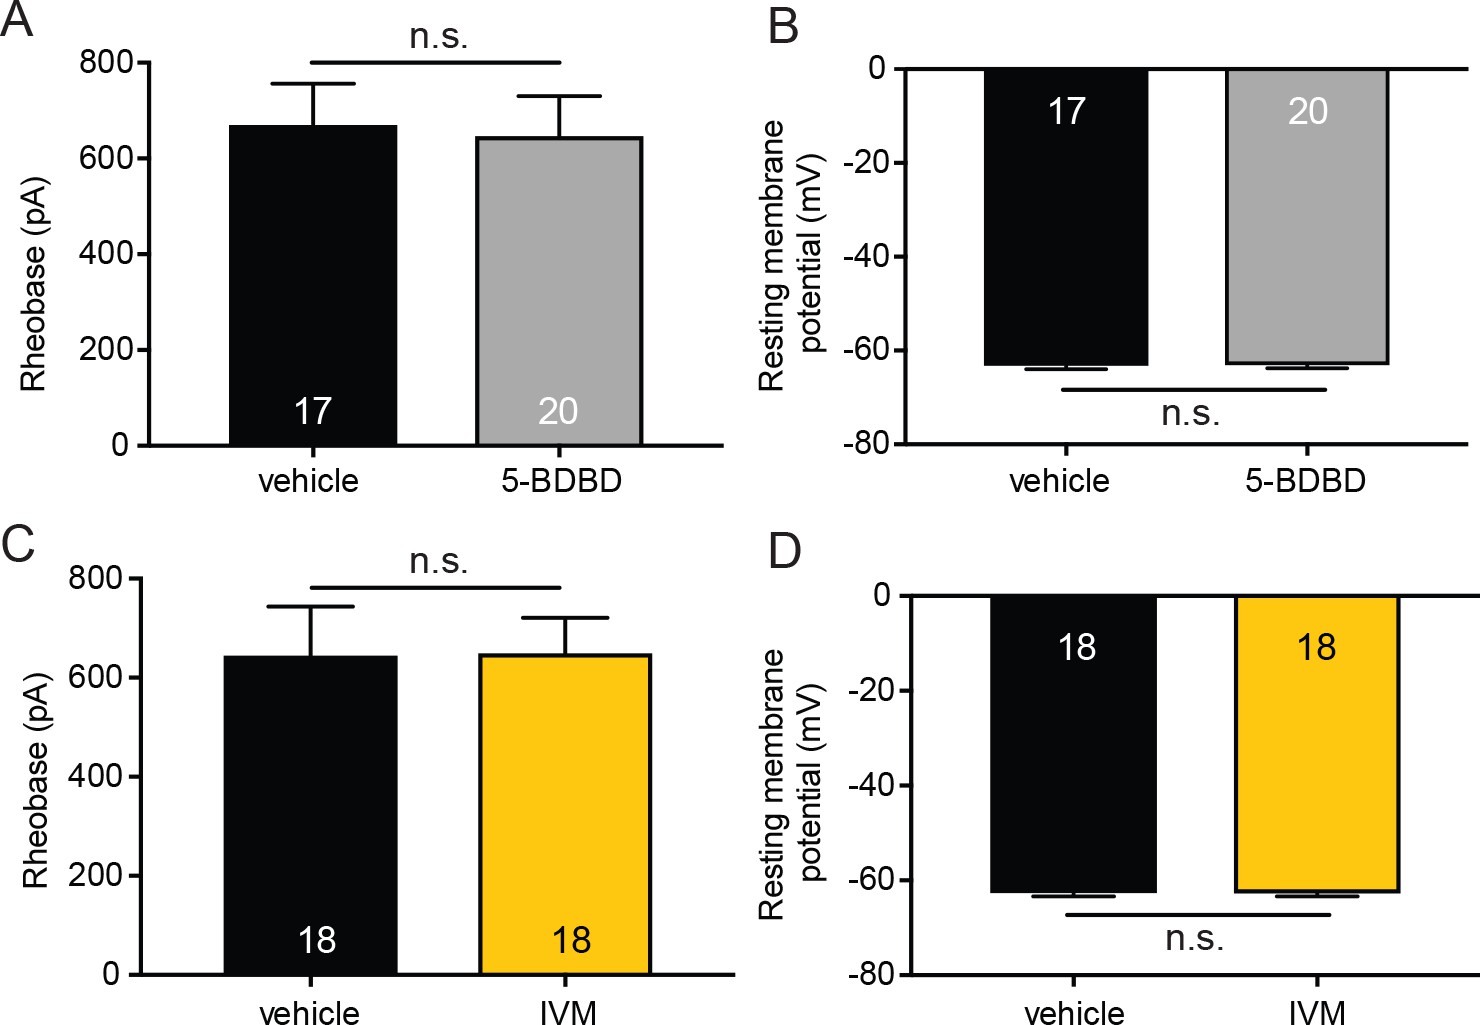
(A) 20 mM 5-BDBD or vehicle were added to the extracellular buffer . 5-BDBD did not significantly change the rheobase as compared to vehicle (n.s. p=0.7919), Mann-Whitney U-test. (B) 5-BDBD also did not significantly alter the resting membrane potential of sensory neurons when compared to vehicle addition to the buffer (n.s. p=0.8913) unpaired t-test. (C) 9 mM ivermectin (IVM) or vehicle were added to the extracellular buffer. IVM did not significantly change the rheobase as compared to vehicle addition to the extracellular buffer (n.s. p=0.6899), Mann-Whitney U-test. (D) IVM addition to the extracellular solution also did not significantly alter the resting membrane potential of sensory neurons when compared to vehicle (n.s. p=0.9540) unpaired t-test. Data are represented as mean ± SEM.
Figure 7 with 1 supplement
ATP is primarily acting through P2X4 receptors on sensory neurons to mediate innocuous and noxious touch in vivo.
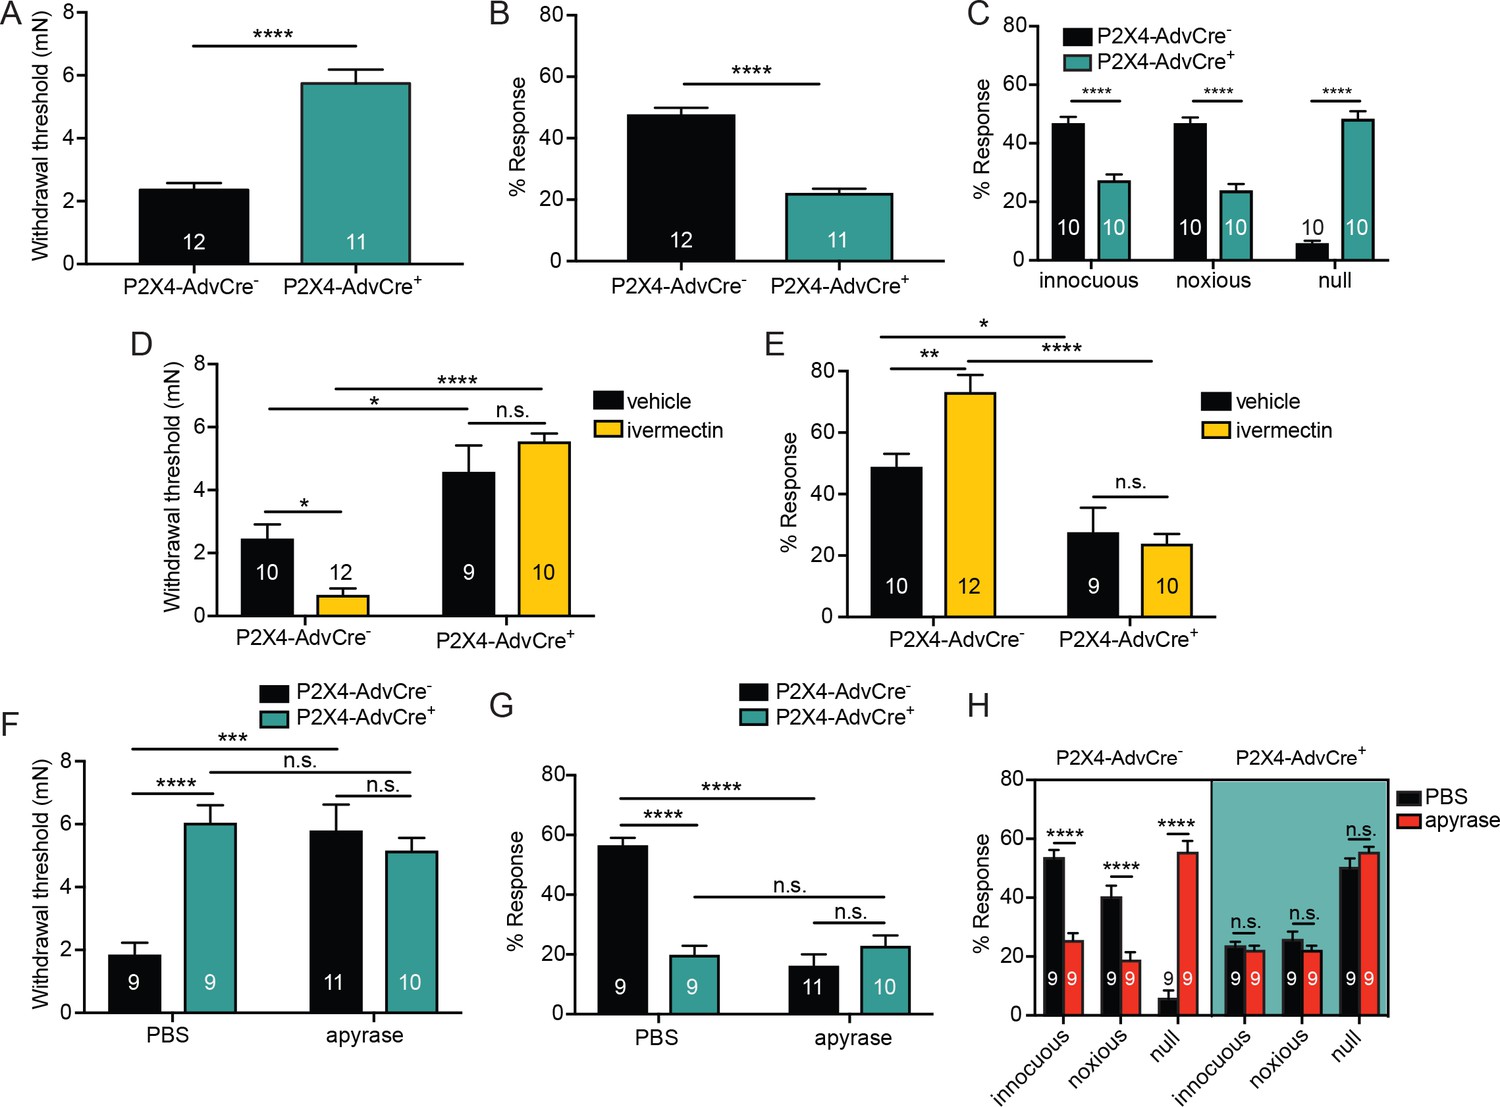
(A) P2X4-AdvCre+ animals had higher paw withdrawal thresholds than their littermate controls (****p<0.0001), Mann-Whitney U-test. (B) P2X4-AdvCre+ animals also showed fewer responses to the 3.61 mN stimulus than their controls (****p<0.0001), Mann-Whitney U-test. (C) P2X4-AdvCre+animals showed a significant increase in null responses in the noxious needle assay (****p<0.0001) as compared to P2X4 AdvCre- animals. P2X4-AdvCre+animals also showed a significant decrease in innocuous (****p<0.0001) and noxious responses (****p<0.0001) as compared to their controls; two-way ANOVA, Tukey post-hoc. (D) P2X4-AdvCre+ animals and littermates were injected with 900 μM ivermectin 20 min prior to the behavior assays. P2X4-AdvCre+ showed no sensitization after ivermectin injection (n.s. p=0.4605), whereas P2X4-AdvCre- controls with ivermectin injection had significantly lower paw withdrawal thresholds compared to the vehicle injected P2X4-AdvCre- animals (*p=0.0273) and the ivermectin injected P2X4-AdvCre+ animals (****p<0.0001), two-way ANOVA, Tukey post-hoc. (E) P2X4-AdvCre+animals injected with ivermectin were not sensitized after ivermectin injection (n.s. p=0.9615) and had significantly fewer responses than their littermate controls injected with ivermectin (****p<0.0001); two-way ANOVA, Tukey post-hoc. (F) Apyrase treatment significantly elevated the paw withdrawal threshold of P2X4 AdvCre- animals (****p<0.0001), but it had no additional effect on P2X4-AdvCre+animals (n.s. p=0.6573), two-way ANOVA, Tukey post-hoc. (G) Apyrase treatment significantly lowered the number of responses to the 3.61 mN filament in P2X4-AdvCre- animals (****p<0.0001), but it had no additional effect on P2X4-AdvCre+ animals (n.s. p=0.9126). Furthermore, P2X4-AdvCre- apyrase treated animals were not significantly different from P2X4-AdvCre+ apyrase treated animals (n.s. p=0.4330), two-way ANOVA, Tukey post hoc. (H) Apyrase treatment in P2X4-AdvCre- animals significantly elevated the null responses (****p<0.0001) and decreased both the innocuous (****p<0.0001) and noxious (****p<0.0001) responses as compared to P2X4-AdvCre- animals treated with PBS. Apyrase treatment had no additional effect on P2X4-AdvCre+ animals compared to the PBS treatment (innocuous n.s. p>0.9999; noxious n.s. p=0.9993; null n.s. p=0.9543), three-way ANOVA, Tukey post-hoc. Data are represented as mean ± SEM. The experimenter was blinded to genotype and compound treatment. See also Figure 7—figure supplement 1.
Figure 7—figure supplement 1
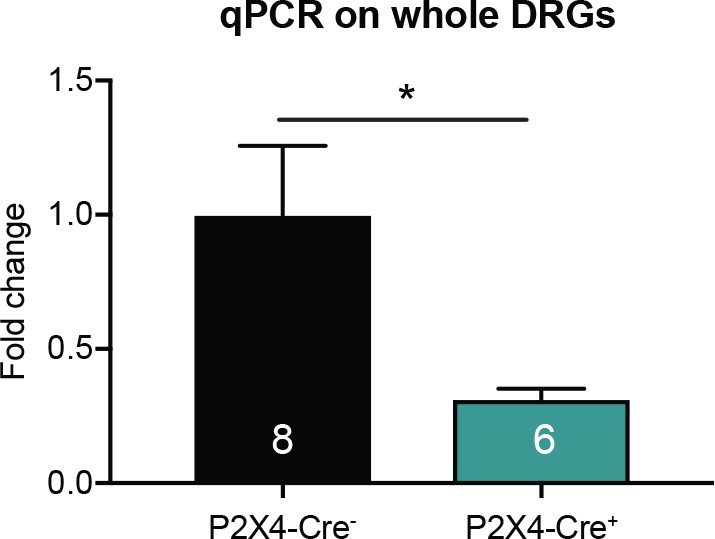
P2X4-AdvCre+animals have a ~70% knockdown of P2rx4 in sensory neurons.
P2rx4 levels were normalized to GAPDH. P2X4-AdvCre+ DRG samples had 69.6% less P2rx4than P2X4-AdvCre- DRGs (*p=0.0423). Each sample was run in triplicates, unpaired t-test. Data are represented as mean ± SEM.
Figure 8
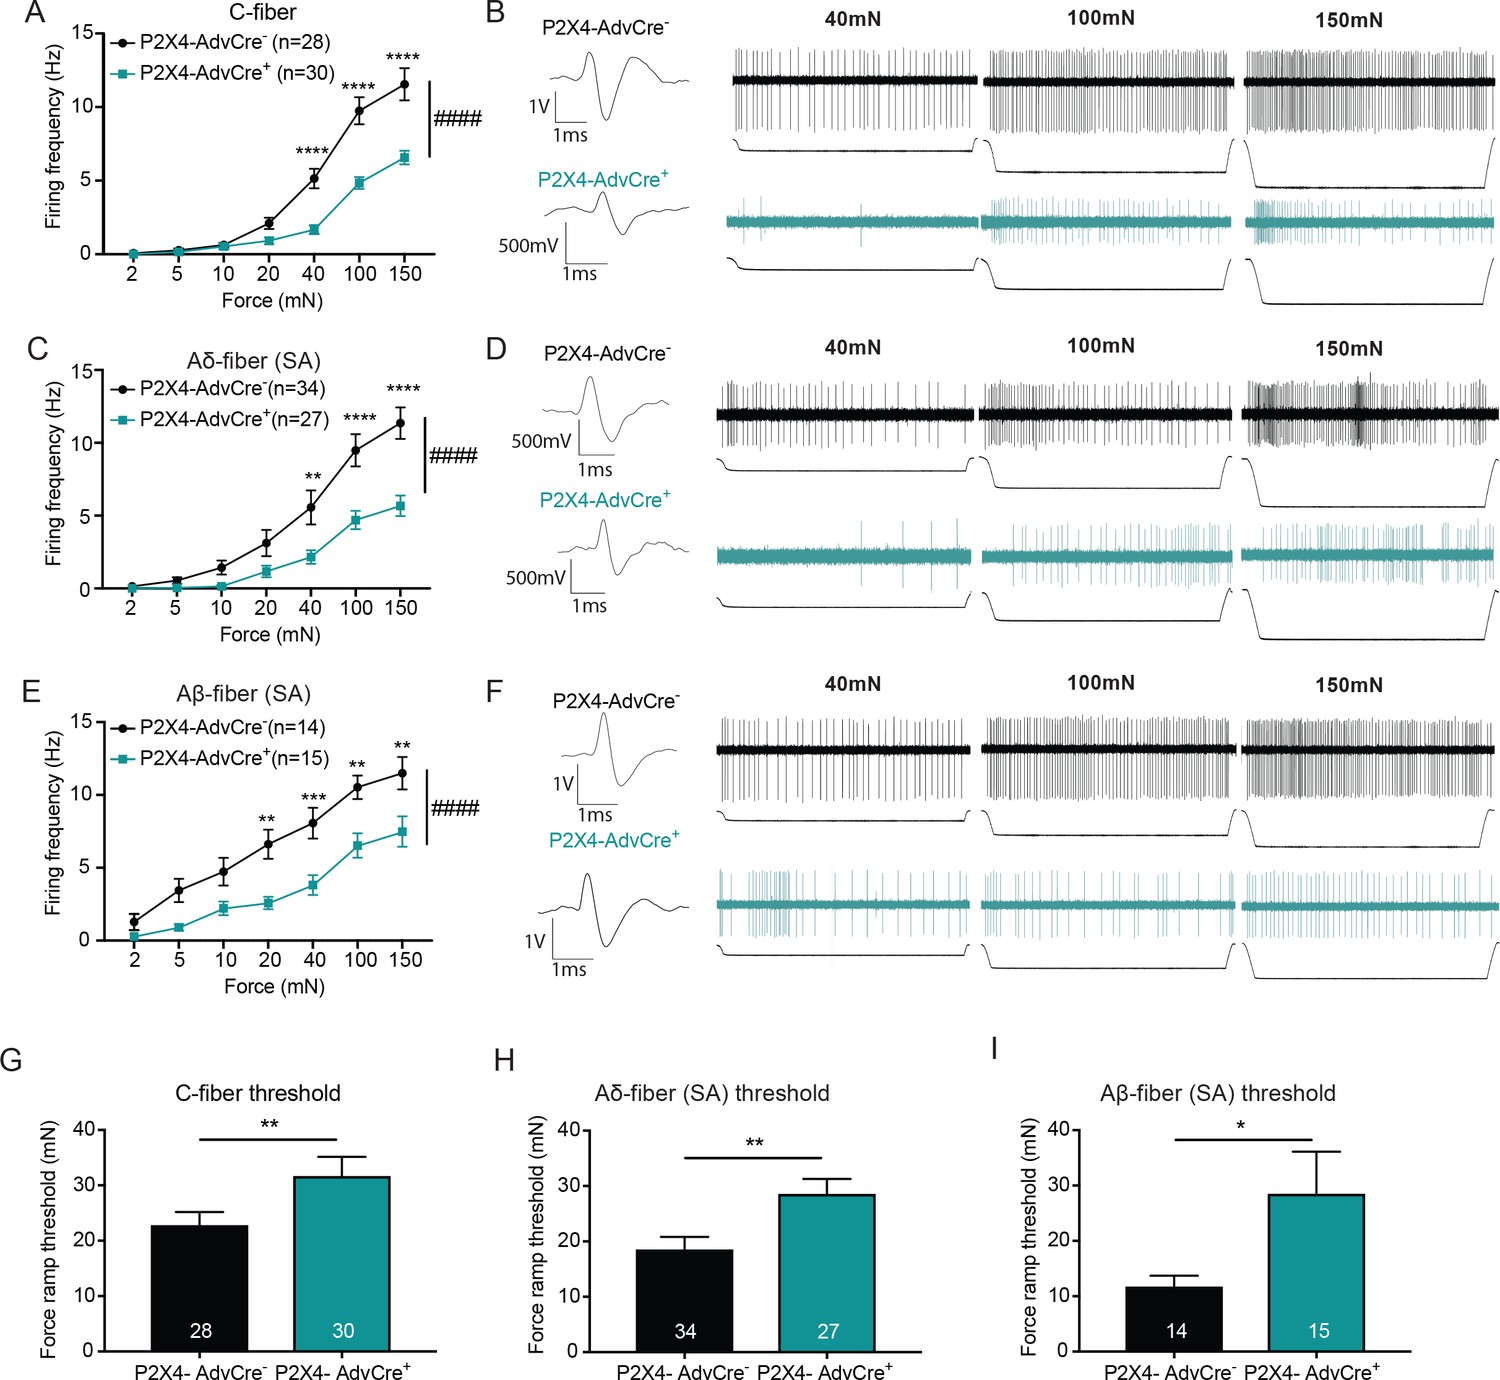
The knockdown of P2X4 in Advillin-expressing neurons significantly decreases afferent firing and elevates mechanical action potential thresholds of slowly adapting (SA) C-fibers, SA-Aδ and SA-Aβ-fibers.
Recordings were made from tibial skin-nerve preparations of P2X4-AdvCre- and P2X4-AdvCre+ animals. Action potentials were recorded with a force ramp of 2, 5, 10, 20, 40, 100 and 150 mN over a 10 second period. (A) C-fibers were characterized based on their conduction velocity of <1.2 m/s. P2X4-AdvCre+ C-fibers overall fired significantly fewer action potentials (####p<0.0001), (40 mN ****p<0.0001; 100 mN ****p<0.0001; 150 mN ****p<0.0001), two-way ANOVA, Sidak post-hoc test (n = 23 mice). (B) C-fiber traces, top: P2X4-AdvCre- and bottom: P2X4-AdvCre+. (C) Aδ-fibers were characterized based on their conduction velocity of 1.2–10 m/s and repeated firing to sustained force. P2X4-AdvCre+ SA-Aδ-fibers overall fired significantly fewer action potentials (####p<0.0001), (40 mN **p=0.0055; 100 mN ****p<0.0001; 150 mN ****p<0.0001), two-way ANOVA, Sidak post-hoc test (n = 23 mice). (D) SA-Aδ-fiber action potential traces, top: P2X4-AdvCre- and bottom: P2X4-AdvCre+. (E) Aβ-fibers were characterized based on their conduction velocities > 10 m/s and repeated firing to sustained force. P2X4-AdvCre+ SA-Aβ-fibers overall fired fewer action potentials (####p<0.0001), (20 mN **p=0.0020; 40 mN ***p=0.0010; 100 mN **p=0.0023; 150 mN **p=0.0023), two-way ANOVA, Sidak post-hoc test (n = 23 mice). (F) SA-Aβ fiber action potential traces, top: P2X4-AdvCre- and bottom: P2X4-AdvCre+. G) Action potential firing thresholds of the different fiber subtypes were determined using a force ramp from 0 to 100 mN over a 10 second period. C-fiber thresholds were significantly elevated in P2X4-AdvCre+ preparations as compared to the P2X4-AdvCre- preparations (*p=0.0446), unpaired t-test. (H) SA-Aδ-fiber action potential thresholds in P2X4-AdvCre+ mice were significantly higher than in littermate controls (**p=0.0065), unpaired t-test. (I) P2X4-AdvCre+ SA-Aβ-fibers action potential thresholds were significantly higher than those of P2X4-AdvCre- SA-Aβ-fibers (*p=0.0497), unpaired t-test. Data are represented as mean ± SEM.
Figure 9
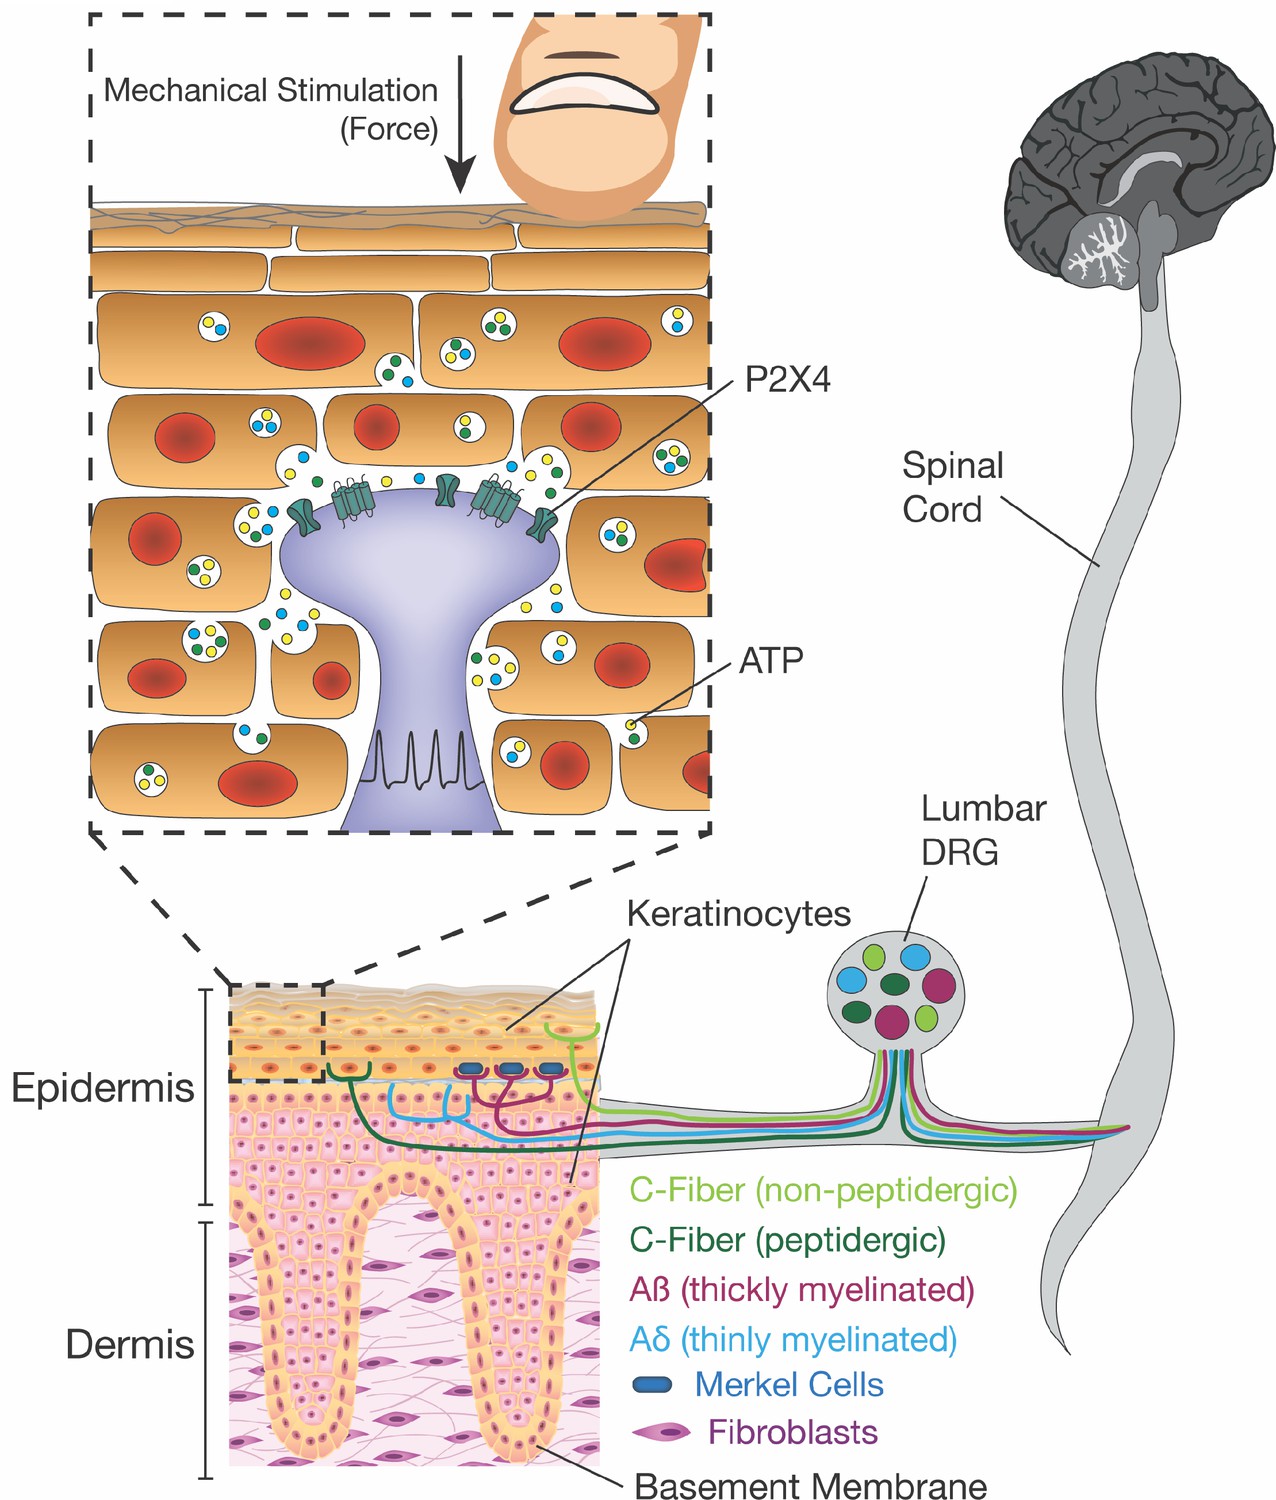
Schematic diagram depicting the proposed mechanism for ATP release induced by mechanical stimulation of keratinocytes and its interaction with P2X4 on sensory nerve endings.
Touching of the skin, and therefore the mechanical stimulation of keratinocytes, elicits release of factors such as ATP, which in turn, acts on P2X4 and possibly other receptors on sensory neurons found within the epidermis, thereby causing action potential firing in the neurons and downstream effects leading to touch perception.
Author response image 1
Tables
Key resources table
| Reagent type (species) or resource | Designation | Source or reference | Identifiers | Additional information |
|---|---|---|---|---|
| Strain, strain background (C57BL/6J) | C57BL/6J | The Jackson Laboratory | Jackson Stock #: 000664 RRID:IMSR_JAX:000664 | |
| Strain, strain background (K14Cre) | K14Cre | The Jackson Laboratory | B6N.Cg-Tg(KRT14-cre)1Amc (Jackson stock #: 018964) RRID:IMSR_JAX:018964 | |
| Strain, strain background (Archaerhodopsin3 fl/fl) | Arch | The Jackson Laboratory | Ai35D (B6;129S-Gt(ROSA) 26Sortm35.1(CAG-aop3/GFP)Hze/J (Jackson stock #: 012735) RRID:IMSR_JAX:012735 | |
| Strain, strain background (Channelrhodopsin2 fl/fl) | ChR | The Jackson Laboratory | Ai32 (B6;129S-Gt(ROSA) 26Sortm32(CAG-COP4+H134R/EYFP)Hze/J) (Jackson stock #: 007909) RRID:IMSR_JAX:007909 | |
| Strain, strain background (TdTomato fl/fl) | tdTomato | The Jackson Laboratory | Ai14; B6.Cg-Gt(ROSA) 26Sortm14(CAG-TDTomato)Hze/J (Jackson stock #: 007914) RRID:IMSR_JAX:007914 | |
| Strain, strain background (AdvillinCre) | Advillin Cre | doi: 10.1073/pnas.1014411108; PMCID: PMC3044401 | ||
| Strain, strain background (P2X4 fl/fl) | P2X4 | doi: 10.1161/CIRCHEARTFAILURE. 113.001023; PMCID: PMC4289151 | ||
| Cell line (293 [HEK-293] cell line) | HEK-293 cells | ATCC® | RRID:CVCL_0045 Cat# ATCC® CRL-1573™ | |
| Transfected construct (GFP-tagged P2RX2 plasmid) | GFP-P2X2 HEK-293 cell | Origene | RG216207 | |
| Antibody (Rabbit polyclonal anti-Keratin 14) | K14 | Biologend | RRID:AB_2616896 Cat# 905304 AB_2616894 | 1:500 dilution |
| Antibody (Donkey anti-rabbit AlexaFluor 594) | Invitrogen | RRID:AB_2556547 Cat# R37119 | 2 drops/1mL | |
| Commercial assay or kit (Purelink RNA Microscale Kit) | ThermoFisher Scientific | Cat#12183016 | ||
| Commercial assay or kit (Superscript Variable Input Linear Output (VILO) cDNA Synthesis Kit) | ThermoFisher Scientific | Cat#11754050 | ||
| Commercial assay or kit (TaqMan primer and probes mouse P2X4) | LifeTechnologies | Assay ID: Mm00501787_m1 | ||
| Commercial assay or kit (TaqMan primer and probes mouse GAPDH) | LifeTechnologies | Assay ID: Mm99999915_g1 | ||
| Commercial assay or kit (Sarissa Probe® ATP / ATP) | Sarissa Biomedical Limited; doi: 10.3791/53059; PMCID: PMC4684070 | Cat# SBS-ATP-05-50 | ||
| Commercial assay or kit (Sarissa Probe® Null / NUL) | Sarissa Biomedical Limited; doi: 10.3791/53059; PMCID: PMC4684070 | Cat# SBS-NUL-05-50 | ||
| Chemical compound, drug (apyrase) | apyrase | Sigma-Aldrich; doi:10.1371/journal. pbio.1001747 | CAS. No. 9000-95-7 Cat#A6237 | |
| Chemical compound, drug (5-BDBD (5-(3-Bromophenyl) -1,3-dihydro-2H-benzofuro[3,2-e] -1,4-diazepin-2-one)) | 5-BDBD | Tocris Bioscience | CAS 768404-03-1 Cat# 3579 | |
| Chemical compound, drug (ivermectin) | IVM or ivermectin | Tocris Bioscience | CAS 70288-86-7 Cat#1260 | |
| chemical compound, drug (dimethyl sulfoxide) | DMSO | Sigma-Aldrich | Cat # 8418-100mL | |
| Chemical compound, drug (NF 110) | NF 110 | Tocris Bioscience | CAS 111150-22-2 Cat#2548 | |
| Software, algorithm (Pulse) | HEKA Electronics | http://www.heka.com/downloads/downloads_main.html#down_patchmaster | ||
| Software, algorithm (FitMaster) | HEKA Electronics | http://www.heka.com/downloads/downloads_main.html#down_fitmaster | ||
| Software, algorithm (Origin 5.0) | Origin Lab | http://originlab.com | ||
| Software, algorithm (Graphpad Prism 7) | Graphpad | https://graphpad.com/scientific-software/prism/ | ||
| Software, algorithm (ANY-maze) | ANY-maze | http://www.anymaze.co.uk/index.htm | ||
| Software, algorithm (LabChart) | ADInstruments | https://www.adinstruments.com/products/labchart | ||
| Software, algorithm (DY2000 Multi-channel Potentiostat) | DigiIvy | http://www.digi-ivy.com/dy2000.html | ||
| Other (490 nm LED) | 490 nm | Thorlabs inc | Cat# M490L2 | |
| Other (590 nm LED) | 590 nm | Thorlabs inc | Cat# M590L2 | |
| Other (Compact T-Cube LED driver) | Thorlabs inc | CAT# LEDD1B | ||
| Other (473 nm Laser) | 473 nm | Laserglow | Cat# R471005GX | |
| Other (589 nm Laser) | 589 nm | Laserglow | Cat# R581005GX | |
| Other (595 nm LED strip) | 596 nm LED floor | Environmental Lights | Cat# amber3528-120-10-reel | |
| Other (460 nm LED strip) | 460 nm LED floor | Environmental Lights | Cat# blue3528-120-10-reel | |
| Other (BAT-12 Microprobe Thermometer) | Physitemp | Cat# BAT-12 | ||
| Other (DY2023 multi-channel potentiostat) | DigiIvy | Cat# DY2023 | ||
| Other (EPC9 single patch amplifier) | HEKA Electronics | Cat# EPC9 | ||
| Other (ENV 800 SC amplifier module) | Piezosystemjena | Cat# E-280-100 | ||
| Other (PA 25114 SGpreloaded stack type actuator) | Piezosystemjena | Cat# P-153-01 | ||
| Other (Superfrost Plus Gold Slides) | Electron Microscopy Sciences | Cat #: 71864-01 |
Additional files
-
Transparent reporting form
- https://doi.org/10.7554/eLife.31684.020
Download links
A two-part list of links to download the article, or parts of the article, in various formats.
Downloads (link to download the article as PDF)
Open citations (links to open the citations from this article in various online reference manager services)
Cite this article (links to download the citations from this article in formats compatible with various reference manager tools)
Keratinocytes mediate innocuous and noxious touch via ATP-P2X4 signaling
eLife 7:e31684.
https://doi.org/10.7554/eLife.31684


