Entorhinal cortex receptive fields are modulated by spatial attention, even without movement
- University of Osnabrück, Germany
- University of Washington School of Medicine, Washington National Primate Research Center, United States
- University Medical Center Hamburg-Eppendorf, Germany
Figures
Figure 1

Task design and recording location.
(A) Monkeys were trained to maintain central fixation while a dot moved across the screen and were rewarded for releasing a response bar when they detected a color change of the moving dot. Dot trajectories were smoothed Hamiltonian cycles through a 23 × 23 grid and covered the screen without a central bias. The blue trajectory was not shown during the experiment. (B) Temporal structure of a trial. (C) Recording setup and example of MRI-guided electrode placement (coronal section through the EC). Recordings were carried out with a 12-site laminar electrode array mounted on a tungsten microelectrode (AXIAL Array, 30 μm diameter, 150 μm spacing, FHC Inc.). Tungsten electrode is represented in white, the yellow strip represents the span of the recording contacts. EC = Entorhinal Cortex. (D) Example cell recorded under conditions of covert attention. Left panel shows the estimated firing field (max. firing rate 1.47 Hz). The small black dots on the trajectory indicate the spikes recorded during the first cycle. They largely align with the average firing field (backdrop) based on all six cycles recorded for this neuron. The 2D autocorrelation in the right panel shows six peaks surrounding the center which is characteristic of grid cells (gridness score 1.80).
Figure 2
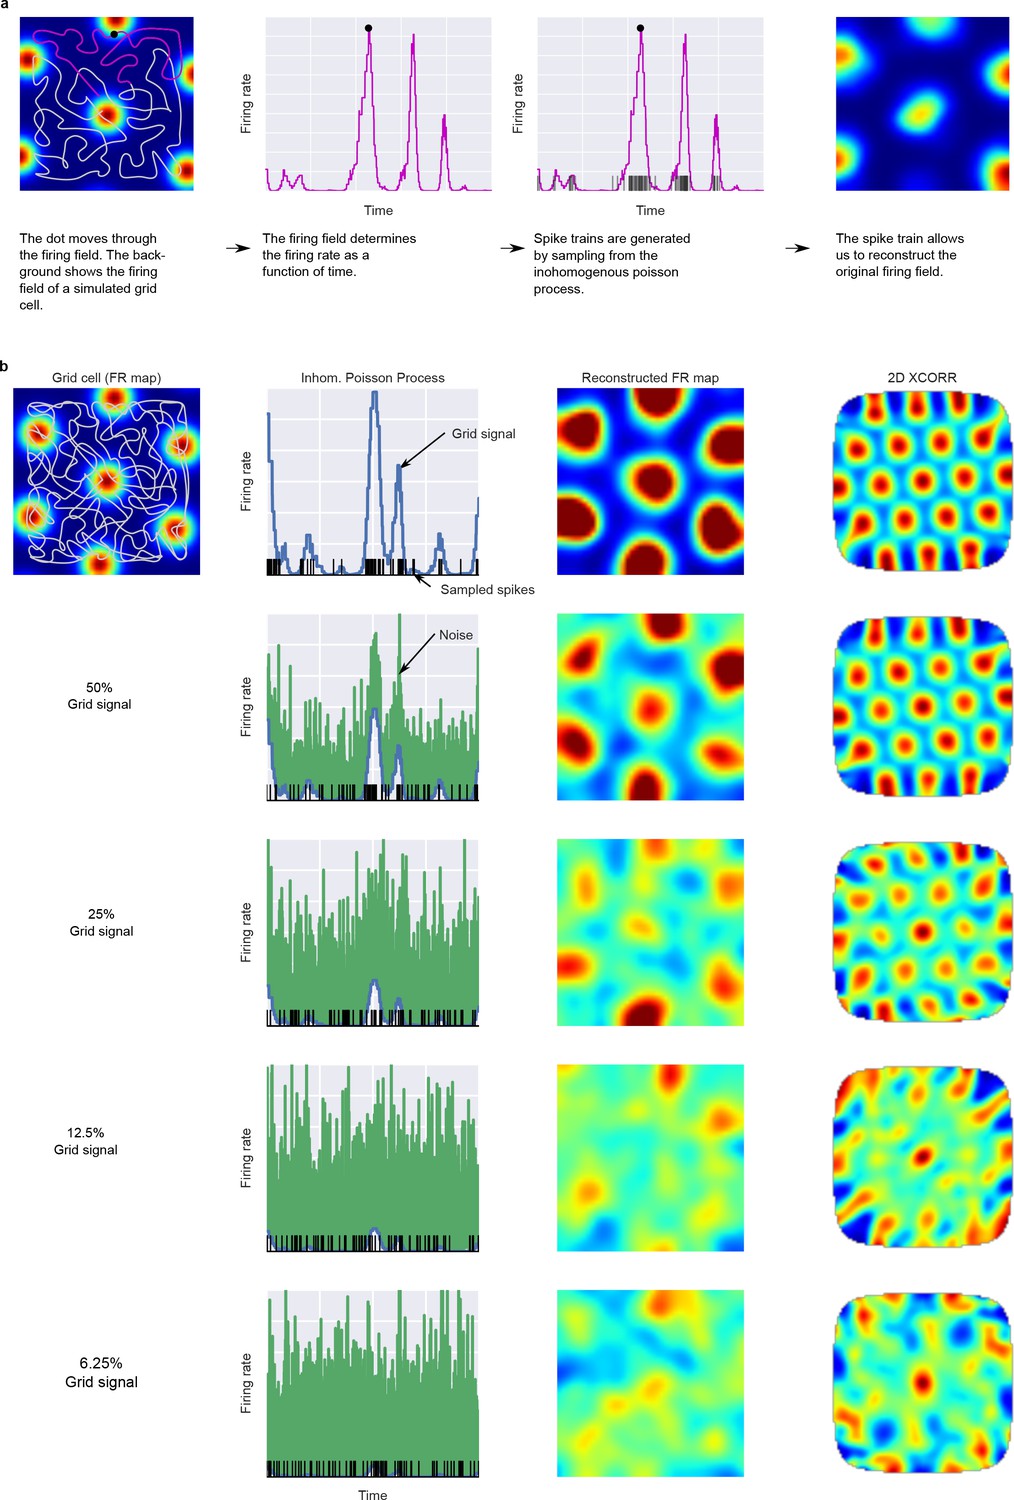
Simulation of units from grid-like firing fields.
Panel (A) shows how the dot’s trajectory and a 2D firing field generate the time varying firing rate for a simulated unit. Panel (B) shows how different amounts of noise influence the reconstructed firing fields and 2D autocorrelations.
Figure 3

Classification of grid cells.
Gray filled circles indicate gridness and firing field modulation index values for our recorded EC units. Solid curves show contours of the log likelihood ratio (in deciban) that indicates evidence in favor or against a cell being a grid cell. 4.25 deciban (thick line) corresponds to a false discovery rate (FDR) of <5% in our simulations, 10 deciban (10:1 odds ratio, thin dotted line) to a FDR of 1.26% and 20 deciban (thin dashed line) to a FDR of 0.07%. The FDR indicates how many simulated non-grid cells are classified as grid cells with each log likelihood ratio value. Cells above the curves are likely grid cells. Small insets with arrows show the 2D autocorrelation for example cells. Inset panel shows how many cells exceed a specific deciban threshold.
Figure 4
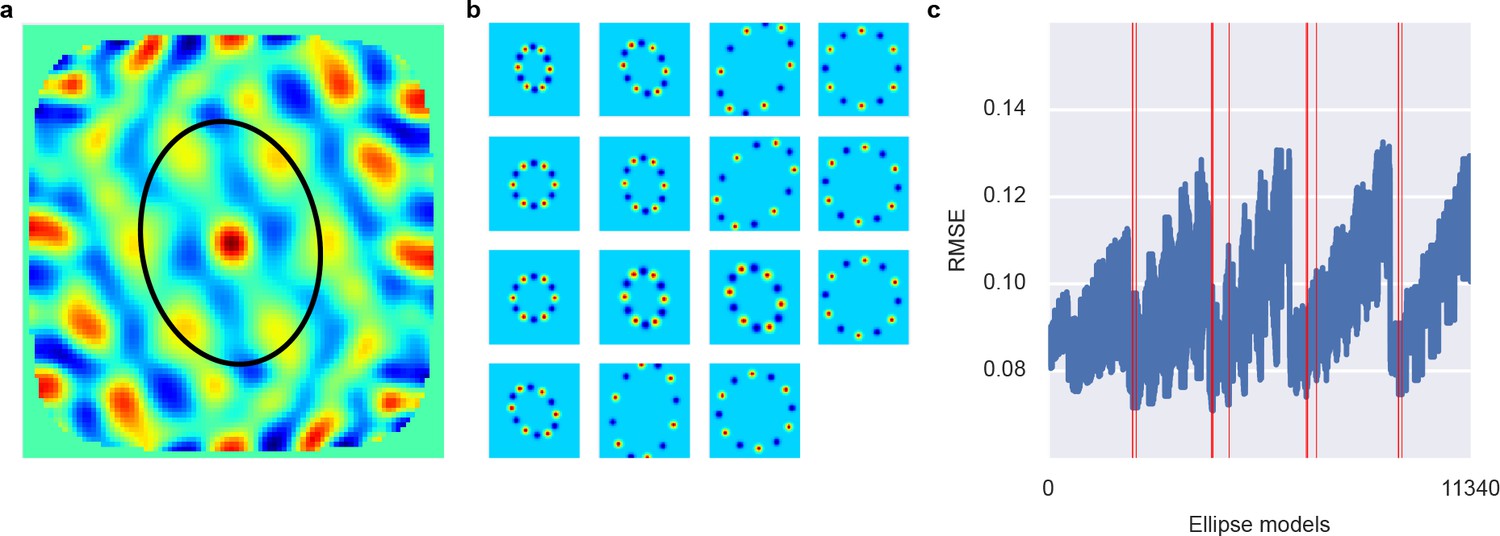
Ellipse fitting on 2D autocorrelation maps.
(A) shows one example 2D autocorrelation function and fitted ellipse that passes through six peaks. (B) shows a set of candidate ellipses with hexagonal peaks and valleys. To identify best-fitting ellipses, we generated a large number of potential ellipses that passed through at least one peak in the 2D autocorrelation and the computed the RMSE between ellipses and 2D autocorrelation. (C) shows the RMSE of a large number of candidate ellipses, arranged by a linear index into the five-dimensional parameter space for the ellipses. Red lines indicate ellipses selected by a peak shift algorithm whose maximum gridness score was assigned to this unit.
Figure 5
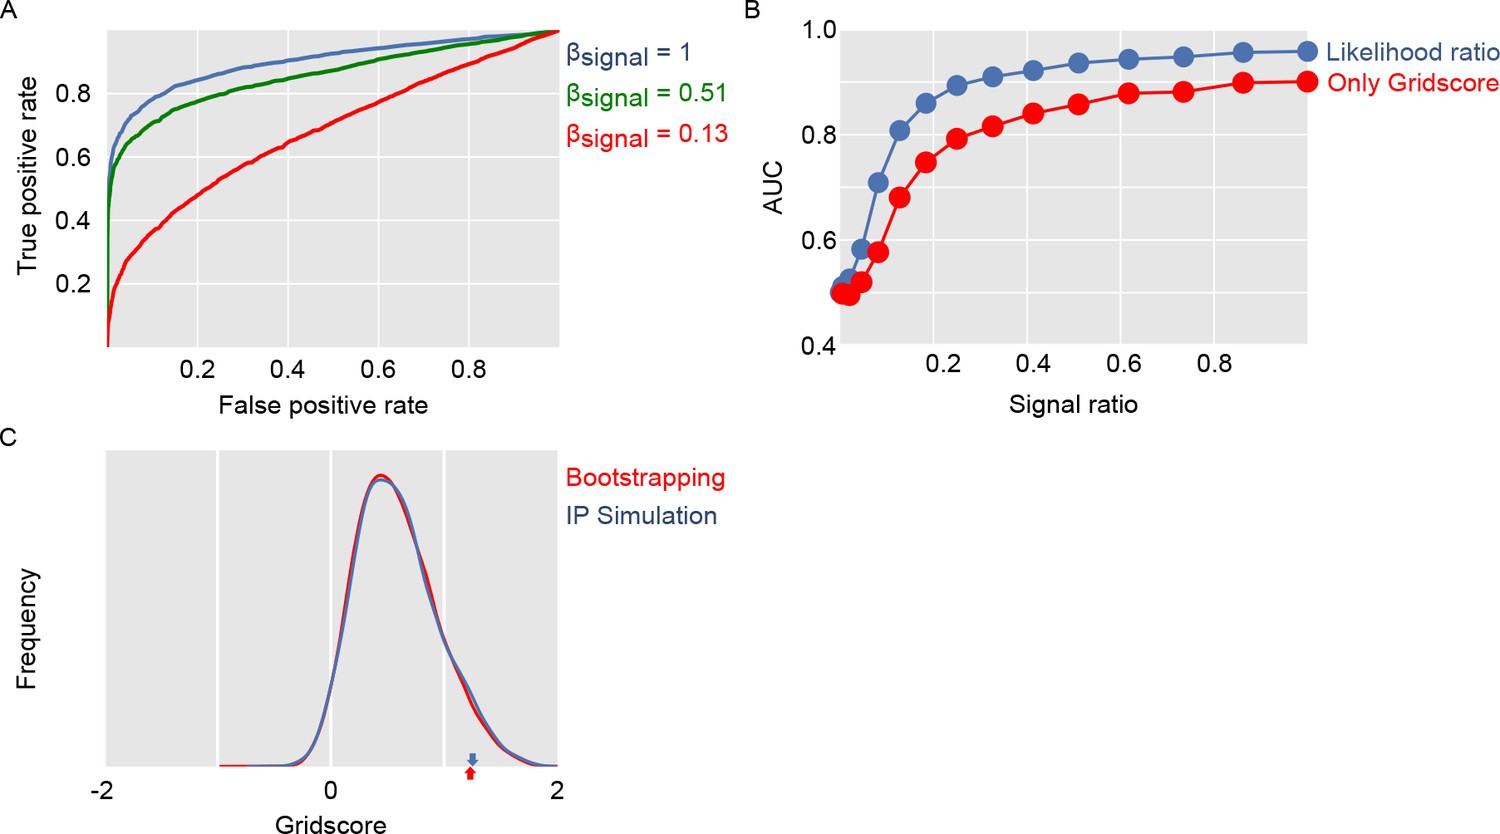
Evaluation of gridness score implementation and log likelihood ratio classification.
Panel (A) shows ROC curves for separating simulated grid-like units and simulated units with homogeneous firing fields. Panel (B) compares using only the gridness score with our approach of computing log likelihood ratios based on the ffm and gridness score. Panel (C) compares gridness scores obtained by shuffling spike sequences along the dots trajectory with gridness scores obtained from simulating units with homogenous noise.
Figure 6
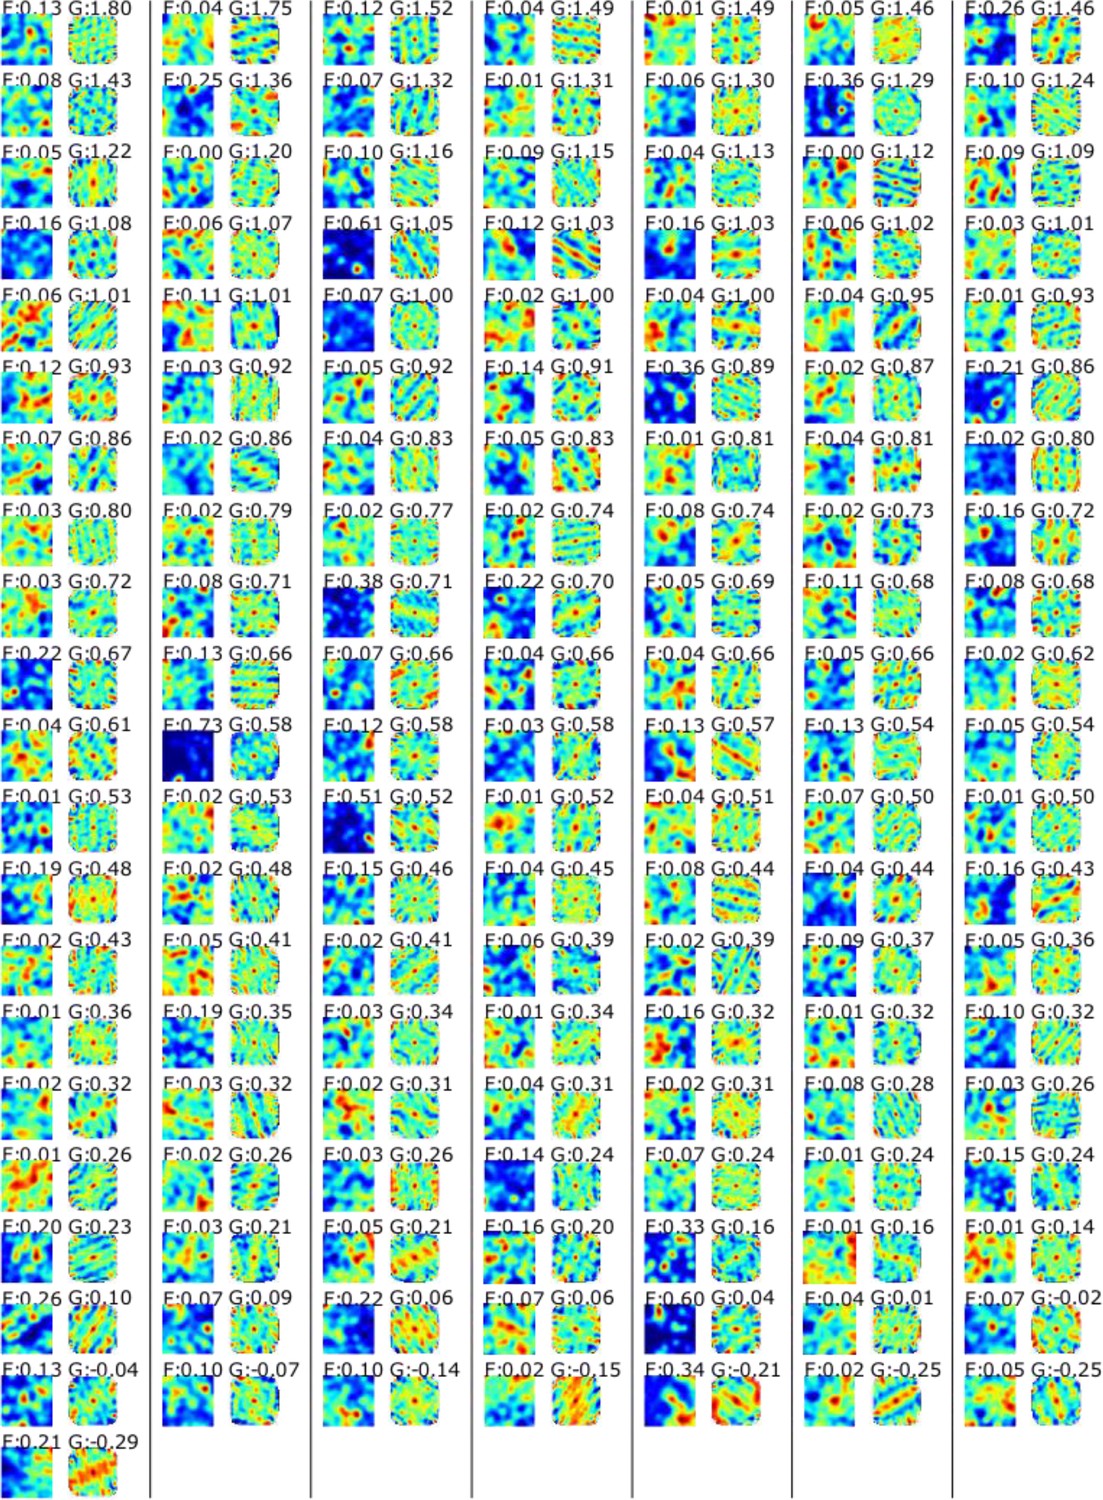
Rate maps (left) and autocorrelation functions (right) for all recorded EC cells.
Numbers on top give the firing field modulation index (F) and the gridness score (G).
Tables
Table 1
Number of recorded units (included/excluded) for each monkey and area.
https://doi.org/10.7554/eLife.31745.008| MP | PW | TO | |
|---|---|---|---|
| EC | 69/16 | 72/25 | −/− |
| Hippocampus | −/− | 97/3 | 189/18 |
Additional files
-
Transparent reporting form
- https://doi.org/10.7554/eLife.31745.010
Download links
A two-part list of links to download the article, or parts of the article, in various formats.
Downloads (link to download the article as PDF)
Open citations (links to open the citations from this article in various online reference manager services)
Cite this article (links to download the citations from this article in formats compatible with various reference manager tools)
Entorhinal cortex receptive fields are modulated by spatial attention, even without movement
eLife 7:e31745.
https://doi.org/10.7554/eLife.31745


