Pre-post synaptic alignment through neuroligin-1 tunes synaptic transmission efficiency
- University of Bordeaux, UMR 5297, F-33000, France
- CNRS, UMR 5297, F-33000, France
- Salk Institute for Biological Studies, United States
- UMS 3420 CNRS, Université de Bordeaux, US4 INSERM, F-33000, France
Figures
Figure 1 with 2 supplements
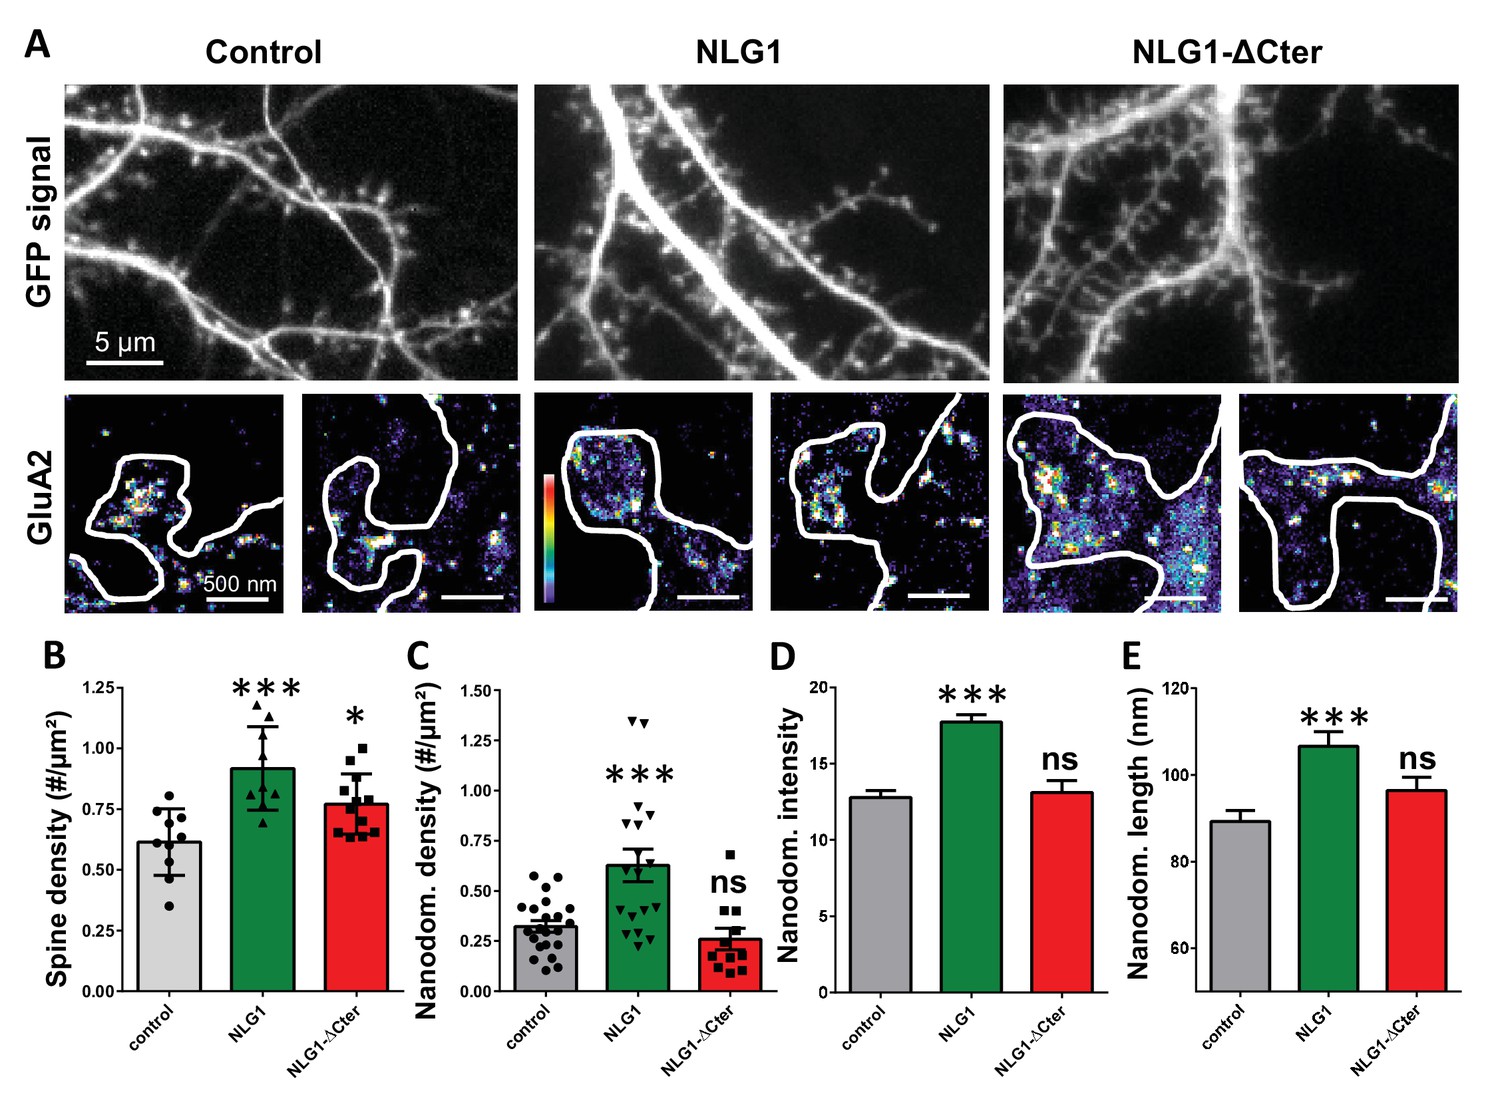
Expression of WT neuroligin but not NLG1-ΔCter affects AMPAR synaptic nano-organization.
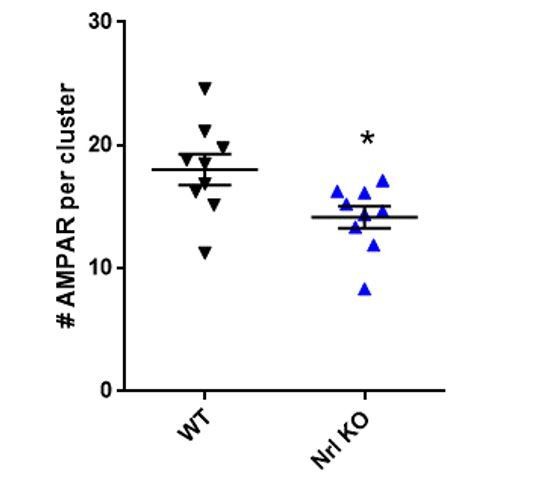
(A) Example of neurons transfected either with GFP, NLG1 + GFP or NLG1-ΔCter + GFP (from the left to the right), and two examples of AMPAR organization visualized with d-STORM technique. Intensity is color coded, scale go from 1 (purple) to 100 (white) detection per pixel. Average of spine density (B), AMPAR nanodomain density (C), nanodomains intensity expressed as number of receptors per nanodomain (D) and nanodomain length (E), on neuron expressing GFP, GFP +NLG1 and NLG1-ΔCter + GFP (n = 10; 9; 12 cells respectively; and between 200 to 500 individual domains).
Figure 1—figure supplement 1

Tessellation-based analysis reveals that synaptic AMPA receptor nanoscale organization is not affected by the expression of NLG1-ΔCter.
(A) Example of endogenous GluA2 organization inside synapse obtained with d-STORM technique on GFP (left panels) and GFP + NLG1-ΔCter (right panels) expressing cells. (B) Cumulative distribution of the estimated number of endogenous AMPAR per synapse. The insert represents the cell to cell variability of the synaptic AMPAR content. (C) Cumulative distribution and cell to cell variability (insert) of the number of endogenous AMPAR per nanodomain. (D) Cumulative distribution and cell to cell variability of the nanodomain diameter. (B–D) reveals no changes in synaptic AMPAR organization when NLG1-ΔCter is expressed (n = 12 and 13 cells, corresponding to 107 and 136 individual domains for control and NLG1-ΔCter respectively).
Figure 1—figure supplement 2
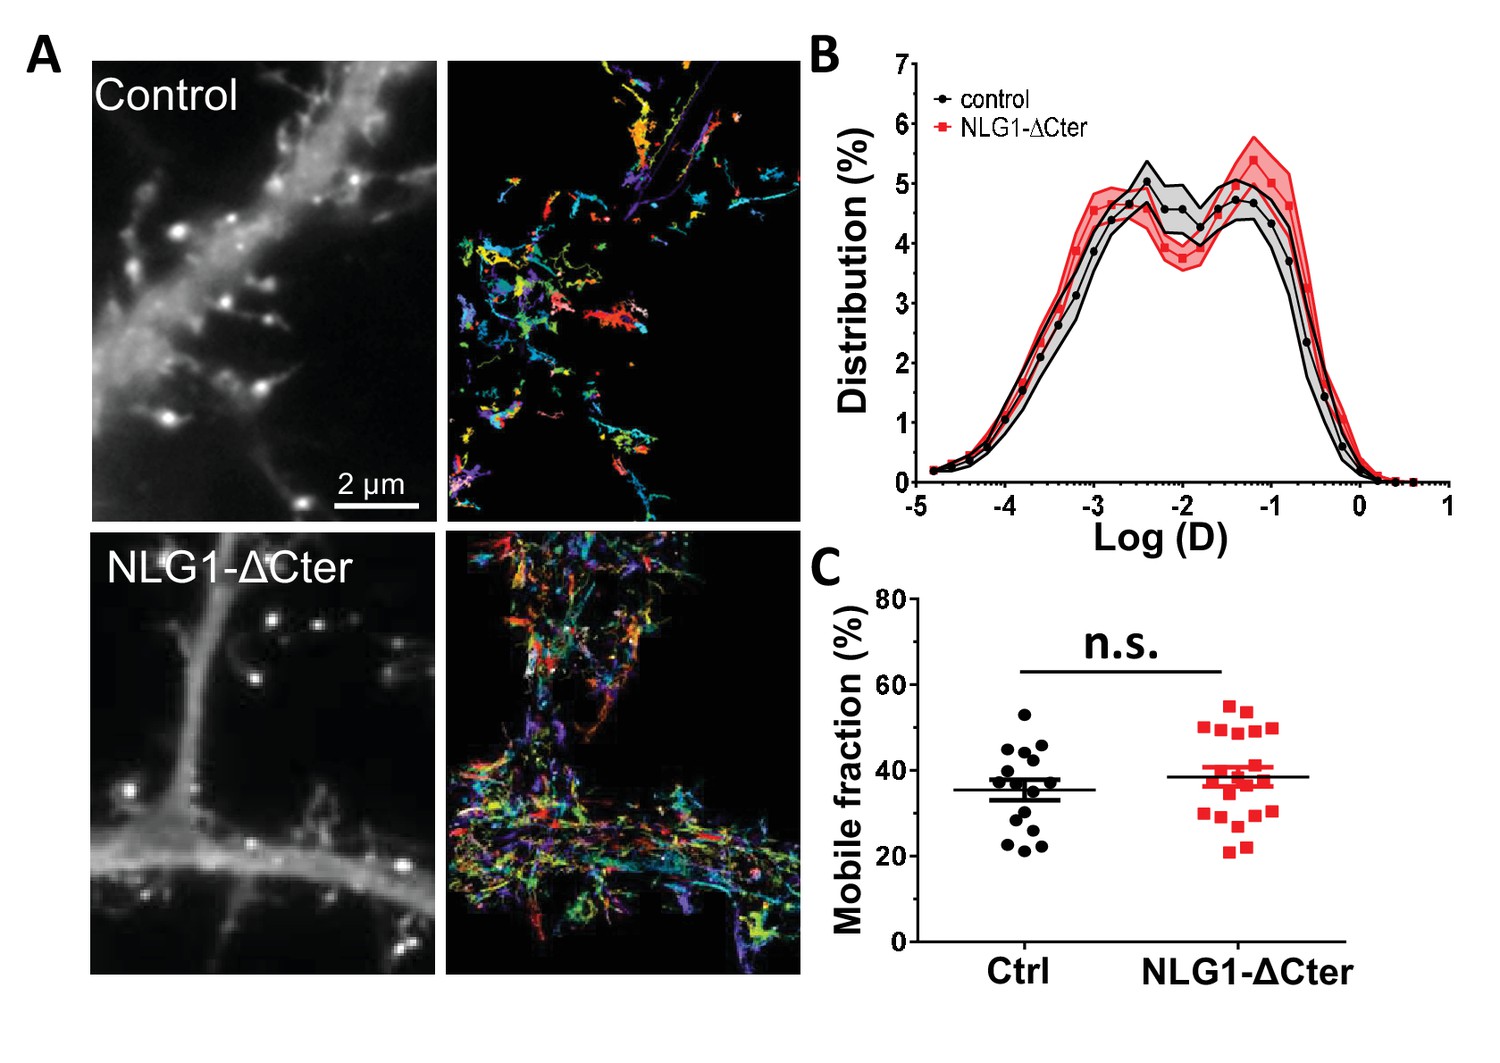
NLG1-ΔCter expression does not affect AMPAR lateral mobility.
(A) Example of endogenous GluA2 containing AMPAR mobility recorded with uPAINT technique on GFP (upper panel) and GFP + NLG1-ΔCter expressing cells. Each individual trajectory is color coded. (B) Average distribution of the logarithm of the diffusion coefficient and (C) mobile fraction reveal no modification of AMPAR mobility induced by the NLG1-ΔCter expression (n = 16 and 21 cells for control and NLG1-ΔCter respectively).
Figure 2 with 1 supplement
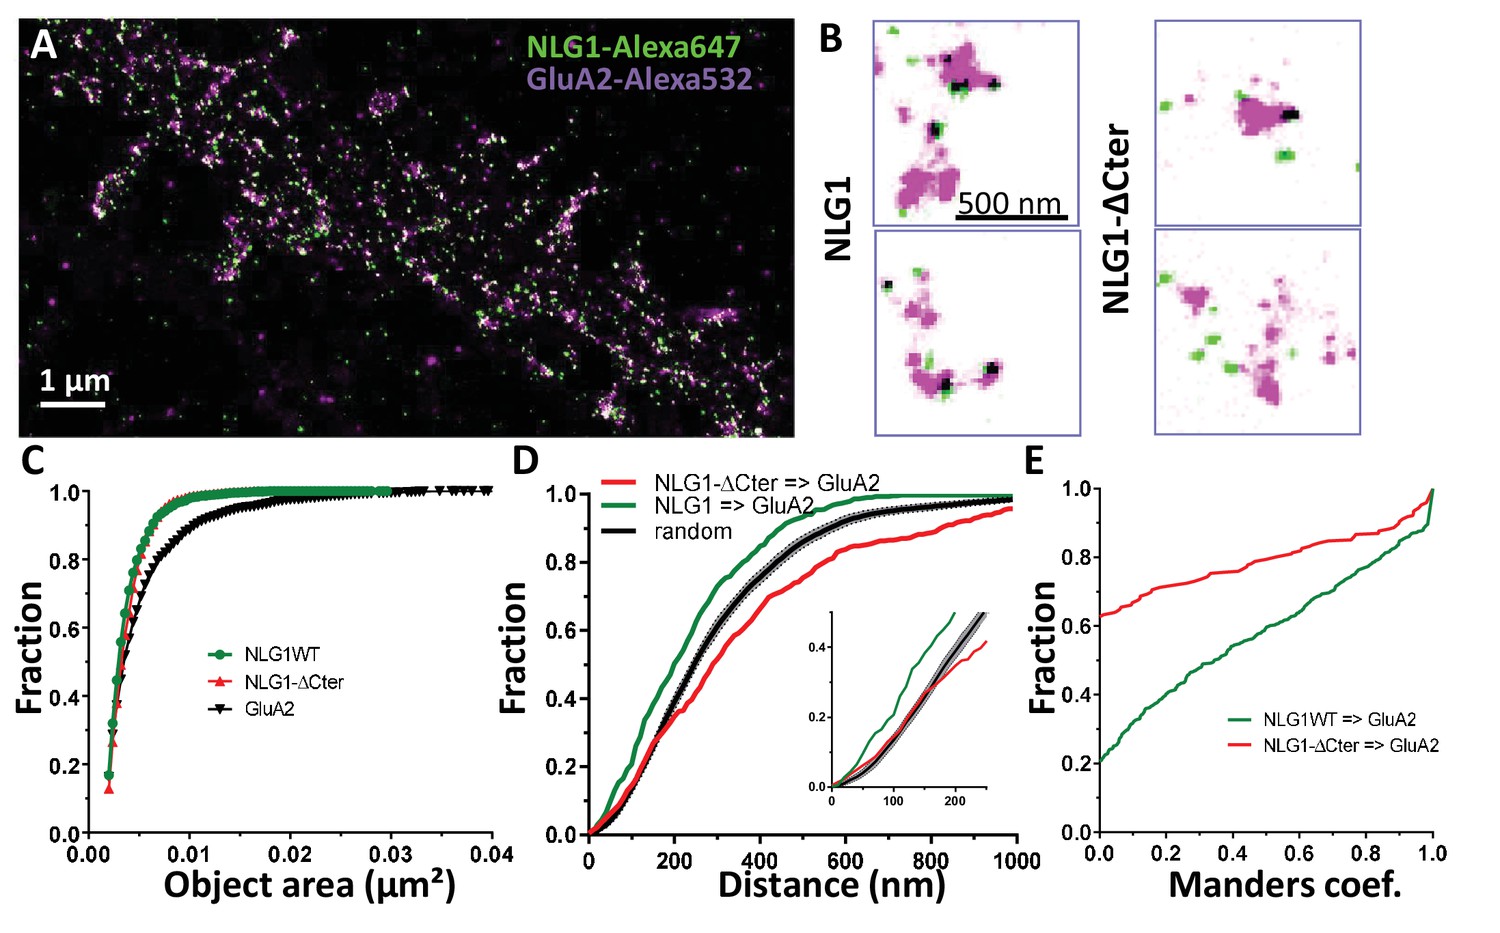
Delta C neuroligin does not co-localize with AMPAR nanoclusters.
(A) Example of dual-color d-STORM super-resolution image of GluA2 containing AMPAR labelled with Alexa 532 nm and HA-tagged NLG1 labelled with Alexa 647 nm. (B) Examples of GluA2 and NLG1 (left) or GluA2 and NLG1-ΔCter (right) co-labeling of two synapses. Dark spots on the overlay image represent co-localizing pixels; NLG1 (in green) strongly co-localizes with AMPAR nanodomains (in purple). NLG1-ΔCter (in green) does not co-localize with AMPAR nanodomains (in purple). (C, D and E) presents the quantification of this co-localization. (C) The size distribution of NLG1 (green), NLG1-ΔCter (red) and GluA2 (black) super-resolved objects. The expression of NLG1-ΔCter does not affect the size of neuroligin 1 and GluA2 nanodomain objects. (D) Cumulative distribution of the measured (red) and randomized (dark) bivariate nearest neighbor distance between large object of GluA2 and NLG1-ΔCter. Green line represents the nearest neighbor distance between large object of GluA2 and neuroligin 1, demonstrating clustering as compared to random distribution. Insert represents a zoom on the 250 nm, approximate size of a PSD; NLG1-ΔCter and GluA2 nanodomain distance overlaps with the random distribution distance. (E) Manders’ coefficients calculated between GluA2 nanodomains and NLG1-ΔCter (red) and between GluA2 nanodomains and NLG1 (green). More than 60% of AMPAR nanodomains are not co-localized with NLG1-ΔCter (n = 18 NLG1 and 12 NLG1-ΔCter cells respectively, corresponding to 516 and 312 independent pairs of objects).
Figure 2—figure supplement 1
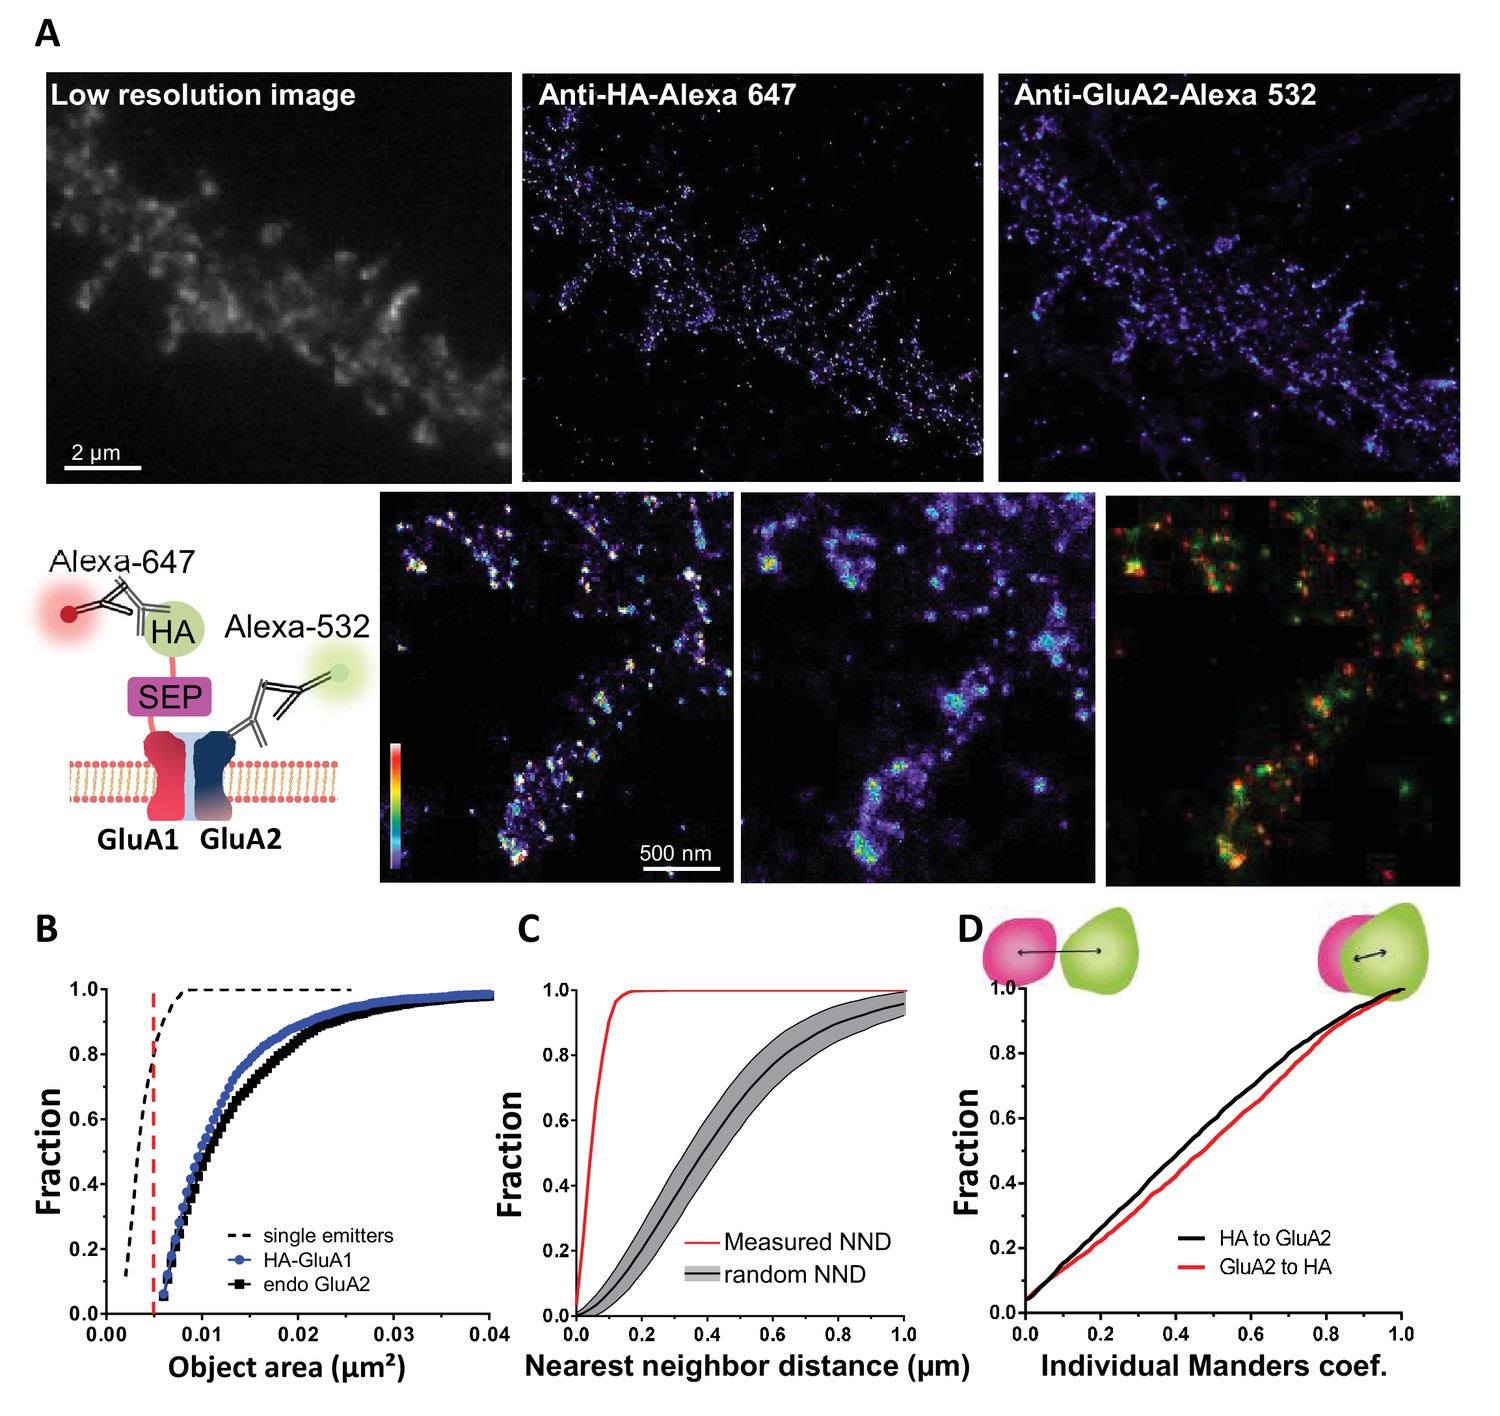
Validation of the method to analyze super-resolved object co-localization with a dual labeling of AMPAR.
(A) Example of dual color image obtained by a GluA1 and GluA2 dual labeling (epifluorescence image on the left) and the super-resolved image acquired with d-STORM technique, both at 647 and 532 (middle and right image). GluA1 presents a HA tag, as shown on the scheme, HA tag is labelled with Alexa 647 and endogenous GluA2 with Alexa 532. An example of co-localization of two super-resolved clusters is reported down to the right. (B, C and D) represent the three steps necessary to determine super-resolved object co-localization (n = 6 cells, and 151 individual clusters). In (B), the size of an object is determined to discriminate potential clusters from the single particle, both having a different physiological meaning. In (C), the bivariate nearest neighbor distance is calculated to determine the average distance between two objects. Control distributions are obtained with the calculation of the distance when the same number of objects is randomly redistributed within the cell border. Finally, (D) is the distribution of Manders’ coefficients. No co-localization gives a null value, 100% co-localization a value of one. The dual labeling of GluA1/A2 reports the presence of small and large objects (B), distance between cluster of GluA1 labelled with anti-HA is closer to GluA2 cluster than randomly distributed (C) 95% of clusters co-localized at least partly (D).
Figure 3

Delta C neuroligin expression decorrelates pre-synaptic RIM from AMPAR nanoclusters.
(A) Example of dual-color d-STORM super-resolution image of GluA2 containing AMPAR labelled with Alexa 532 nm and RIM labelled with Alexa 647 nm. Right panels, examples of GluA2 and RIM co-labeling when post-synaptic neurons are transfected with GFP, NLG1 or NLG1-ΔCter respectively (from the left to the right). (B and C) presents the quantification of this co-localization. (B) Cumulative distribution of the bivariate nearest neighbor distance between GluA2 and RIM clusters when post-synaptic neuron expressed GFP (dark), NLG1 (green) or NLG1-ΔCter (red). These data demonstrate a loss of the pre-post synaptic alignment when NLG1-ΔCter is expressed. (C) Manders’ coefficients calculated between GluA2 nanodomains and RIM clusters in function of the neuroligin wt or truncated form expression. NLG1-ΔCter expression significantly alters the co-localization (n = 9; 9 and 8 Control, NLG1-ΔCter and NLG1 cells respectively, corresponding to 354; 573 and 562 independent pairs of co-localization).
Figure 4 with 4 supplements
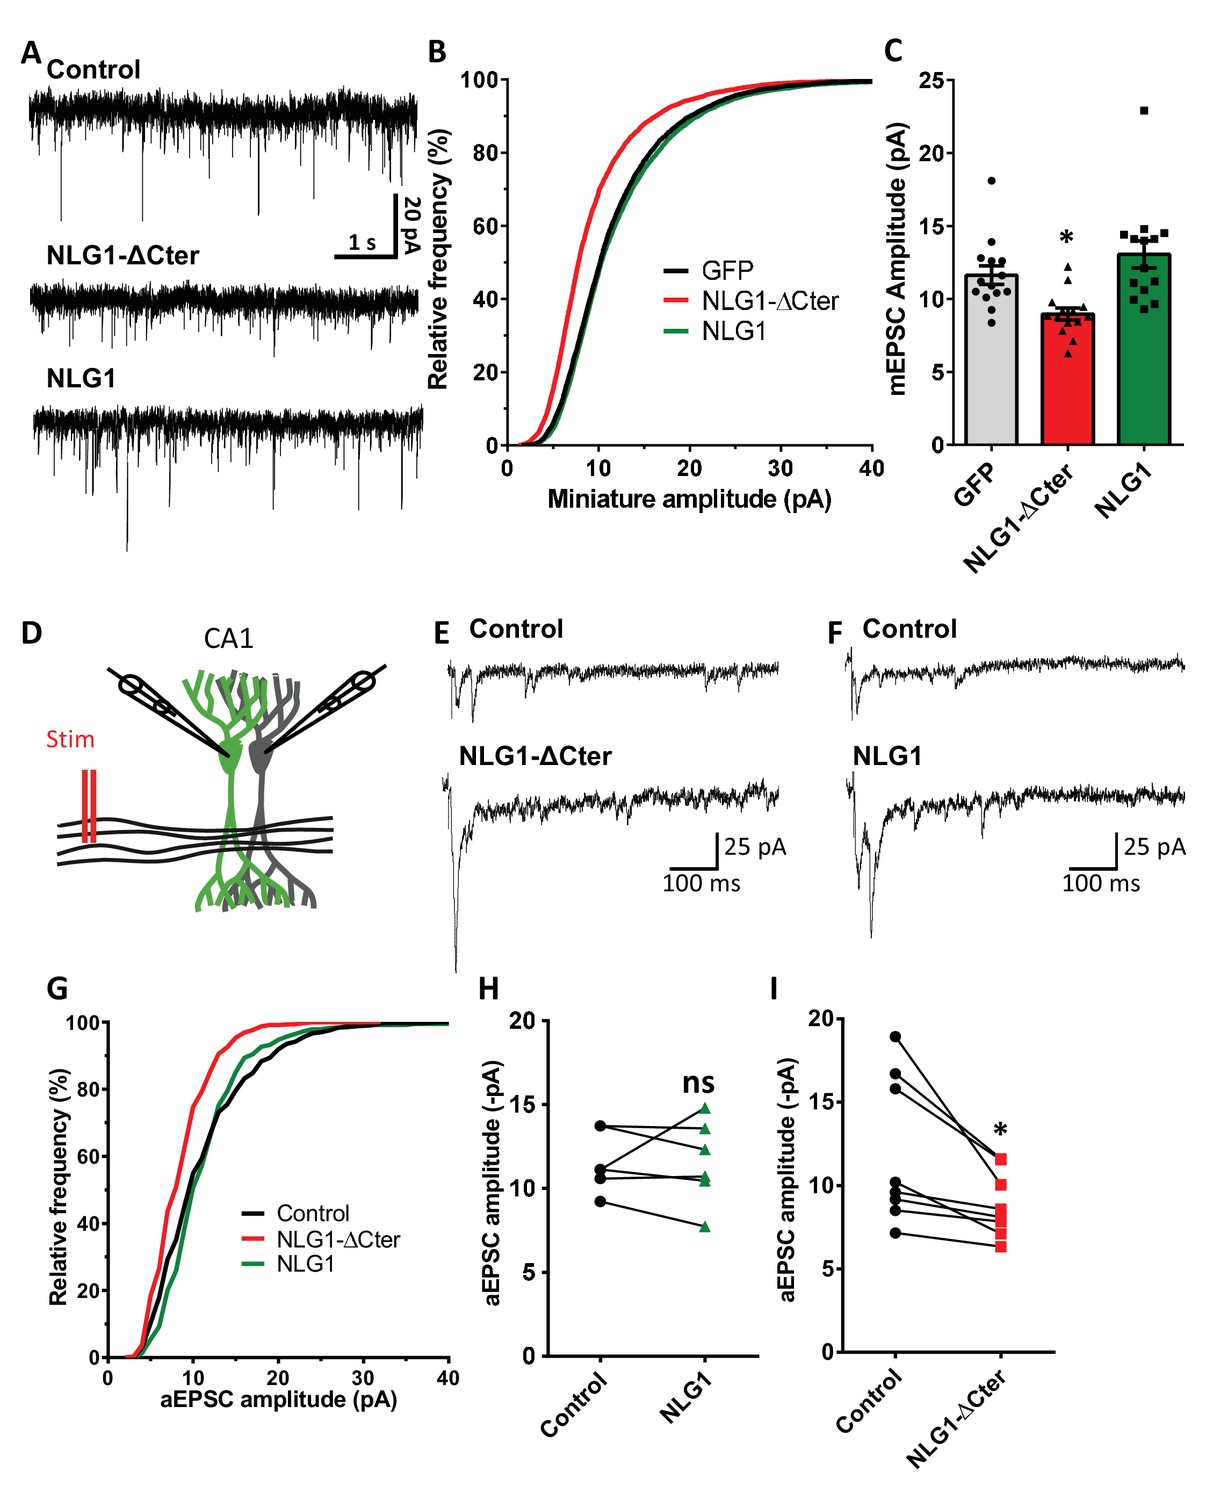
NLG1-ΔCter expression strongly impaired synaptic transmission efficacy.
(A) Example of mEPSC traces recorded in cultured neurons expressing either GFP, GFP + NLG1-ΔCter or GFP + NLG1. (B) Cumulative distribution and (C) average of the mEPSC amplitude recorded on neurons expressing GFP (dark), GFP + NLG1-ΔCter (red) or GFP + NLG1 (green) (n = 14; 14 and 13 respectively). mEPSCs amplitude is decreased by 25% in neurons expressing NLG1-ΔCter. (D) Scheme of the patch clamp protocol used to record asynchronous EPSC on organotypic hippocampus slices. Two neighboring neurons are simultaneously patched, one transfected and one non transfected, Schaffer collateral connecting both neuron are then stimulated. (E and F) Representative traces of asynchronous EPSCs recorded in the presence of strontium, of either a control and a NLG1-ΔCter expressing neuron (E) or a control and a NLG1 (F). To avoid multi synaptic responses, 50 ms following the stimulation are excluded from the analysis. (G) Cumulative distribution of aEPSCs amplitude recorded from control (dark),or neurons expressing GFP + NLG1-ΔCter (red) or GFP + NLG1 (green) (n = 8 and 6 pairs of cells, respectively). Average of aEPSCs amplitude, with connection between the transfected cell and their respective neighboring non transfected control, when either GFP + NLG1 (H) or GFP + NLG1-ΔCter (I) are expressed. NLG1-ΔCter expression decreased by 25% the average aEPSCs amplitude.
Figure 4—figure supplement 1

Neuroligin 1 and NLG1-ΔCter expression have various effect on synaptic transmission properties both on neuronal cell culture and organotypic slices.
(A) Representative images from control and NLG1 and NLG1-ΔCter expressing neurons in culture, with an expanded miniature trace example. (B) Analyses of miniature EPSC, from left to right are represented the amplitude, the frequency, the 20–80% rise time and the decay time constant. (C) Representative images from NLG1 and NLG1-ΔCter expressing neurons in organotypic hippocampal culture. (D) Analyses of asynchronous EPSC, from left to right are represented the amplitude, the frequency, the rise time and the decay time. For all figures, the control is represented in dark, the NLG1-ΔCter in red and the NLG1 in green. Each dot represents the mean value for an individual cell.
Figure 4—figure supplement 2
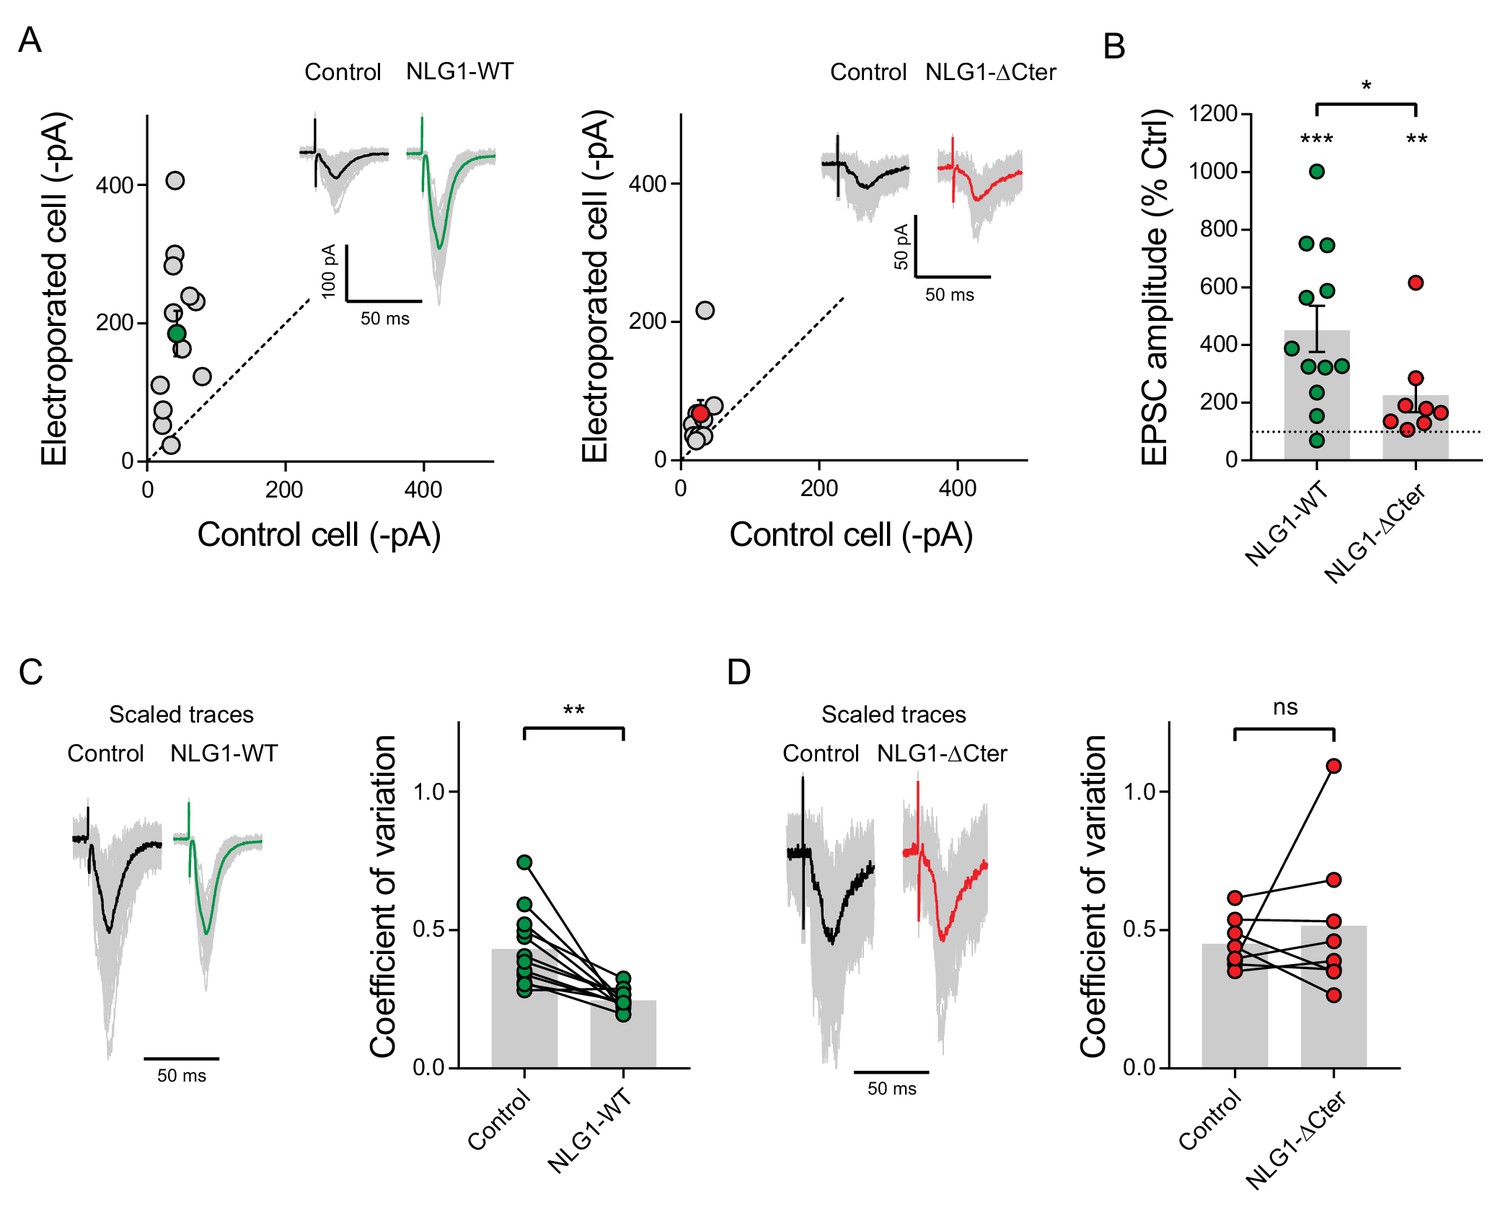
EPSC amplitude from NLG1-ΔCter expressing neurons is decreased compared to neurons expressing NLG1.
(A) Comparison of EPSC amplitude on paired neurons in organotypic slices, when NLG1 (left panel), and NLG1-ΔCter (right panel) are expressed, and representative traces. (B) Average of the normalized EPSC amplitude, with 100% representing the control paired cell. (C and D) 100 traces are obtained from control and electroporated cells to extract the coefficient of variation. The left panel represents an example of the various responses recorded from single cells (grey traces) with the average trace in dark (control cell) or color (electroporated cell). The right panel shows the comparison of the coefficient of variation between pairs of neurons, when neurons expressed NLG1 (C), and NLG1-ΔCter (D).
Figure 4—figure supplement 3
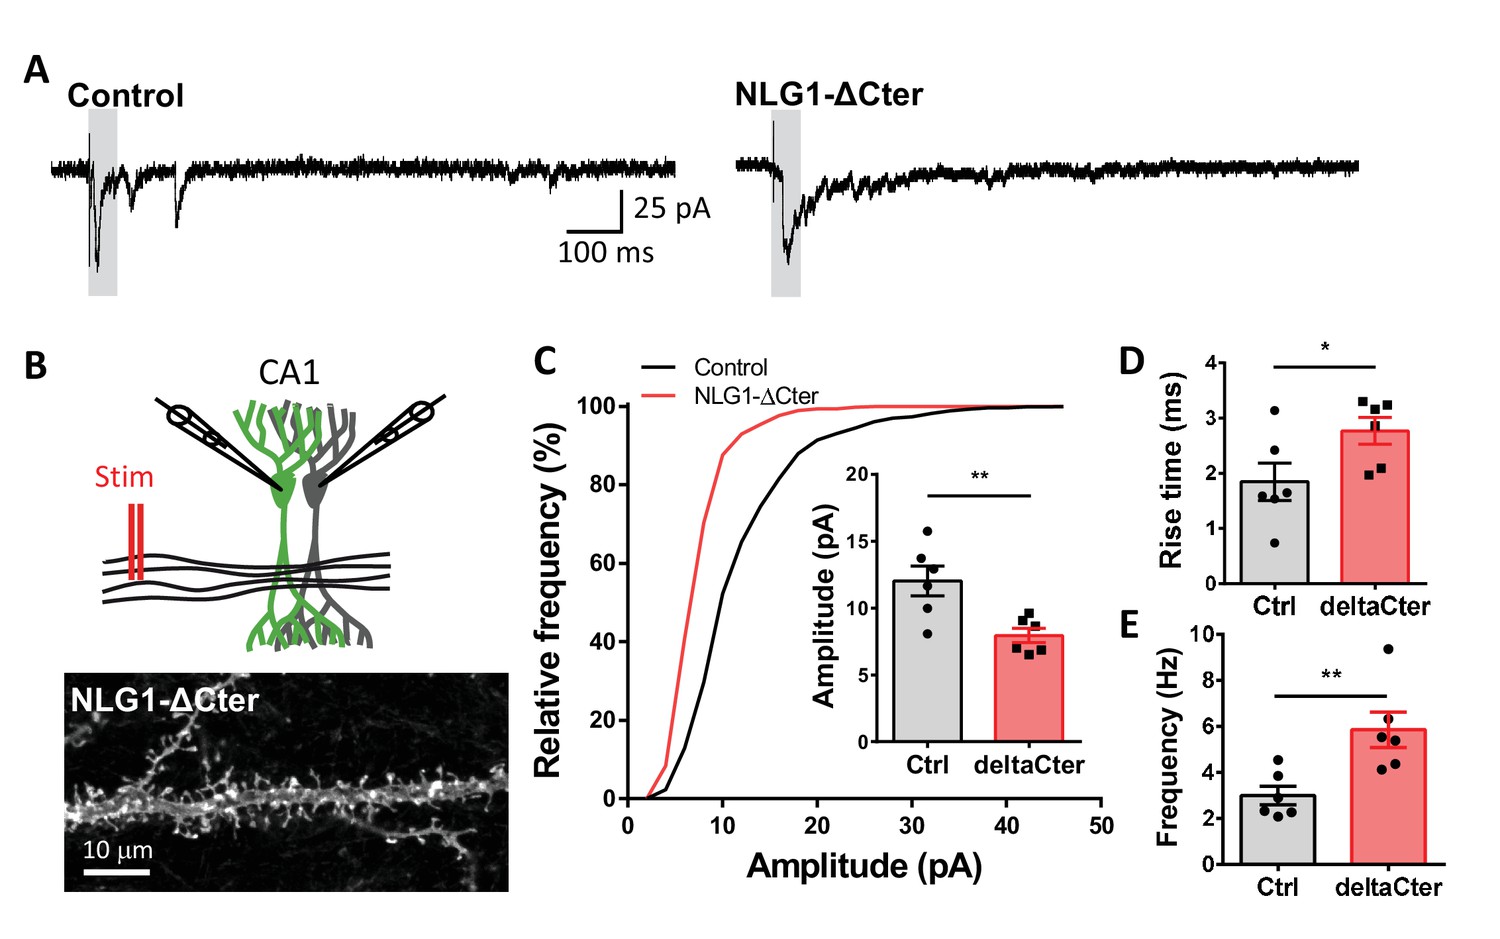
aEPSCs are decreased when NLG1-ΔCter is expressed in NLG1 KO background.
(A) Representative traces of asynchronous EPSCs recorded in the presence of strontium, of either a control and a NLG1-ΔCter expressing neuron in a Nlg1 KO background. (B) Scheme of the patch clamp protocol used to record asynchronous EPSC on organotypic hippocampus slices. Two neighboring neurons are simultaneously patched, one transfected and one non transfected, Schaffer collateral connecting both neuron are then stimulated. To avoid multi synaptic responses, 50 ms following the stimulation are excluded from the analysis. Bottom, example of a transfected cell. (C) Cumulative distribution of aEPSCs amplitude recorded from control (dark),or neurons expressing GFP + NLG1-ΔCter (red). Average of aEPSCs amplitude, with connection between the transfected cell and their respective neighboring non transfected control. (D and E) Rise time and frequency of aEPSC of non-transfected cell and when NLG1-ΔCter is expressed (n = 6 pairs of neurons, 20 sweeps per cell).
Figure 4—figure supplement 4

Expression of NLG1-ΔCter does not affect paired-pulse ratio.
(A) Example of paired-pulse currents recorded from CA1 neurons in organotypic hippocampal slices, expressing either NLG1 or NLG1-ΔCter (in red) and from their respective untransfected neighbors (in black). (B) Average paired pulse ratio for the same conditions as in (A) (n = 7 and 8 pairs of cells for NLG1 and NLG1-ΔCter, respectively).
Figure 5
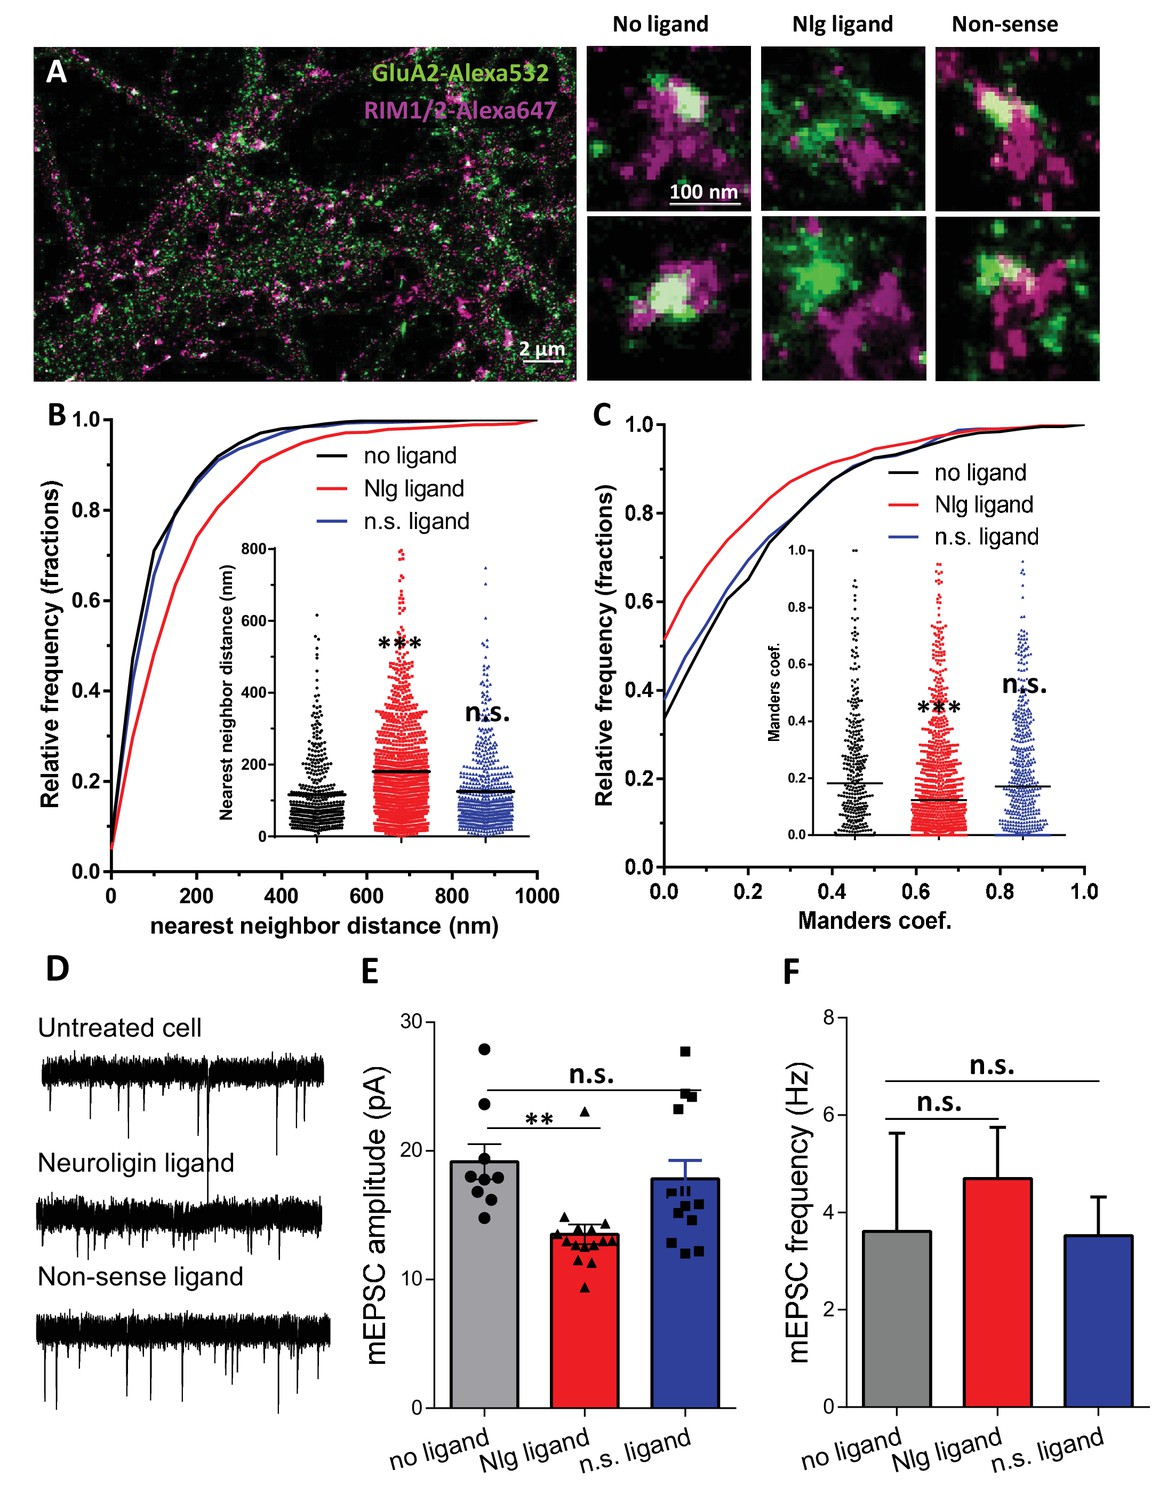
Acute disruption of PSD95-NLG interaction impaired both pre-post alignment and synaptic transmission.
(A) Example of dual-color d-STORM image of GluA2 containing AMPAR labelled with Alexa 532 nm and RIM labelled with Alexa 647 nm. Right panels, examples of GluA2 and RIM co-labeling without ligand or after 1-day treatment with Nlg biomimetic ligand or non-sense ligand (from the left to the right). (B and C) presents the quantification of this co-localization. (B) Cumulative distribution of the bivariate nearest neighbor distance between GluA2 and RIM clusters without ligand (black), with NLG ligand NLG1 (green) or non-sense ligand (blue). These data demonstrate a loss of the pre-post synaptic alignment in the presence of NLG ligand. (C) Manders’ coefficients calculated between GluA2 nanodomains and RIM clusters in function of ligand treatment (n = 4; 5 and 4 Control, NLG ligand and non-sense ligand respectively, corresponding to 451; 1311 and 640 independent pairs of co-localization). (D) Example of mEPSC traces recorded in cultured neurons without ligand, with NLG ligand or with non-sense ligand. (E and F) average of the mEPSC amplitude and amplitude recorded when neurons in culture are incubated without ligand (dark) or with either NLG ligand (red) or with non-sense ligand (blue) (n = 9; 15 and 13 respectively). mEPSCs amplitude is decreased by 30% in neurons incubated with NLG ligand.
Figure 6 with 2 supplements
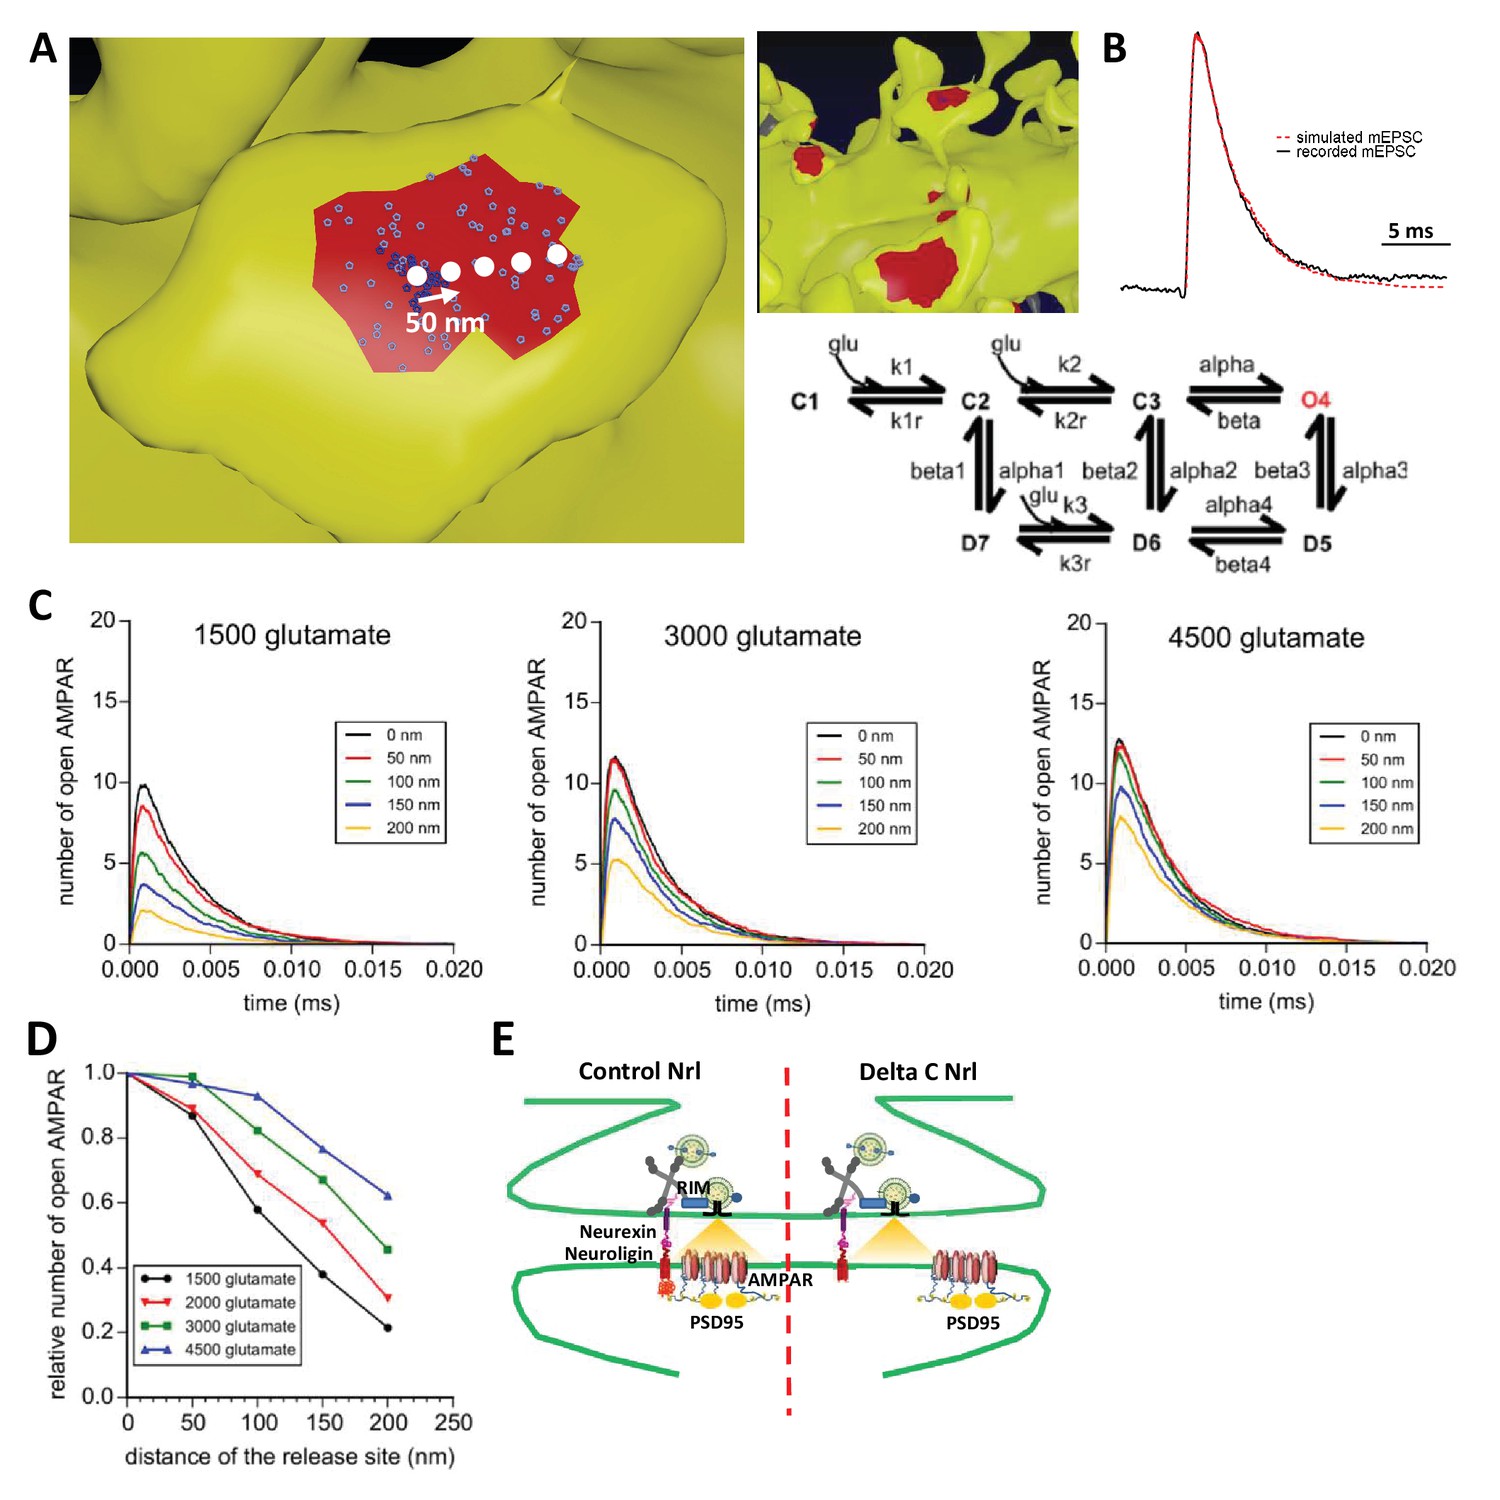
Simulation of AMPAR activation.
(A) View of dendritic spine with synaptic contact area (red patch) containing 25 AMPARs anchored in nanocluster (blue particles) and 70 freely diffusible AMPAR (light blue particles). The simulated glutamate release locations are shown by white dots spaced 50 nm apart. (B) Superposition of a miniature average trace obtained by electrophysiology (dark line) and simulated currents (red line) and,kinetic scheme for activation of AMPAR by glutamate (Jonas et al., 1993). Kinetic rate constants values (after fitting as described in Materials and methods): k1 = 13.77 μM−1.s−1; k1r = 2130 s−1; k2 = 85.2 μM−1.s−1; k2r = 1630 s−1; alpha = 1696 s−1; beta = 630 s−1; alpha1 = 1445 s−1; beta1 = 19.6 s−1; alpha2 = 86 s−1; beta2 = 0.3635 s−1; alpha3 = 8.85 s−1; beta3 = 2 s−1; alpha4 = 6.72 s−1; beta4 = 133.28 s−1; k3 = 3.81 μM−1.s−1; k3r = 22.85 s−1; AMPAR diffusion constant = 0.1 μm2.s−1; and glutamate diffusion constant = 100 μm2.s−1. (C) Time course of simulated AMPAR activation resulting from release of 1500, 3000, and 4500 glutamate molecules at each release location are shown. Each time course is the average of 100 simulations. (D) Normalized peak number of open AMPARs activated by release of 1500, 2000, 3000, and 4500 glutamate molecules at each release location is shown. Dashed line at 90 nm indicates data displayed in E. (E) Percent decrease in peak number of open AMPAR as a function of number of glutamate molecules released, at 90 nm release distance. Dashed lines indicate that when ~2000 glutamate molecules are released the peak number of open AMPARs will be decreased by 25% at a release distance of 90 nm.
Figure 6—figure supplement 1
Expression of NLG1-ΔCter does not affect paired-pulse ratio.
(A) Example of paired-pulse currents recorded from CA1 neurons in organotypic hippocampal slices, expressing either NLG1 or NLG1-ΔCter (in red) and from their respective untransfected neighbors (in black). (B) Average paired pulse ratio for the same conditions as in (A) (n = 7 and 8 pairs of cells for NLG1 and NLG1-ΔCter respectively).
Figure 6—figure supplement 2
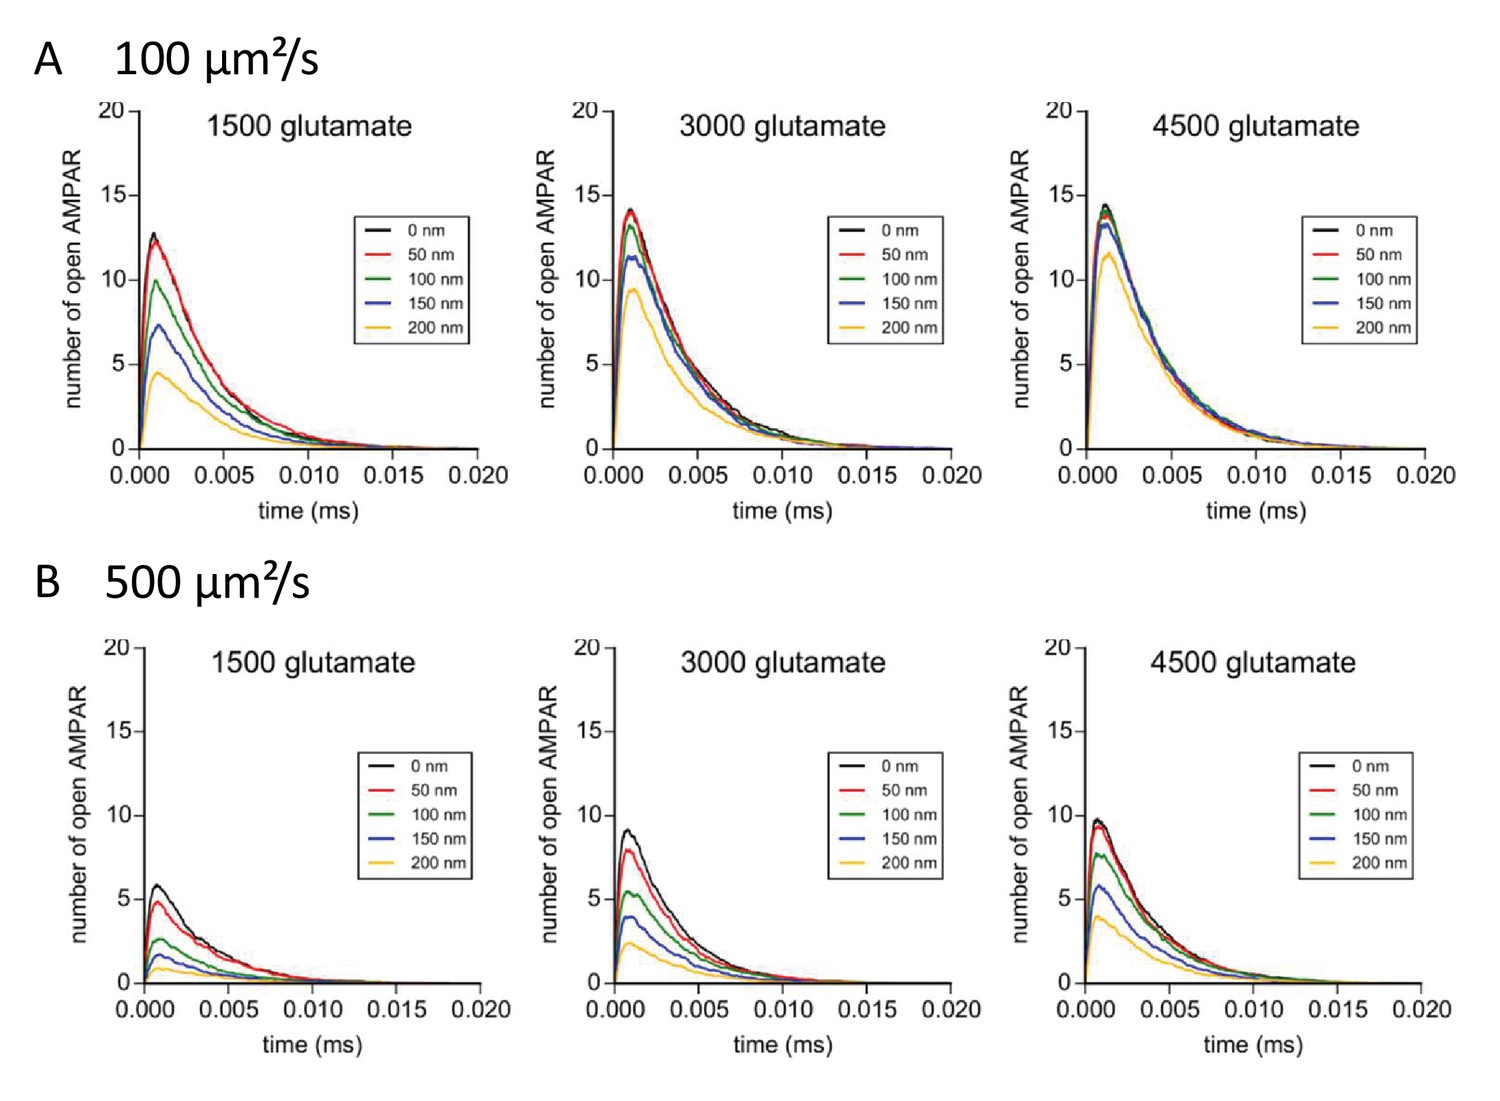
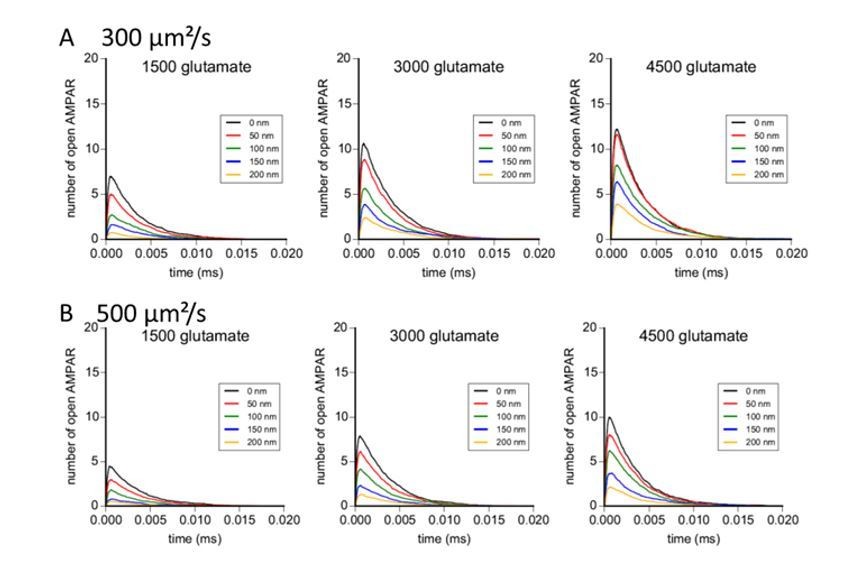
Simulation of AMPAR activation in function of glutamate diffusion properties.
(A) Time course of simulated AMPAR activation resulting from release of 1500, 3000, and 4500 glutamate molecules at each release location with glutamate diffusion rate fixed at 300 µm2/s. Each time course is the average of 100 simulations. (B) Time course of simulated AMPAR activation resulting from release of 1500, 3000, and 4500 glutamate molecules at each release location with glutamate diffusion rate fixed at 500 µm2.s−1. Each time course is the average of 100 simulations.
Author response image 1
Author response image 2
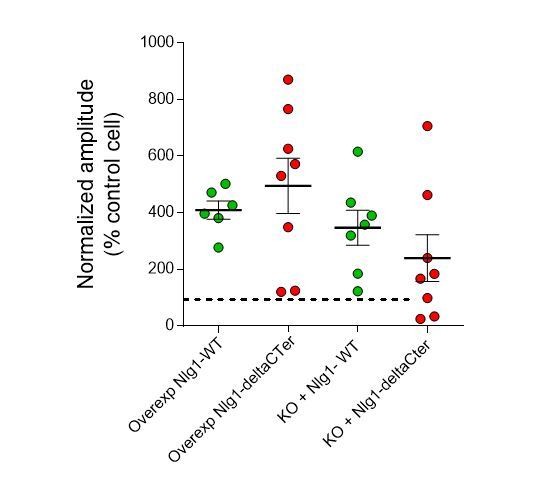
EPSC amplitudes on brain slices (evoked in strontium).
https://doi.org/10.7554/eLife.31755.020
Author response image 3

Properties of EPSCs in cell culture.
https://doi.org/10.7554/eLife.31755.021
Author response image 4
Author response image 5
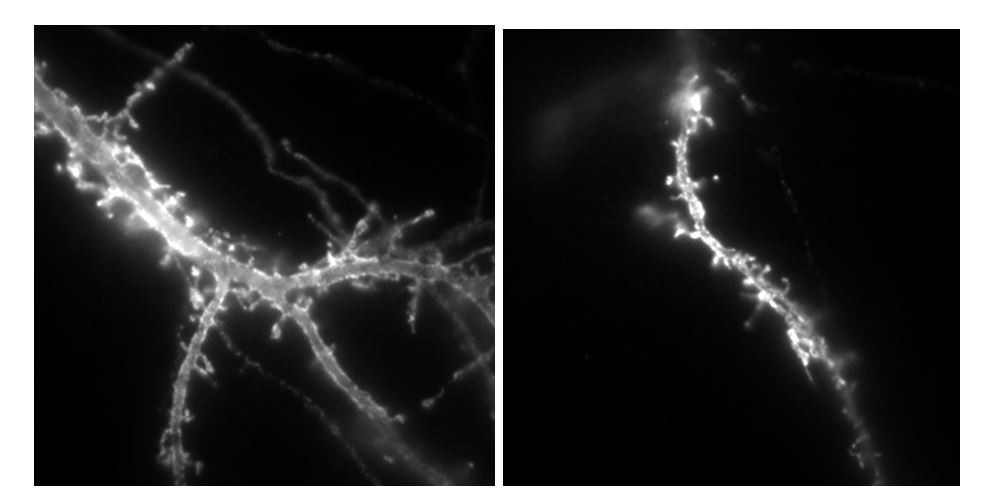
Example of neurons labelled with anti-HA alexa647nm in culture transfected by either Nlg1HA-IRES-GFP or NLG1HA-ΔCter IRES GFP plasmids, used for lentivirus production.
https://doi.org/10.7554/eLife.31755.023
Author response image 6
Author response image 7
Additional files
-
Transparent reporting form
- https://doi.org/10.7554/eLife.31755.017
Download links
A two-part list of links to download the article, or parts of the article, in various formats.
Downloads (link to download the article as PDF)
Open citations (links to open the citations from this article in various online reference manager services)
Cite this article (links to download the citations from this article in formats compatible with various reference manager tools)
Pre-post synaptic alignment through neuroligin-1 tunes synaptic transmission efficiency
eLife 7:e31755.
https://doi.org/10.7554/eLife.31755


