Combinatorial programming of human neuronal progenitors using magnetically-guided stoichiometric mRNA delivery
- Massachusetts Institute of Technology, United States
- Massachusetts General Hospital, Harvard Medical School, United States
- Swiss federal Institute of Technology Zurich (ETH), Switzerland
Figures
Figure 1
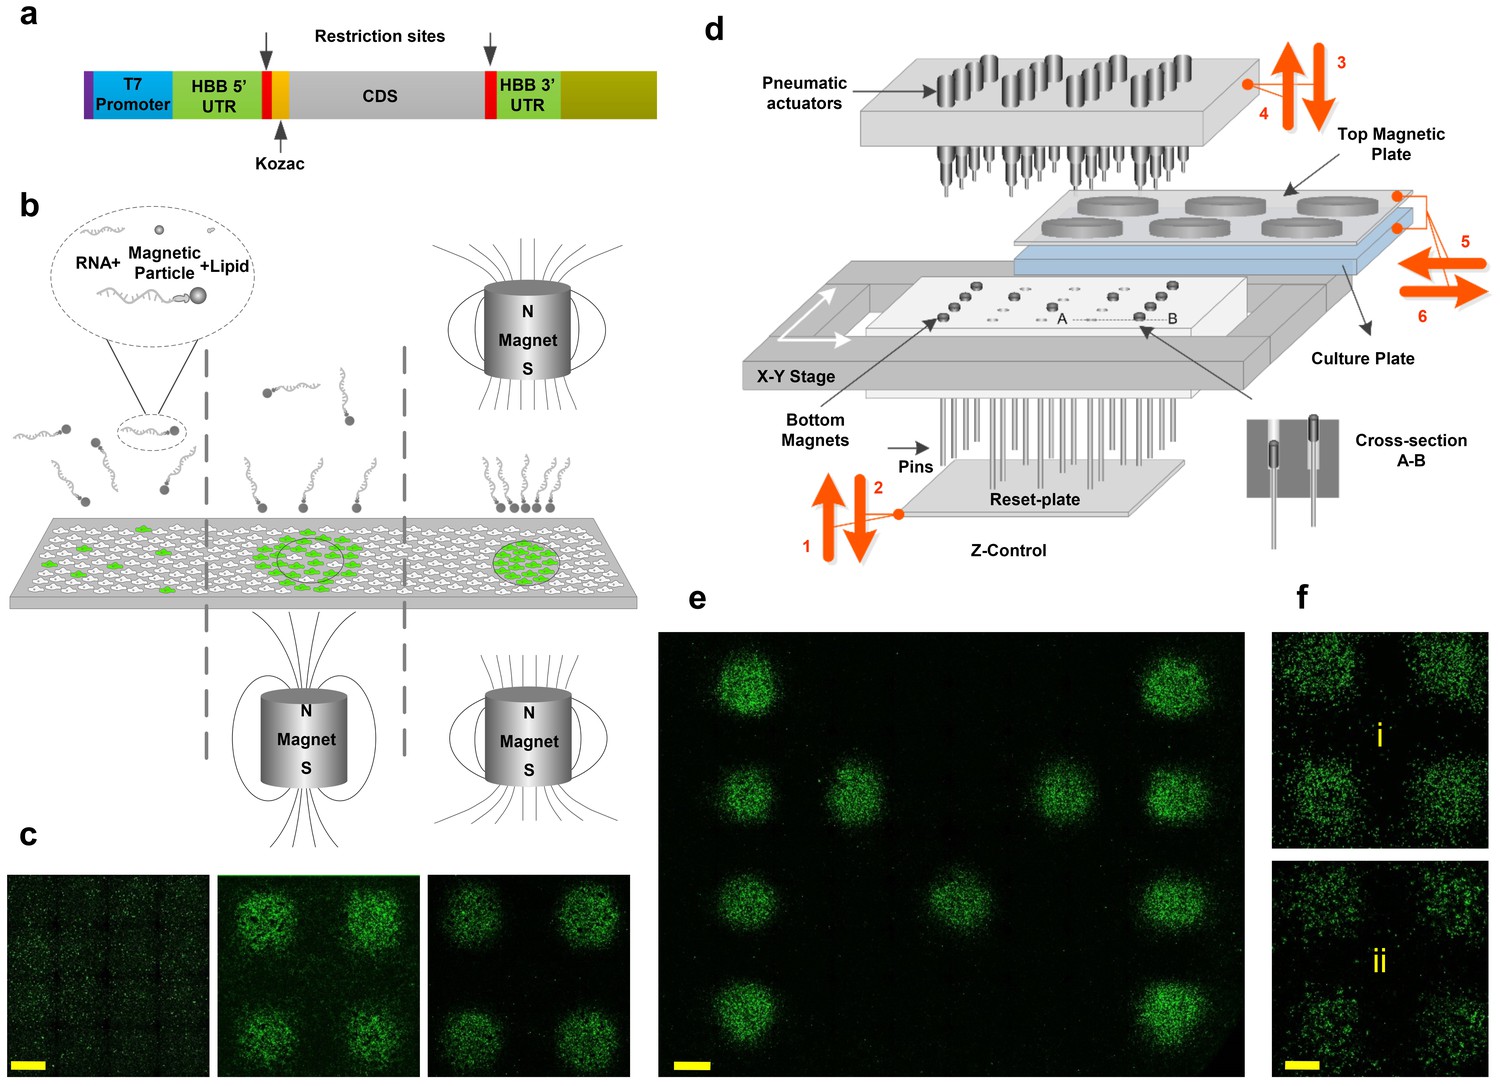
Magnetically-guided spotting platform enables localized reconfigurable stoichiometrically-defined mRNA transfection.
(a) Schematic of the template used for synthesis of transcription factor mRNAs. (b) Magnetic spotting configurations with single versus dual magnets. (c) Transfection of cultured neural progenitor cells with mRNA encoding green fluorescent protein (GFP) in the absence of a magnetic field (left) or delivered with a single (middle) versus dual (right) magnet setup. (d) Schematic diagram and operation of the automated spotting system. Arrows indicating steps 1 through 6 show the operation order and the movement directions of the system components as described in the text. Steps 1 and 2: Bottom plate resets the positions of bottom magnets to up. Steps 3 and 4: The pneumatic actuators program the positions of bottom magnets by pushing them down. Arrows 5 and 6: The cell-culture plate with top magnets is moved in for transfection and moved out. (e) Demonstration of localized GFP mRNA transfection with user-defined patterns. (f) GFP-transfected differentiating human neural progenitors remain localized the transfected spots at 1 day (i) and 7 days (ii) post-transfection. Scale bars, 1 mm.
Figure 2

Interleaved transfection reduces fluctuations in delivered mRNA copy numbers and stoichiometries.
(a) Schematic illustration of multiple interleaved transfections using GFP and mCherry mRNAs. Each mRNA is delivered in multiple interleaved rounds of transfection, as opposed to being delivered all at once in a single transfection. (b) Neural progenitor cells transfected with GFP and mCherry mRNA using a standard single transfection protocol (‘1 × 1’; i.e. the full dose of each mRNA is applied in a single transfection) versus an interleaved transfection protocol (‘4 × ¼"; i.e. one quarter doses of each mRNA are applied using four interleaved transfections). All images were acquired using automated software to prevent saturation. (c) Ratio of red (mCherry) to green (GFP) fluorescence intensity per cell for both single and interleaved transfection protocols. Image correlation analysis was performed on the images shown in (b) using WCIF plugin for ImageJ. Efficiency of interleaved transfection is calculated using Pearson’s Correlation Coefficient (PCC) and Mander’s Overlap Coefficient (MOC). PCC = 0.85 and MOC = 0.92 for interleaved transfections compared to PCC = 0.54 and MOC = 0.79 for single transfections (−1 < PCC < 1; 0 < MOC < 1). Both PCC and MOC represent average values from three independent experiments. (d) Precise RNA dosage control using the magnetically reconfigurable spotting platform. GFP mRNA was spotted in a 3 × 3 matrix at three different dosages: right column (1x), middle column (2x) and left column (4x). mCherry mRNA was delivered to the same spots at three different dosages as follows: bottom row (1x), middle row (2x) and top row (4x). To generate this pattern, we delivered GFP and mCherry mRNAs using our interleaved transfection protocol to achieve highest co-transfection efficiency (this pattern is also reproducible using standard transfection protocols, although with reduced efficiency). In the process, 1x concentration of GFP (1.8 ng; 0.2 ng per spot) was delivered to the plate while all nine magnets were active. In the next step, another 1x concentration of GFP (1.2 ng; 0.2 ng per spot) was delivered to the cells while the 3 magnets of the rightmost column were inactive. Finally, 2x concentration of GFP (1.2 ng; 0.4 ng per spot) was delivered to the cells while the middle and the rightmost columns of 6 magnets were inactive. A similar process was repeated for the mCherry along the perpendicular direction (i.e. by activating/inactivating magnets along the horizontal rows rather than the vertical columns). Scale bars: 100 µm in (b), 1 mm in (d).
-
Figure 2—source data 1
Ratio of red (mCherry) to green (GFP) fluorescence intensity per cell for both single and interleaved transfection protocols.
- https://doi.org/10.7554/eLife.31922.004
Figure 3
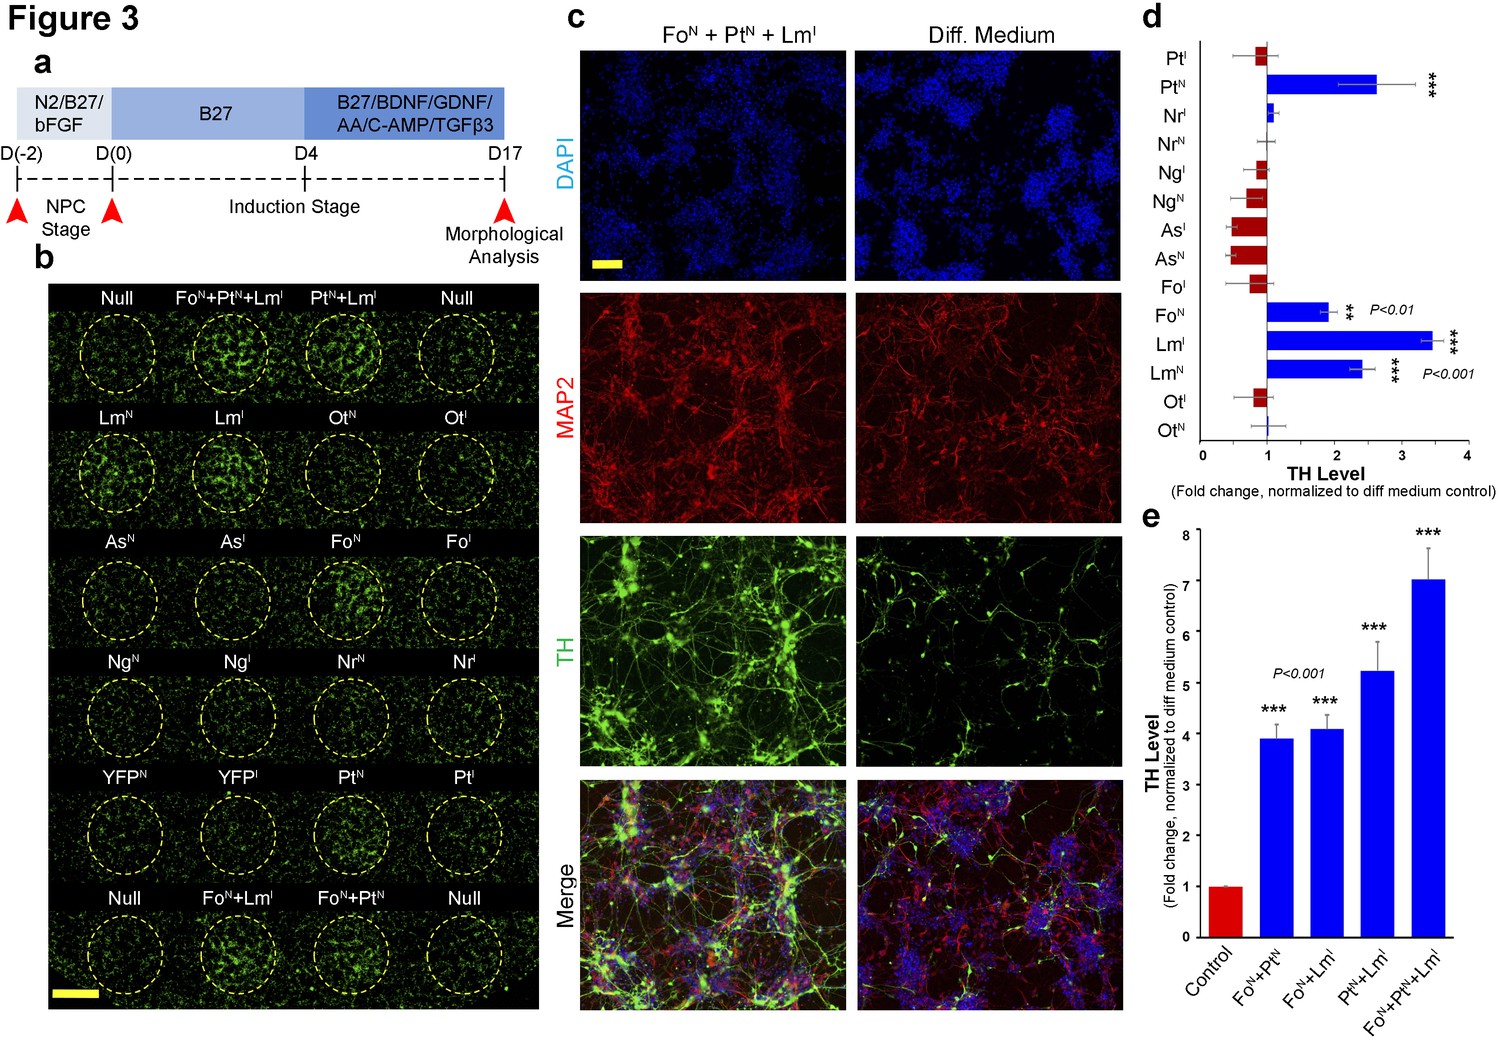
Magnetically reconfigurable spotting platform can screen and identify key transcription factors promoting dopaminergic cell fate.
(a) Timeline of the mRNA-induced differentiation process (proliferative NPC stage from day −2 to 0; early induction stage after day 0). Red arrows indicate time points of transfection before mitogen growth factor removal, transfection after growth factor removal (induction stage), and the final analysis at 17 days after growth factor removal. (b) Immunocytochemistry at day 17 for TH (green) showing upregulation of TH when FOXA2 is delivered to NPCs (FoN), when PITX3 is delivered to NPCs (PtN), and when LMX1A is delivered either to NPCs (LmN) or during induction (LmI). Combinations of these three conditions also increase the number TH+ neurons. (c) Double staining (MAP2+/TH+) results from cells transfected with the most effective combination (FoN +PtN + LmI) compared to non-transfected cells (Diff. Medium). (d and e) Quantitative TH gene expression analysis at day 17 comparing all single factors delivered at NPC (N) and early induction (I) stages (d), and temporal transfection of the selected combinations of double and triple factors (e). All quantifications were done with n = 3 independent experiments (mean ±s.e.m), ***(p<0.001), **(p<0.01), *(p<0.05) (compared to control, Dunnett's test). Abbreviations: TH, tyrosine hydroxylase; Ot, OTX2; Lm, LMX1A, Fo, FOXA2; As, ASCL1; Ng, NGN2; Nr, NURR1; Pt, PITX3; Superscript ‘N’, proliferative NPC stage; Superscript ‘I’, induction stage after mitogen withdrawal. Scale bars: 1 mm in (b), 100 µm in (c).
-
Figure 3—source data 1
Quantitative TH gene expression analysis at day 17 comparing factors delivered at NPC (superscript N) and early induction (superscript I) stages.
- https://doi.org/10.7554/eLife.31922.006
Figure 4
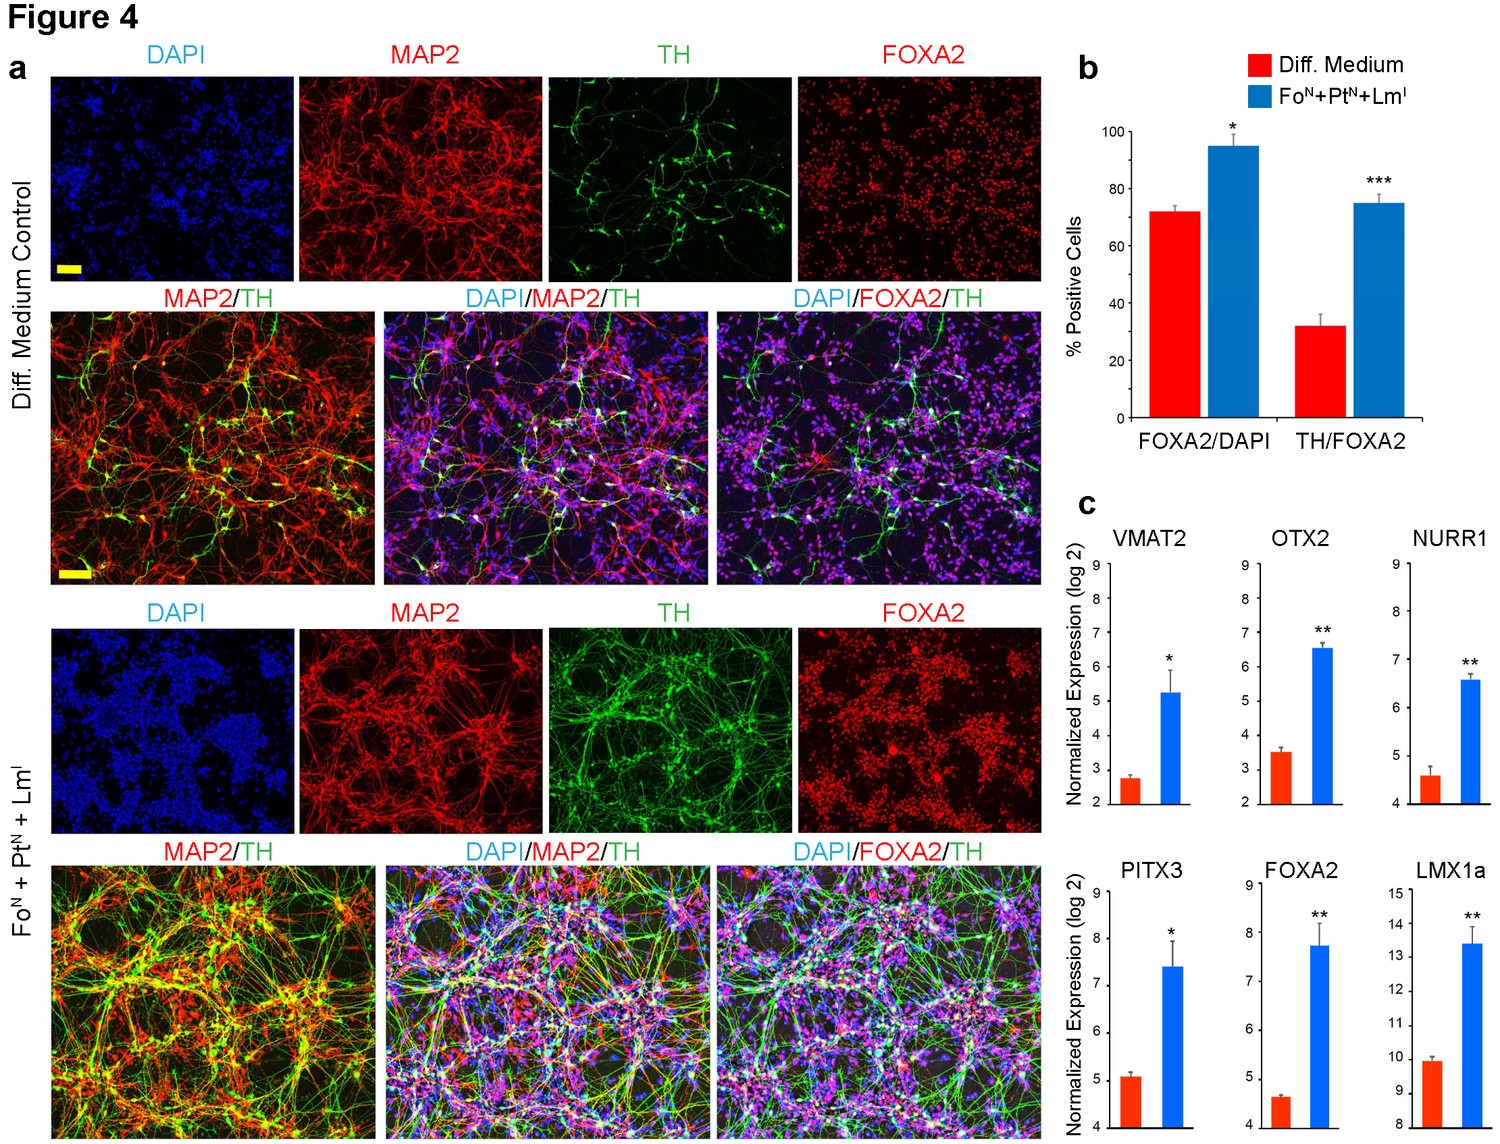
Immunocytochemical and quantitative analysis confirms midbrain identity dopaminergic neurons generated from screen.
(a) Immunocytochemistry at day 17 for TH (green), MAP2 (red), FOXA2 (red) and DAPI (blue) performed in microwell plates; comparing triple staining DAPI+/MAP2+/TH+ and DAPI+/FOXA2+/TH+ between non-transfected cells in differentiation medium alone (top) to FoN + PtN + LmI transfected cells (bottom). (b) Quantification of data presented in (a). The percentage of cells expressing FOXA2 increases from 72% in non-transfected cells to 95% in cells transfected with the combination of FoN + PtN + LmI (left panel, FOXA2/DAPI). The percentage of the FOXA2 positive cells that also co-express TH increases from 32% in non-transfected cells to 75% in cells transfected with the combination of FoN + PtN + LmI (right panel, TH/FOXA2). (c) Gene expression analysis at day 17 for the indicated midbrain specific markers. Quantifications were done with n = 3 independent experiments (mean ± s.e.m), ***p<0.001, **p<0.01, *p<0.05 (compared to control, Student’s t-test). Abbreviations: TH, tyrosine hydroxylase; Lm, LMX1A; Fo, FOXA2; Pt, PITX3; Superscript ‘N’, proliferative NPC stage; Superscript ‘I’, induction stage after mitogen withdrawal. Scale bars, 100 µm.
Author response image 1
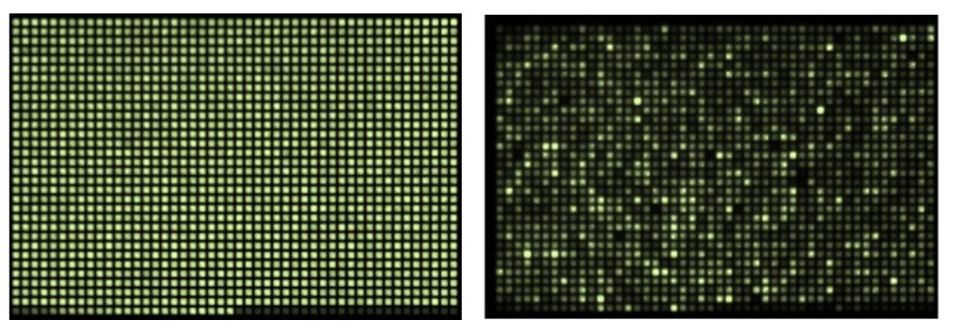
Source: Courtesy of Inglese, J. & Jang, S.-W. from NIH Screening Center.
https://doi.org/10.7554/eLife.31922.012
Author response image 2
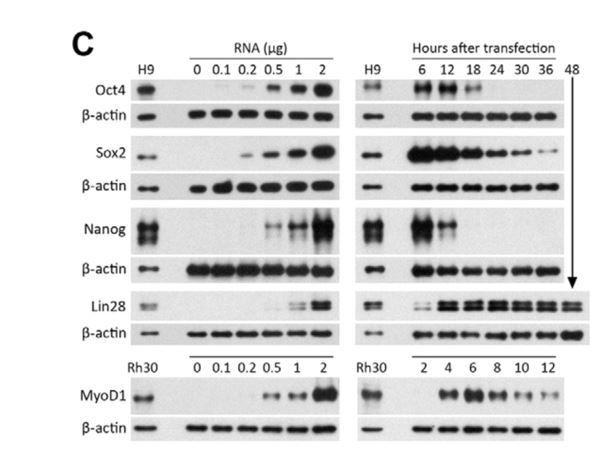
Western blots showing expression levels and lifetimes of Oct4, Sox2, Nanog, Lin28, and MyoD1 proteins in MRC-5 human fetal lung fibroblasts transfected with protein- encoding RNA, relative to levels in hES (H9) and rhabdomyosarcoma (Rh30) cells.
b-actin was used as a loading control. Left panels: The amount of RNA per 50 mL electroporation volume was varied as indicated. Cells were lysed 6 hours after transfection. Right panels: Cells were transfected with 1 mg of RNA, and lysed at the indicated times. (Reproduced from Angel and Yanik, PLoS ONE 2010 under the Creative Commons Attribution License https://doi.org/10.1371/journal.pone.0011756)
Author response image 3
Author response image 4
Tables
Key resources table
| Reagent type (species) or resource | Designation | Source or reference | Identifiers |
|---|---|---|---|
| Gene (Homo sapiens) | OTX2 | NA | HGNC:8522 |
| Gene (H. sapiens) | LMX1A | NA | HGNC:6653 |
| Gene (H. sapiens) | FOXA2 | NA | HGNC:5022 |
| Gene (H. sapiens) | ASCL1 | NA | HGNC:738 |
| Gene (H. sapiens) | NGN2 | NA | HGNC:13805 |
| Gene (H. sapiens) | NURR1 | NA | HGNC:7981 |
| Gene (H. sapiens) | PITX3 | NA | HGNC:9006 |
| Cell line (H. sapiens) | hNP1 | EMD Millipore | EMD Millipore:SCR055; RRID:CVCL_GS51 |
| Antibody | anti-FOXA2 (mouse monoclonal) | Abcam | Abcam:ab60721 |
| Antibody | anti-MAP2 (chicken polyclonal) | Abcam | Abcam:ab5392 |
| Antibody | anti-Tyrosine Hydroxylase (rabbit polyclonal) | Abcam | Abcam:ab112 |
| Sequence-based reagent | VMAT2 (TaqMan assay) | Thermo Fisher Scientific | Thermo Fisher Scientific:Hs00996835_m1 |
| Sequence-based reagent | GAPDH (TaqMan assay) | Thermo Fisher Scientific | Thermo Fisher Scientific:Hs02758991_g1 |
| Sequence-based reagent | OTX2 (TaqMan assay) | Thermo Fisher Scientific | Thermo Fisher Scientific:Hs00222238_m1 |
| Sequence-based reagent | PITX3 (TaqMan assay) | Thermo Fisher Scientific | Thermo Fisher Scientific:Hs01013935_g1 |
| Sequence-based reagent | FOXA2 (TaqMan assay) | Thermo Fisher Scientific | Thermo Fisher Scientific:HS00232764_m1 |
| Sequence-based reagent | LMX1A (TaqMan assay) | Thermo Fisher Scientific | Thermo Fisher Scientific:Hs00892663_m1 |
| Sequence-based reagent | TH (TaqMan assay) | Thermo Fisher Scientific | Thermo Fisher Scientific:Hs0016594_m1 |
| Sequence-based reagent | MAP2 (TaqMan assay) | Thermo Fisher Scientific | Thermo Fisher Scientific:Hs00258900_m1 |
| Sequence-based reagent | NURR1 (TaqMan assay) | Thermo Fisher Scientific | Thermo Fisher Scientific:Hs00443062_g1 |
| Other | DAPI stain | Thermo Fisher Scientific |
Additional files
-
Supplementary file 1
List and details of top and bottom magnets.
- https://doi.org/10.7554/eLife.31922.008
-
Supplementary file 2
List of TaqMan qRT-PCR assays used in this research.
- https://doi.org/10.7554/eLife.31922.009
-
Transparent reporting form
- https://doi.org/10.7554/eLife.31922.010
Download links
A two-part list of links to download the article, or parts of the article, in various formats.
Downloads (link to download the article as PDF)
Open citations (links to open the citations from this article in various online reference manager services)
Cite this article (links to download the citations from this article in formats compatible with various reference manager tools)
Combinatorial programming of human neuronal progenitors using magnetically-guided stoichiometric mRNA delivery
eLife 7:e31922.
https://doi.org/10.7554/eLife.31922


