The control of tonic pain by active relief learning
- University of Cambridge, United Kingdom
- Advanced Telecommunications Research Institute International, Japan
- National Institute for Information and Communications Technology, Japan
Figures
Figure 1
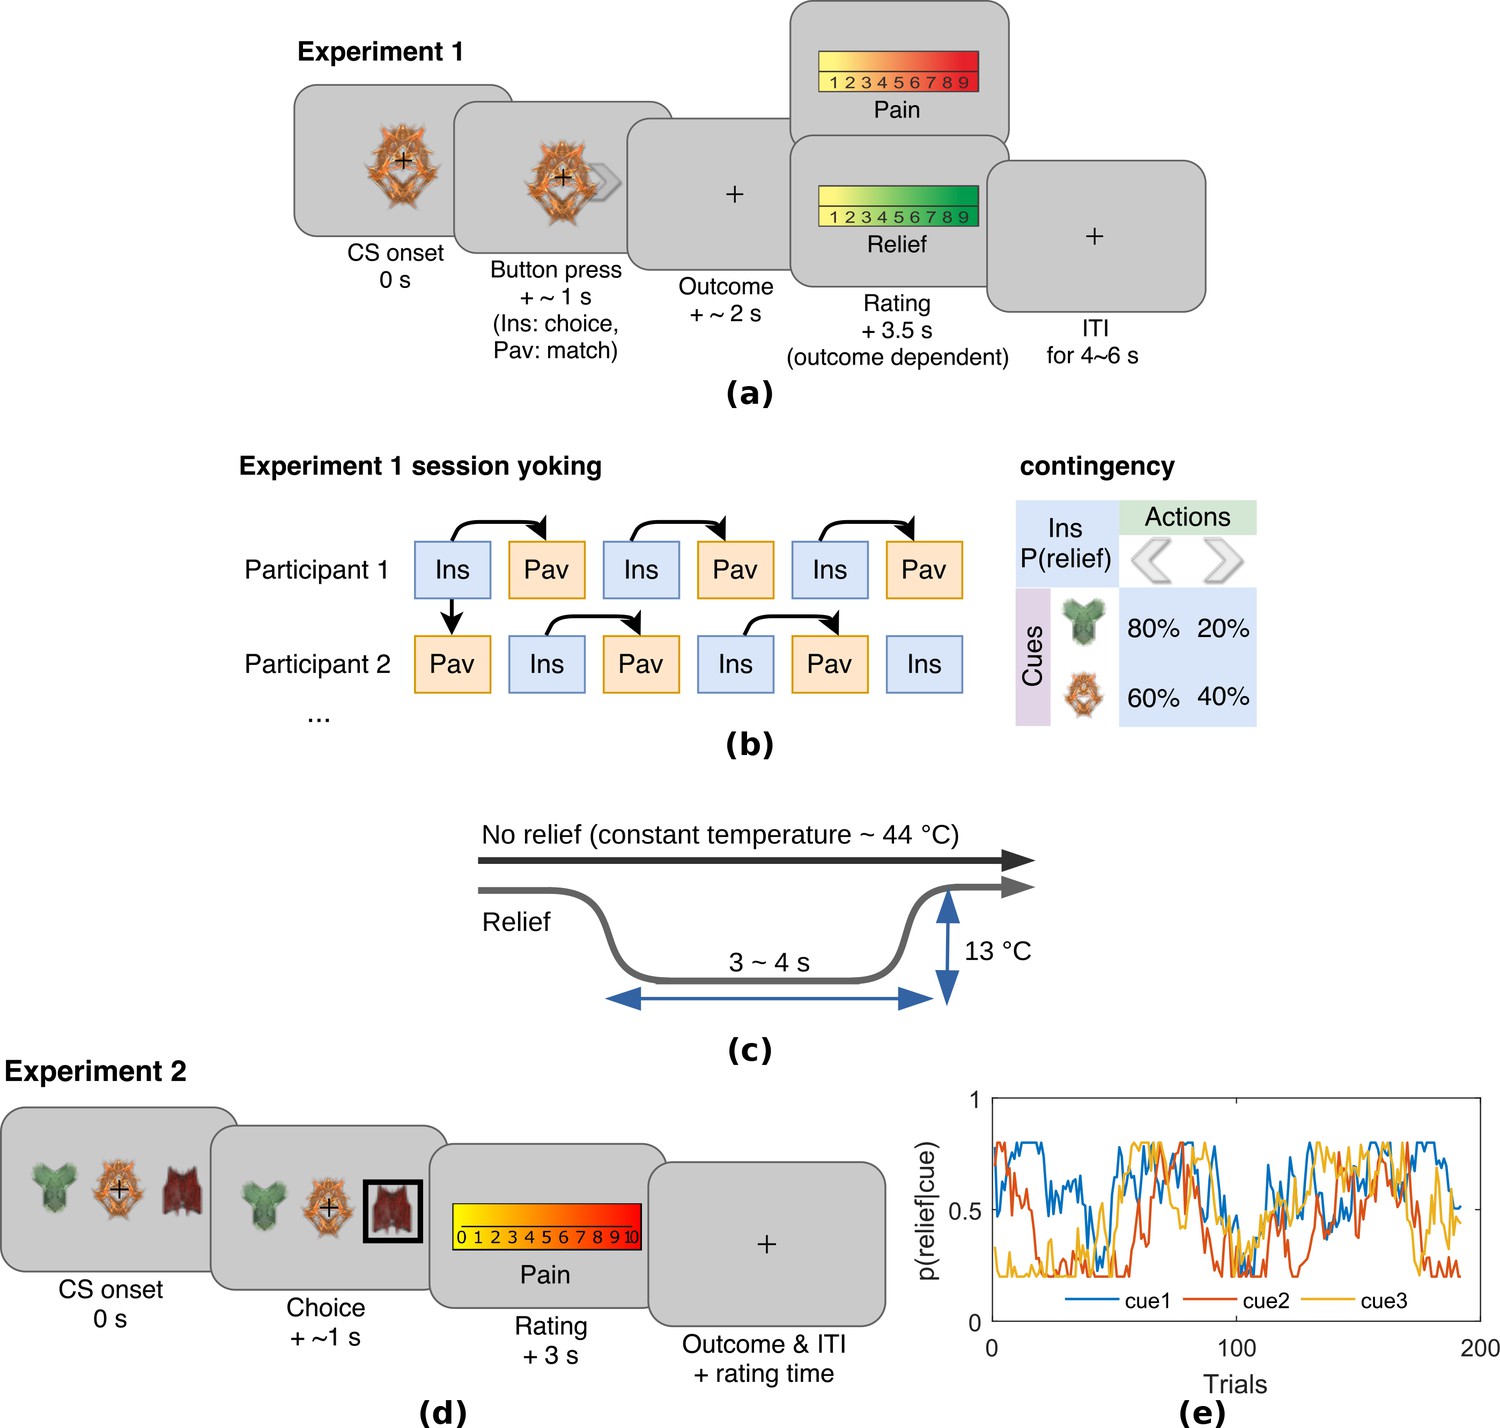
Experimental paradigms.
(a) Example trial in Experiment 1, which was an instrumental relief learning task (Ins) with fixed relief probabilities, yoked with identical Pavlovian task (Pav) within subject. In instrumental trials, subjects saw one of two images (’cues’) and then chose a left or right button press, with each action associated with a particular probability of relief. In the yoked Pavlovian session, subjects were simply asked to press button to match the action shown on screen (appearing 0.5 s after CS onset). (b) Instrumental/Pavlovian session yoking and cue-outcome contingency in Experiment 1, arrows represent identical stimulus-outcome sequence. Note in contingency table, left and right button presses were randomised for both actions and cues. (c) Relief and no relief outcomes, individually calibrated, constant temperatures at around 44°C were used to elicit tonic pain; a brief drop in temperature of 13°C was used as a relief outcome (4 s in Experiment 1, 3 s in Experiment 2), but temperature did not change for the duration in no relief outcomes. (d) Example trial in Experiment 2, where subjects performed an instrumental paradigm (only) involving unstable relief probabilities. The cue-action representation was different to Experiment 1, and three cues were presented alongside each other with subjects required to choose one of the three using a button press. The position of each cue varied from trial-to-trial, and the same three cues were presented throughout. Tonic pain rating being taken before the outcome was experienced, not after as in Experiment 1. (e) Example traces of dynamic relief probabilities for the three displayed cues throughout all trials in eight sessions in Experiment 2, which required a constant trade-off of exploration and exploitation throughout the task. Dynamic relief probabilities also provide varying uncertainty throughout learning.
Figure 2 with 3 supplements
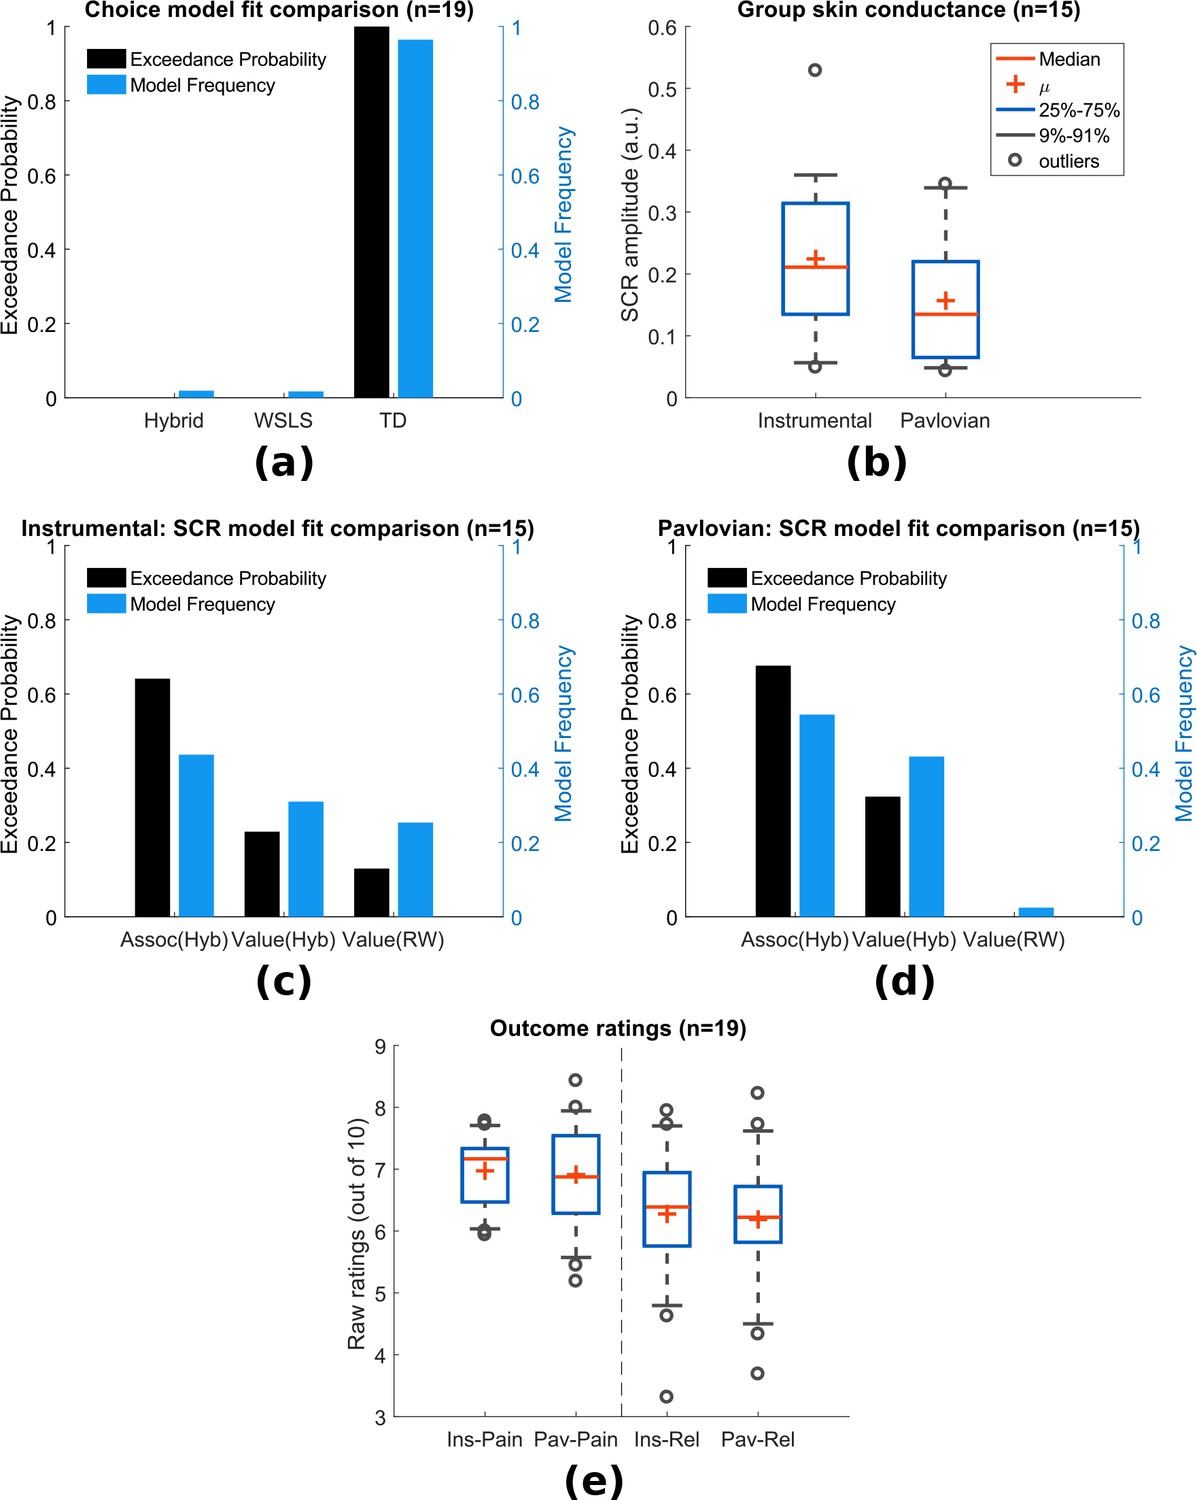
Experiment 1: behavioural results.
(a) Choice-fitted model comparison, TD model fit instrumental sessions choices best (TD: action-learning model with fixed learning rate, Hybrid: action-learning model with associability as changing learning rate, WSLS: win-stay-lose-shift model). Model frequency represents how likely a model generate the data given a random participant, while exceedance probability estimates how one model is more likely compared to others (Stephan et al., 2009). (b) Instrumental vs Pavlovian sessions SCRs (n = 15, sessions with over 20% trials <0.02 amplitude excluded). (c) Associability from hybrid model fitted trial-by-trial SCRs best in instrumental sessions (Assoc: associability, Hyb: hybrid model, RW: Rescorla-Wagner model). (d) Associability also fitted SCRs from Pavlovian sessions best. (e) Both pain and relief ratings did not differ significantly between instrumental and Pavlovian sessions (Participants’ ratings were averaged for each of the four categories shown, mean = 8 ratings per person per category).
-
Figure 2—source data 1
Experiment 1’s behavioural data including SCRs, choices, ratings can be found in zip file attached.
- https://doi.org/10.7554/eLife.31949.008
Figure 2—figure supplement 1

Experiment 1: raw skin conductance traces, where vertical lines are beginning of each trial when cue display starts (n = 15, excluded participants not shown, showing first non-excluded session from all participant).
https://doi.org/10.7554/eLife.31949.005
Figure 2—figure supplement 2

Experiment 1: filtered skin conductance traces (band-pass at 0.0159–2 Hz, 1 st order Butterworth), averaged across all trials within participant (n = 15, excluded participants not shown, shaded region represent SEM across all participants).
https://doi.org/10.7554/eLife.31949.006
Figure 2—figure supplement 3
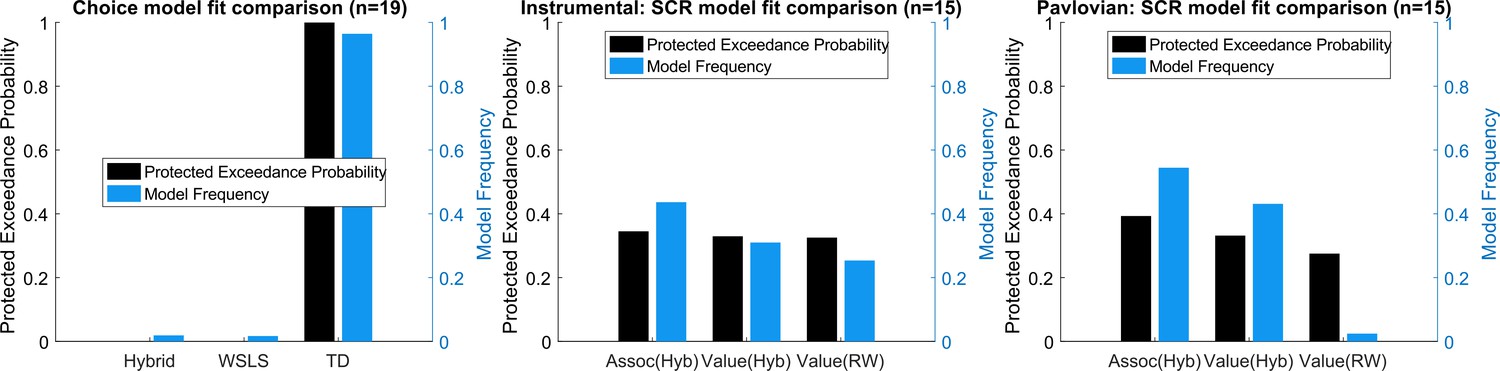
Experiment 1: Model protected exceedance probability.
Choice fitting remains similar to the original exceedance probability, however, SCR fitting comparison becomes less clear regarding best fitting model.
Figure 3
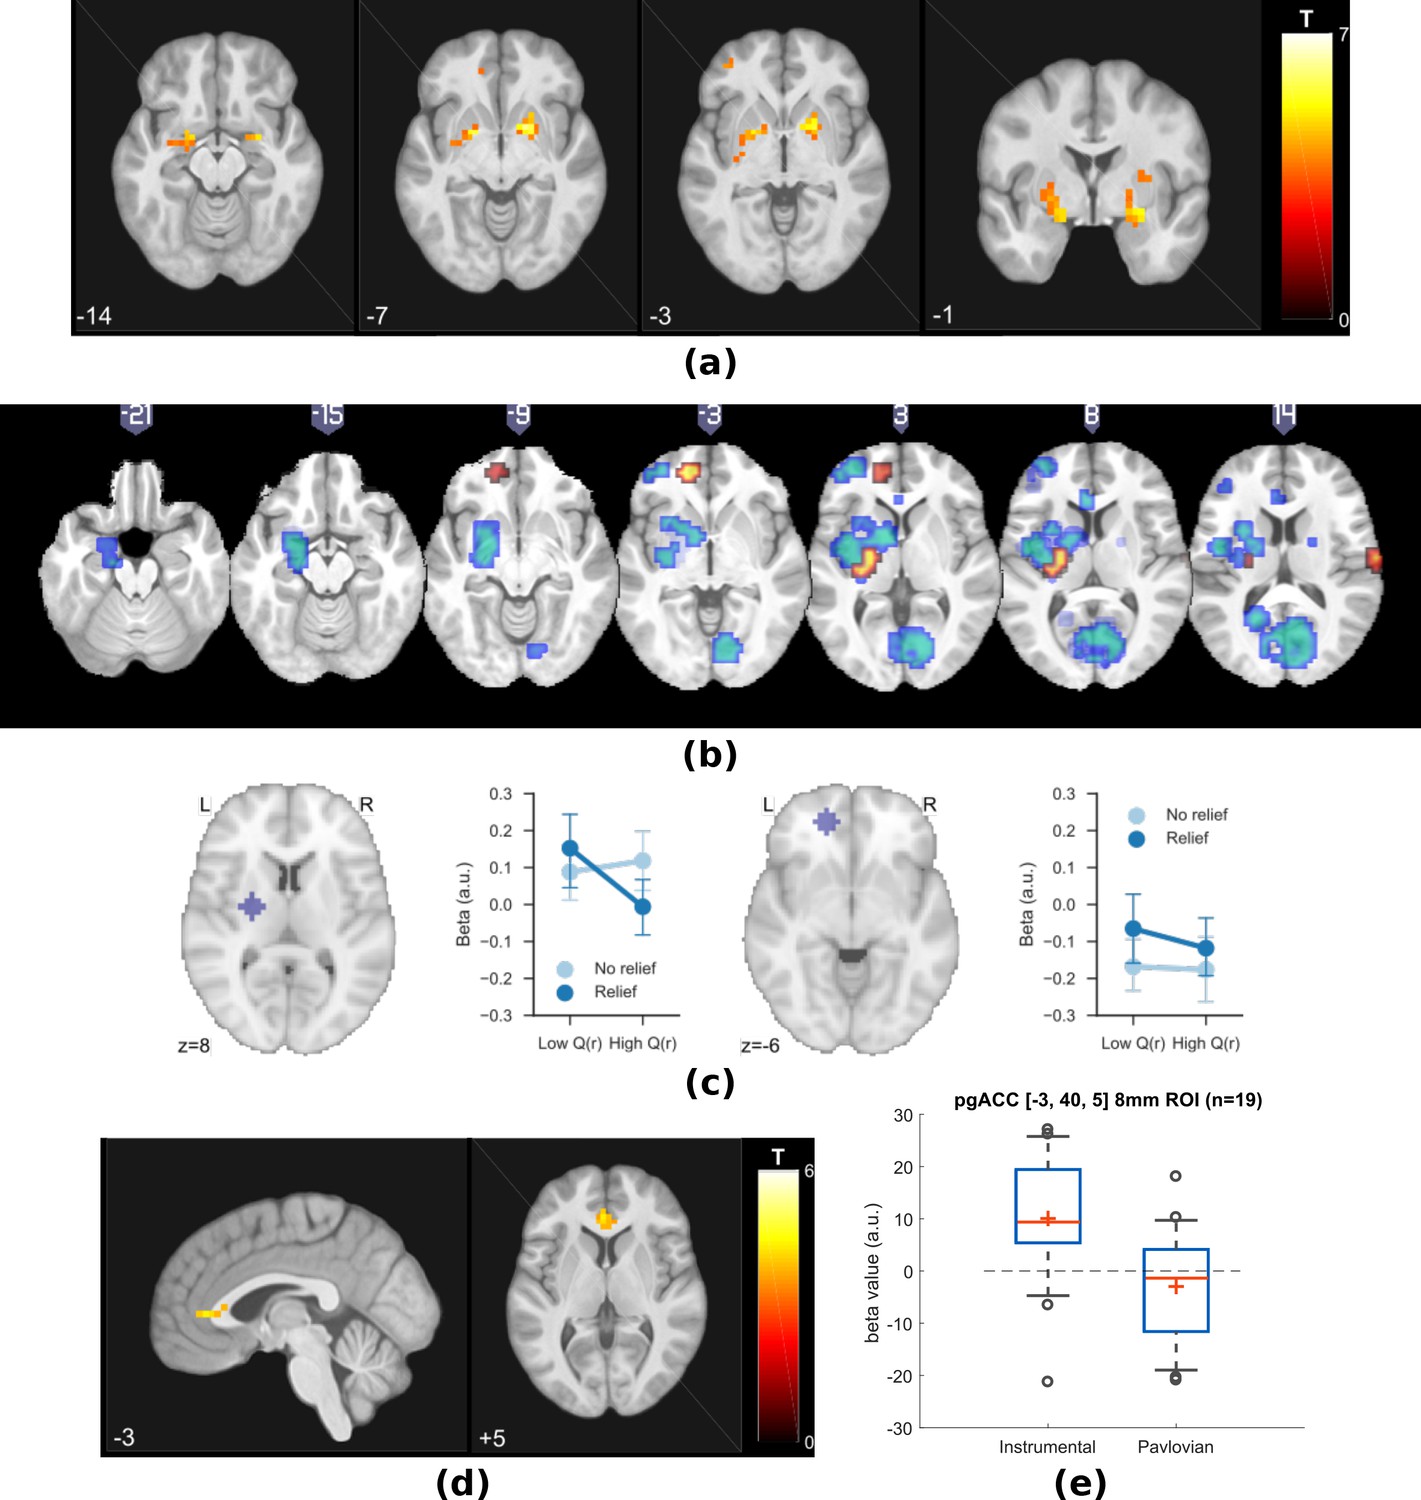
Experiment 1: neuroimaging results, shown at p<0.001 uncorrected: (a) TD model prediction errors (PE) as parametric modulators at outcome onset time (duration = 3 s).
(b) Model PE posterior probability maps (PPMs) from group-level Bayesian model selection (BMS) within PE cluster mask, warm colour: TD model PE, cool colour: hybrid model PE (shown at exceedance probability P>0.7). (c) Axiomatic analysis of hybrid model PEs in instrumental sessions, ROIs were 8 mm spheres from BMS peaks favouring TD model PEs, in left putamen and VMPFC. (d) Associability uncertainty generated by hybrid model, as parametric modulators at choice time (duration = 0), in instrumental sessions. (e) Comparing pgACC activations across instrumental/Pavlovian paradigms, ROI was 8 mm sphere at [−3, 40, 5], peak from overlaying the pgACC clusters from Experiments 1 and 2.
Figure 4 with 3 supplements

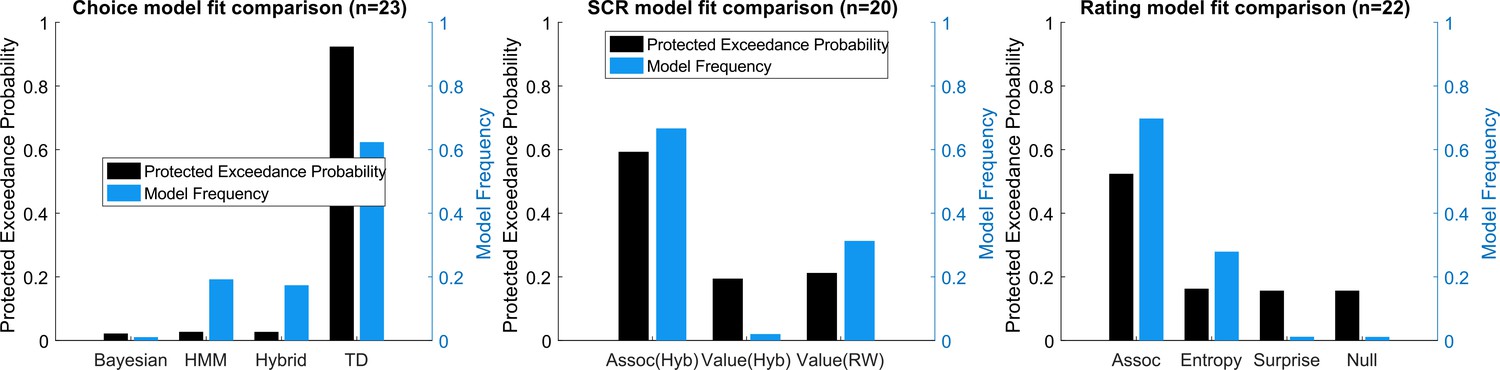
Experiment 2: behavioural results.
(a) Model comparison showed that TD model fitted choices best (Bayesian: hierarchical Bayesian model, HMM: hidden Markov model, Hybrid: action-learning model with associability as changing learning rate). (b) SCRs measured on the side with thermal stimulation (‘Stim side’, left hand) were lower than those on without stimulation (‘Non-stim side’, right hand), but both were highly correlated. (c) Associability from state-learning hybrid model fit SCRs best, similarly to Experiment 1. (d) Trial-by-trial associability from hybrid model fitted pain ratings best compared with other uncertain measures (entropy: HMM entropy, surprise: TD model prediction error magnitude from previous trial, null model: regression with no predictors). (e) Regression coefficients with associability as uncertainty predictor were significantly negative across subjects.
-
Figure 4—source data 1
Experiment 2: behavioural data including SCRs, choices, ratings can be found in zip file attached.
- https://doi.org/10.7554/eLife.31949.016
Figure 4—figure supplement 1
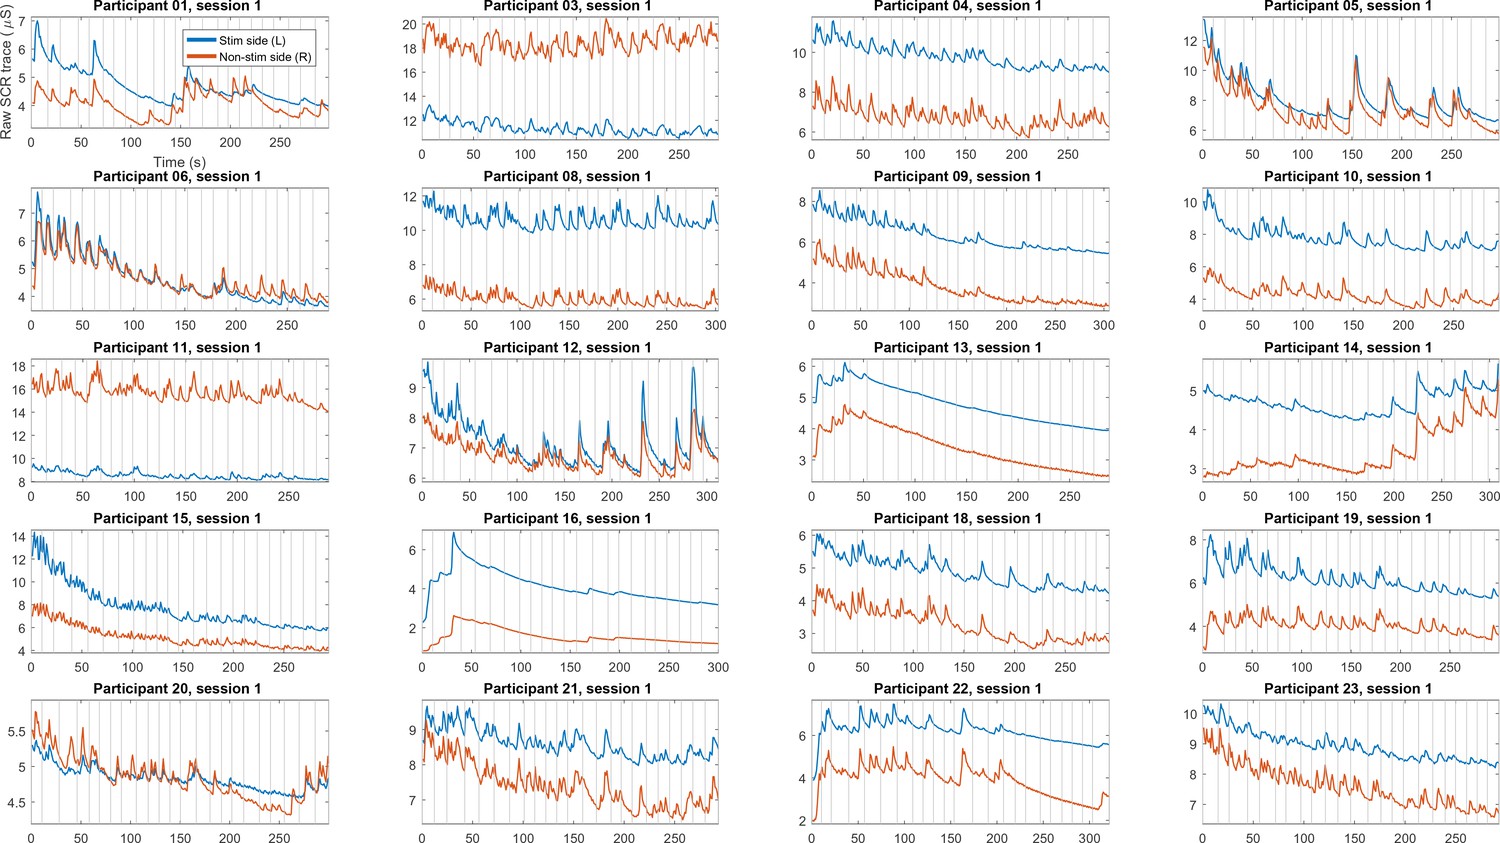
Experiment 2: raw skin conductance traces, where vertical lines are beginning of each trial when cue display starts (n = 20, excluded participants not shown, showing first non-excluded session from all participants).
https://doi.org/10.7554/eLife.31949.013
Figure 4—figure supplement 2
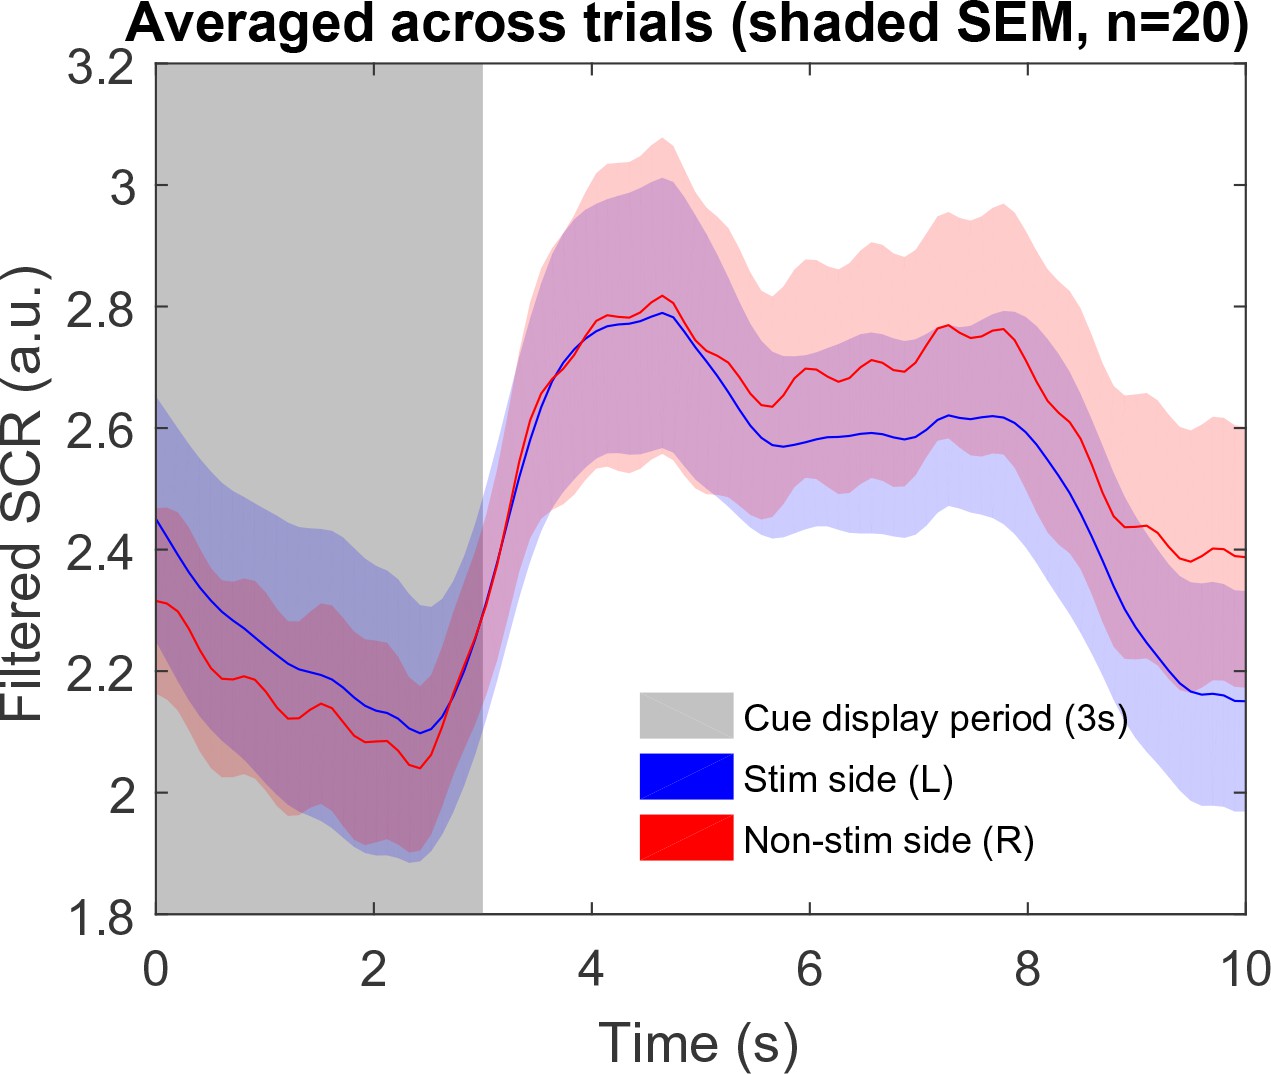
Experiment 2: filtered skin conductance traces (band-pass at 0.0159–2 Hz, 1 st order Butterworth), averaged across all trials within participant (n = 20, excluded participants not shown, shaded region represent SEM across all participants).
In Experiment 2, pain ratings took place immediately after cue display period, with variable length of rating time (participant terminates rating whenever they finish). This increased time gap between cue display and outcome account for the second peak in trial averaged SCR trace.
Figure 4—figure supplement 3
Experiment 2: model protected exceedance probability.
Choice, SCR, rating fitting all remain similar to original exceedance probability figures.
Figure 5 with 2 supplements
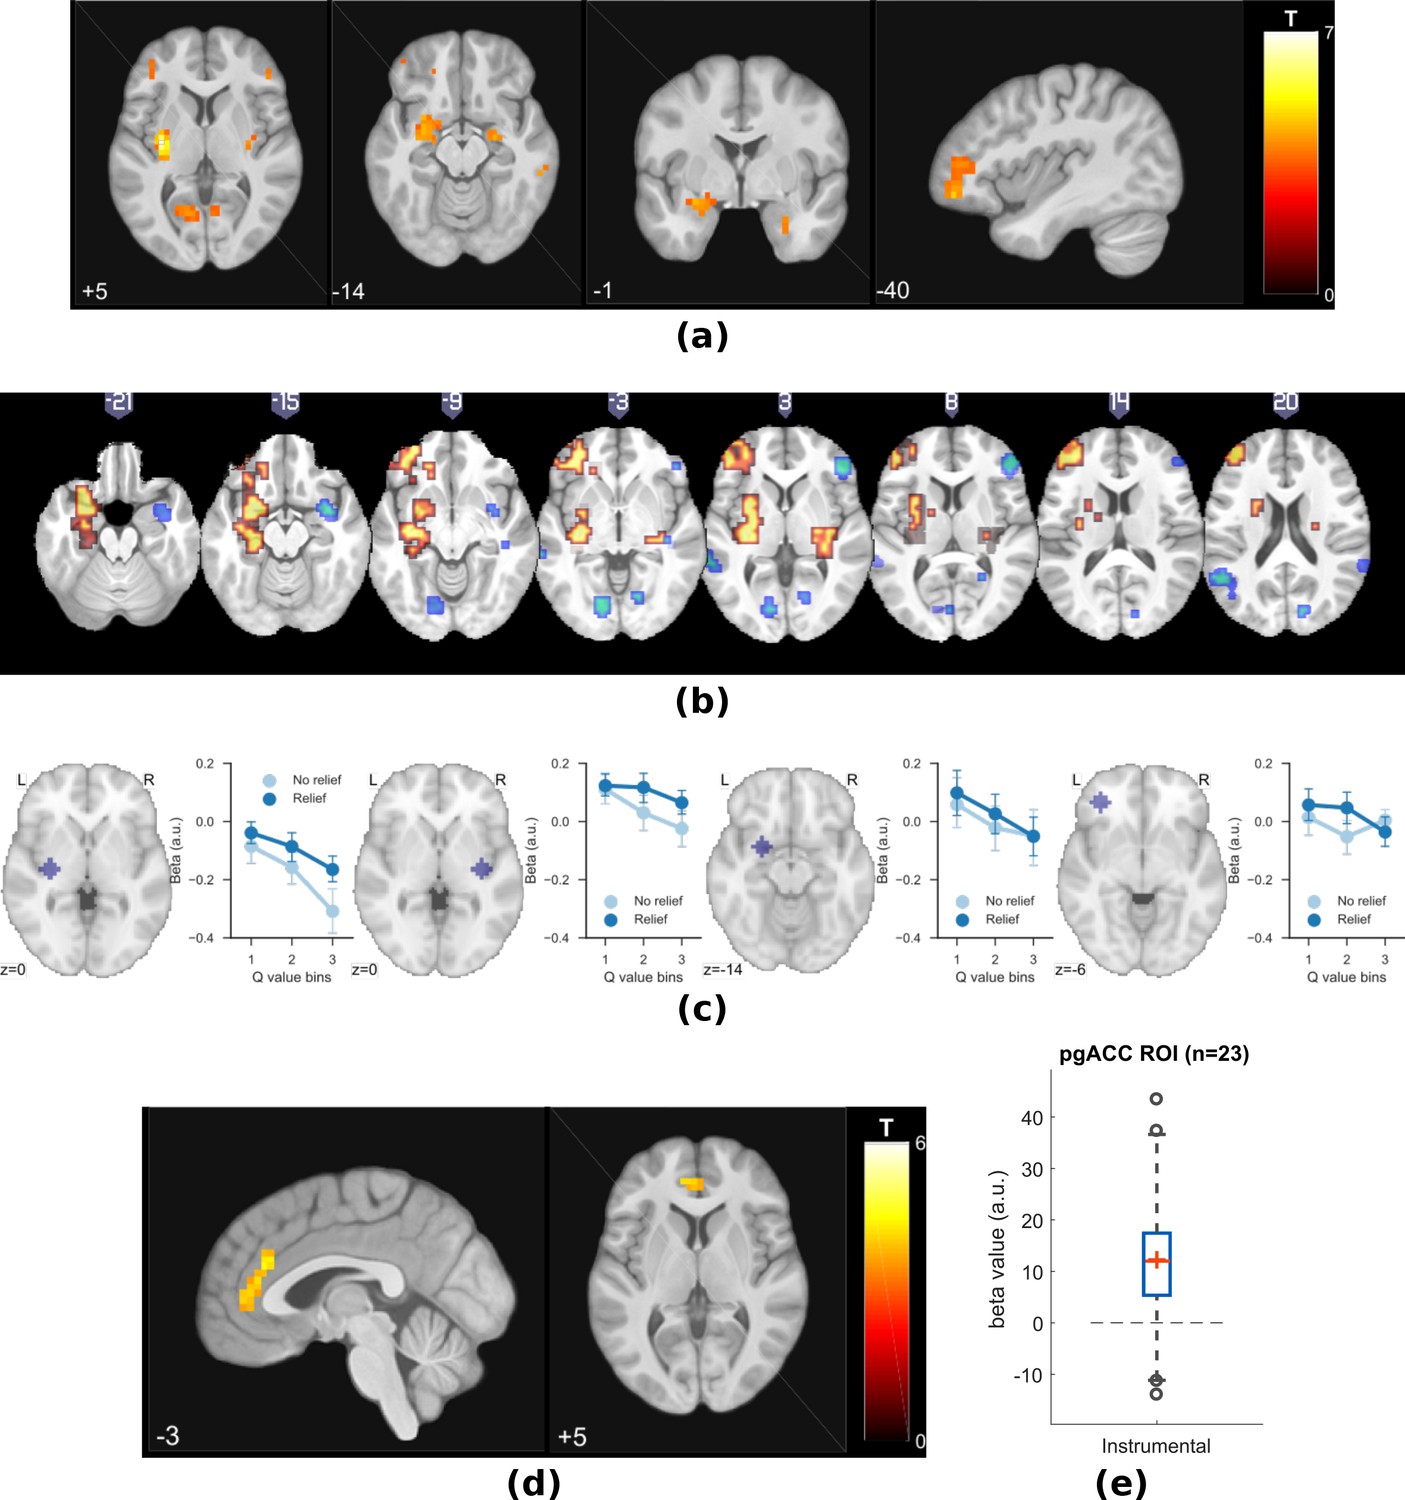
Experiment 2: neuroimaging results, shown at p<0.001 uncorrected: (a) TD model prediction errors (PE), at outcome onset time (duration = 3 s).
(b) Model PE posterior probability maps (PPMs) from group-level Bayesian model selection, warm colour: TD model PE, cool colour: hybrid model PE (both shown at exceedance probability p>0.80). (c) Axiom analysis, separating trials according to outcomes and predicted relief values (bins 1–3 from low to high), BOLD activity pattern from striatum (putamen) satisfied those of relief PE. (d) Associability uncertainty generated by hybrid model correlating with pgACC activities, at choice time (duration = 0). (e) pgACC activation beta values across all subjects, ROI was 8 mm sphere at [−3, 40, 5], peak from overlaying the pgACC clusters from Experiments 1 and 2.
Figure 5—figure supplement 1
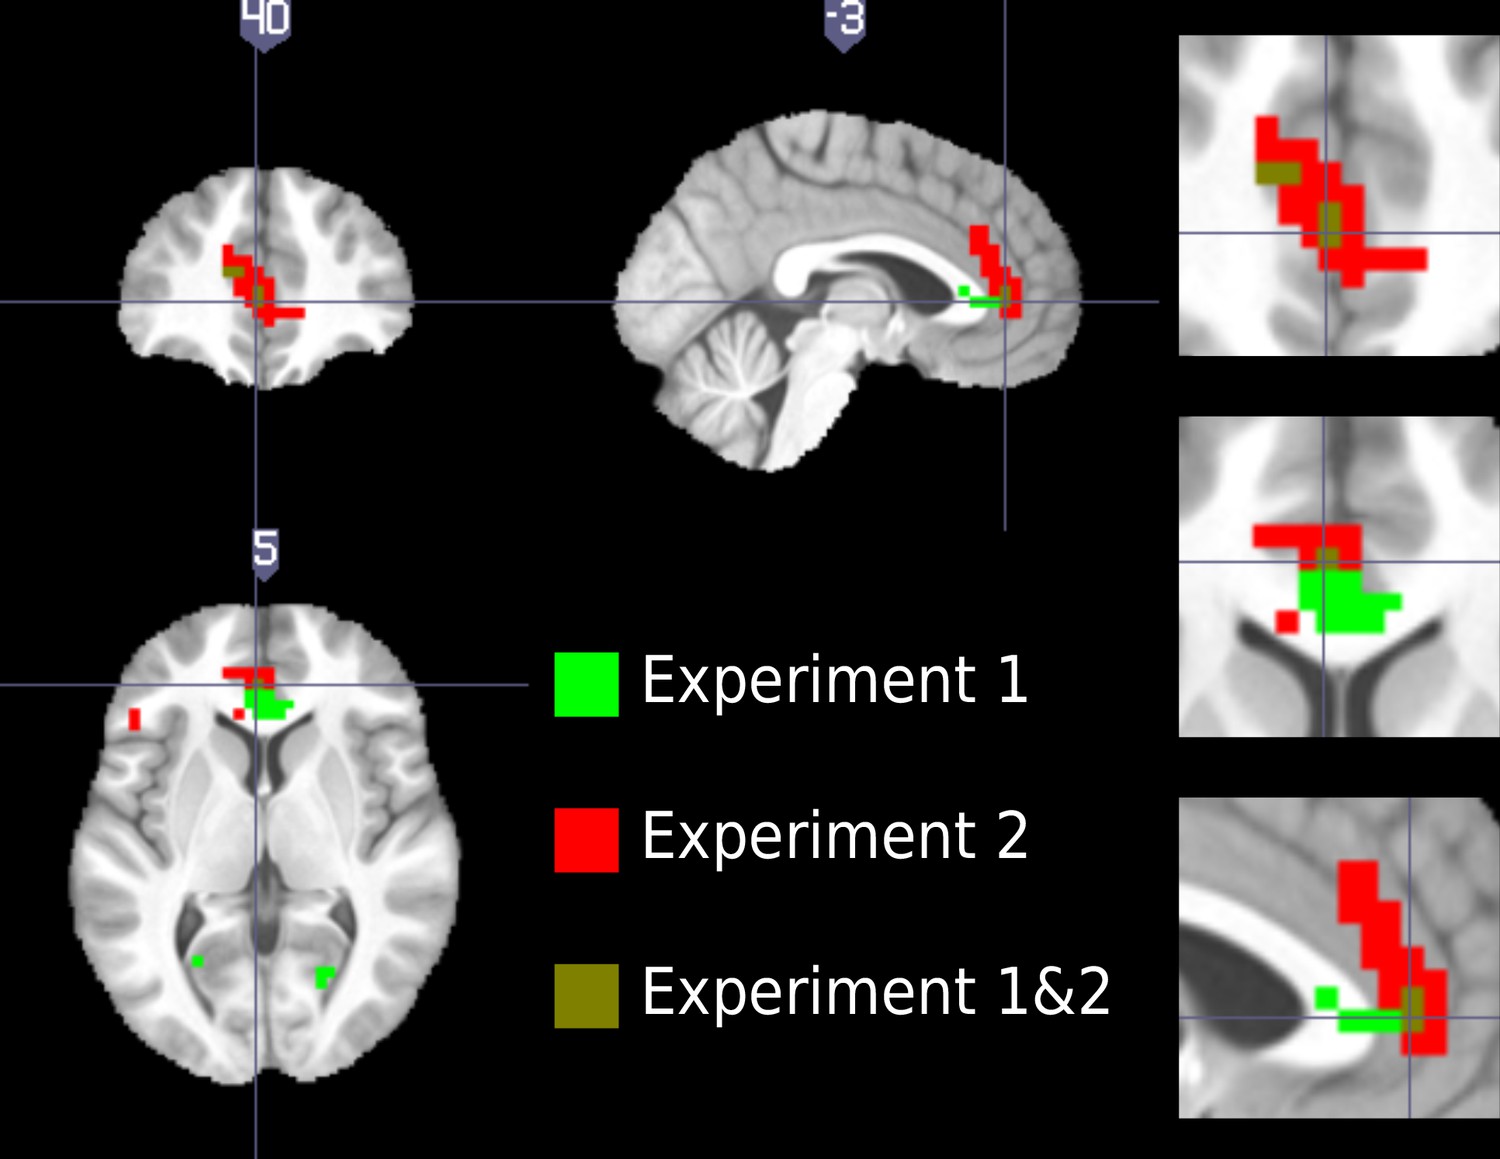
Overlaying associability associated pgACC responses from both experiments (displayed at p<0.001 unc., crosshair at [−3, 40, 5]).
https://doi.org/10.7554/eLife.31949.019
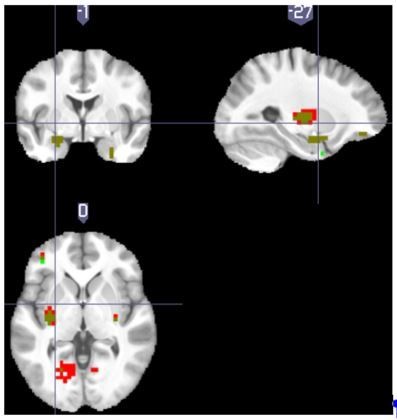
Figure 5—figure supplement 2

Overlaying prediction error associated responses from both experiments (displayed at p<0.001 unc., showing overlapping dorsal putamen and amygdala clusters).
https://doi.org/10.7554/eLife.31949.020
Author response image 1
Author response image 2

Tables
Table 1
Multiple correction for Experiment 1 (cluster-forming threshold of p<0.001 uncorrected, regions from Harvard-Oxford atlas. *FWE cluster-level corrected (showing p<0.05 only).
https://doi.org/10.7554/eLife.31949.010| p* | k | T | Z | MNI coordinates (mm) | Region mask | ||
|---|---|---|---|---|---|---|---|
| x | y | z | |||||
| TD model PE, instrumental sessions | |||||||
| 0.007 | 4 | 4.27 | 3.5 | −21 | -5 | −14 | Amygdala L |
| 0.011 | 3 | 4.98 | 3.9 | 28 | -1 | −14 | Amygdala R |
| 0 | 28 | 5.31 | 4.07 | −21 | 3 | -7 | Putamen L |
| 4.7 | 3.75 | −28 | -5 | 1 | |||
| 0.003 | 14 | 5.73 | 4.27 | 20 | 7 | -7 | Putamen R |
| 0.034 | 2 | 3.75 | 3.18 | 28 | -1 | 8 | |
| 0.007 | 4 | 4.63 | 3.71 | −17 | 3 | -3 | Pallidum L |
| 0.003 | 9 | 5.2 | 4.01 | 17 | 7 | -3 | Pallidum R |
| Hybrid model PE, instrumental sessions | |||||||
| 0.005 | 5 | 4.3 | 3.52 | −21 | -5 | −14 | Amygdala L |
| 0.014 | 2 | 4.53 | 3.65 | 28 | -1 | −14 | Amygdala R |
| 0.004 | 12 | 5.02 | 3.92 | −21 | 3 | -7 | Putamen L |
| 0.012 | 6 | 4.55 | 3.66 | −28 | 3 | 8 | |
| 0.046 | 1 | 3.82 | 3.23 | −28 | 11 | -3 | |
| 0.001 | 23 | 5.03 | 3.92 | 20 | 7 | -7 | Putamen R |
| 4.92 | 3.87 | 20 | 7 | 1 | |||
| 4.39 | 3.57 | 24 | -1 | 5 | |||
| 0.006 | 5 | 4.04 | 3.36 | −17 | 3 | -3 | Pallidum L |
| 0.005 | 6 | 4.82 | 3.81 | 17 | 7 | 1 | Pallidum R |
| Hybrid model PE, Pavlovian sessions | |||||||
| None | |||||||
| Hybrid model associability, instrumental sessions | |||||||
| 0.027 | 5 | 4.34 | 3.55 | -2 | 37 | 5 | Cingulate Anterior |
Table 5
Experiment 1 learning model fitting results.
https://doi.org/10.7554/eLife.31949.011| Model (Options) | Data fitted (sessions) | Parameters | Mean | Std | Initial states |
|---|---|---|---|---|---|
| TD (*) | choice (instrumental) | learning rate, | 0.401 | 0.087 | =0 |
| WSLS (*) | choice (instrumental) | pseudo Q (cue 1), p1 | 0.382 | 0.073 | No hidden states |
| pseudo Q (cue 2), p2 | 0.458 | 0.075 | |||
| Hybrid Action learning (*) | choice (instrumental) | free parameter | 0.527 | 0.104 | =0 |
| free parameter | 0.413 | 0.125 | =1 | ||
| RW - V (†) | SCR (instrumental) | learning rate, | 0.492 | 0.013 | =0 |
| RW - V (†) | SCR (Pavlovian) | learning rate, | 0.492 | 0.014 | =0 |
| Hybrid - Assoc (†) | SCR (instrumental) | free parameter | 0.497 | 0.004 | =0 |
| free parameter | 0.495 | 0.004 | =1 | ||
| Hybrid - Assoc (†) | SCR (Pavlovian) | free parameter | 0.498 | 0.003 | =0 |
| free parameter | 0.496 | 0.008 | =1 | ||
| Hybrid - V (†) | SCR (instrumental) | free parameter | 0.492 | 0.012 | =0 |
| free parameter | 0.499 | 0.003 | =1 | ||
| Hybrid - V (†) | SCR (Pavlovian) | free parameter | 0.494 | 0.005 | =0 |
| free parameter | 0.5 | 0.003 | =1 |
-
*Fitting options: muTheta, muPhi = 0, sigmaTheta, sigmaPhi = 1.
†muTheta, muPhi=0, sigmaTheta=0.05, sigmaPhi=1.
Table 6
Experiment 2 learning model fitting results.
https://doi.org/10.7554/eLife.31949.017| Model (Options) | Data fitted | Parameters | Mean | Std | Initial states |
|---|---|---|---|---|---|
| TD (*) | choice | learning rate, | 0.577 | 0.28 | =0 |
| Hybrid Action learning (*) | choice | free parameter | 0.774 | 0.381 | =0 |
| free parameter | 0.14 | 0.139 | =1 | ||
| HMM (*) | choice | state transition probability | 0.275 | 0.213 | =0.5 |
| relief outcome bias c | 0.535 | 0.212 | |||
| no relief outcome bias d | 0.027 | 0.072 | |||
| Bayesian (‡) | choice | level 2 (outcome) | 0.331 | 0.239 | =0 |
| level 2 (outcome) | −0.423 | 1.396 | |||
| level 3 (belief) | 0.45 | 0.03 | |||
| RW - V (†) | SCR (bilateral) | learning rate, | 0.46 | 0.054 | =0 |
| Hybrid - Assoc (†) | SCR (bilateral) | free parameter | 0.49 | 0.01 | =0 |
| free parameter | 0.488 | 0.027 | =1 | ||
| Hybrid - V (†) | SCR (bilateral) | free parameter | 0.48 | 0.034 | =0 |
| free parameter | 0.496 | 0.013 | =1 |
-
* Fitting options: muTheta, muPhi = 0, sigmaTheta, sigmaPhi = 1.
†muTheta, muPhi = 0, sigmaTheta = 0.05, sigmaPhi = 1.
-
‡muTheta=[0,-2,0], muPhi=0, sigmaTheta, sigmaPhi=1
Table 2
Multiple correction for Experiment 2 (cluster-forming threshold of p<0.001 uncorrected, regions from Harvard-Oxford atlas. *FWE cluster-level corrected (showing p<0.05 only).
https://doi.org/10.7554/eLife.31949.021| p* | k | T | Z | MNI coordinates (mm) | Region mask | ||
|---|---|---|---|---|---|---|---|
| x | y | z | |||||
| TD model PE | |||||||
| 0.002 | 15 | 4.31 | 3.63 | −25 | -5 | −22 | Amygdala L |
| 0.003 | 11 | 4.36 | 3.66 | 24 | -8 | −14 | Amygdala R |
| 0.018 | 1 | 3.97 | 3.41 | 28 | -1 | −26 | |
| 0.002 | 22 | 5.9 | 4.52 | −32 | -8 | 5 | Putamen L |
| 0.021 | 4 | 4.55 | 3.78 | 32 | −16 | 1 | Putamen R |
| Hybrid model PE | |||||||
| 0.001 | 16 | 4.36 | 3.66 | −21 | −12 | −14 | Amygdala L |
| 4.23 | 3.58 | −21 | -1 | −18 | |||
| 0.002 | 13 | 4.95 | 4.01 | 24 | -8 | −18 | Amygdala R |
| 4.34 | 3.65 | 28 | -1 | −26 | |||
| 0.003 | 17 | 5.49 | 4.31 | −32 | -8 | 5 | Putamen L |
| Hybrid model associability | |||||||
| 0.001 | 29 | 4.5 | 3.75 | -6 | 40 | 12 | Cingulate Anterior |
| 4.44 | 3.71 | -2 | 33 | 23 | |||
| 4.08 | 3.49 | -2 | 44 | 5 | |||
| 3.93 | 3.38 | 2 | 40 | 1 | |||
Table 3
Details of subjective ratings for Experiments 1 and 2.
https://doi.org/10.7554/eLife.31949.022| Experiment | Rating type | Rating timing | Avg # of ratings per subject |
|---|---|---|---|
| Experiment 1 | Instrumental pain | After 3 s cue + choice window AND outcome (rating type depend on outcome) | 8.2 |
| Instrumental relief | 7.7 | ||
| Pavlovian pain | 8.1 | ||
| Pavlovian relief | 7.7 | ||
| Experiment 2 | Instrumental pain | After 3 s cue + choice window, BEFORE outcome | 70.9 |
Table 4
All learning models fitted (bold: winning model; AL - action-learning; SL - state-learning, F - variational Bayesian approximation to the model’s marginal likelihood, used for model comparison)
https://doi.org/10.7554/eLife.31949.023| Experiment 1 (Instrumental sessions) | |||
|---|---|---|---|
| Choice | F (n=19, sum [sem]) | SCR | F (n = 15, sum [sem]) |
| TD | -1330.920 [3.604] | RW - value | −1079.153 [8.024] |
| Hybrid (AL) | -1345.667 [3.664] | Hybrid (SL) - value | −1077.911 [8.059] |
| WSLS | -1486.723 [3.973] | Hybrid (SL) - associability | −1077.699 [8.003] |
| Experiment 1 (Pavlovian sessions) | |||
| Choice (not available) | SCR | F (n = 15, sum [sem]) | |
| N/A | RW - value | −1101.079 [7.132] | |
| Hybrid (SL) - value | −1096.250 [7.195] | ||
| Hybrid (SL) - associability | −1095.135 [7.106] | ||
| Experiment 2 (Instrumental sessions, Pavlovian not available) | |||
| Choice | F (n=23, sum [sem]) | SCR | F (n = 20, sum [sem]) |
| TD | -3572.476 [8.736] | RW - value | −7867.834 [60.668] |
| Hybrid (AL) | -3626.478 [8.946] | Hybrid (SL) - value | −7857.341 [60.643] |
| HMM | -3571.020 [9.067] | Hybrid (SL) - associability | −7841.864 [60.838] |
| Bayesian Hierarchical | -3784.372 [8.616] | ||
Additional files
-
Transparent reporting form
- https://doi.org/10.7554/eLife.31949.024
Download links
A two-part list of links to download the article, or parts of the article, in various formats.
Downloads (link to download the article as PDF)
Open citations (links to open the citations from this article in various online reference manager services)
Cite this article (links to download the citations from this article in formats compatible with various reference manager tools)
The control of tonic pain by active relief learning
eLife 7:e31949.
https://doi.org/10.7554/eLife.31949


