EGF receptor signaling, phosphorylation, ubiquitylation and endocytosis in tumors in vivo
- University of Pittsburgh School of Medicine, United States
- Institute Pasteur, France
Figures
Figure 1
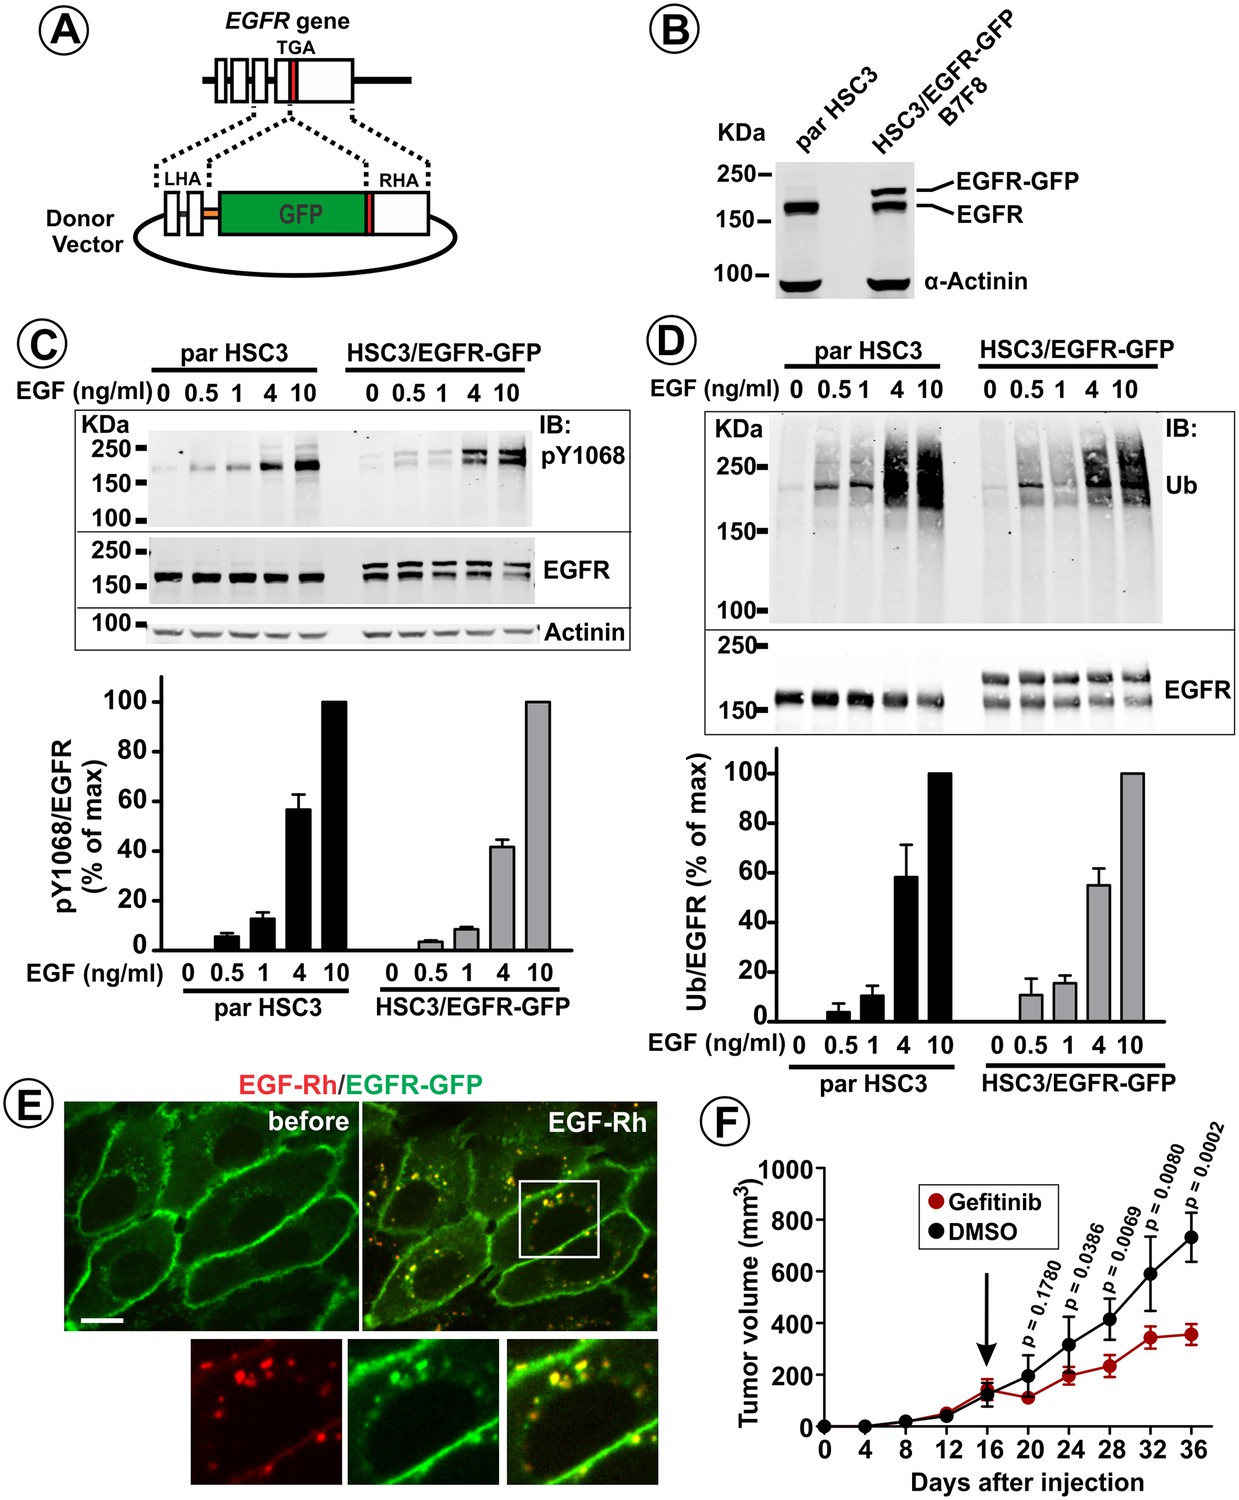
Generation and characterization of HSC3 cells expressing endogenous GFP-tagged EGFR.
(A) Schematics of genome-editing. GFP sequence was inserted in-frame at the 3′-end of the coding sequence of the EGFR gene using a ZFN pair and a donor vector containing GFP inserted between left and right homology arms (LHA and RHA) from the genomic EGFR sequence. (B) Western blotting of parental (par) HSC3 and HSC3/EGFR-GFP cells (B7F8 clone) with the EGFR and α-actinin (loading control) antibodies. (C) Parental (par) HSC3 and HSC3/EGFR-GFP cells were stimulated with EGF for 10 min at 37°C and lysed. The lysates were probed by western blotting using antibodies to pY1068, EGFR and α-actinin (loading control). Bar graph represents mean values of ratios of pY1068 to total EGFR signals expressed as percent of the maximum value of the ratio at 10 ng/ml EGF (±S.E.M; n = 3). (D) Cells were stimulated with EGF for 10 min at 37°C and lysed. EGFR was immunoprecipitated, and the immunoprecipitates were probed by western blotting with ubiquitin and EGFR antibodies. Bar graph represents mean values of ratios of the amount of ubiquitylated EGFR to total EGFR expressed as percent of the maximum value of the ratio at 10 ng/ml EGF (±S.E.M; n = 3). (E) Live-cell imaging of HSC3/EGFR-GFP cells was performed through 488 nm (EGFR-GFP) and 561 nm (EGF-Rh) channels during stimulation of cells with 4 ng/ml EGF-Rh at 37°C. Merged images of individual frames before and 12 min after EGF-Rh stimulation are shown. Insets represent high magnification images of the region indicated by white rectangle. Scale bar, 10 μm. (F) HSC3/EGFR-GFP cells were implanted into flanks of athymic nude mice. Mice harboring tumors were randomized into two groups, which were administered with Gefitinib (30 mg/Kg) or vehicle (DMSO) i.p. 5 days/week for 3 weeks starting on day 16 when tumors reached ~100 mm3 (arrow). Averaged tumor volumes (±S.E.M; n = 6) are presented. Unpaired T-test was performed. p-Values < 0.05 are considered statistically significant.
Figure 2 with 3 supplements
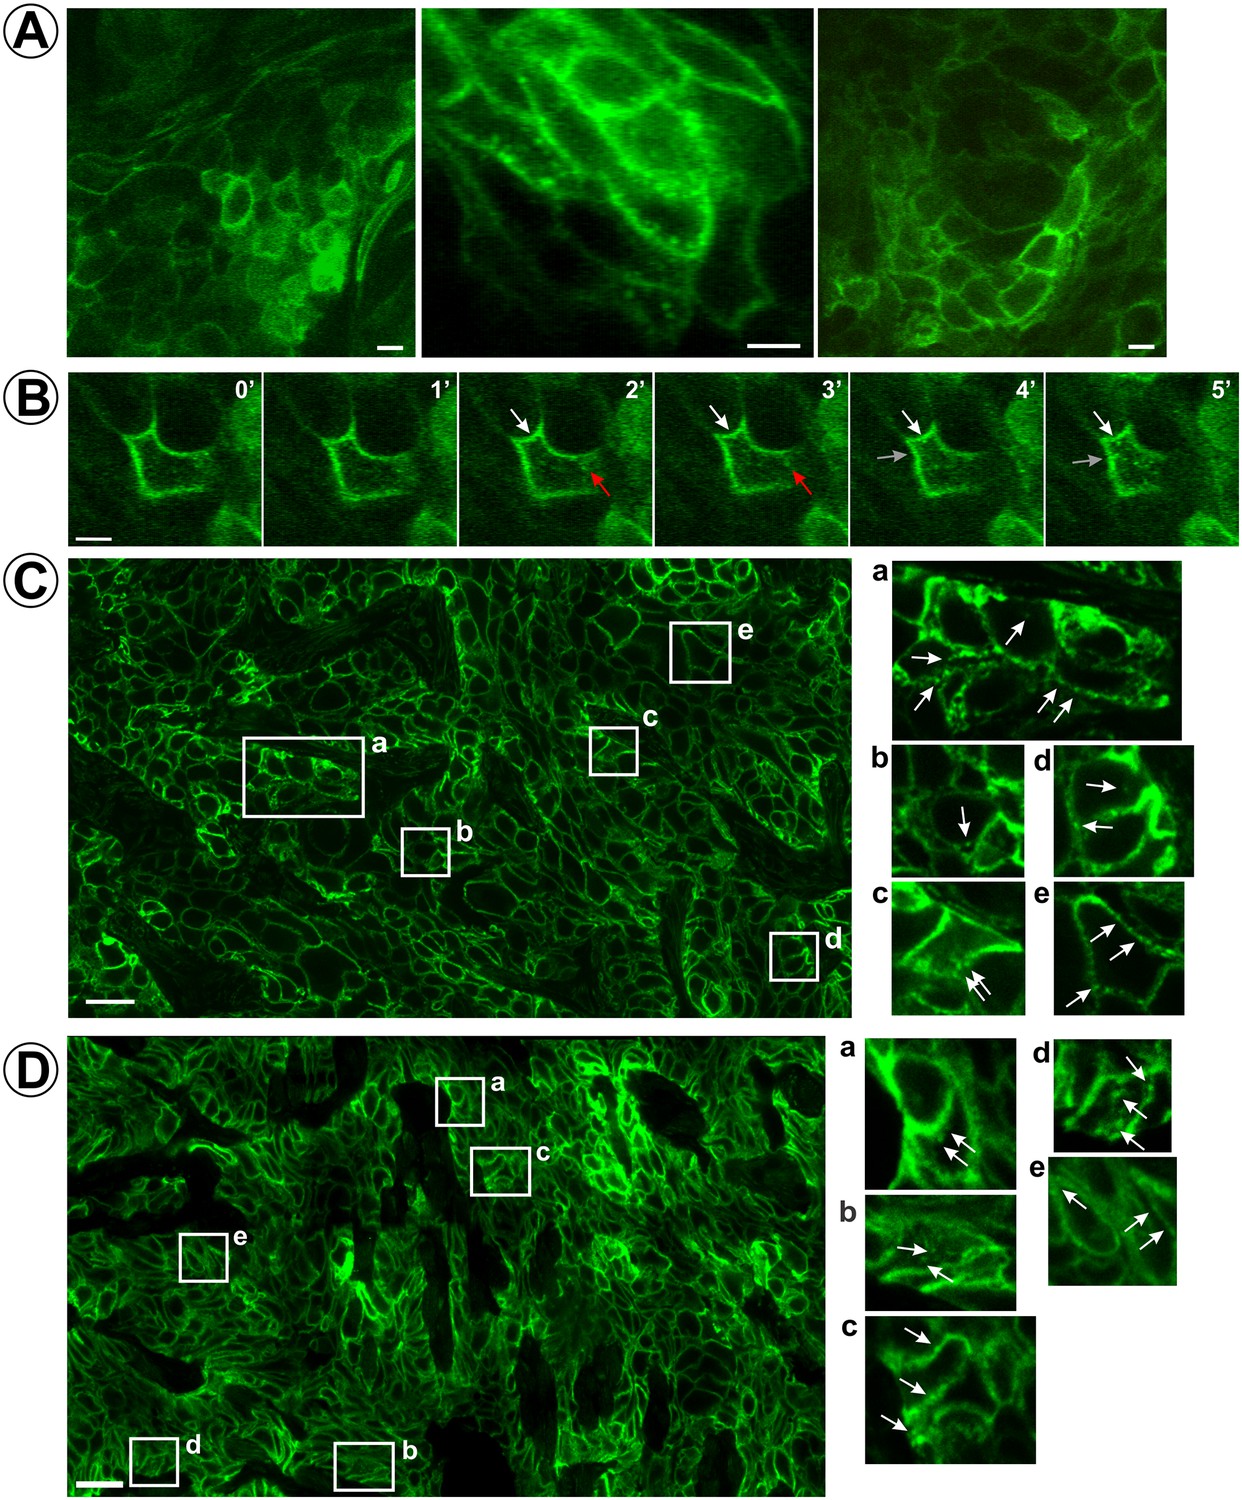
Localization and dynamics of EGFR-GFP in HSC3/EGFR-GFP tumor xenografts.
(A and B) Time-lapse intravital imaging of HSC3/EGFR-GFP flank tumors was performed by multiphoton microscopy as described in ‘Materials and methods’. (A) Representative snapshots from time-lapse series. See Figure 2—video 1. (B) Selected time-lapse images (0–5 min) of a single cell show the apparent formation of vesicles from the plasma membrane (white and red arrows). See Figure 2—video 2. Scale bars, 10 μm. (C and D) HSC3/EGFR-GFP flank (C) or tongue (D) tumors were dissected and fixed in paraformaldehyde. Confocal imaging of cryosections was performed through the 488 nm channel. Montage images of representative areas of tumors are shown. Insets represent high-magnification images of the regions indicated by white rectangles. Arrows point on the examples of clusters and vesicles of EGFR-GFP. Scale bars, 25 μm.
Figure 2—figure supplement 1
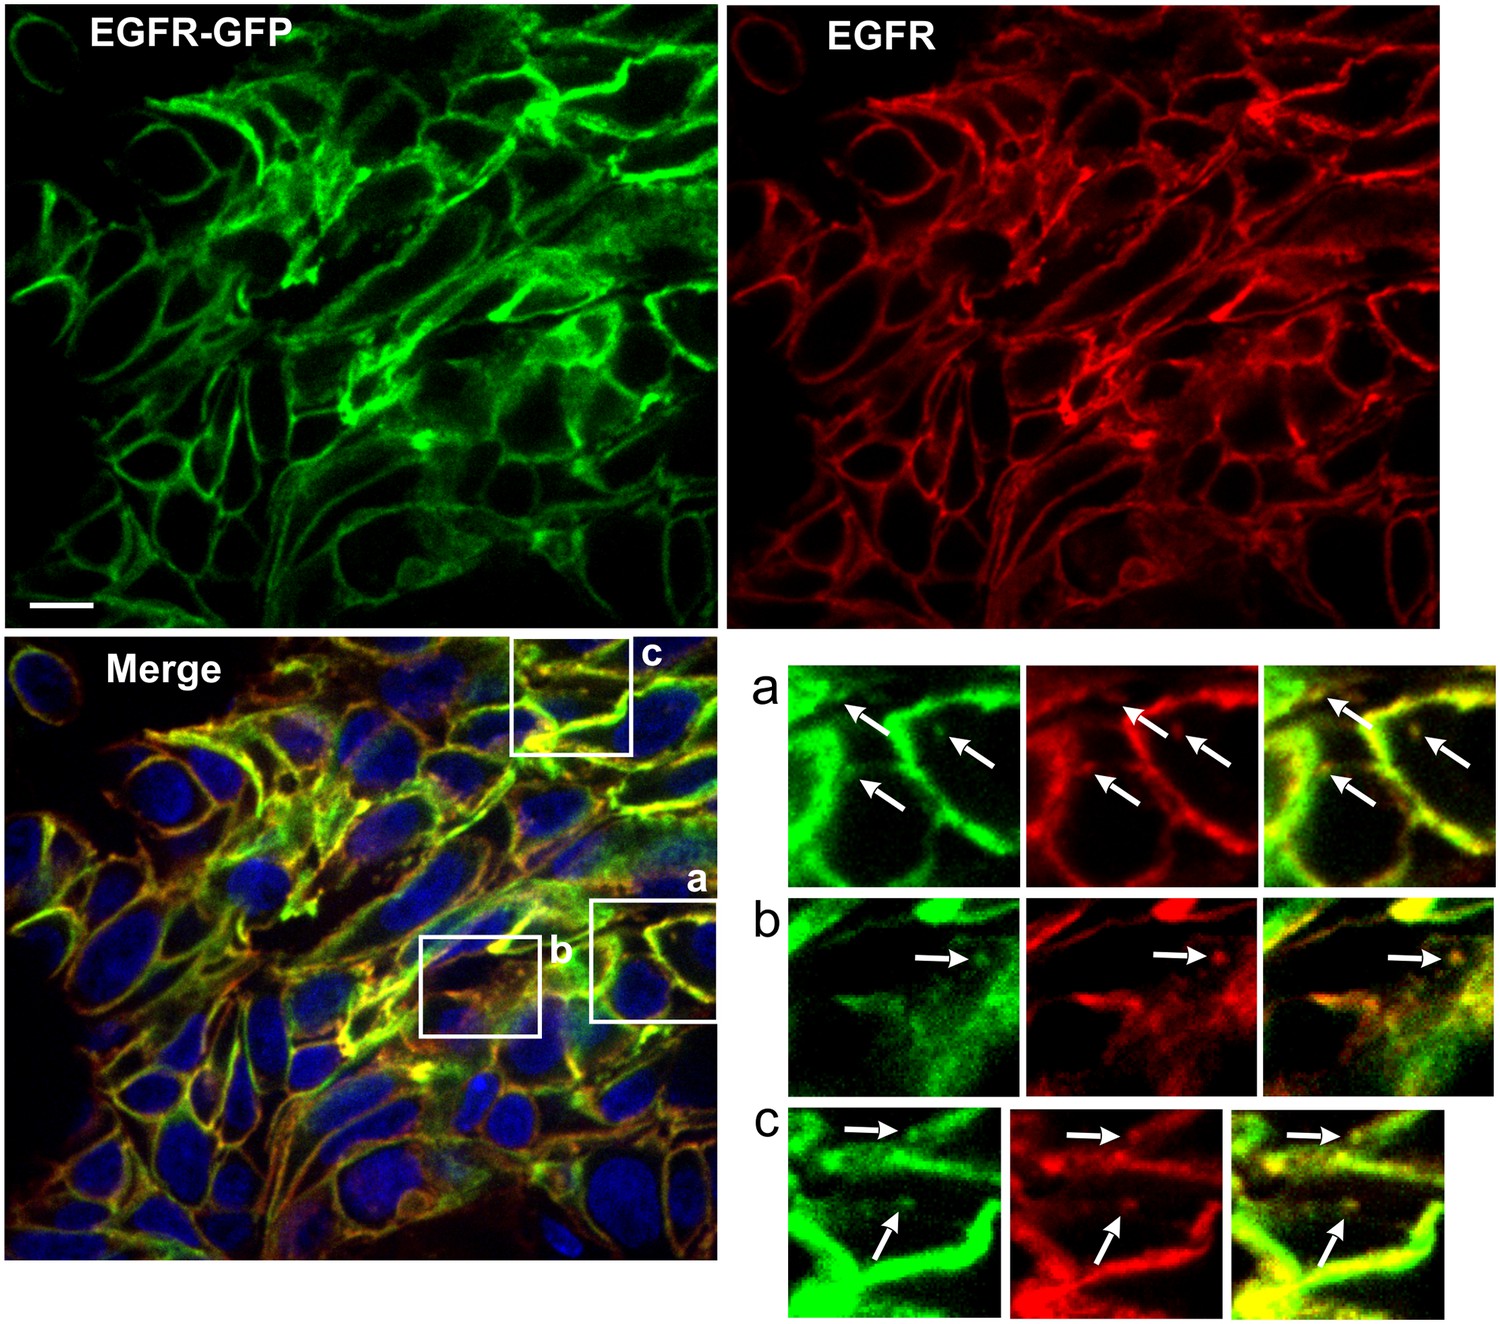
Immunofluorescence labeling of EGFR in HSC3/EGFR-GFP tumor flank xenografts.
Athymic nude mice harboring HSC3/EGFR-GFP xenograft tumors were dissected, fixed in paraformaldehyde and permeabilized with Triton X-100. Cryosections were labeled with Mab528 followed by secondary Cy3-conjugated antibodies (red). Nuclei were stained with Hoescht. Confocal imaging was performed through 488 nm (GFP, green), 561 nm (Cy3, red) and 405 nm (Hoescht, blue). Scale bar, 10 µm. Insets show high-magnification images of regions indicated by white rectangles. Arrows point on examples of Mab528 and GFP co-localization in clusters and vesicles.
Figure 2—video 1
Time lapse imaging of HSC3/EGFR-GFP flank tumor xenograft.
Images were acquired for 5 min every 5 s. See individual frames in Figure 2A, center image.
Figure 2—video 2
Time lapse imaging of HSC3/EGFR-GFP flank tumor xenograft.
Images were acquired for 5 min every 5 s. See individual frames in Figure 2B.
Figure 3 with 1 supplement
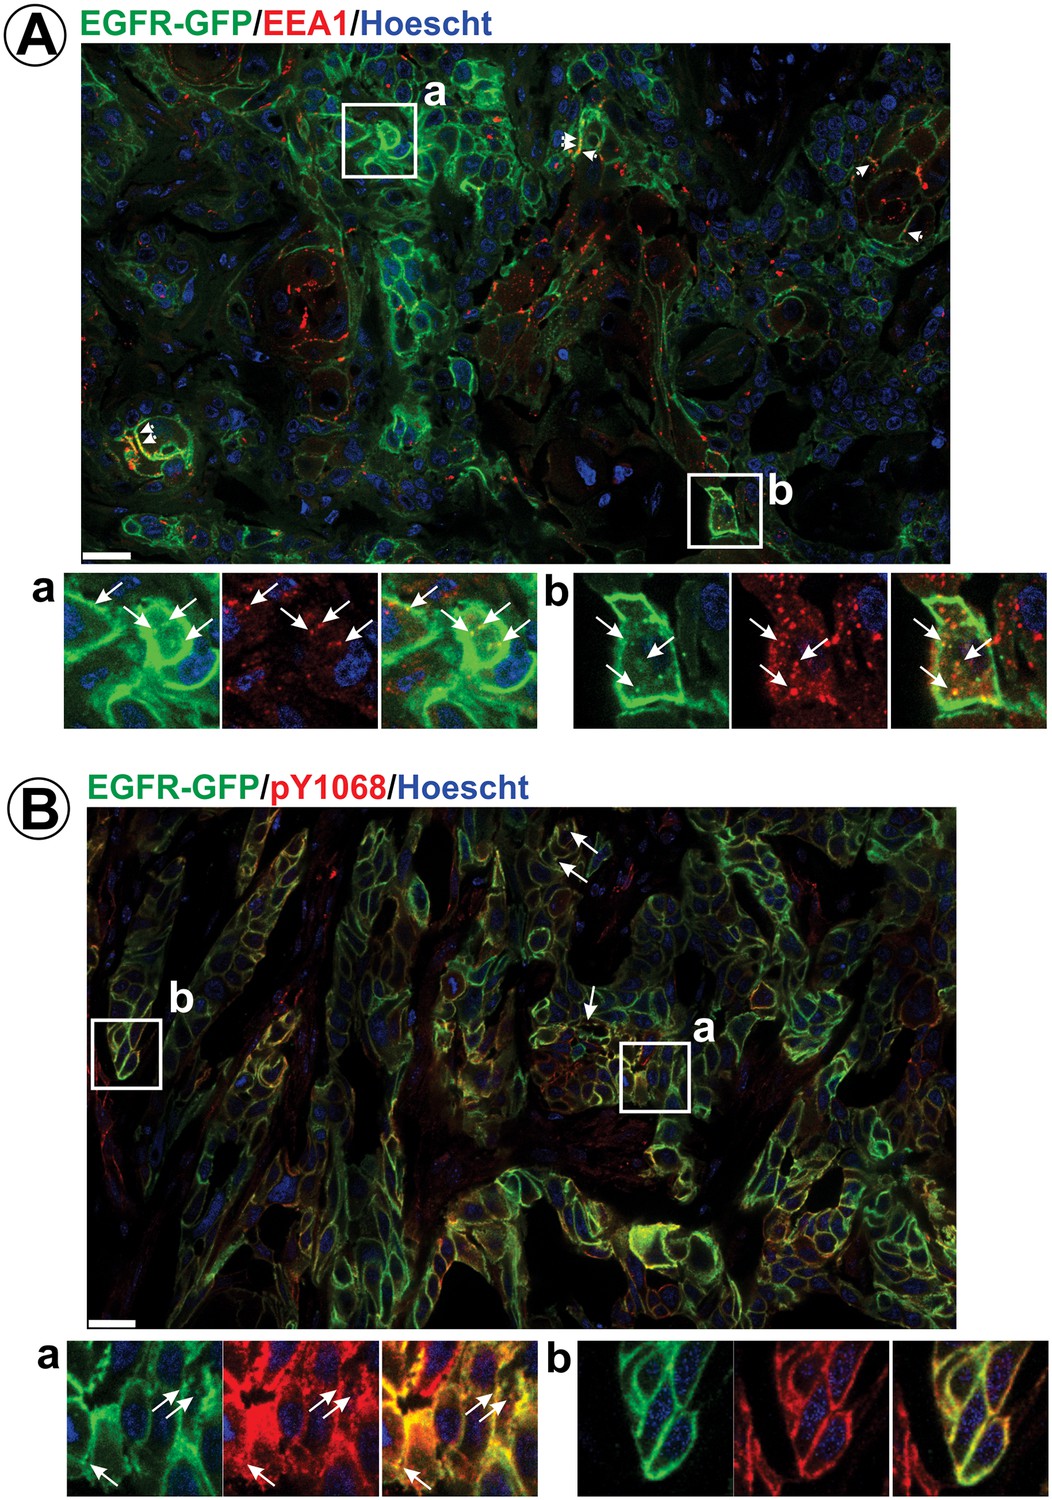
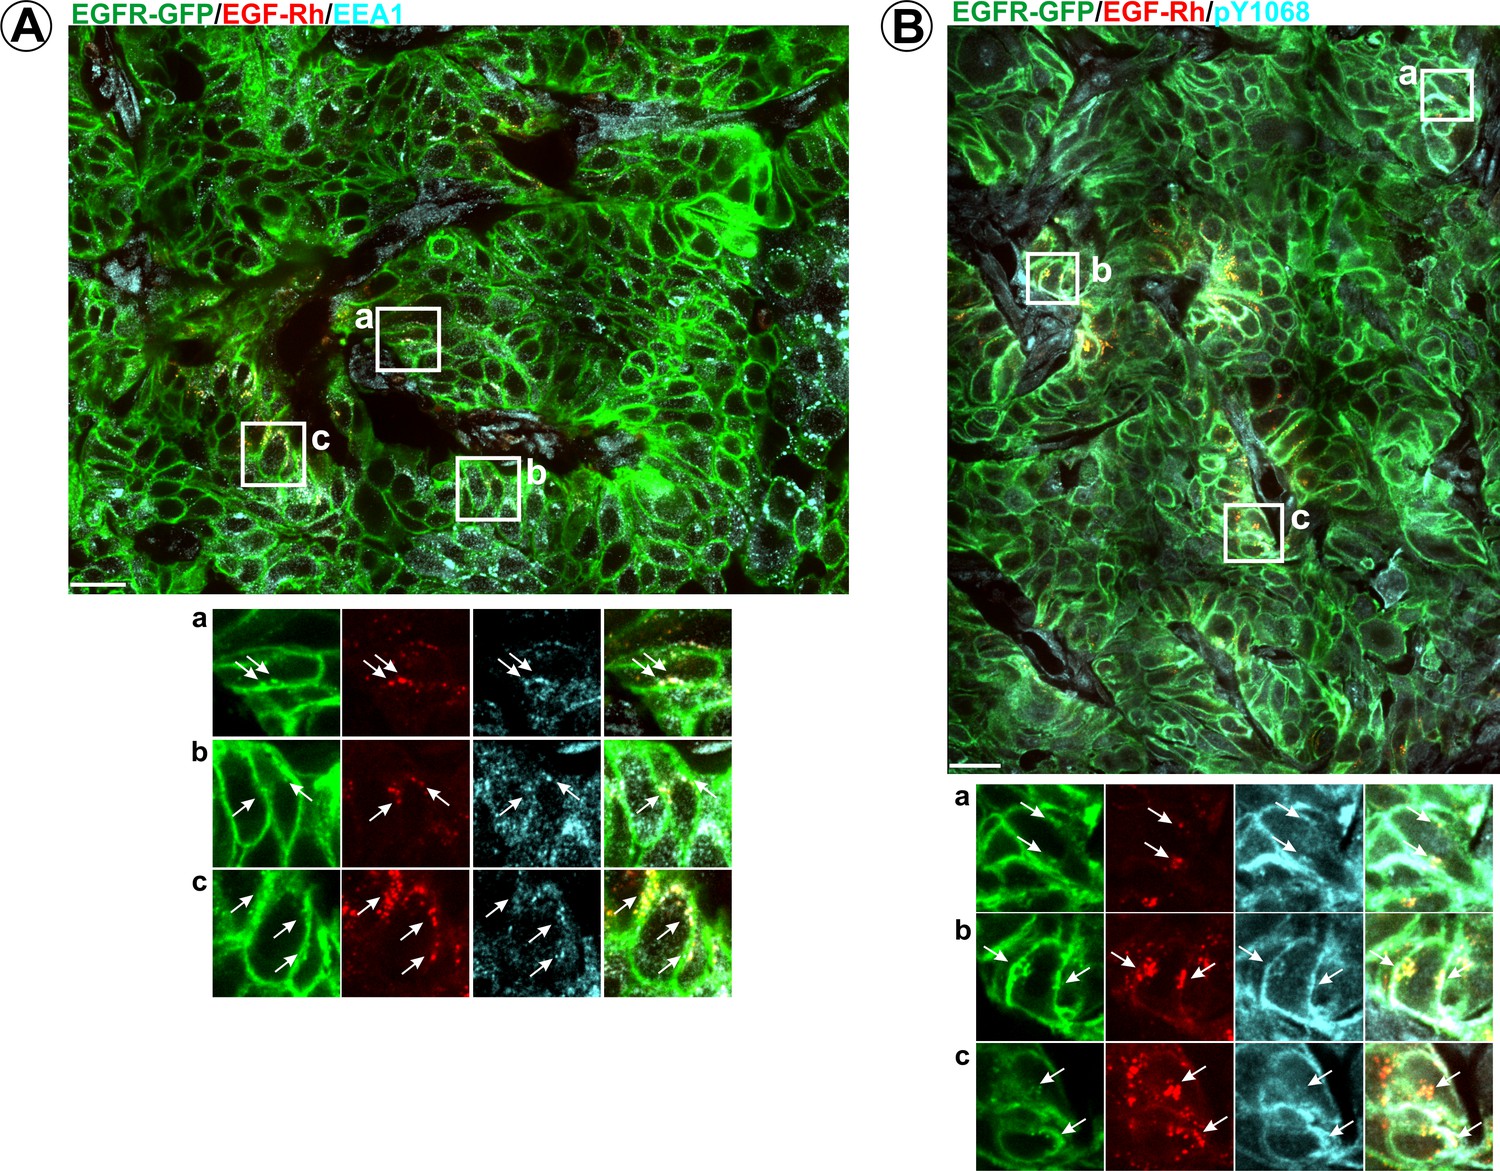
Immunofluorescence labeling of early endosomes and phosphorylated EGFR in HSC3/EGFR-GFP flank tumor xenografts.
HSC3/EGFR-GFP tumors were dissected and fixed. Cryosections were permeabilized with Triton X-100 and immunolabeled with EEA1 (A) or pY1068 antibodies (B). Nuclei were stained with Hoescht33342. Confocal images were acquired through 405 nm (Hoescht; blue), 488 nm (EGFR-GFP; green) and 640 nm (Cy5-conjugated secondary antibody; red) channels. Montage images of representative large areas of tumors are shown. Insets show high-magnification images of regions indicated by white rectangles. Long arrows indicate examples of vesicles containing EGFR-GFP co-localized with EEA.1 or pY1068 immunofluorescence. Short arrows point on examples of EEA.1 endosomes overlapping with the plasma membrane. Scale bars, 25 µm. Images demonstrating the specificity of EEA.1 and pY1068 labeling are presented in Figure 3—figure supplement 1.
Figure 3—figure supplement 1
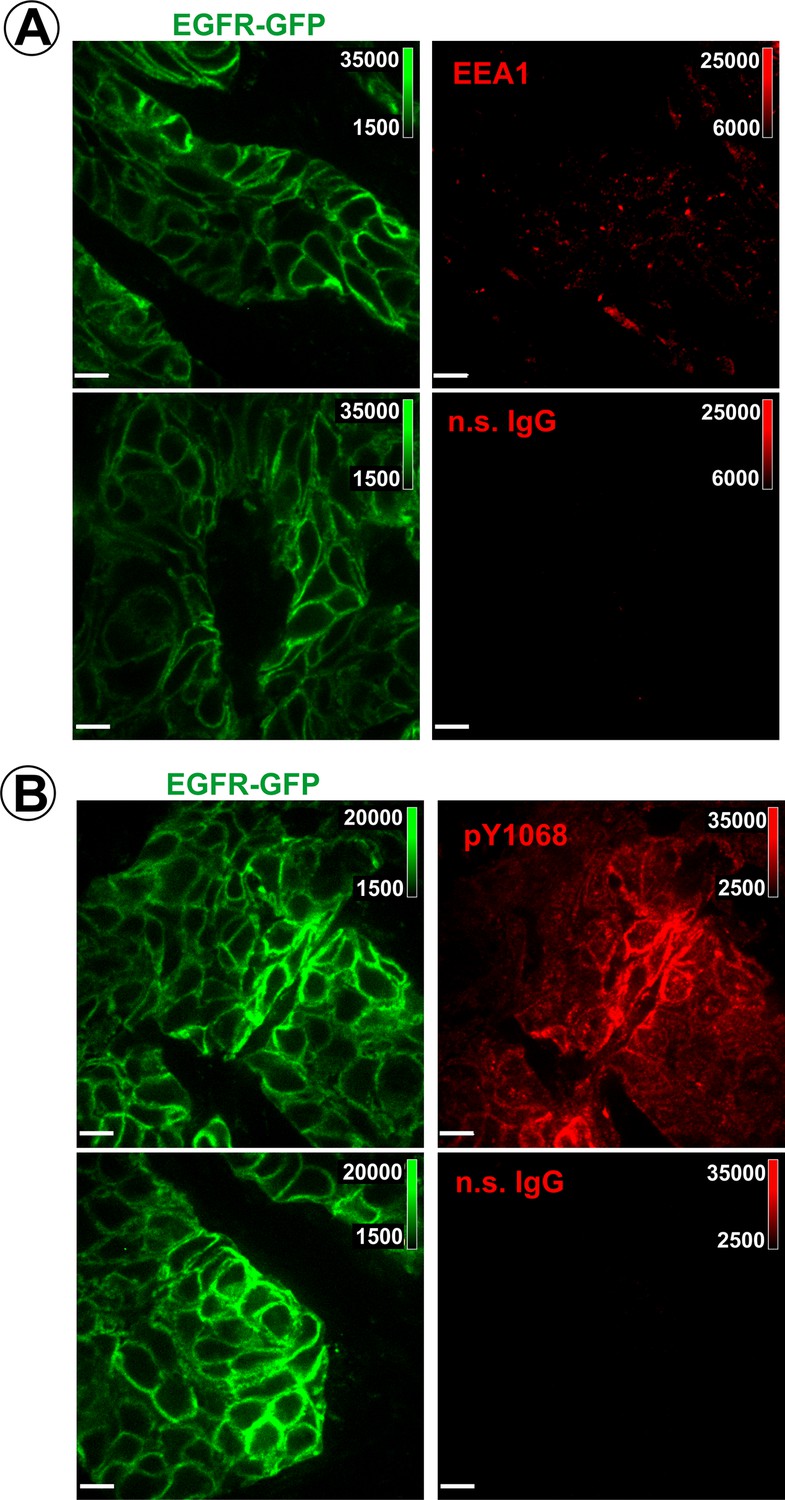
Controls for specificity of EEA.1 and pY1068 labeling.
Cryosections of HSC3/EGFR-GFP flank tumors were labeled with EEA.1 (A) or pY1068 antibodies (B), or with non-specific rabbit IgG used in the concentrations equal to the concentrations of specific primary antibodies. Secondary Cy5-conjugated antibodies were used at the same concentration in all samples. Confocal imaging was performed as in Figure 3. Scale bars, 25 µm.
Figure 4
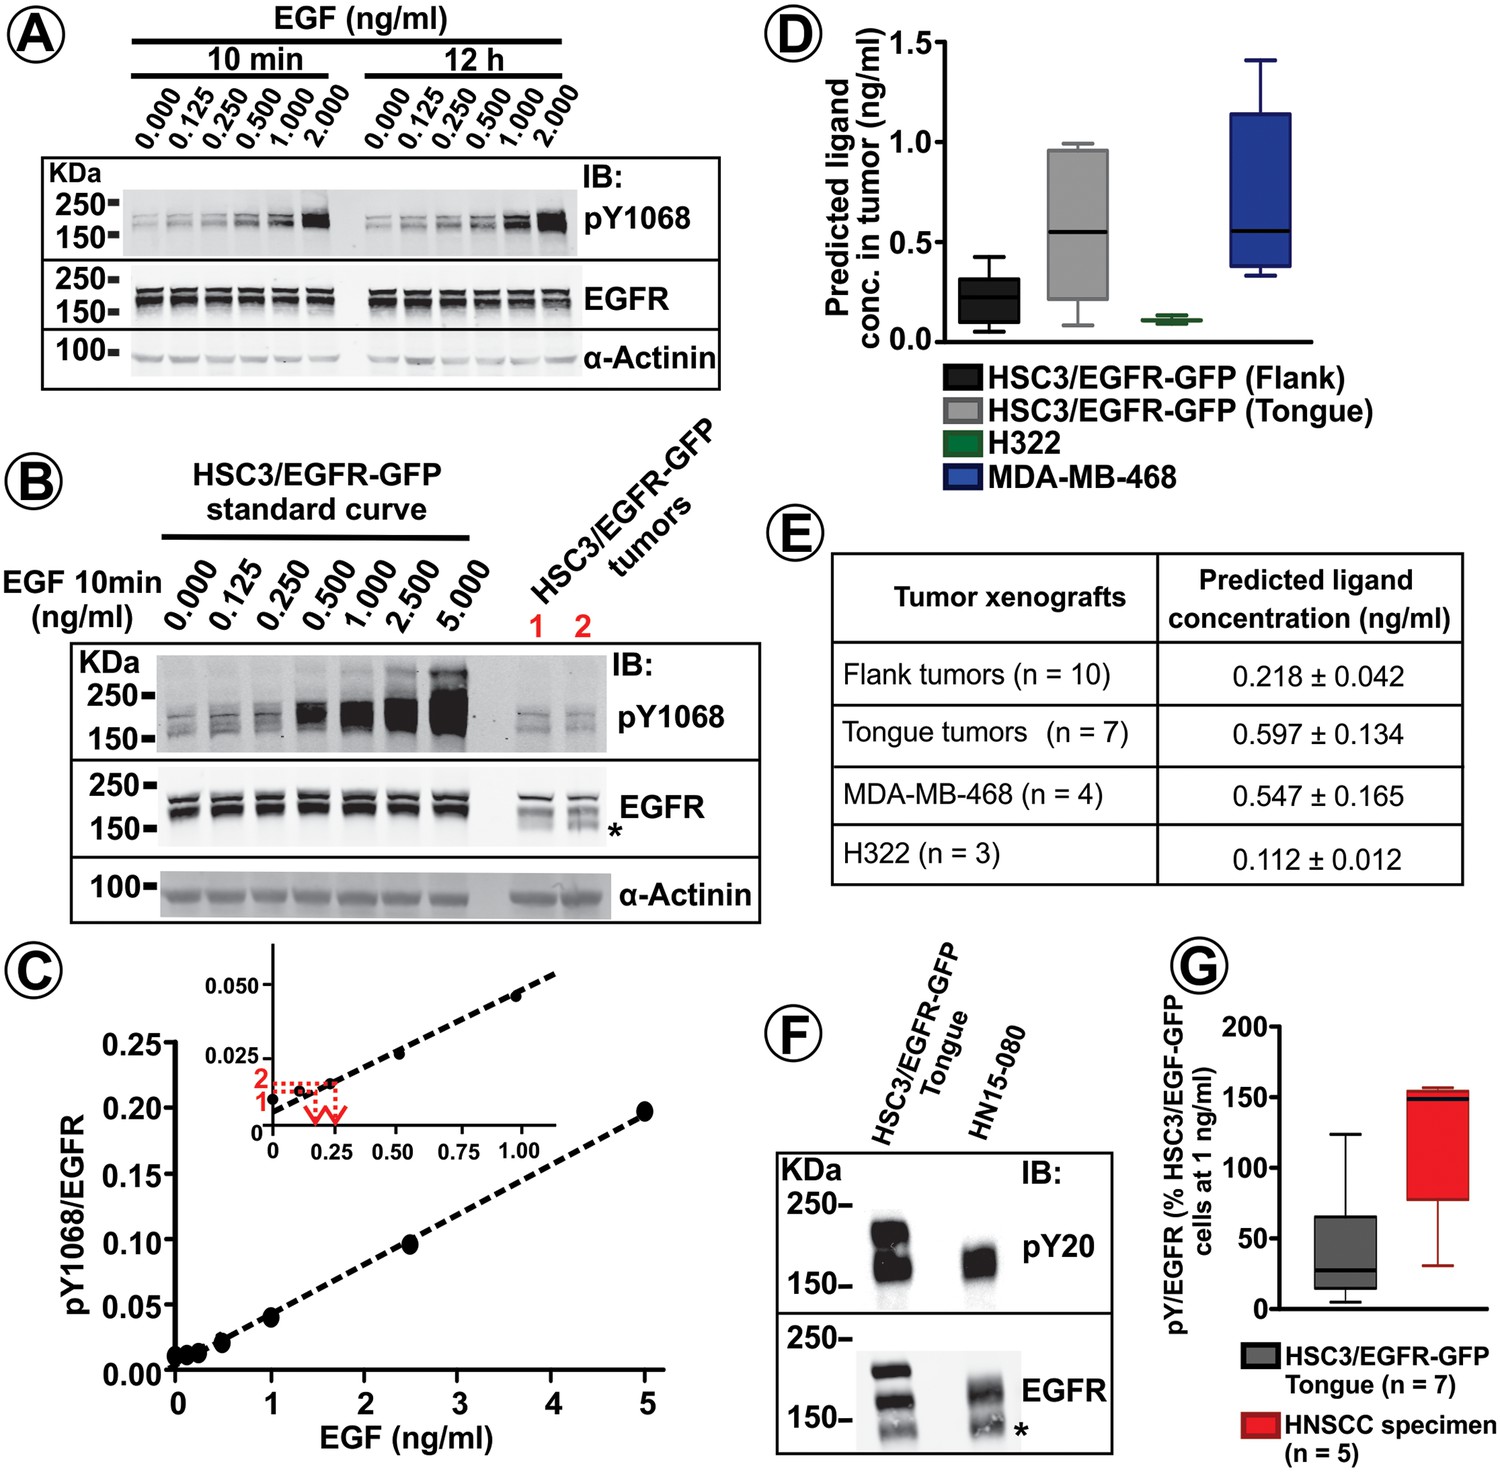
Quantification of EGFR phosphorylation and EGFR ligand concentrations in tumor xenografts and human HNSCC specimens.
(A) Serum-starved HSC3/EGFR-GFP cells were treated with 0–2 ng/ml EGF for 10 min or 12 hr at 37°C as described in ‘Materials and methods’. Lysates were probed with pY1068, EGFR and α-actinin (loading control) antibodies by Western blotting. Representative blot is shown. (B) Lysates of HSC3/EGFR-GFP cells treated with EGF (0–5 ng/ml) for 10 min at 37°C and two HSC3/EGFR-GFP flank tumors (#1 and #2; obtained as in Figure 1F) were probed with pY1068, EGFR and α-actinin (loading control) antibodies by western blotting. Representative blot is shown. (C) The values of in vitro pY1068/EGFR ratio measured in the experiment presented in (B) are plotted against EGF concentration. pY1068/EGFR ratios from tumors #1 and #2 were interpolated in the plot to estimate EGFR ligand concentrations in these two tumors (see red lines in the inset). (D and E) Summary of the quantifications of predicted EGFR ligand concentrations in HSC3/EGFR-GFP, H322 and MDA-MB-468 tumor xenografts from several independent series of experiments performed as described in (B–C). Boxplot in (D) shows medians, quartiles, and extreme values (n = 3–10). Mean values (±S.E.M.) are presented in (E). (F) EGFR was immunoprecipitated from the HSC3/EGFR-GFP tongue tumor and the HNSCC patient specimen. Immunoprecipitates were blotted with pY20 and EGFR antibodies. Asterisk indicates EGFR calpain proteolytic product (~145 kDa). (G) Quantification of pY20/EGFR ratios in tongue tumors and HNSCC patient specimens from several experiments exemplified in (F). Boxplot shows medians, quartiles, and extreme values (n = 4–5).
Figure 5
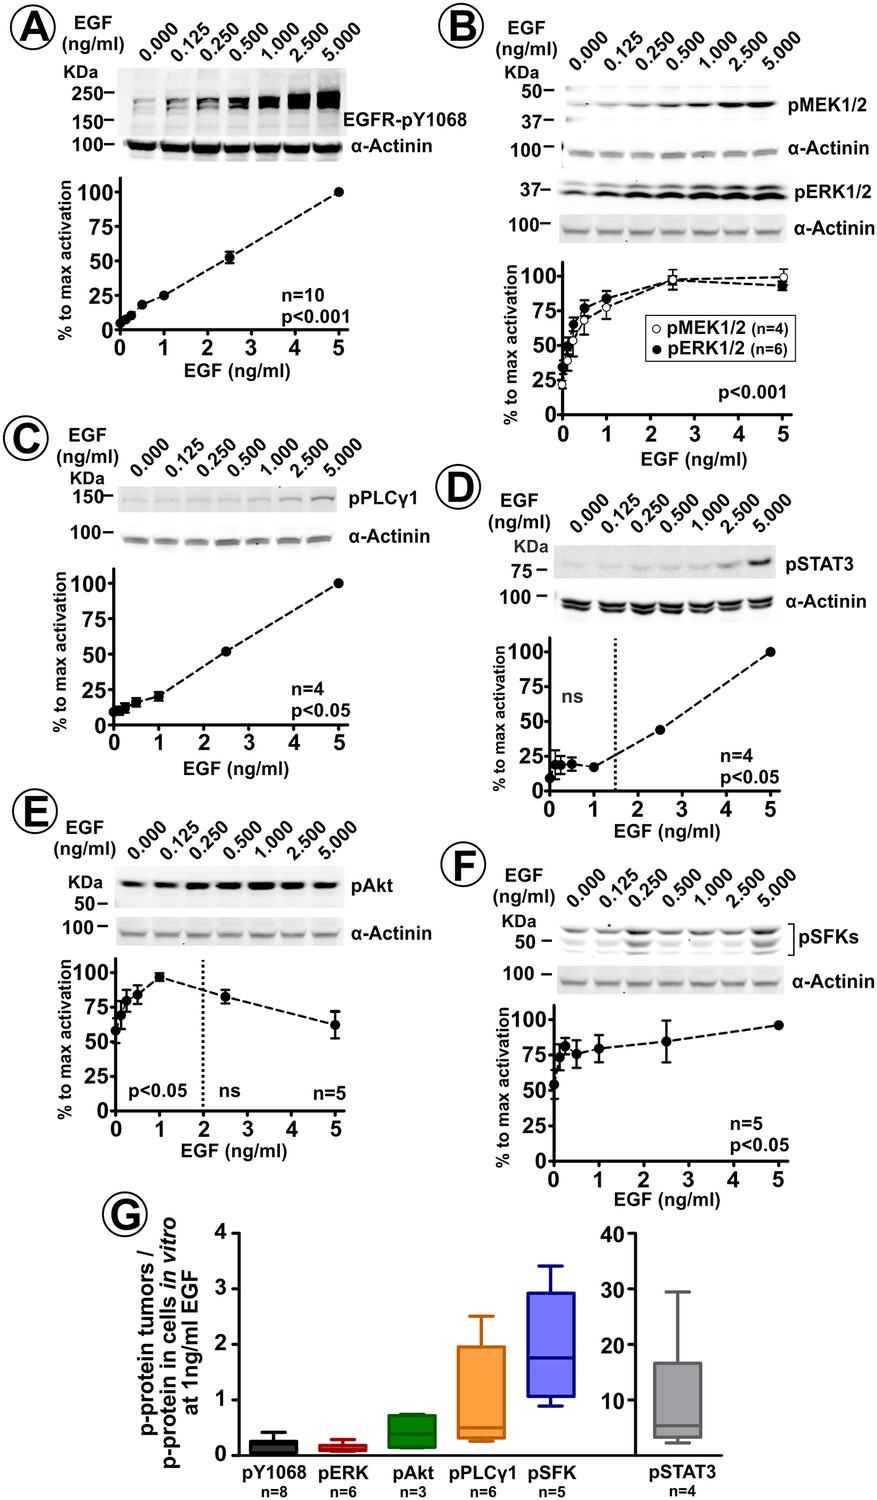
ERK1/2 pathway is the primary signaling cascade significantly activated by low ligand concentrations.
Serum-starved HSC3/EGFR-GFP cells were incubated with 0–5 ng/ml EGF for 10 min at 37°C. Lysates were probed with antibodies to phosphorylated proteins: EGFR pY1068 (A), MEK1/2 and ERK1/2 (B), PLCγ1 (C), STAT3 (D) AKT (E) and SFKs (F). Blotting for α-actinin is used as a loading control in each experiment. Representative western blots and quantifications of several independent experiments are shown. Paired T-test was performed (n = 4–10). p values indicate statistical significance relative to ‘no EGF’ cells. ns, p>0.05. (G) Lysates of HSC3/EGFR-GFP flank and tongue tumors, and lysates of these cells grown in vitro and treated with 0–5 ng/ml EGF for 10 min at 37°C (as in the experiment exemplified in Figure 4B) were blotted with phosphosite-specific antibodies as in (A–F). Phosphosite antibody signals (p-Protein) were normalized to the amounts of α-actinin (loading control). Normalized signals of each phosphosite antibody in tumor lysates (‘in vivo’) were divided by normalized signal intensities of the same antibody in lysates of cultured cells treated with 1 ng/ml EGF in vitro. Boxplot shows medians, quartiles, and extreme values of the resulting ‘in vivo/in vitro’ ratios of normalized signals (n = 2–8).
Figure 6 with 2 supplements
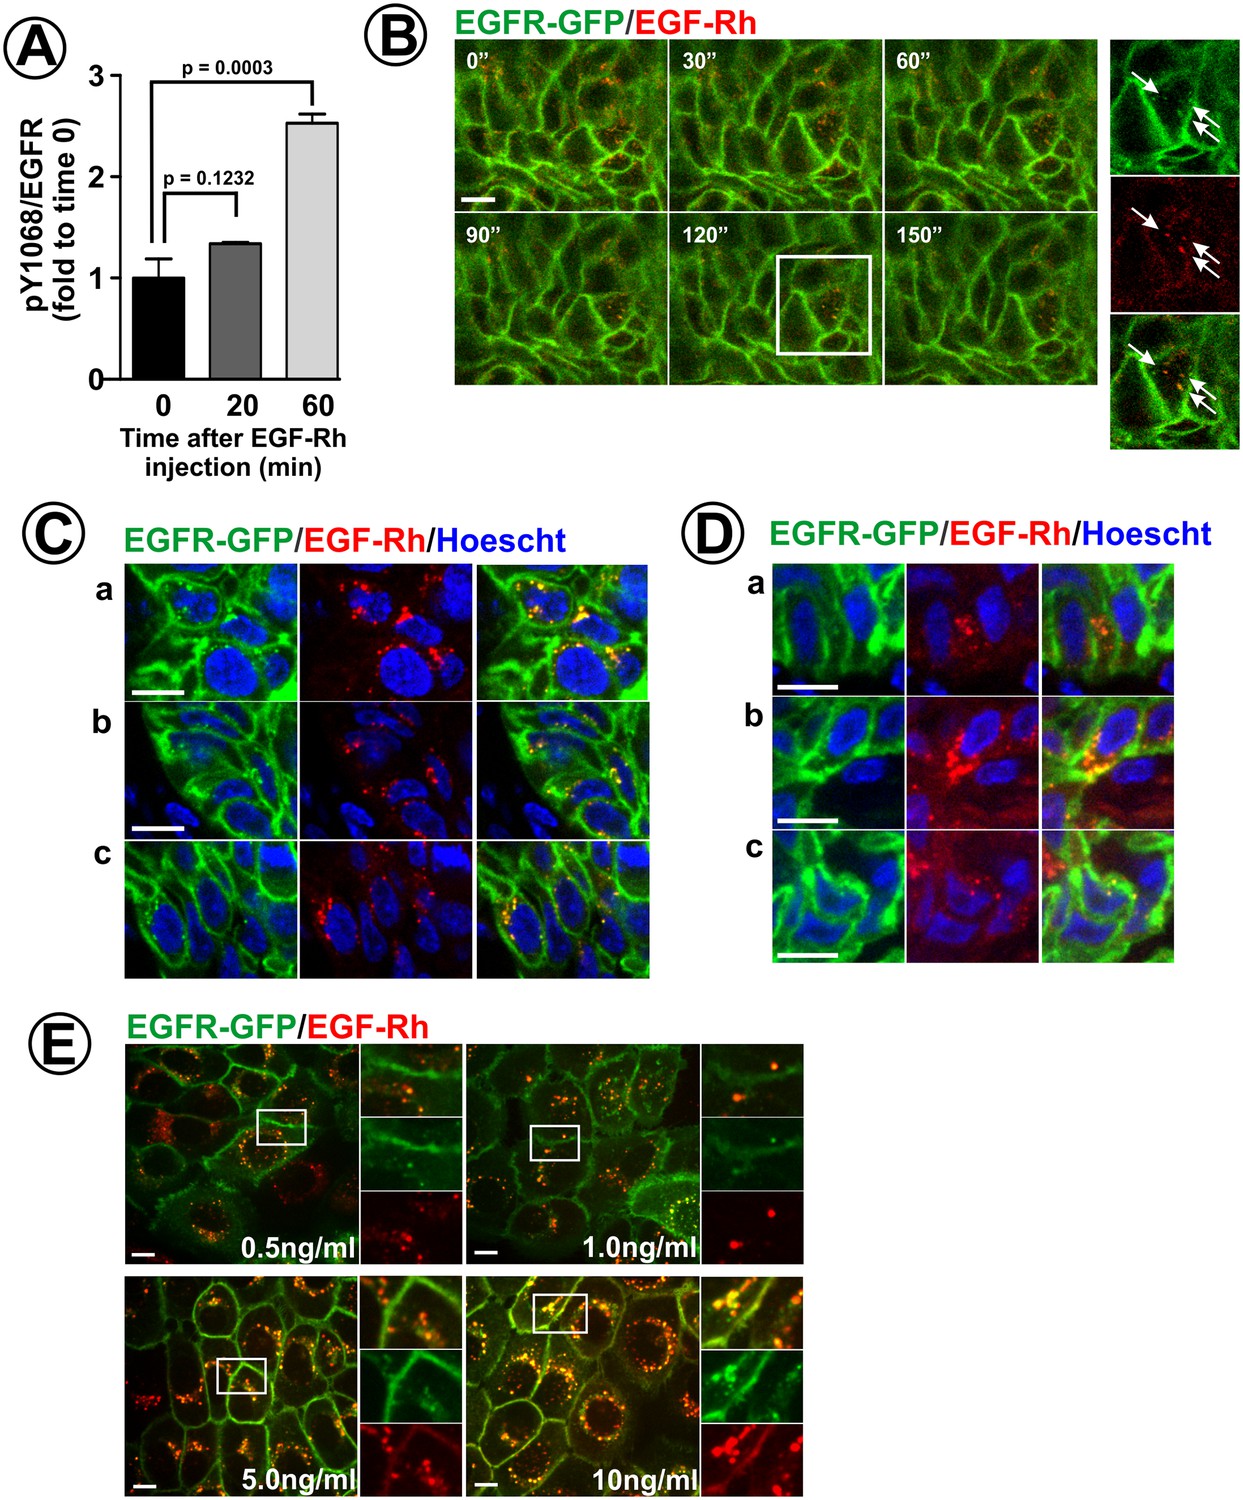
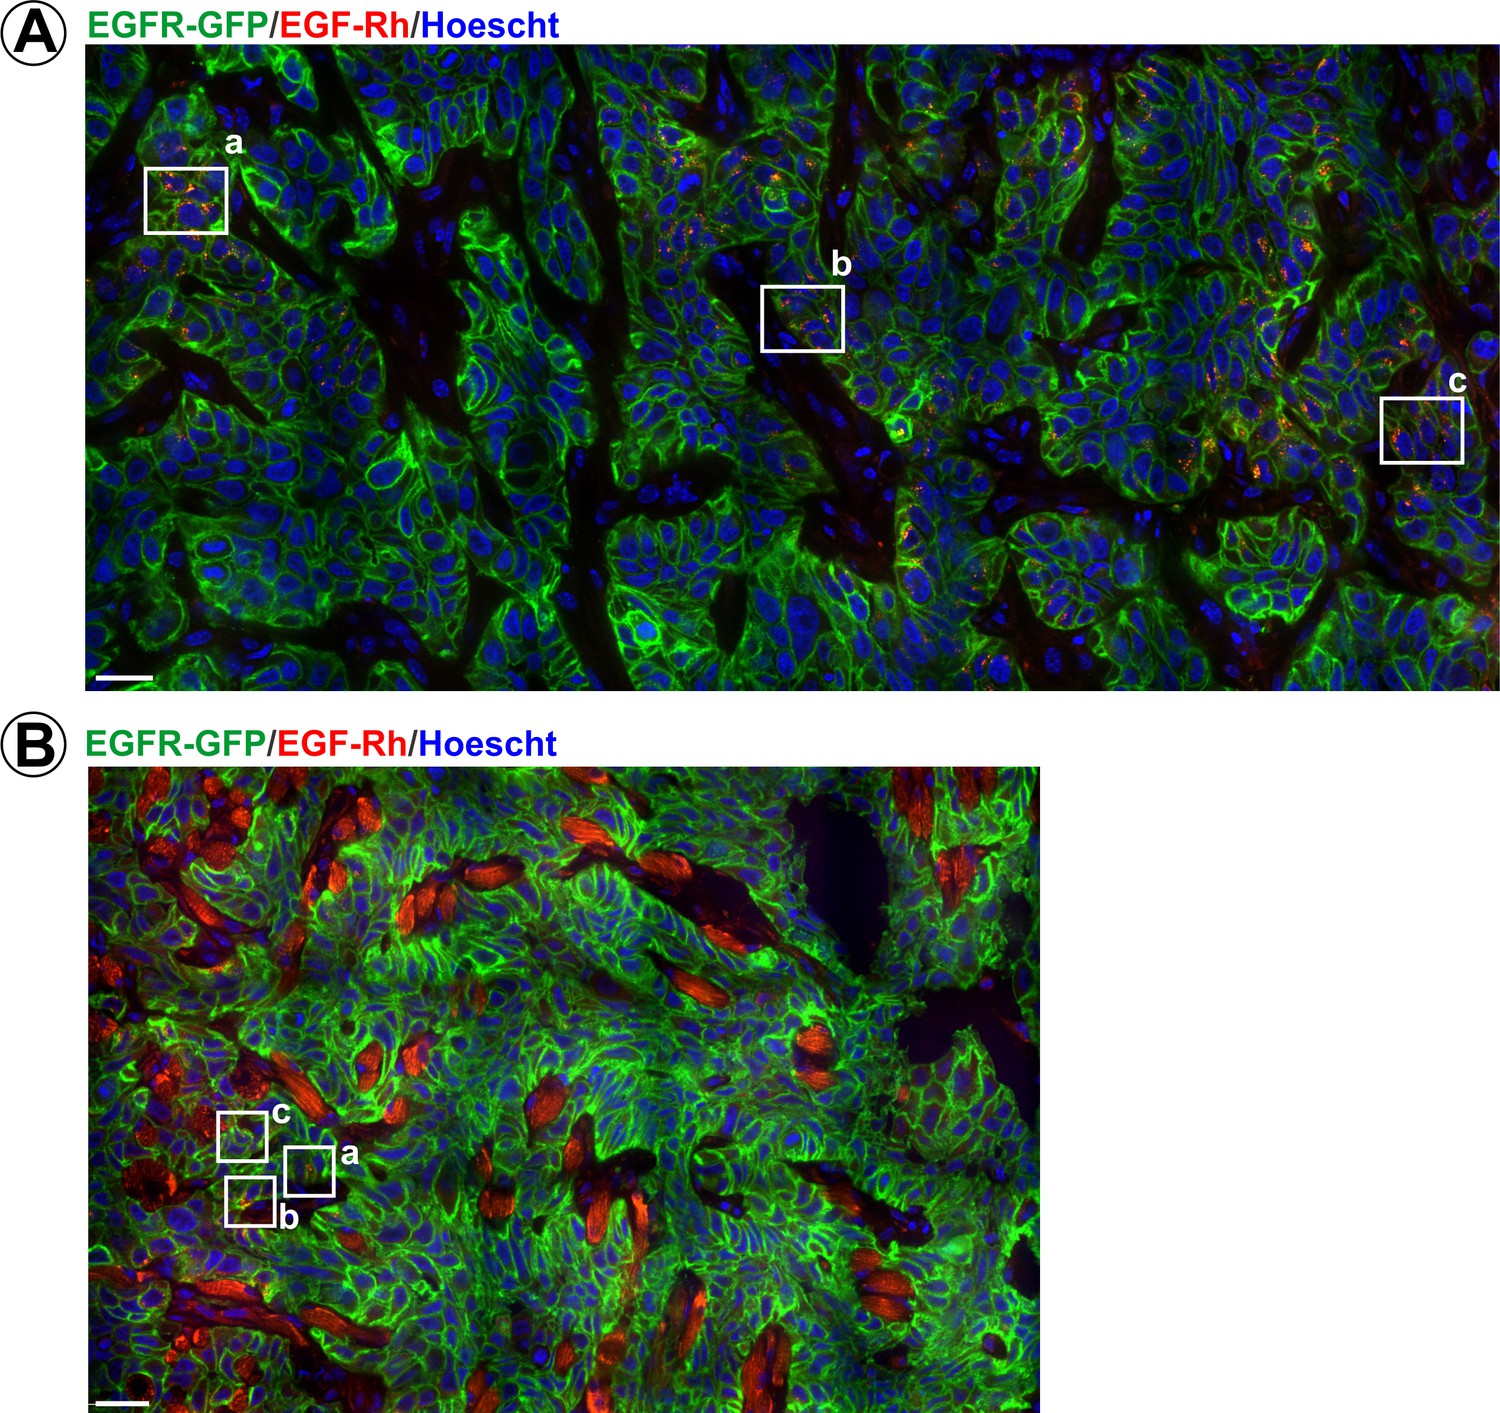
Endocytosis of EGF-Rh in flank and tongue tumors.
(A) Athymic nude mice harboring HSC3/EGFR-GFP xenografts were injected with EGF-Rh (100 μl, 50 ng/μl) in the tail vein. Tumors were dissected before and 20–60 min after injection, and tumor lysates were probed with pY1068 and EGFR antibodies as in Figure 4A–B. The mean values of pY1068/EGFR ratios (±S.E.M) are presented as fold increase to the ratio values before injection of EGF-Rh (time ‘0’). Unpaired T-test was performed (n = 4). p values < 0.05 are considered statistically significant. (B) Mice harboring HSC3/EGFR-GFP xenografts were injected with EGF-Rh as in (A). Time-lapse intravital imaging of GFP and rhodamine was performed as in Figure 2A. Merged images of selected time points are presented. Insets show high-magnification single-channel images of the region indicated by white rectangle to demonstrate an overlap of EGF-Rh and EGFR-GFP fluorescence in endosomes (arrows). Time ‘0’ corresponds to the start of time-lapse imaging. Scale bar, 10 µm. (C and D) Mice harboring flank (C) or tongue (D) HSC3/EGFR-GFP xenografts were injected with EGF-Rh as in (A), tumors were dissected 1 hr after injection and fixed in paraformaldehyde. Confocal imaging of cryosections was performed through 405 nm (Hoescht; blue), 488 nm (EGFR-GFP; green) and 561 nm (EGF-Rh; red) channels. Representative images are shown. Scale bars, 10 µm. Regions corresponding to these images are marked by white rectangles in the montage images of the large areas of tumors presented in Figure 6—figure supplement 1. (E) HSC3/EGFR-GFP cells grown in vitro were stimulated with EGF-Rh (0.5–10 ng/ml) for 15 min at 37°C, Confocal imaging was performed through 488 nm (EGFR-GFP; green) and 561 nm (EGF-Rh; red) channels. The image acquisition parameters were the same as in (C and D). Insets show high-magnification single-channel images of the regions indicated by white rectangles to demonstrate EGF-Rh remaining at the cell surface when used at 5–10 ng/ml but not at 0.5–1 ng/ml. Scale bars, 10 µm.
Figure 6—figure supplement 1
Endocytosis of EGF-Rh in flank and tongue tumors.
Mice harboring flank (A) or tongue (B) HSC3/EGFR-GFP xenografts were injected with EGF-Rh as in Figure 6. Tumors were dissected 1 hr after injection and fixed in paraformaldehyde. Confocal imaging of cryosections was performed through 405 nm (Hoescht; blue), 488 nm (EGFR-GFP; green) and 561 nm (EGF-Rh; red) channels. Representative montage images of the large areas of tumors are presented. Regions corresponding to images presented in Figure 6 are marked by white rectangles. Scale bars, 25 µm.
Figure 6—figure supplement 2
Immunofluorescence labeling of early endosomes and phosphorylated EGFR in HSC3/EGFR-GFP tumor flank xenografts in the presence of EGF-Rh.
Athymic nude mice harboring HSC3/EGFR-GFP xenografts were injected with EGF-Rh as in Figure 6. Tumors were dissected 1 hr after injection and fixed in paraformaldehyde. Cryosections were immunolabelled with EEA1 (A) or pY1068 (B) antibodies followed by secondary Cy5-conjugated antibodies. Confocal imaging was performed as in Figure 3. Montage images are shown. Scale bars, 25 µm. Insets show high-magnification images of regions indicated by white rectangles. Arrows point on co-localizations in vesicular compartments.
Figure 7
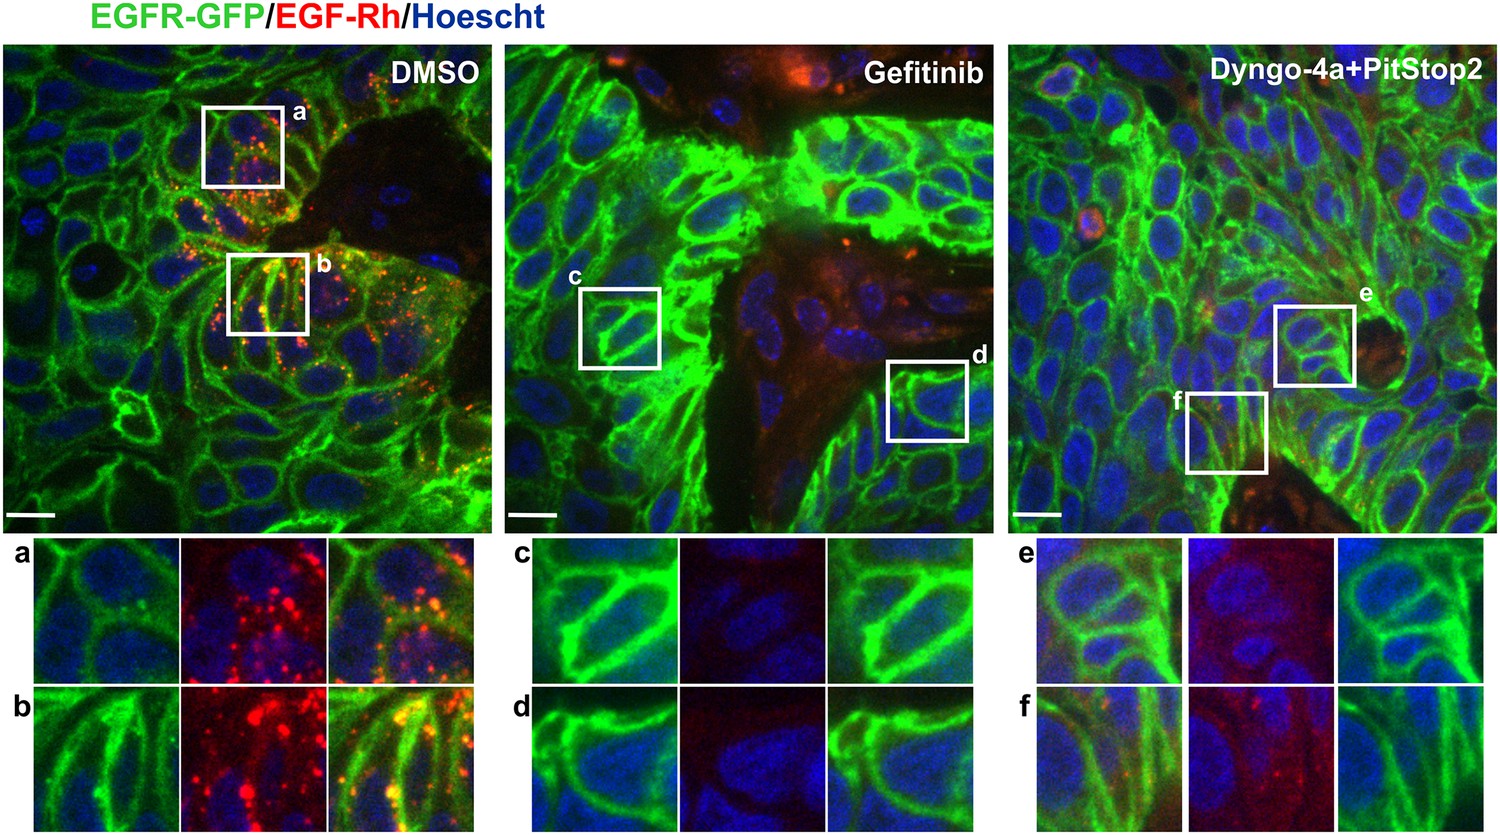
Effects of gefitinib and endocytosis inhibitors on EGF-Rh and EGFR-GFP internalization in tumors.
Mice harboring flank HSC3/EGFR-GFP xenografts were administered i.p. with DMSO, gefitinib (30 mg/kg) or Dyngo-4a plus Pitstop2 (1.125 mM/each in 400 μl saline-glucose). 2 hr after these injections, EGF-Rh was i.v. injected as in Figure 6. Tumors were dissected 1 hr after EGF-Rh injection and fixed in paraformaldehyde. Confocal imaging of cryosections was performed through 405 nm (Hoescht; blue), 488 nm (EGFR-GFP; green) and 561 nm (EGF-Rh; red) channels. Scale bars, 10 µm. Representative merged images are shown. Insets show high-magnification single-channel images of the regions indicated by white rectangles. Intensity scales are identical.
Figure 8 with 1 supplement
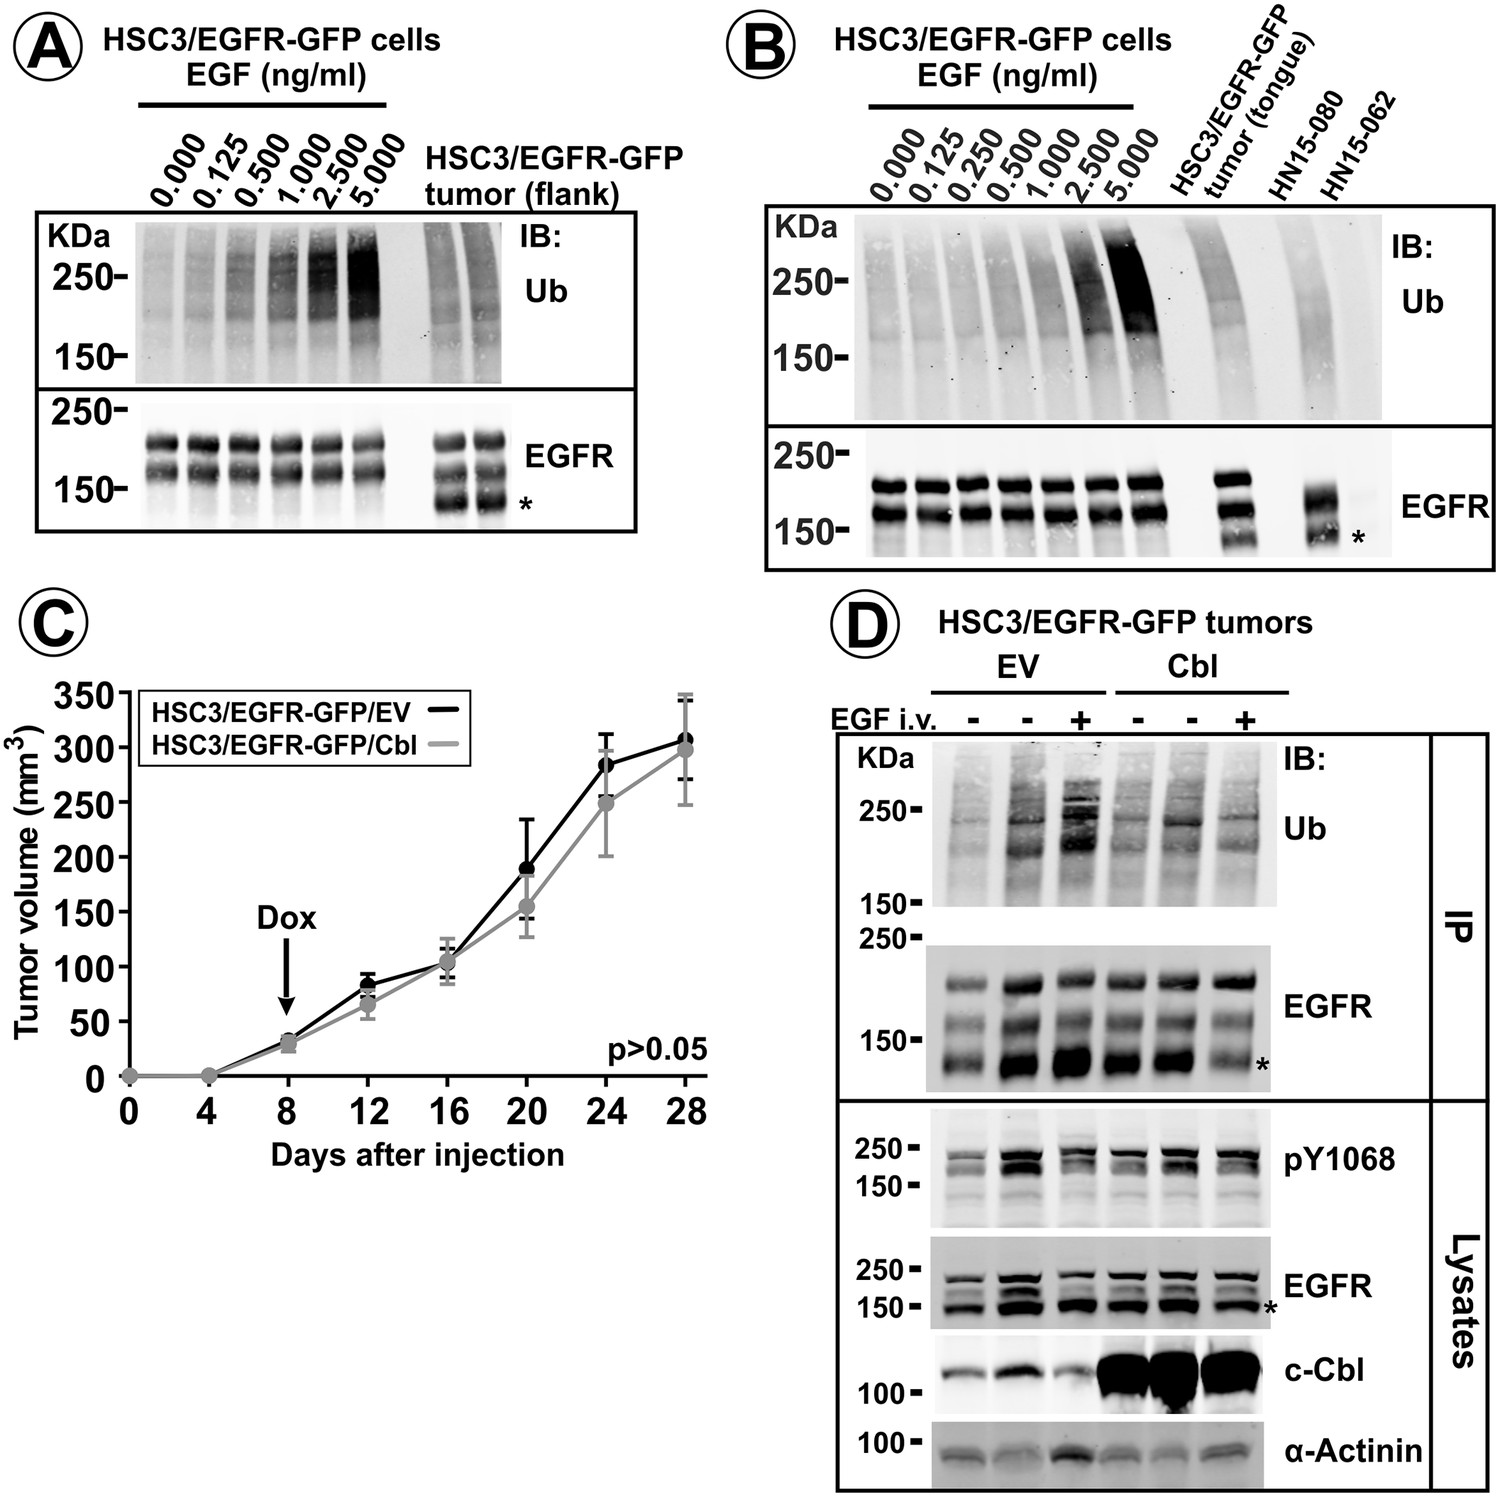
EGFR ubiquitylation in tumors in vivo, and the effects of Cbl overexpression.
EGFR/EGFR-GFP were immunoprecipitated from lysates of HSC3/EGFR-GFP cells grown in vitro and stimulated with 0–5 ng/ml EGF for 10 min (A–B), lysates of flank (A) and tongue (B) HSC3/EGFR-GFP tumors or lysates of human HNSCC specimens (B). Immunoprecipitates were analyzed by western blotting with ubiquitin and EGFR antibodies. Representative western blots are shown. Asterisk indicates EGFR calpain proteolytic product (~145 kDa). Tumor specimen HN15-062 expressing negligible amount of EGFR is shown as control for the specificity of the ubiquitylated EGFR signal. (C and D). Mice harboring HSC3/EGFR-GFP/Cbl and HSC3/EGFR-GFP/EV (control) flank tumors for 8 days were switched to drinking water containing 0.5 mg/ml Dox to induce c-Cbl overexpression. (C) Tumor growth was monitored as described in ‘Methods’. Averaged tumor volumes (±S.E.M; n = 9) are presented. Paired T-test was performed. (D) After 28 days of Dox administration, three tumors (one – 1 hr after EGF-Rh injection) were dissected and lysed. Aliquots of the lysates were probed with pY1068, EGFR, c-Cbl and α-actinin antibodies (loading control), or the rest of lysates was used for immunoprecipitation of EGFR and EGFR-GFP. Immunoprecipitates were probed with ubiquitin and EGFR antibodies.
Figure 8—figure supplement 1
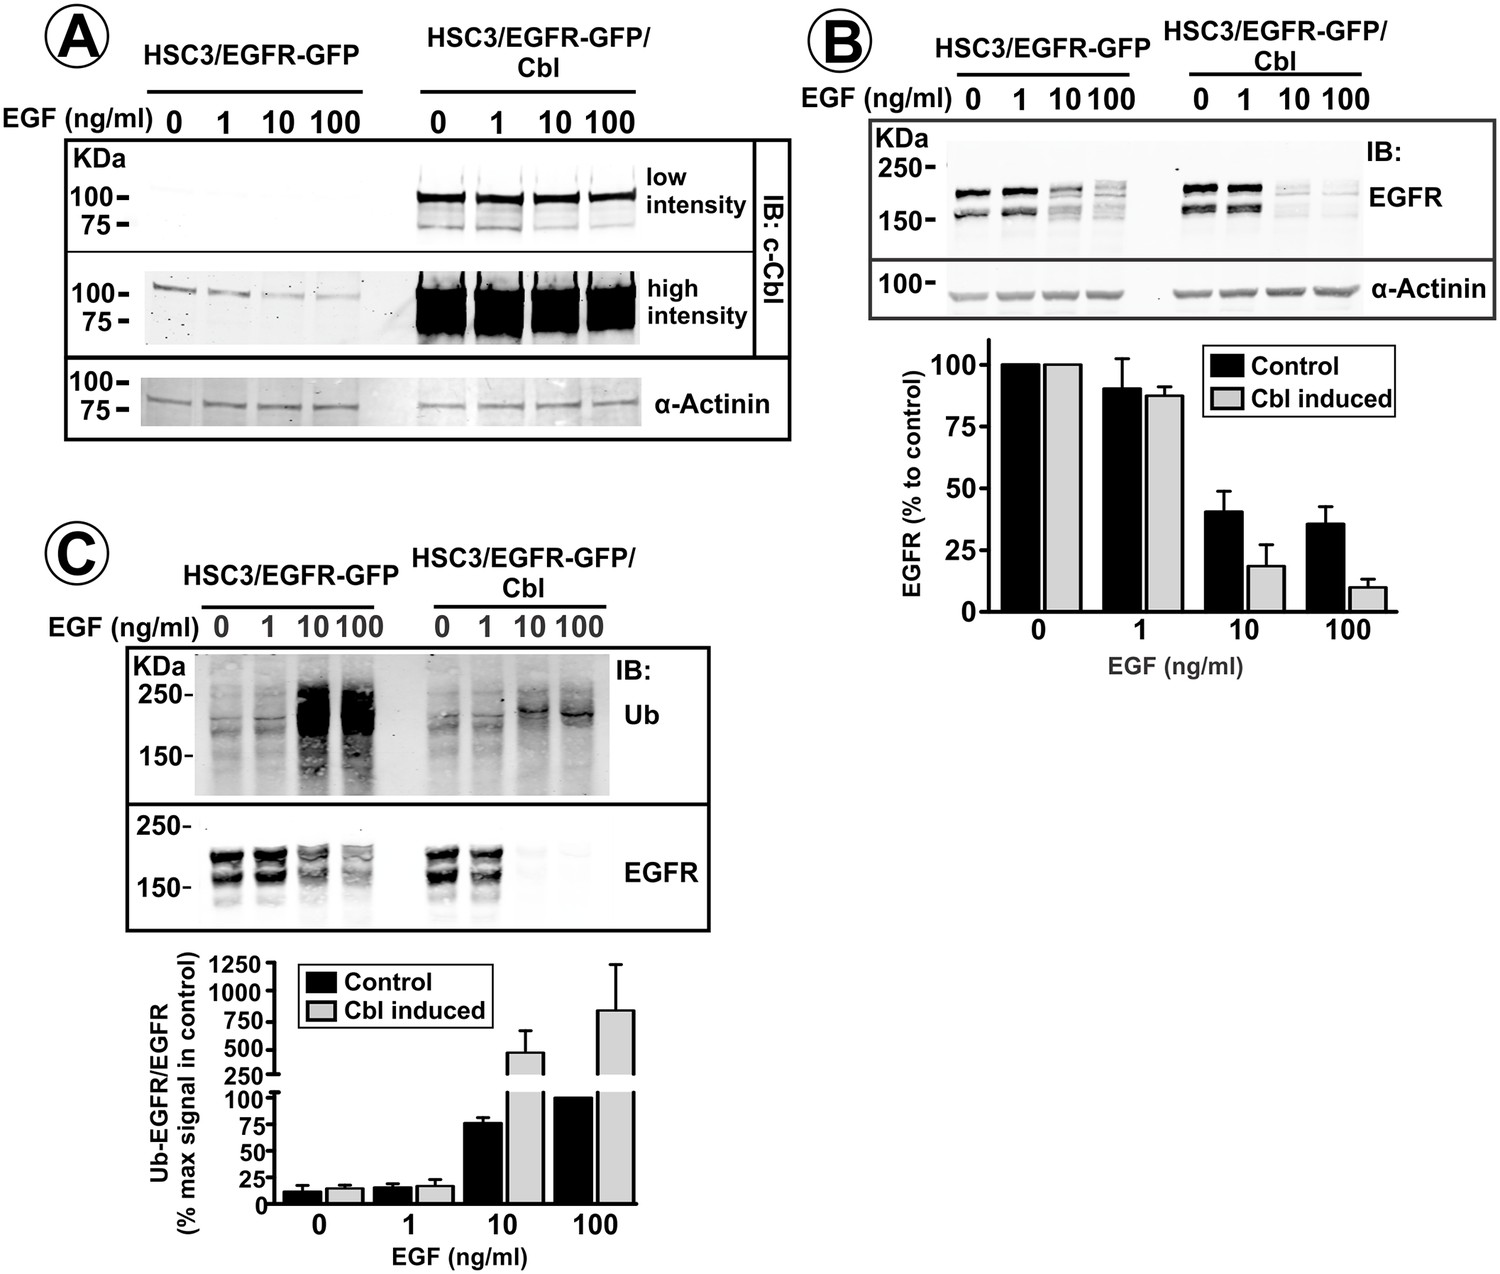
Effect of c-Cbl overexpression on EGFR levels and ubiquitylation in vitro.
HSC3/EGFR-GFP and HSC3/EGFR-GFP/Cbl cells grown in vitro were incubated with 0.5 mg/ml doxycycline for 36 hr, and then without EGF (control) or with 1–100 ng/ml EGF for 16 hr at 37°C. Cells were then lysed either in conventional TGH lysis buffer (A and C) or in TGH in which NEM and orthovanadate were omitted (B). (A) Cell lysates were either resolved by electrophoresis or used for EGFR immunoprecipitation. Lysates and immunoprecipitates were probed by western blotting with antibodies to EGFR, c-Cbl, ubiquitin and α-actinin (loading control). Bar graph in (B) represents mean amounts of the EGFR protein (±S.E.M; n = 3) calculated from several experiments exemplified on blots in (B) and presented as percent of this amount in control cells. Bar graph in (C) represents mean values (±S.E.M; n = 3) of ratios of the amount of ubiquitylated EGFR to total EGFR calculated in blotting experiments depicted in (C) and presented as percent of maximal value of their ratio in control (no Cbl overexpression) cells.
Additional files
-
Transparent reporting form
- https://doi.org/10.7554/eLife.31993.017
Download links
A two-part list of links to download the article, or parts of the article, in various formats.
Downloads (link to download the article as PDF)
Open citations (links to open the citations from this article in various online reference manager services)
Cite this article (links to download the citations from this article in formats compatible with various reference manager tools)
EGF receptor signaling, phosphorylation, ubiquitylation and endocytosis in tumors in vivo
eLife 6:e31993.
https://doi.org/10.7554/eLife.31993


