Tracing neuronal circuits in transgenic animals by transneuronal control of transcription (TRACT)
- California Institute of Technology, United States
- University of Extremadura, Spain
Figures
Figure 1
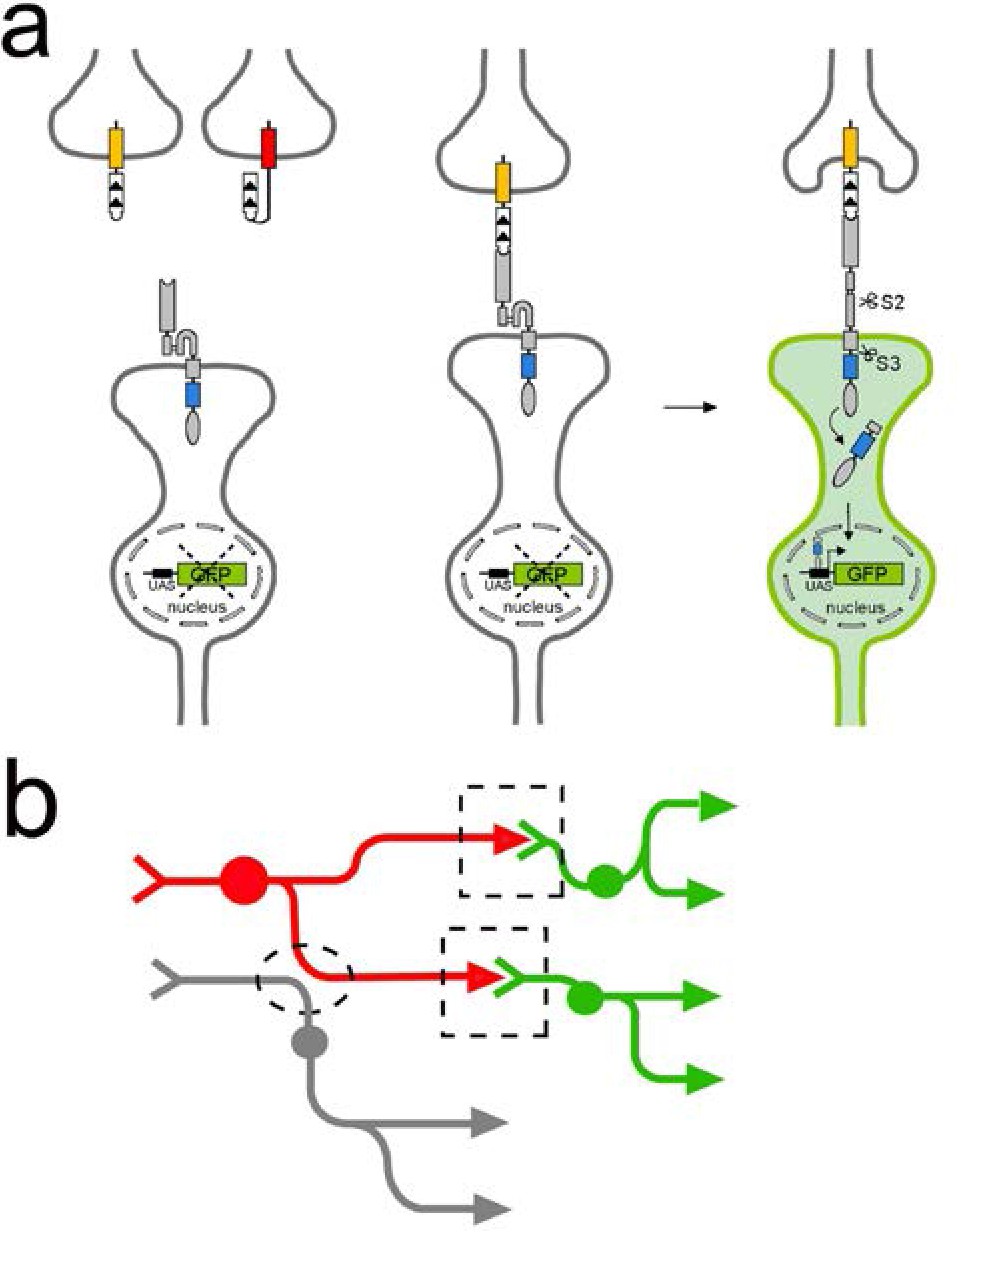
TRACT: Using ligand-induced intramembrane proteolysis to reveal circuits of neurons connected by synapses.
(a) Ligand-induced intramembrane proteolysis to monitor synaptic contacts between neurons. Sequence of events upon ligand-receptor interaction are depicted from left to right. The ligand domain, (CD19, white domain with the arrowheads indicating the orientation of protein sequence from N- to C-terminal) is localized to the presynaptic plasma membrane in the ‘donor’ neuron of interest (top) by fusing it to domains from two different presynaptic proteins, Sdc (yellow rectangle) or nSyb (red rectangle). The receptor (grey and blue rectangles, and grey oval) is targeted to synaptic sites by introducing the intracellular domain (blue rectangle) of neuroligin (NLGN) between the transmembrane domain of Notch and the transcription factor Gal4 (gray oval). When the ligand binds to the receptor on a synaptic partner neuron (bottom), it partially unfolds the notch regulatory region (NRR) to allow for cleavage of the receptor in the S2 site by endogenous metalloproteases. S2 cleavage shortens the receptor, and induces a second cleavage (S3) by intramembrane proteolysis (mediated by ɣ-secretase) that liberates the transcription factor (gray oval) that is part of the intracellular domain of the receptor. This transcription factor then translocates to the nucleus to activate transcription of reporter genes such as GFP. (b) Using TRACT to detect synaptic connections between neurons. For anterograde tracing, the ligand is localized on the presynaptic neurons of interest (‘donor’ neuron labeled in red). The receptor is expressed in all potential synaptic partners (‘receiver’ neurons labeled in green and gray). GFP expression will be activated (green) only in the receiver neurons that make synaptic contacts (indicated by stippled boxes) with the donor neurons (red). In contrast, GFP expression should not be activated in neurons (gray) that are in close proximity to donor neurons but do not make synapses (stippled oval).
Figure 2 with 7 supplements
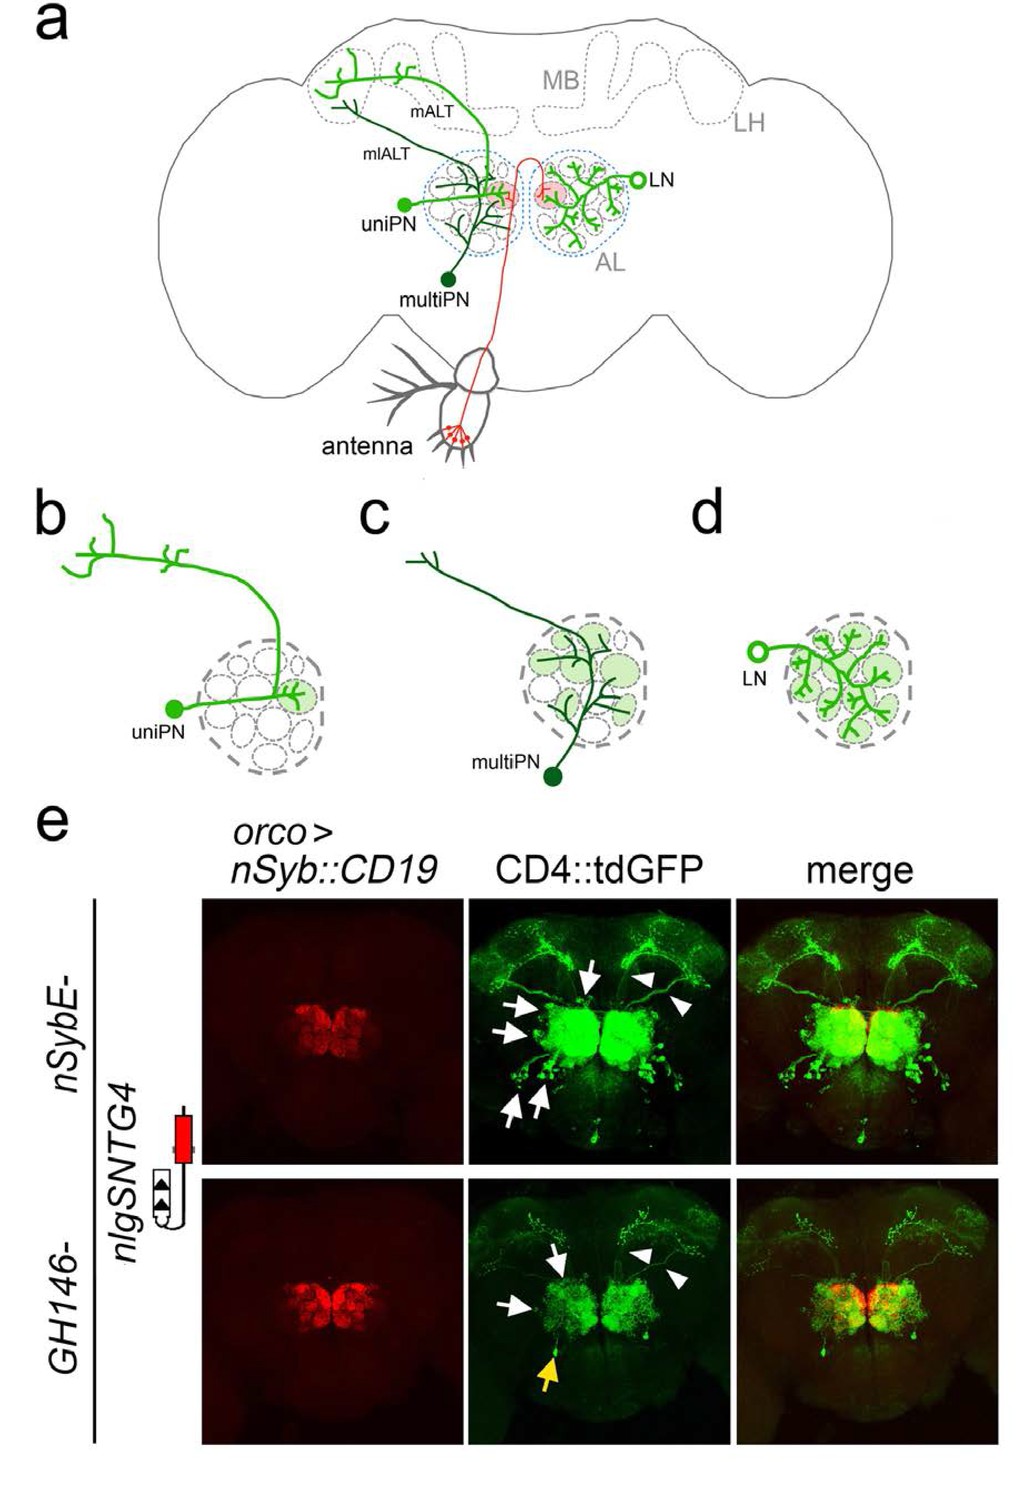
Connections between olfactory receptor neurons and antennal lobe neurons revealed by TRACT.
(a) Olfactory receptor neurons (ORNs) labeled in red, have their cell bodies located into two peripheral sensory organs, antennae (illustrated here) and maxillary palps, and have axons that project into the antennal lobe (AL) in the brain. All axons from ORNs expressing the same olfactory receptor converge in two glomeruli (one in each hemisphere) within the AL (red circles). There are two main types of neurons (green) in the antennal lobe, projection neurons (PNs) and local neurons (LNs). PNs have dendrites that branch in glomeruli and axons that project towards the mushroom body (MB) and/or the lateral horn (LH). (b, c) There are two types of PNs, uniglomerular PNs (uniPNs) and multiglomerular PNs (multiPNs). (b) The dendrites of uniPNs branch in a single glomerulus, and their axons project into the MB and LH via the medial antennal lobe tract (mALT). (c) The dendrites of multiPNS branch into multiple glomeruli, and their axons project into the LH via the mediolateral ALT (mlALT). (d) LNs are axonless neurons and their dendrites branch into many (or most) of the glomeruli. (e) Detection of synaptic contacts between olfactory receptor neurons and antennal lobe neurons in the adult Drosophila antennal lobe with the nlgSNTG4 receptor driven by nSybE enhancer (top panels) and GH146 enhancer (bottom panels). Induction of GFP expression in neurons (arrows) surrounding the antennal lobe when the ligand (nSyb::CD19) was driven by the orco driver in ORNs. Arrowheads indicate the axons of PNs in mALT and mlALT. Left: nSyb::CD19+ axons from ORNs (red); middle: GFP+ neurons in the antennal lobe (green); right: merged images of nSyb::CD19 and GFP. In the brains with the nlgSNTG4 receptor driven by the nSybE enhancer (top panels) GFP expression was induced in different neuronal types, including uniPNs, LNs and and several multiPNs at the ventral part. In the brain with the nlgSNTG4 receptor driven by the PN-specific driver GH146 (bottom panels), only PNs were GFP+. Most of these cells are uniPNs, but there was also one GFP+ multiPN in each antennal lobe (yellow arrow). Maximum projection of z-stack confocal images. Scale bar = 50 µm. See Supplementary file 2 for additional information.
Figure 2—figure supplement 1
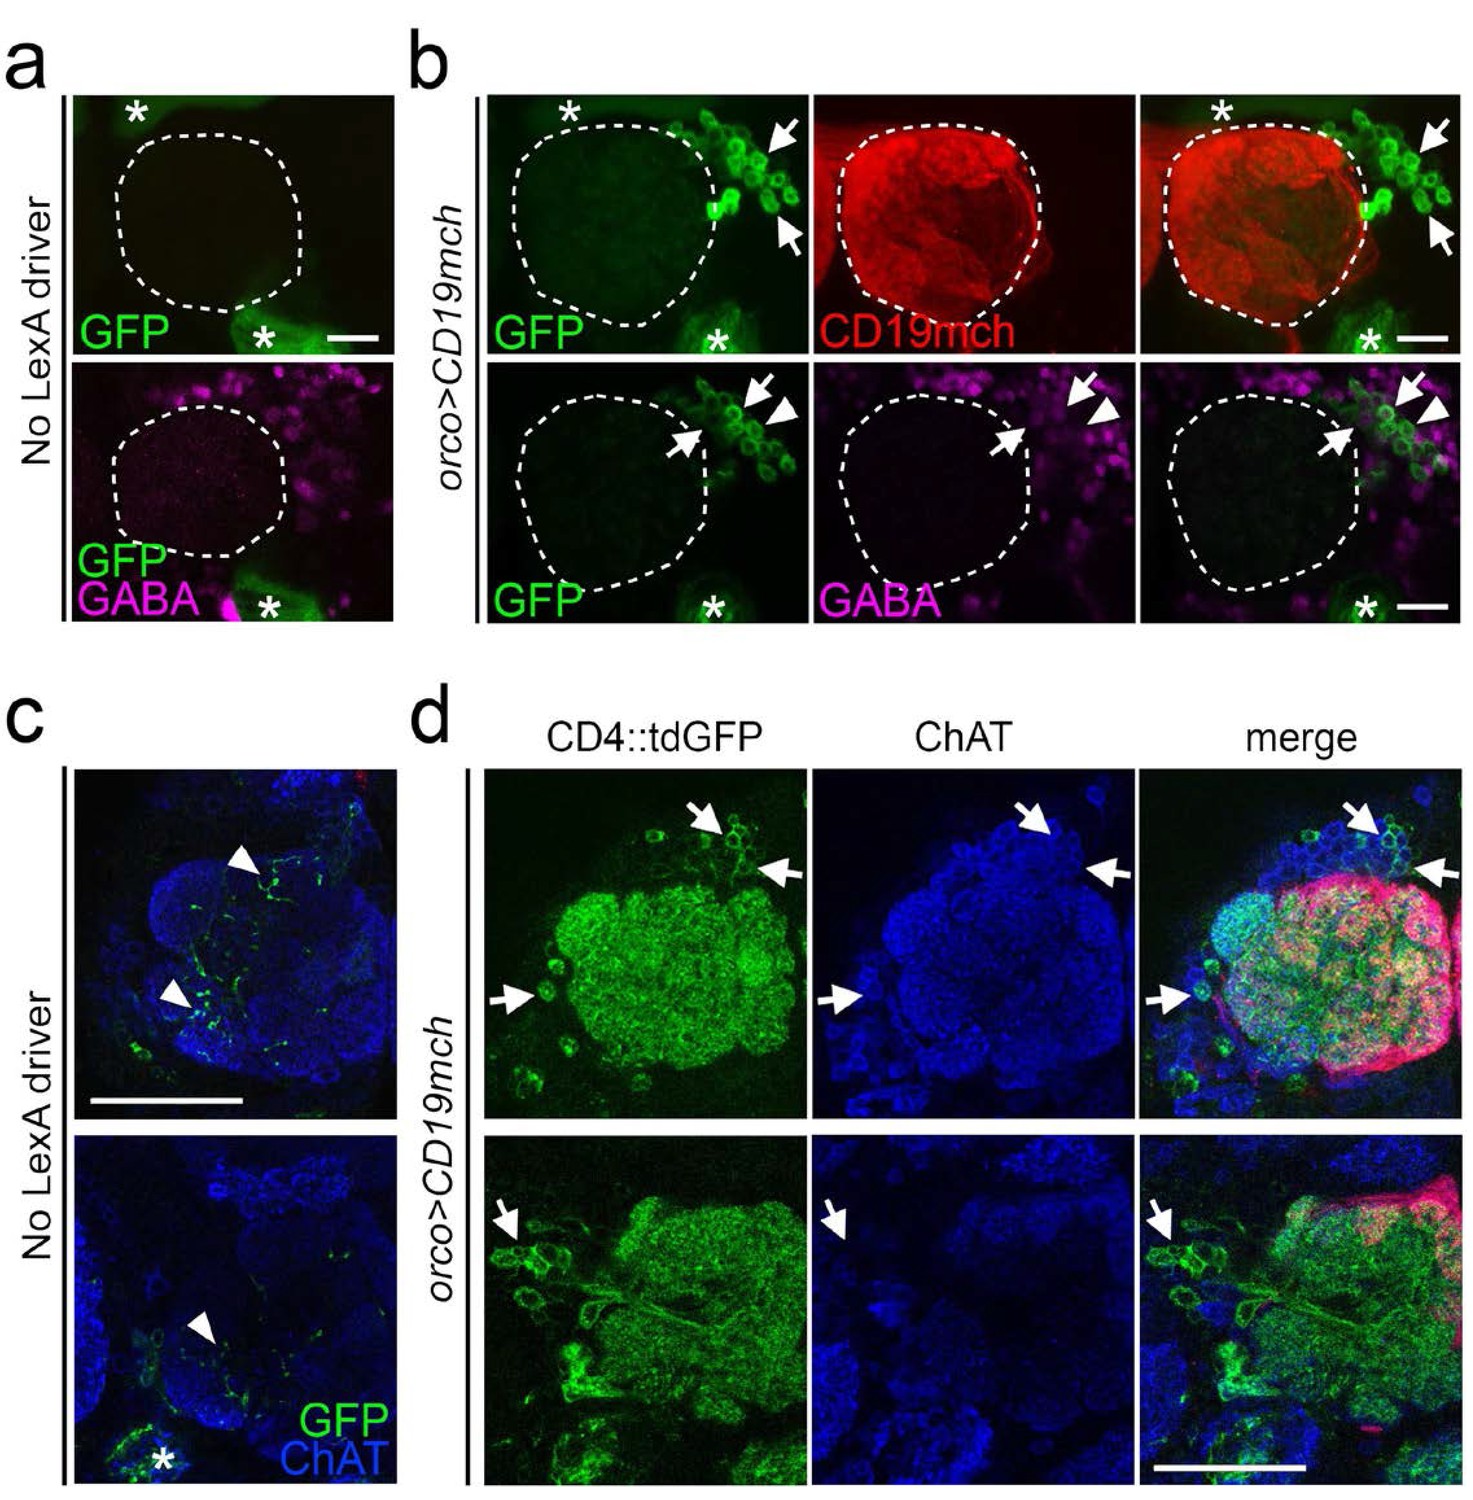
TRACT reveals antennal lobe neurons that have cell-cell contacts with olfactory receptor neurons.
(a) and (b) Detection of neuron-neuron contacts in the adult Drosophila antennal lobe (stippled circle) with nlgSNTG4 driven by elav promoter. Top panels show maximum projection of z-stack confocal images; the bottom panels show single optical sections from the z-stack on the top panels. (a) Control samples without orco-lexA driver (carrying elav-nlgSNTG4, 5xUAS-CD4::tdGFP and LexAop-CD19mch) show no induction in antennal lobe neurons. The stars mark the ligand-independent background in the mushroom body (top left) and axons from Johnson’s organ neurons (bottom right). (b) Top panels show induction of CD8:GFP expression in neurons (arrows) surrounding the antennal lobe (stippled circle) when the ligand (CD19mch) was driven by the orco driver in ORNs. Left: CD8:GFP+ neurons; middle: CD19mch+ axons from ORNs; right: merged images of CD19mch (red), CD8:GFP (green). Bottom panels show a single optical section from the stack on top with GABA immunostaining (magenta), confirming that some of the GFP+ neurons (green) induced by CD19mch+ ORNs are GABAergic LNs (arrows). The arrowheads indicate the GFP+, GABA- neurons. left: distribution of GFP+ neurons; middle: GABA immunostaining; right: merged images of GABA (magenta), GFP (green). Scale bar = 20 μm. (c, d) Detection of neuron-neuron contacts in the adult Drosophila antennal lobe with nlgSNTG4 driven by nSyb promoter. (c) Control brains without orco-lexA driver (carrying nSyb-nlgSNTG4, 5xUAS-CD4::tdGFP and LexAop-CD19mch) had low levels of background GFP expression inside of the antennal lobe (arrowheads) and in the antennal mechanosensory and motor center (star in the bottom panel). (d) When CD19mch was driven by the orco-lexA driver in ORNs, it triggered induction of GFP expression in neurons whose dendrites branched throughout the whole antennal lobe. Left: GFP+ cell bodies and neurites from the antennal lobe neurons; middle: ChAT immunostaining (blue); right: merged images of CD19mch (red), CD4::tdGFP (green), and CD19mch+ axons from ORNs (red). The images of two single optical section (top and bottom panels) at different depths show ChAT immunostaining (blue), indicating that some of the GFP+ neurons (green) induced by CD19mch+ ORNs are cholinergic PNs (arrows in the top panels). Bottom panels, some of the GFP+ neurons (green) are non-cholinergic cells, suggesting that they are LNs (arrows in the bottom panels). Scale bar = 50 µm.
Figure 2—figure supplement 2
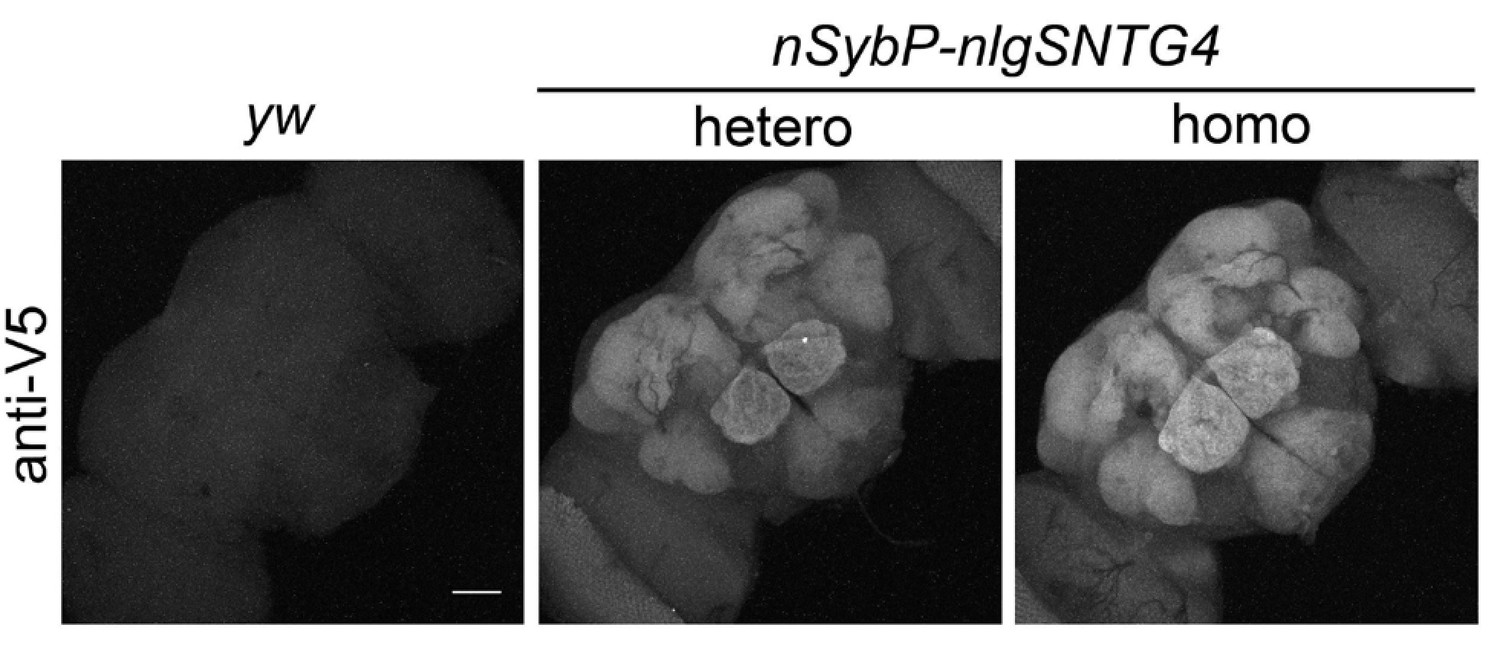
Expression of the nlgSNTG4 receptor under the SybE enhancer.
The receptor nlgSNTG4 was tagged with the V5 epitope in its C terminus. Immunostaining with an anti-V5 antibody shows that the nlgSNTG4 receptor is highly expressed in the central brain, in regions such as antennal lobe and subesophageal ganglion, but its expression was much weaker in the optic lobe (bottom left and top right corners). The expression level of the receptor protein in the homozygote SybE-nlgSNTG4 (right) is higher than in the heterozygote (middle). Notice that the expression of the receptor is enriched in the neuropil regions. Scale bar = 50 µm.
Figure 2—figure supplement 3
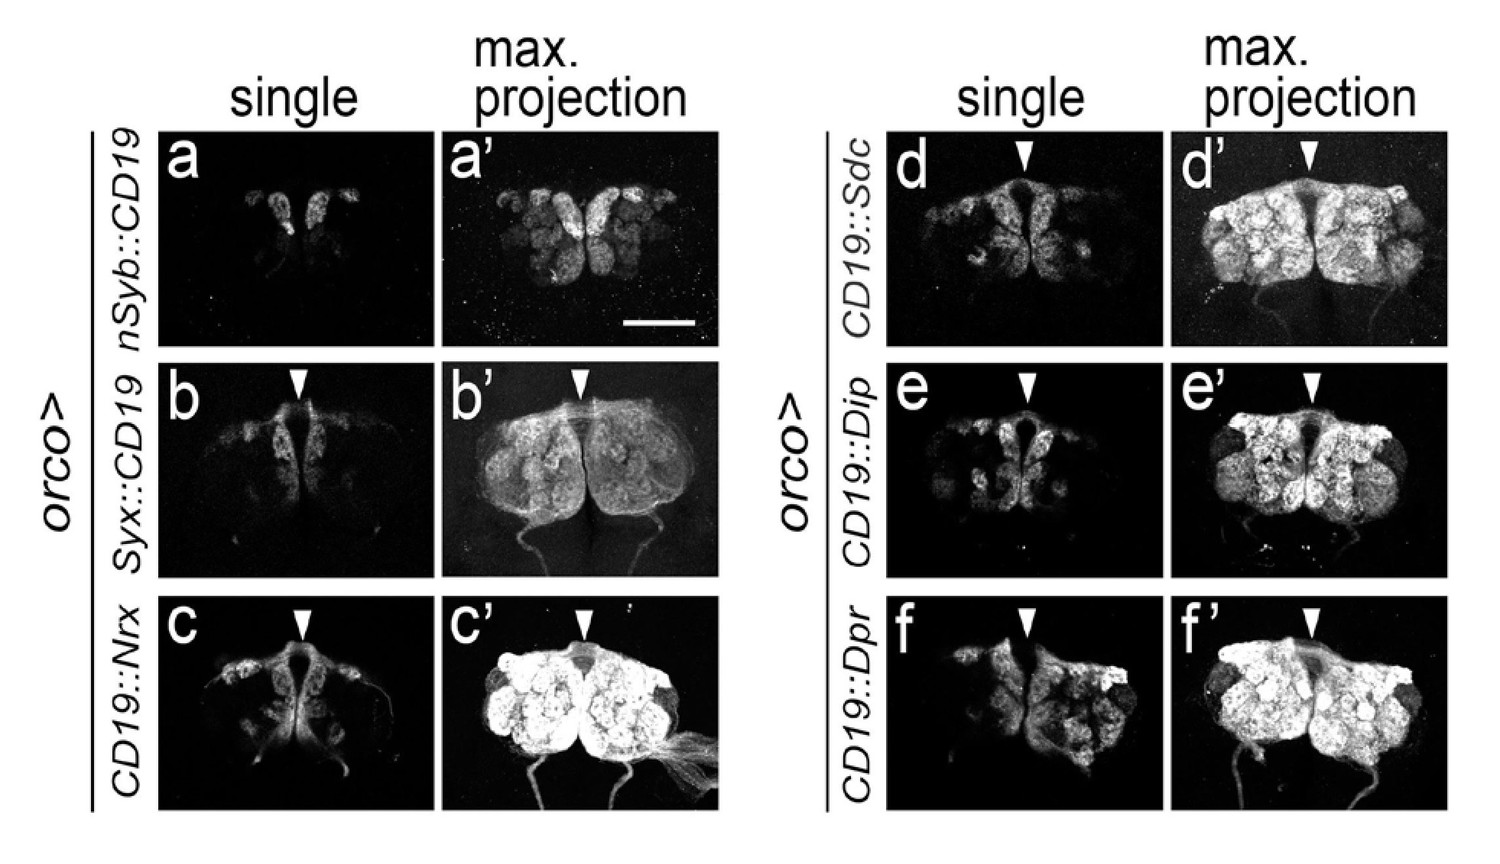
Expression of CD19 fused with different presynaptic proteins in ORNs.
The ligand, CD19, was fused with domains from the following pre-synaptic markers: nSyb (a), syx (b), Nrx1 (c), Sdc (d), Dip (e) and Dpr (f). The distribution of the different ligands expressed in ORN axons driven by the orco driver is shown in single optic sections (a–f) or maximum projections (a’–f’). nSyb::CD19 (a and a’) was selectively accumulated at the presynaptic terminals and could not be detected along axons, thus allowing for the visualization of individual glomeruli. The other ligands (syx (b), Nrx1 (c), Sdc (d), Dip (e) and Dpr (f)) are homogeneously distributed throughout the surface of the axons, including axon shafts, thus allowing to detect the ligand on the antennal commissure (arrowheads in b-f and b’-f’). Scale bar = 50 μm.
Figure 2—figure supplement 4
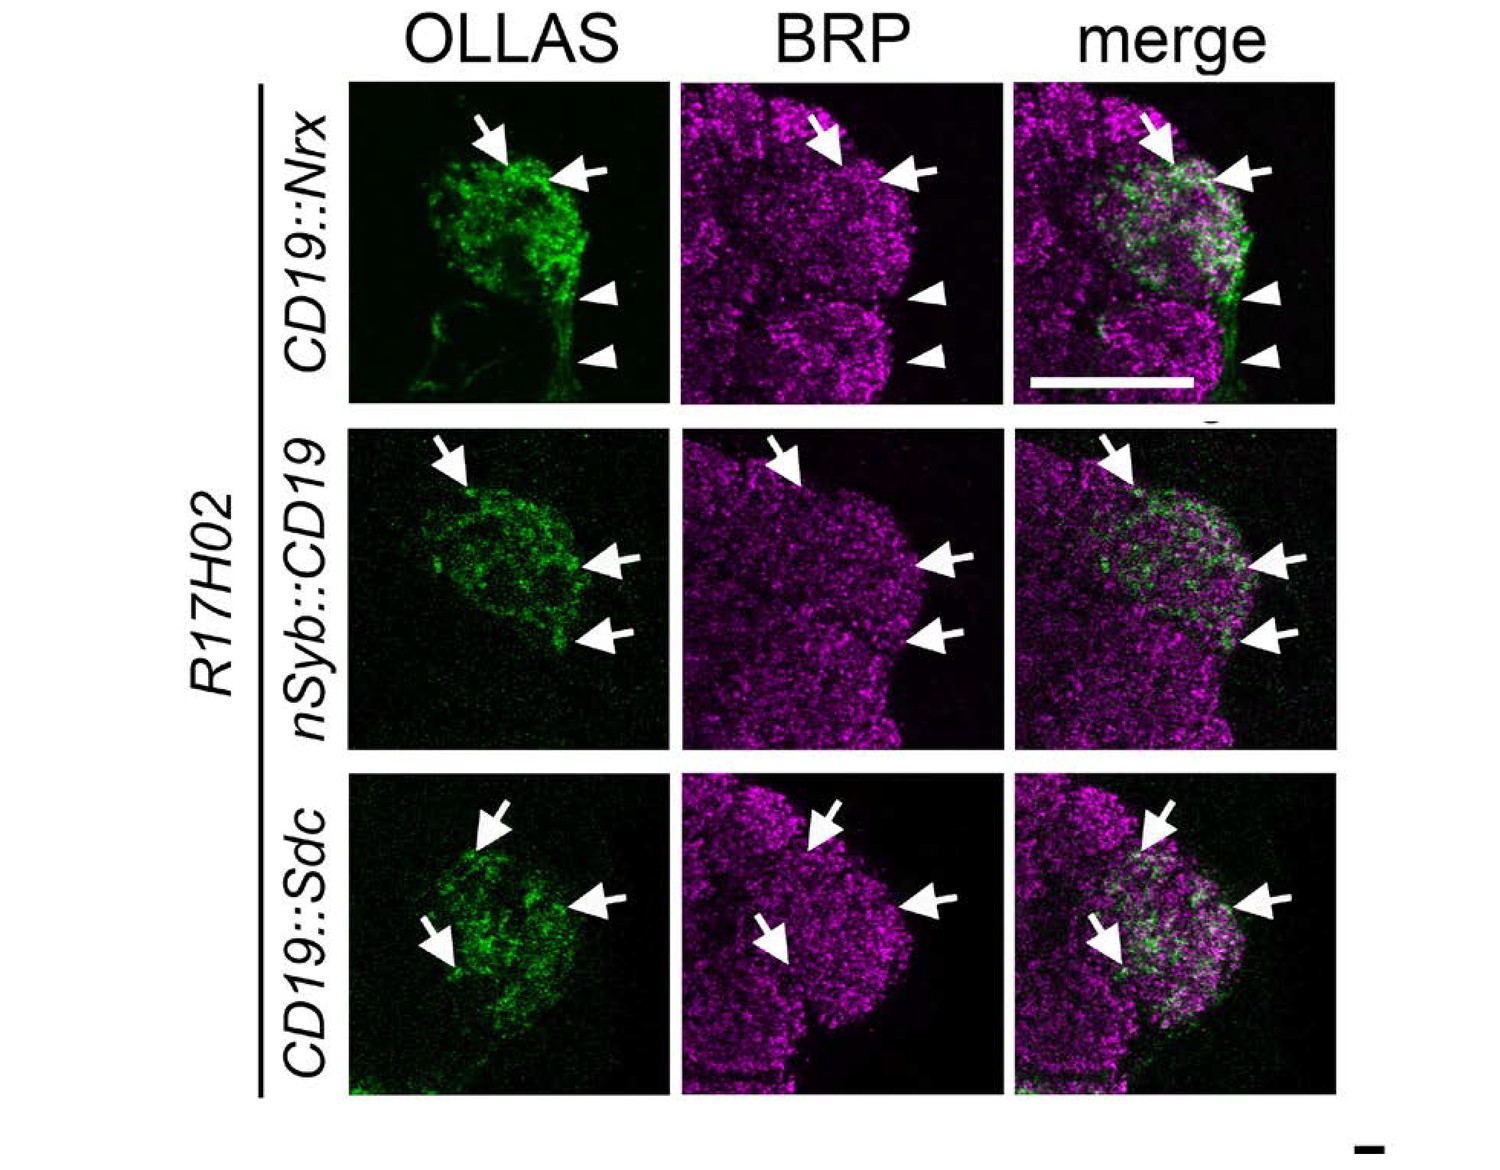
Comparison of localization of the CD19::Nrx, nSyb::CD19 and CD19::sdc ligands into presynaptic sites in the ORNs targeting DA1.
Different intracellular and transmembrane domains (from Nrx, nSyb, and sdc) were fused to CD19 and expressed into ORNs targeting the DA1 glomerulus using the CD19::Nrx (top panels), nSyb::CD19 (middle panels) and CD19::Sdc (bottom panels), with the R17H02 driver (in green). The brain samples were co-immunostained with antibodies against the OLLAS tag (present in the ligand) and against the pre-synaptic protein, BRP (in magenta). The ligand proteins are co-localized with or adjacent to BRP (arrows), demonstrating that all ligands are enriched at the presynaptic terminals of the ORNs, but CD19::Nrx was also expressed at strong levels in the axon shaft outside of the glomerulus (arrowheads in top panels). Scale bar = 20 μm.
Figure 2—figure supplement 5
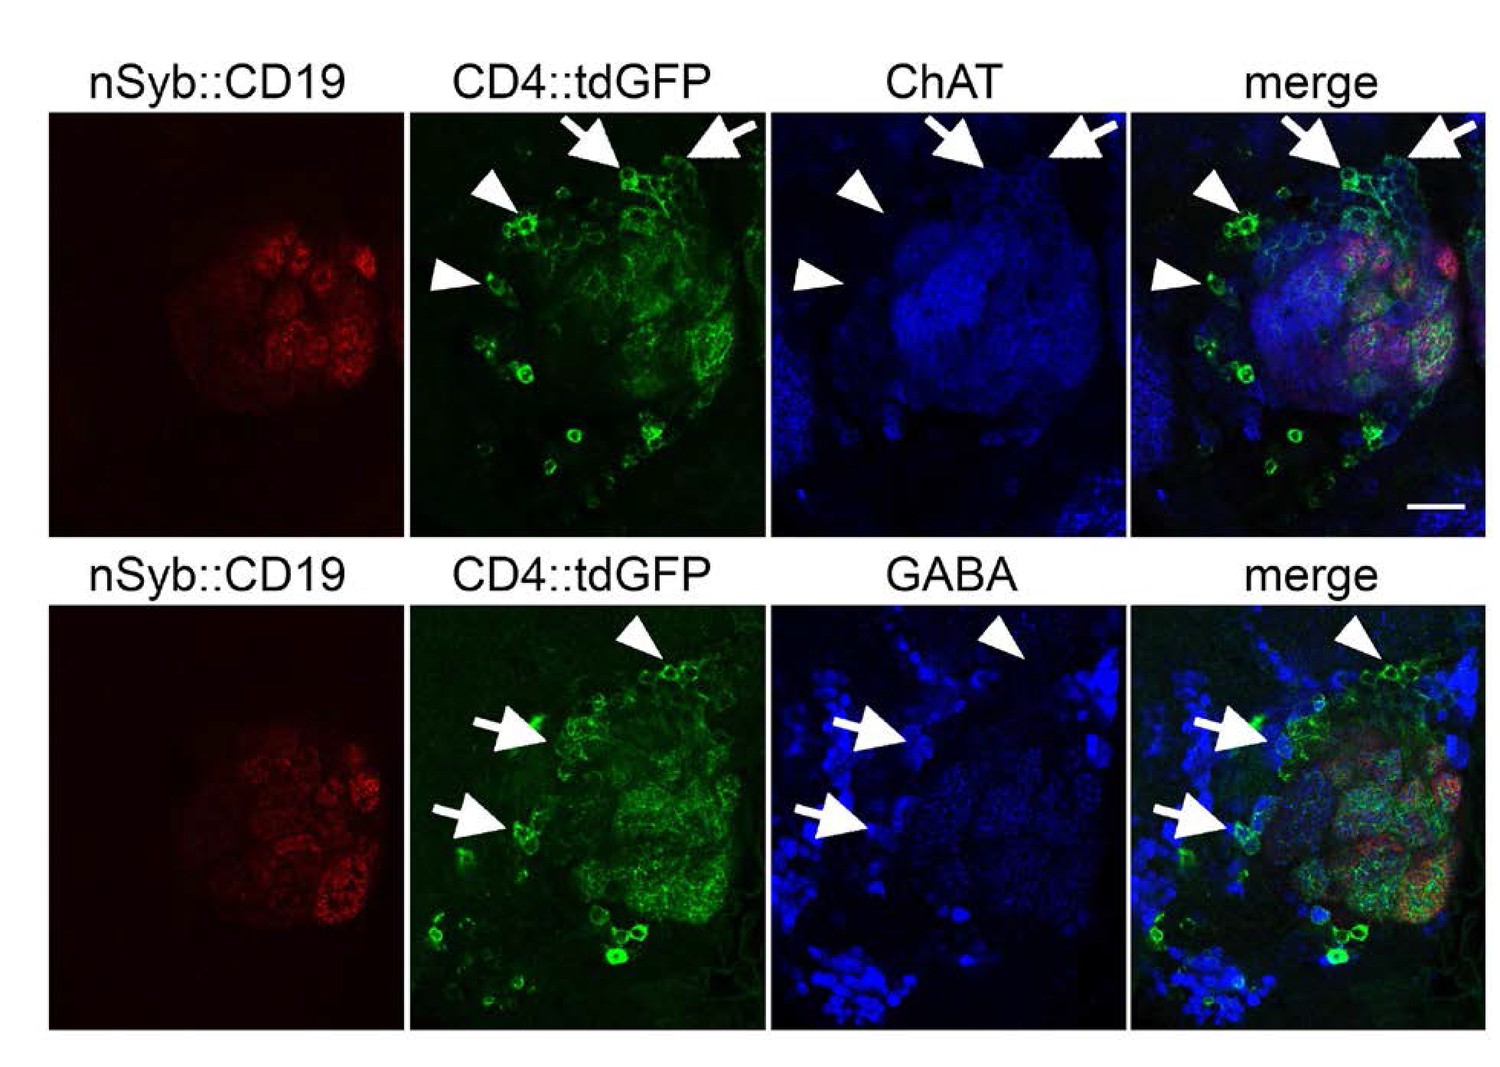
Identity of the postsynaptic targets of olfactory receptor neurons in the antennal lobe detected by TRACT.
Cholinergic (ChAT+)and GABAergic (GABA+) neurons were labeled with GFP when the nSyb::CD19 ligand was expressed in most of the ORNs by the orco-lexA driver. The position of the cell bodies of the cholinergic and GABAergic GFP+ neurons was consistent with them being PNs and LNs, respectively. The images of two single optical section from two brain samples show ChAT immunostaining (top row, third column in blue) and GABA immunostaining (bottom row, third column in blue), indicating that some of the GFP+ neurons (top and bottom rows, second column in green) induced by nSyb::CD19+ ORNs (top and bottom rows, first column in red) are cholinergic (not GABAergic) PNs (arrows in (top row) and arrowhead in (bottom row)). Some GFP+ neurons on the lateral part of the antennal lobe are GABA+ and ChAT- (arrowheads in (top row) and arrows in (bottom row)), which indicates they are probably GABAergic LNs. First column: NSYB::CD19+ axons from ORNs (red); Second column: distribution of GFP+ neurons in the antennal lobe; Third column: GABA or ChAT immunostaining; Fourth column: merged images of GABA or ChAT (blue), GFP (green) and nSyb::CD19 (red). Scale bar = 20 μm.
Figure 2—figure supplement 6
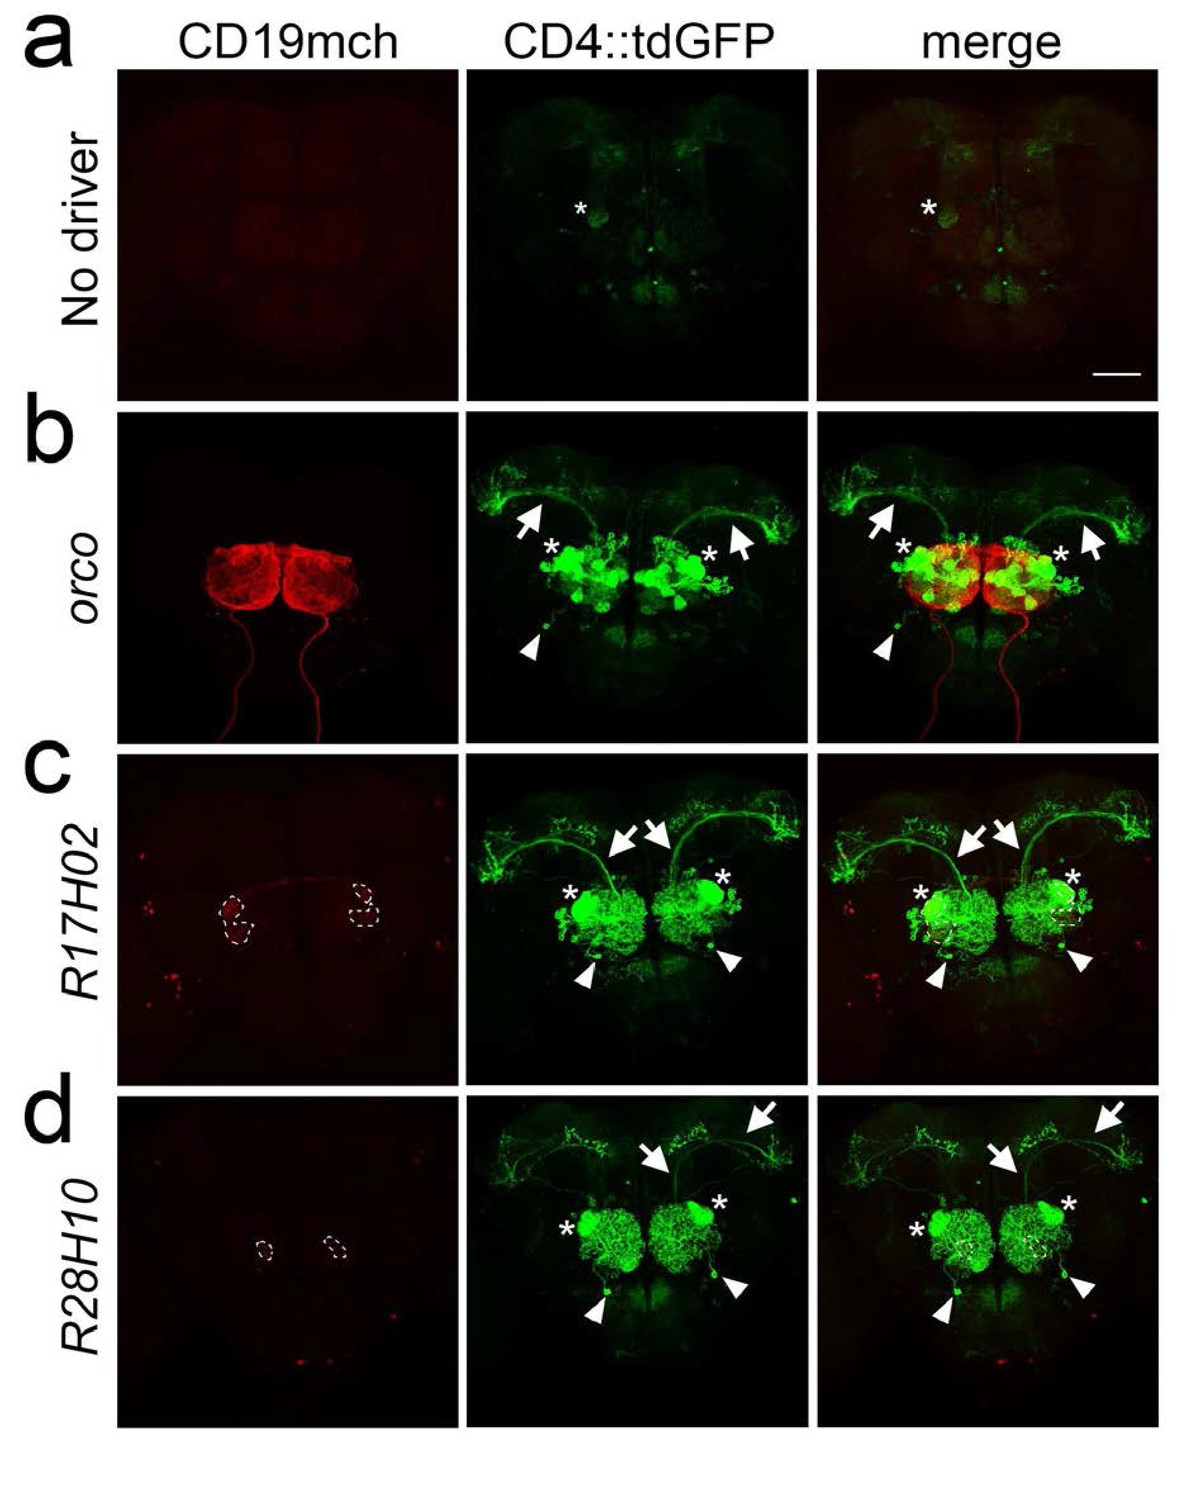
TRACT with non-synaptically localized ligand reveals neurons that are not exclusively connected by synapses.
To selectively detect the connections between ORNs and PNs, the GH146 enhancer was used to drive expression of nlgSNTG4 selectively into PNs, and the ligand was expressed in subsets of ORNs that project to identified glomeruli. (a) Control brain without lexA driver (carrying GH146-nlgSNTG4, 5xUAS-CD4::tdGFP and LexAop-CD19mch) reveals low levels of background GFP expression that can be barely observed in several brain regions, including DA1 glomerulus (star in the right). (b, c, and d) Expression of the ligand CD19mch in most glomeruli with the orco driver (b), or in identified glomeruli using the R17H02 (c) and R28H10 (d) drivers. (b) Left - CD19mch+ axons from ORNs (red) driven by orco branch in the antennal lobe. Middle - Induction of CD4::tdGFP expression in PNs triggered by CD19mch+ ORNs (red, left image). Axon bundles of the CD4::tdGFP+ uniPNs in the iACT (arrows) branch in the mushroom body. (c–d) CD4::tdGFP+ PNs (middle panels) induced by CD19mch+ ORN axons (red, left images) that innervate one (VC1) to three (DA1/VA6/VA1lm) identified glomeruli (stippled circles in the left panels). Although the ligand proteins were only present in specific glomeruli (stippled circles, the expression level in VA6 was low and undetectable after immunostaining with anti-RFP antibody), strong CD4::tdGFP induction (middle panels) was detected in PNs with dendrites outside the CD19mch+ glomeruli. In particular, there are GFP+ neurites within DA1 (stars) in all the cases. The arrows indicate the axons of uniPNs, which run through the mALT. In (b–d), in addition to the uniPNs, few multiPNs were labeled as well (arrowheads). Their dendrite arborizations cover the entire antennal lobes. The right panels show the merged images of CD4::tdGFP (green) and CD19mch (red). Scale bar = 50 μm.
Figure 2—figure supplement 7
Control brains without the lexA driver to assess the levels of ligand-independent background.
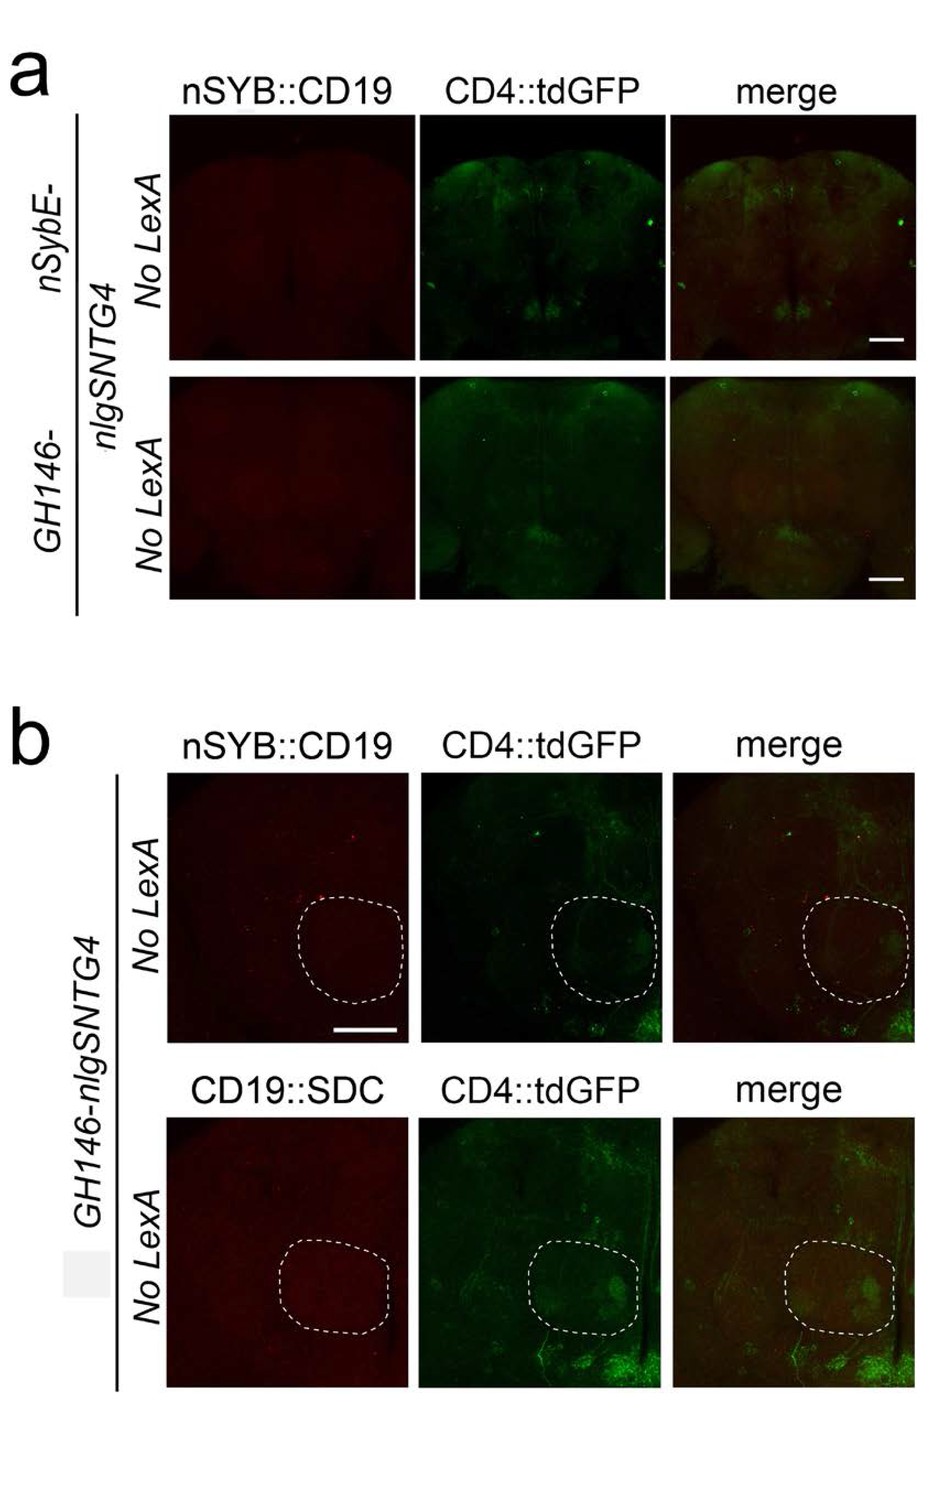
(a) The confocal images show that the negative controls of Figure 2e without lexA drivers (carrying nlgSNTG4 driven by the nSybE- (top panels) or GH146 enhancers (bottom panels), 5xUAS-CD4::tdGFP and LexAop-nSyb::CD19) have no induction in antennal lobe neurons. (b) The images show that control brains of Figure 3 without LexA driver (carrying GH146-nlgSNTG4, 5xUAS-CD4::tdGFP and LexAop-nSyb::CD19 (top panels) or CD19::Sdc (bottom panels) have very low levels of ligand-independent background GFP expression in the antennal lobe (stippled circle). Scale bar = 50 μm.
Figure 3

Selective labeling of PNs that receive synaptic input from ORNs in identified glomeruli.
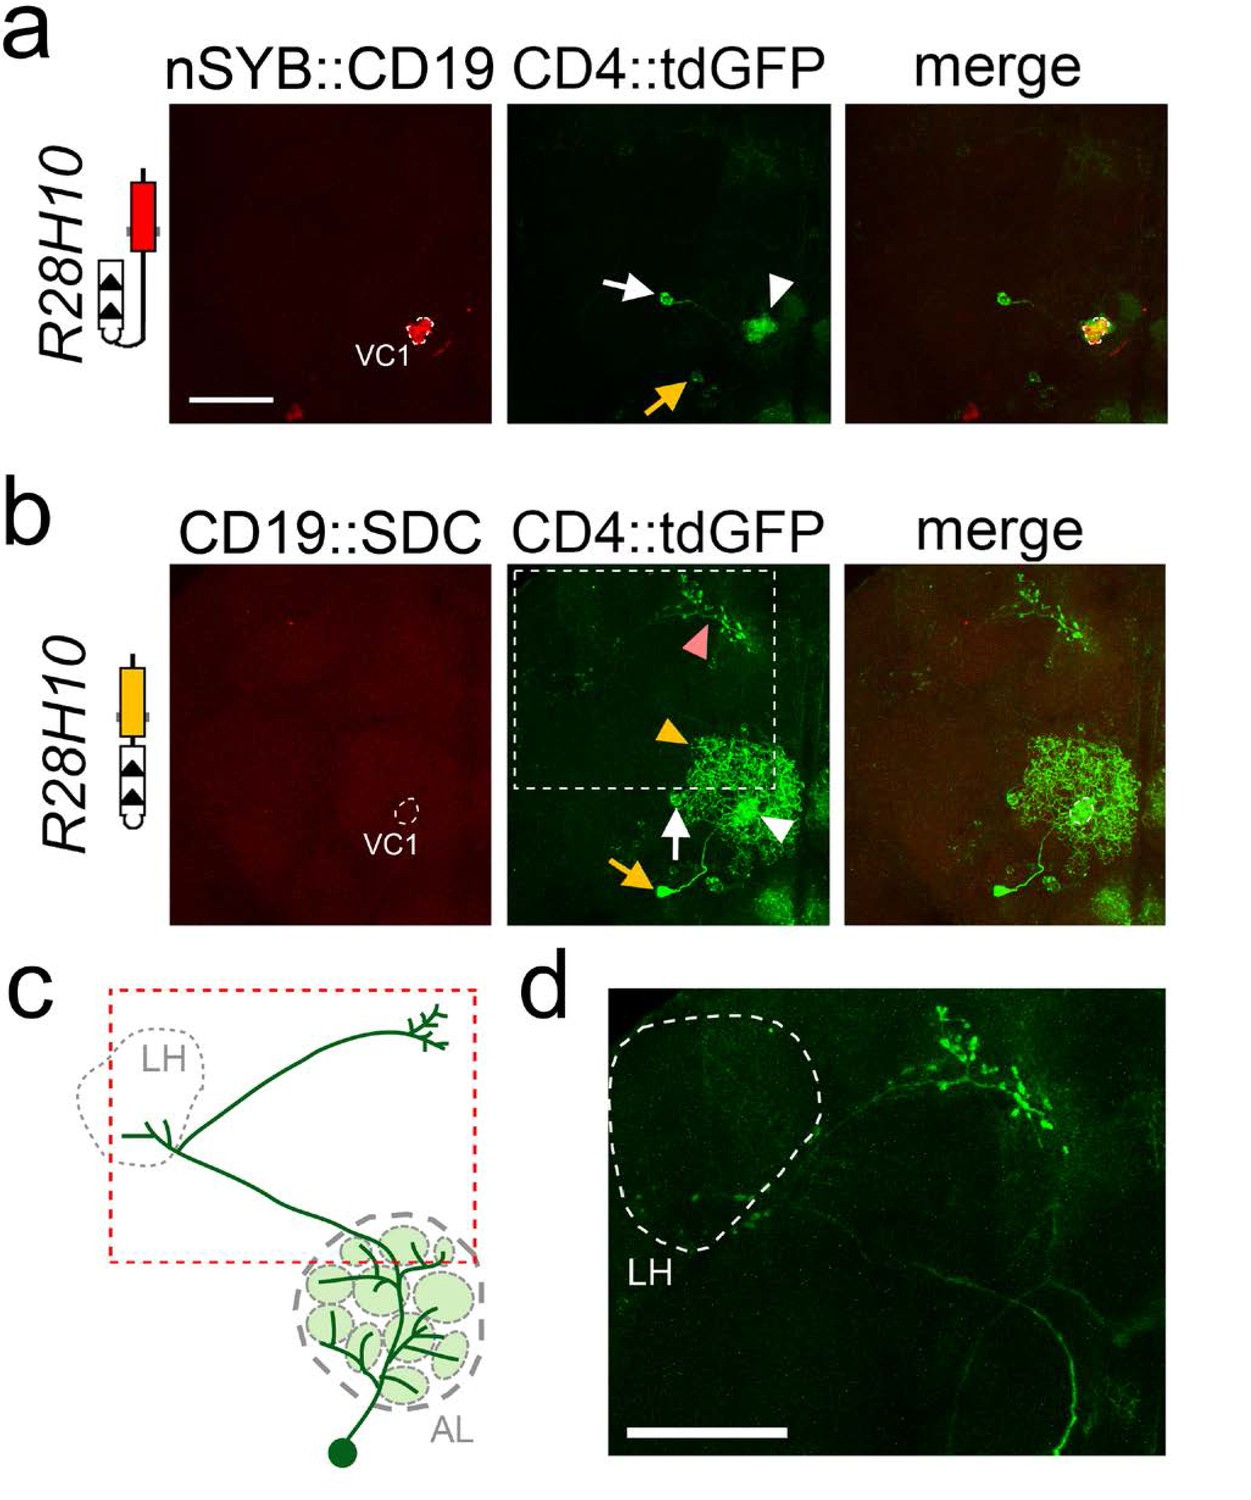
(a) Labeling of PNs that receive synaptic input from ORNs expressing the ligand nSyb::CD19 in identified glomeruli using the R17H02 (top panels) and R28H10 (bottom panels) LexA drivers. Left: nSyb::CD19+ axons from ORNs (red) driven by R17H02- and R28H10-LexA branch in identified glomeruli (stippled circles). In R17H02 the nSyb::CD19 expression level was low in VA6 and VA1lm, and expression in DA1 was only visible after signal amplification by immunostaining. Center: Induction of CD4::tdGFP expression in PNs triggered by nSyb::CD19+ ORNs (red, left panels). In R17H02 (top center) two uniPNs with dendrites branching into DA1 (arrows) and one neuron branching into VA6 (arrowhead) were labeled. No GFP+ PN branched in VA1lm. In R28H10 (bottom center) a single uniPN with dendrites branching in VC1 was GFP+ (arrow). (b) Tracing the neuronal connections from the ORNs expressing the ligand CD19::sdc in identified glomeruli by using the R17H02 (top panels) and R28H10 (bottom panels) LexA drivers. Left: CD19::sdc+ axons from ORNs (red) driven by R17H02- and R28H10-LexA branch in the identified glomeruli (stippled circles). In the VA6 glomerulus of R17H02 and VC1 of R28H10, the CD19::sdc expression level was too low to be detected by immunostaining, but the expression in DA1 and VA1lm of R17H02 was above the detection level. Center: Induction of CD4::tdGFP expression in PNs triggered by CD19::sdc+ ORNs (red, left panels). In R17H02 (top center) there were uniPNs projecting to DA1 (arrows) and VA6 (arrowhead). In R28H10 (bottom center) a single uniPN projecting to VC1 was GFP+ (arrow). Expression of CD19::sdc with R28H10 and R17H02 induced GFP expression in a single multiPN (yellow arrowhead). (c) The diagrams show the induction pattern of uniPNs from (a) and (b). The multiPNs detected in (b) are not included. Scale bar = 50 μm.
Figure 4
Labeling of one uniPN and one multiPN connected to glomerulus VC1 with nSyb::CD19 and CD19::sdc.
Expression of nSyb::CD19 (homozygote, top panels) and CD19::sdc (heterozygote, middle panels) in VC1 glomerulus induced GFP expression in a single uniPN (white arrow) and one multiPN (yellow arrow). With the nSyb::CD19 ligand (a), both the cell body of the uniPN (white arrow) and its dendrite branching in the VC1 glomerulus (white arrowhead) are visible. In contrast, the cell body of the multiPN is indicated by a yellow arrow. With the CD19::sdc ligand (b) the induction of GFP in the uniPN is comparable to that observed with nSyb::CD19 (white arrow and arrowhead point to the cell body and dendrite of uniPN, respectively). However, with CD19::sdc induction in the multiPN is stronger than with nSyb::CD19, and GFP labels the cell body (yellow arrow), its dendrites (yellow arrowhead), and its axon (pink arrowhead). High magnification image of the axon (white stippled inset) is shown in (d). (c) The diagram illustrates the position of the cell body of the multiPN with respect to the antennal lobe, and the trajectory of its axon (red stippled inset), projecting first into the LH (grey stippled circle), and then to the rostral part of the brain. This multiPN has been described previously - see (Marin et al., 2002 panel H, Figure 3). All images are maximum projection confocal stacks. Scale bar = 50 µm.
Figure 5 with 1 supplement

Using TRACT to identify synaptic targets of the PDF neurons in the central brain.
(a) Diagram of Drosophila circadian neurons. The two groups of PDF LNvs are located close to optic lobe: four l-LNvs (black) have dendrites that branch into the ipsilateral optic lobe, and project their axons across the central brain to the contralateral optic lobe. Four s-LNvs (red) project their dorsal axons to dorsoposterior part of the central brain, where DN1 (blue), DN2 (purple) and DN3 (green) neurons are located. (b) Labeling of neurons that receive synaptic input from PDF cells expressing no ligand (top panels: b1, (b3, b5, b7), or the ligand nSyb::CD19 driven by the pdf-LexA driver (bottom panels: b2, (b4, b6, b8). To unbiasedly identify downstream synaptic targets of PDF neurons, we used the pan-neuronal receptor strain, nSybE-nlgSNTG4. b1, b2: nSyb::CD19 +expression pattern. b1: control brain with no nSyb::CD19 expression. b2: nSyb::CD19 driven by pdf-LexA accumulated (red) in the cell bodies (yellow arrows) and the axon terminals of s-LNv dorsal axons (yellow arrowheads). b3: No GFP induction was observed in the control brains without pdf >nSyb::CD19 ligand. b4: Induction of CD4::tdGFP expression in pdf >nSyb::CD19 brain in the vicinity of the trajectory of nSyb::CD19 +axons through the central brain. Arrow and arrowhead point to GFP +neurons in the DN1 region, and DN3 regions, respectively. b5, b6: Immunostaining with anti-PER antibody identifies DN1 (white arrow), DN2, and DN3 (white arrowhead) neurons. b7, b8: Merged images of PER (magenta), GFP (green) and nSyb::CD19 (red). Stippled square in b8 indicates region shown at high magnification (40X) in Figure 6.
Figure 5—figure supplement 1
Potential synaptic targets of the PDF neurons in the central brain using the CD19::Sdc ligand.
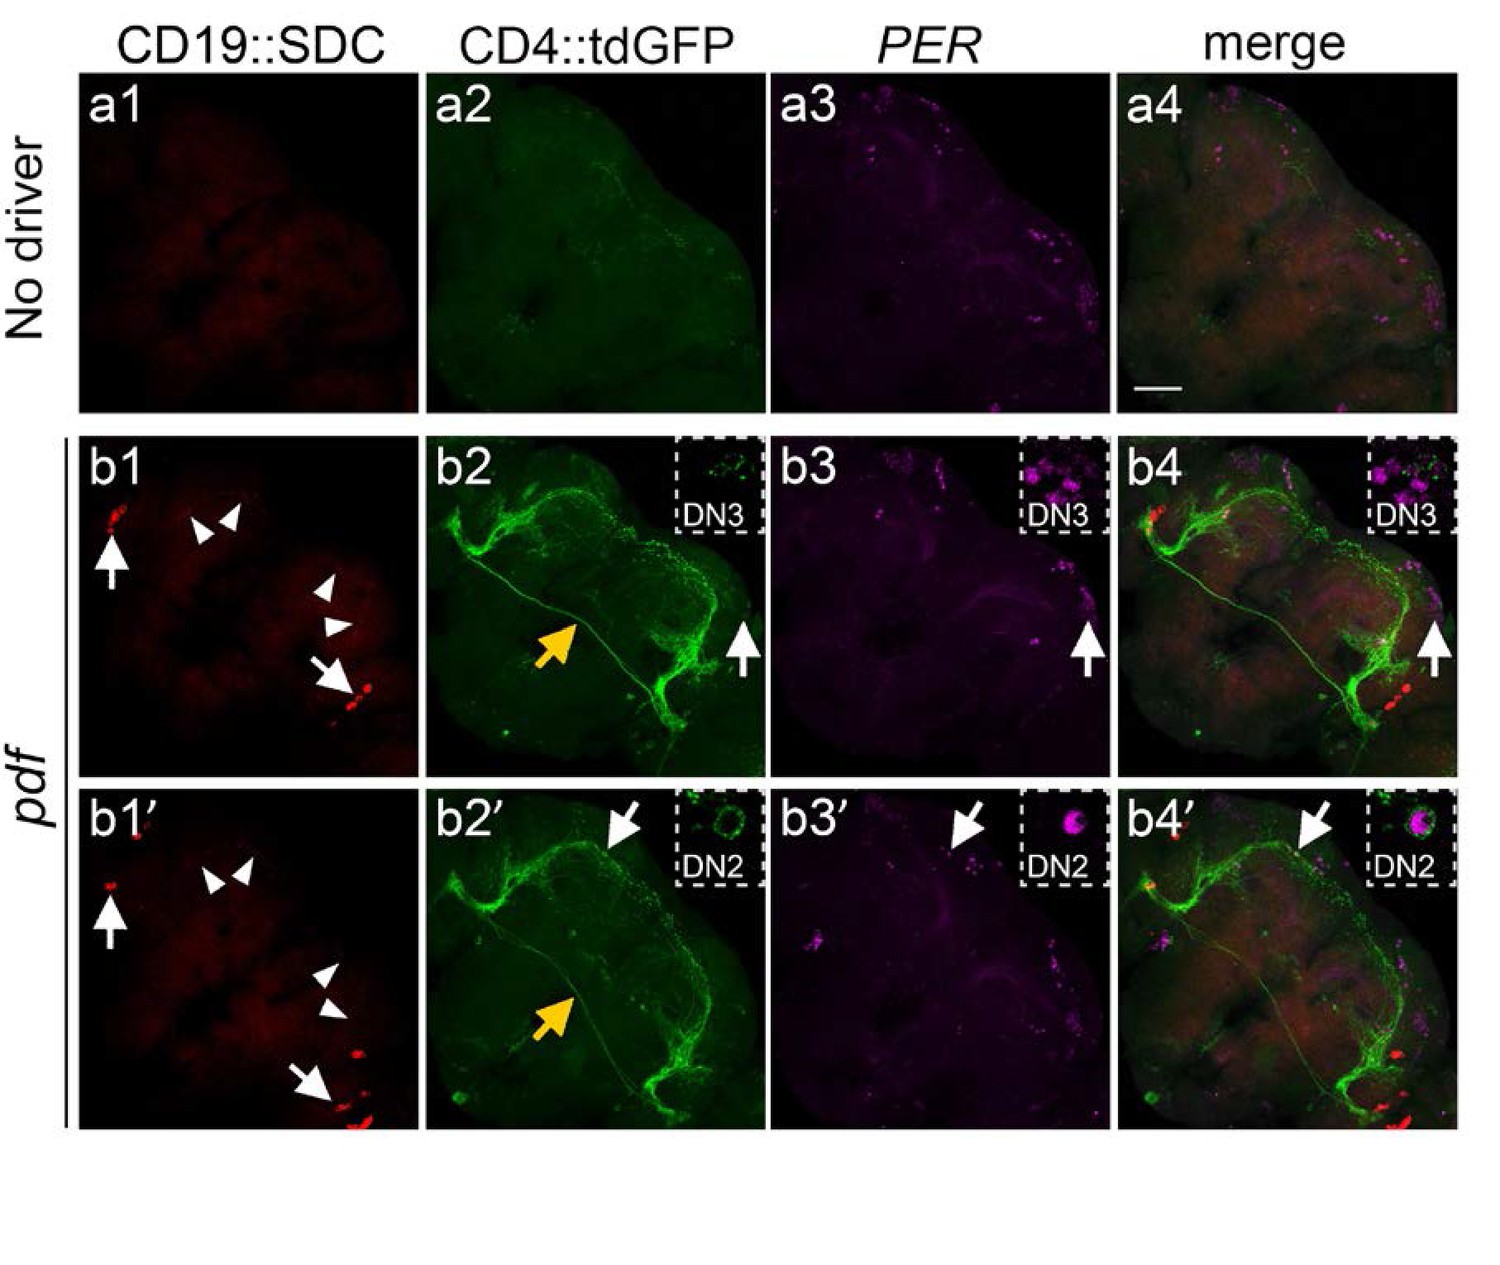
(a1-4) Negative control, with no ligand expression. (b1-4 and b1’−4’ [two different animals]) GFP +neurons induced by expression of the CD19::Sdc ligand driven by the pdf-LexA driver. The receptor in both cases is the nSybE-nlgSNTG4. a1: control brain with no nSyb::CD19 expression. b1 and b1’: nSyb::CD19 driven by pdf-LexA strongly accumulated (red) in the cell bodies (arrows) and had a weak signal in the axon terminals of s-LNv dorsal axons (arrowheads). a2: no GFP induction was observed in the control brains without pdf >nSyb::CD19 ligand. b2 and b2’: Induction of GFP expression in pdf >nSyb::CD19 brain in the vicinity of the trajectory of nSyb::CD19 +axons through the central brain. b1-4 and b1’-b4’ are images from two different animals. In b2 there was GFP induction in DN3 (but not DN2), and in b2’ there was induction in DN2 (but not in DN3). White Arrows point to GFP +DN2 (b) and GFP +DN3 (b’) neurons whereas yellow arrows indicate the commissural axons of l-LNvs. a3, b3, and b3’: Immunostaining with anti-PER antibody identifies DN1, DN2, and DN3 neurons. a4, b4 and b4’:Merged images of PER (magenta), GFP (green) and CD19::Sdc (red). Stippled insets in b and b’ show the GFP +DN2 or DN3 neurons in high magnification (60X). Scale bar = 50 μm.
Figure 6
Characterization of the synaptic targets of the PDF neurons in the central brain.
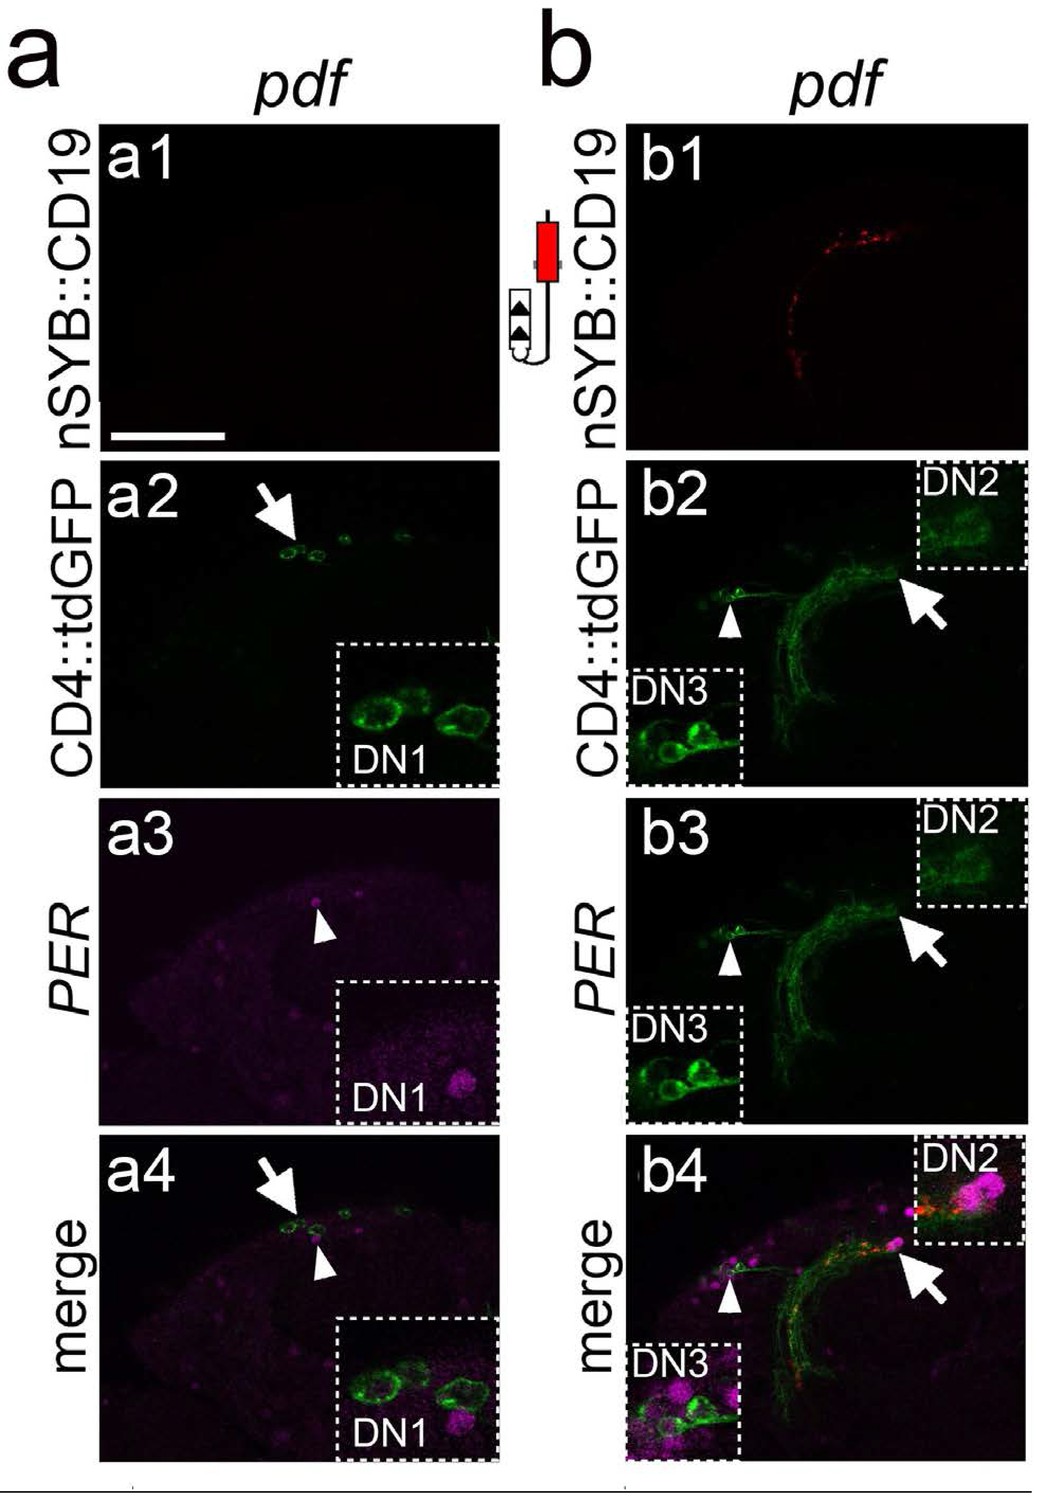
(a and b) Single optical confocal images at different depths of the brain showing a high magnification view of the stippled rectangle in Figure 5b bottom panels. (a) Induction of GFP in neurons around the DN1 region. a1: In this focal plane the nSyb::CD19 expression is not visible. a2: Induction of GFP expression in cells (arrow) around the DN1 cluster. Stippled square at the bottom right is a high magnification image of the GFP +cells. a3: PER immunostaining of the DN1 neurons. Arrowhead points to PER +cells shown at high magnification on the right bottom inset. a4: Merged image showing that the GFP +cells are not the PER +DN1 neurons. (b) Induction of GFP in cells in the DN2 and DN3 regions. b1: Axons from nSyb::CD19 (red). b2: Arrowhead and arrow point to cell bodies of GFP induced neurons in DN3 and DN2 regions, shown at higher magnification on the bottom left, and top right insets, respectively. b3: Immunostaining of PER (magenta). b4: Merged image showing that in the DN3 (bottom left inset) and DN2 (top right inset) regions, the GFP +neurons are also PER+. Scale bar = 50 μm.
Tables
Table 1
Summary of the induction results in the identified glomeruli and circadian neurons.
(a and b) Summary of PNs labeled from ORNs expressing nSyb::CD19 (a) or CD19::Sdc (b) in identified glomeruli using the R17H02 and R28H10 LexA drivers. # of GFP+ PNs: number of PNs with GFP induction (median ±sd). % of positive ALs: percentage of antennal lobes with GFP+ PNs in identified glomeruli. # of PNs reported: numbers of PNs innervating identified glomeruli as reported in previous works (Grabe et al., 2016). In the column of R17H02, only the results from females (F) are listed because expression of the R17H02-lexA driver was highly variable in males. n: number of antennal lobes analyzed. *: one R17H02>nSyb::CD19 and two R17H02>CD19::Sdc VA6 glomeruli were GFP+ (there were GFP+ dendrites branching in VA6), but were excluded because the cell bodies of the uniPN projecting into VA6 could not be identified. $: with nSyb::CD19 there is GFP induction in multiPNs in animals homozygous for the ligand (hom), but not in heterozygotes (het). (c) Summary of neurons with GFP expression in animals with donor PDF neurons expressing nSyb::CD19. # of GFP+ Ns: number of the different types of neurons labeled with GFP (mean ±s.e.m). # of Ns reported with connections: previous works did not report these data. % of positive hemispheres: percentage of hemispheres analyzed that contained GFP+ neurons. n: numbers of the hemispheres analyzed.
| A | GH146-nlgSNTG4 + LexAop-nSyb::CD19 | ||||
| PNs | # of GFP+ PNs | # of PNs reported | % of positive ALs | n | |
| R17H02 | uniPN->DAl | 10.5±1.65 | 8±1.9(F) | 100 | 10 |
| uniPN->VA6 | 1±0.33 | 1±0.4 (F) | 100 | 9* | |
| uniPN->VA1lUm | 0 | 6±0.9 (F) | 0 | 10 | |
| multiPN | 0 (het)$ 1±0.00 (horn) | 1 | 0 100 | 10 6 | |
| R28H10 | uniPN->VCl | 1±0.00 | 1-2 | 100 | 22 |
| multiPN | 0 (het)$ 1±0.48(hom) | 1 | 0 70 | 22 10 | |
| B | GH146-nlgSNTG4 + LexAop-CD19::Sdc | ||||
| PNs | # of GFP+ PNs | # of PNs reported | % of positive ALs | n | |
| R17H02 | uniPN->DAl | 11.5±11.43 | 8±+1.9 (F) | 100 | 10 |
| uniPN->VA6 | 1±0.35 | 1±10.4 (F) | 100 | 8* | |
| uniPN->VA1lm | 0 | 6±0.9 (F) | 0 | 10 | |
| multiPN | 1±0.52 | 1 | 60 | 10 | |
| R28H10 | uniPN->VCl | 1±0.31 | 1-2 | 90 | 20 |
| multiPN | 1±0.39 | 1 | 90 | 20 | |
| C | nSybE-nlgSNTG4 + LexAop-nSyb::CD19 | ||||
| types of neurons | #of GFP+Ns | # of Ns reported with connections | % of positive hemispheres | n | |
| DN2 | 1±0.75 | N.A. | 55.6 | 18 | |
| DN3 | 7±2.3 | N.A. | 100 | 18 | |
| PER- | 7±2.81 | N.A. | 100 | 18 | |
Additional files
-
Supplementary file 1
ID3 dNRR dNotch1 TMD dnlng2 esn V5.
- https://doi.org/10.7554/eLife.32027.018
-
Supplementary file 2
Supplementary text for Figure 2.
- https://doi.org/10.7554/eLife.32027.019
-
Transparent reporting form
- https://doi.org/10.7554/eLife.32027.020
Download links
A two-part list of links to download the article, or parts of the article, in various formats.
Downloads (link to download the article as PDF)
Open citations (links to open the citations from this article in various online reference manager services)
Cite this article (links to download the citations from this article in formats compatible with various reference manager tools)
Tracing neuronal circuits in transgenic animals by transneuronal control of transcription (TRACT)
eLife 6:e32027.
https://doi.org/10.7554/eLife.32027


