CRISPR-based herd immunity can limit phage epidemics in bacterial populations
- University of Liverpool, United Kingdom
- Institute of Science and Technology Austria, Austria
- Technion - Israel Institute of Technology, Israel
Figures
Figure 1
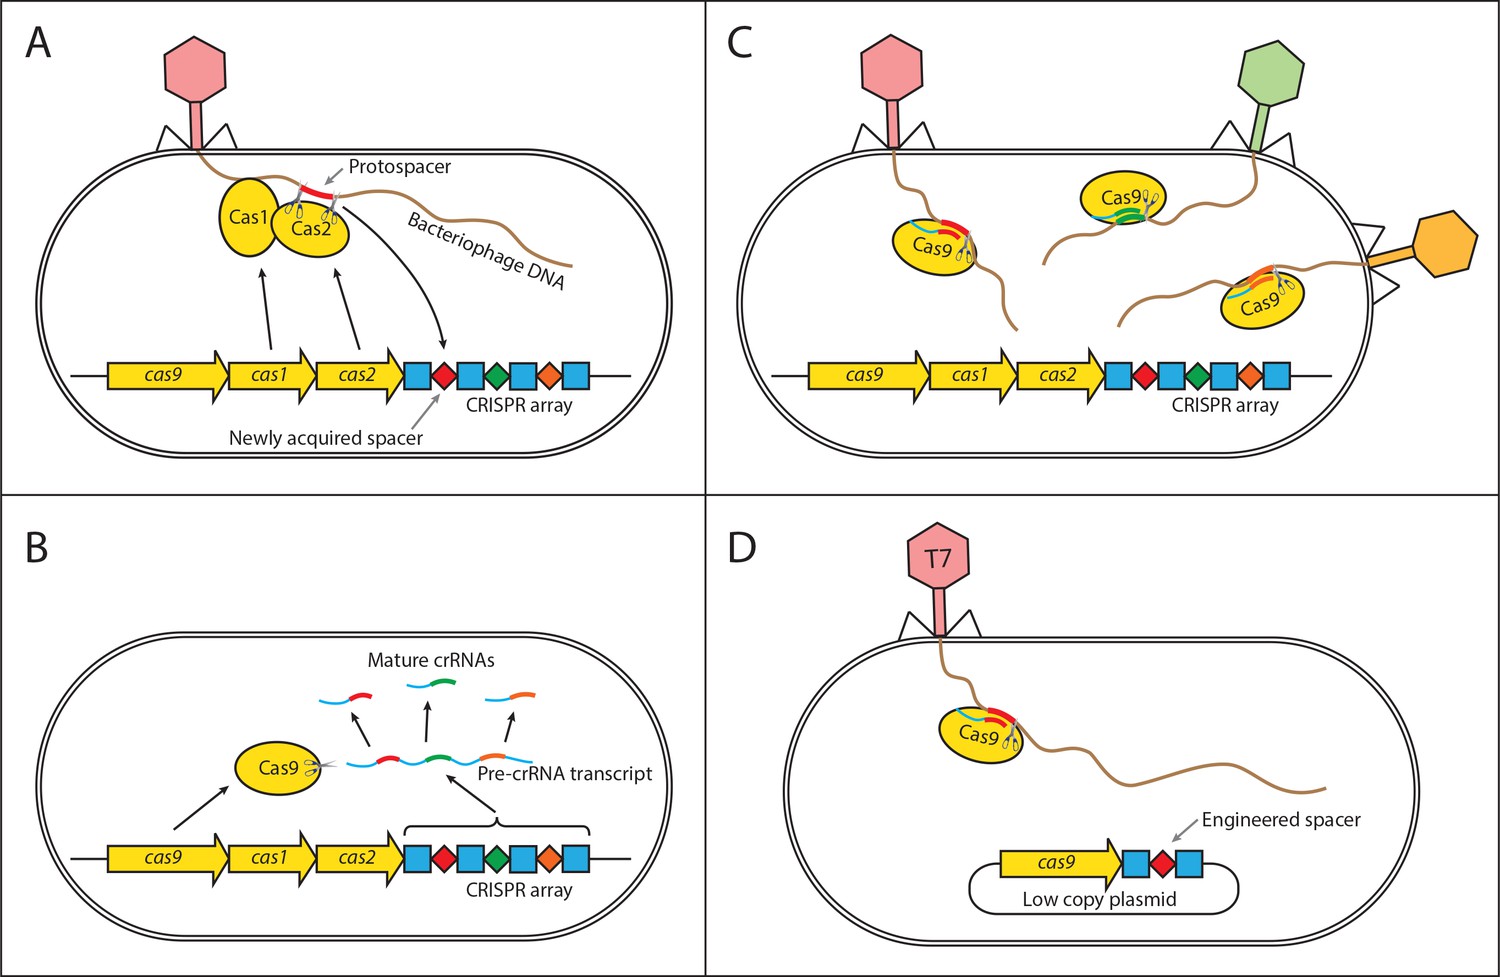
Mechanism of CRISPR/Cas type II immunity.
The CRISPR/Cas system provides immunity to phages and its main features can be described by three distinct stages. (A) Acquisition. When a cell gets infected by a phage, a protospacer on the invading phage DNA (indicated as a red bar) is recognized by Cas1 and Cas2. The protospacer is cleaved out and ligated to the leader end (proximal to the Cas genes) of the CRISPR array as a newly acquired spacer (red diamond). (B) Processing. The CRISPR array is transcribed as a Pre-crRNA and processed by Cas9 (assisted by RNaseIII and trans–activating RNA, not shown) into mature crRNAs. (C) Interference. Mature crRNAs associate with Cas9 proteins to form interference complexes which are guided by sequence complementarity between the crRNAs and protospacers to cleave invading DNA of phages whose protospacers have been previously incorporated into the CRISPR array. (D) A truncated version of the CRISPR system on a low copy plasmid, which was used in this study lacks cas1 and cas2 genes and was engineered to target a protospacer on the T7 phage chromosome to provide Escherichia coli cells with immunity to the phage. The susceptible strain contains the same plasmid except the spacer does not target the T7 phage chromosome.
Figure 2
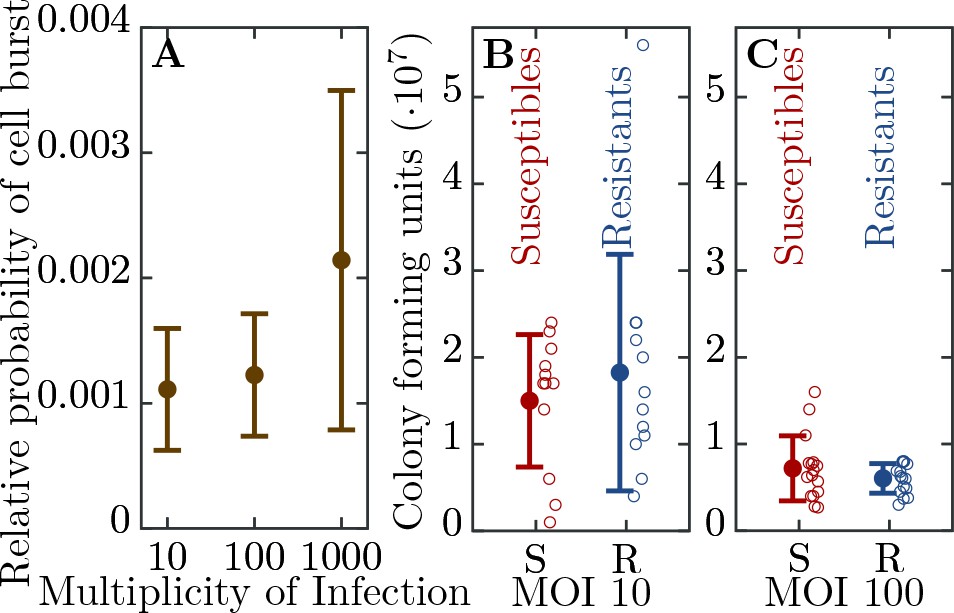
Efficiency of bacterial resistance.
(A) The probability that a resistant cell bursts, relative to a susceptible cell, at three different initial multiplicities of infection (MOI). The probability that a resistant cell bursts at MOI 1000 is significantly higher than at MOI 10 (p = , = ) or at MOI 100 (p = , = ). The error bars show the standard deviations from the mean. Note that this measure is not a widely used ’efficiency of plating’ but it determines the probability of burst of single resistant cells (see Materials and methods for details). (B) The number of colony forming units (CFUs) post phage challenge (see Materials and methods). The mean number of CFUs after the bacterial cultures were exposed to the phage is not significantly different between susceptible and resistant strains at MOI 10 (p = , = ) and (C) at MOI 100 (p = , = ), indicating that the resistant cells’ growth is halted after the cells are infected by a phage. The error bars show the standard deviations from the mean. There were no detectable CFUs in either susceptible or resistant cell cultures at MOI 1000. It should be noted that the indicated MOI values do not correspond to the average number of phages that adsorb to cells in the experiments. For MOI 10 we estimated the mean number of phages per cell as and for MOI 100 as 0.988 (see Materials and methods for details). It was impossible to determine the mean for MOI 1000 as there were no detectable CFUs under such conditions. The data presented in this figure can be found in Figure 2—source data 1.
-
Figure 2—source data 1
Efficiency of bacterial resistance.
- https://doi.org/10.7554/eLife.32035.005
Figure 3
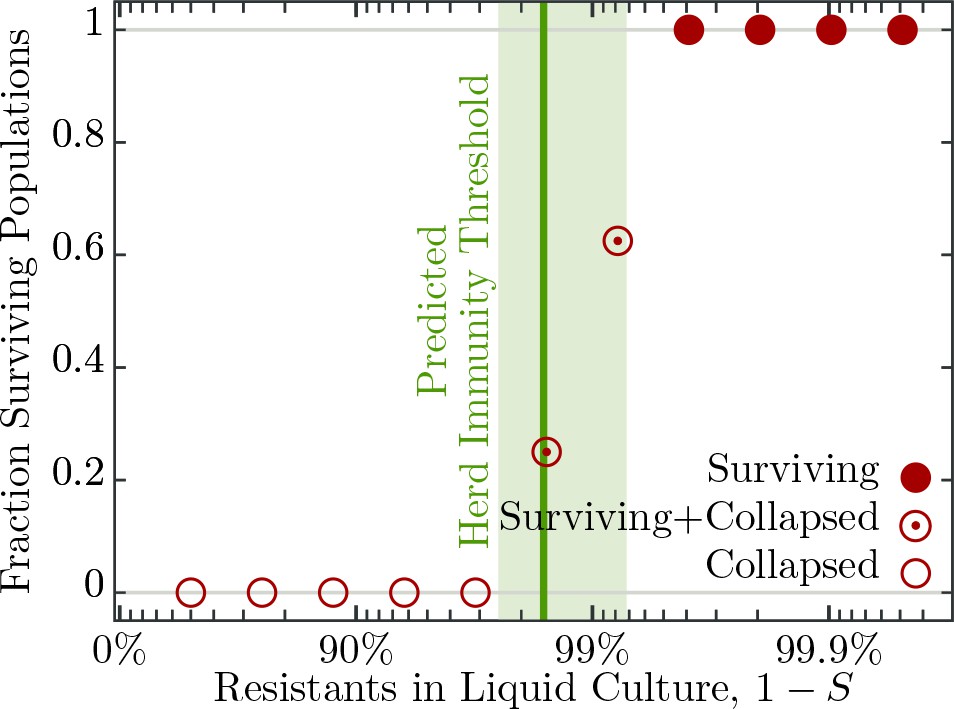
Fraction of surviving populations at post phage infection.
Bacterial populations consisting of various fractions of resistant to susceptible individuals infected with phages, corresponding to a multiplicity of infection (MOI) of , designed to resemble an epidemic initiated by the burst size from one infected individual (see Table 2 for burst size estimates). Each population phage challenge is replicated times. The solid dark green line shows the model prediction, Equation 4, for the herd immunity threshold (), given latent period (), bacterial growth rate (), and phage burst size (). Shaded area indicates standard deviation. The data presented in this figure can be found in Figure 3—source data 1.
-
Figure 3—source data 1
Fraction of surviving populations at 18 hr post phage infection.
- https://doi.org/10.7554/eLife.32035.007
Figure 4
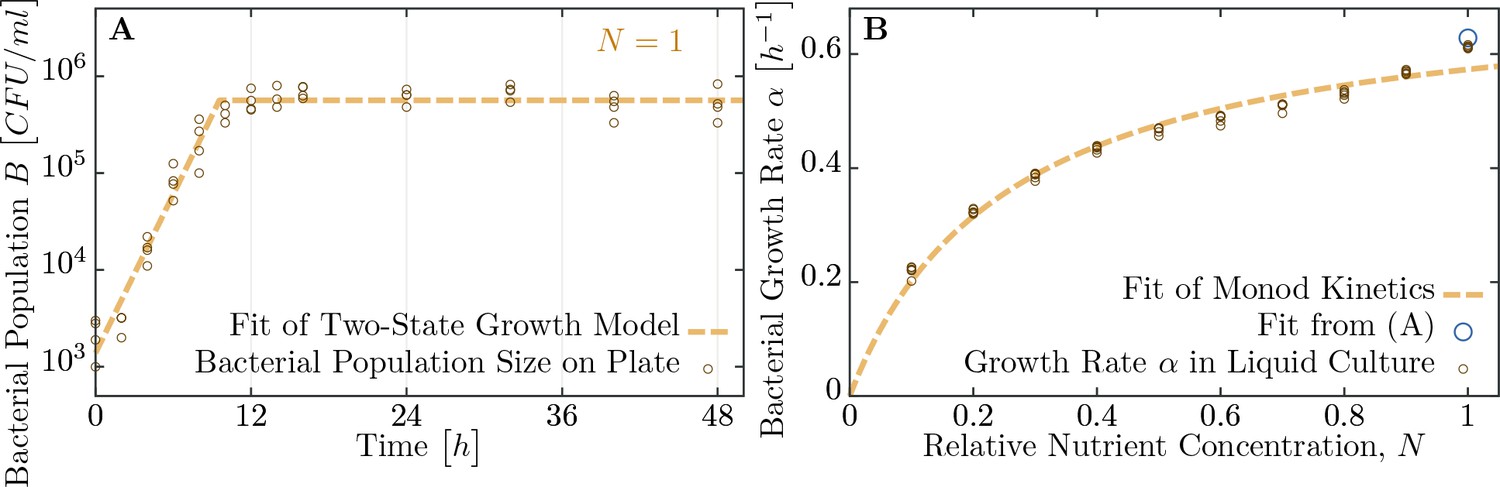
Measuring bacterial growth without phage.
(A) Trajectory of population size on agar plates over time. For modeling, we assume two states of growth (dashed brown curve): first, the bacterial population grows exponential until the time , when nutrients are depleted. From this time on, growth rate is assumed to be zero and the population saturates at a maximal size . Experimental observations fit this proposed growth curve to a very good extent. After all, half of all nutrients are used up in the last generation indicating that the switch between growth and no-growth should be fast. (B) Growth rates of bacteria in diluted medium follow closely Monod’s empirical law, given by expression Equation 9. Fit parameters are found to be and (with the latter in dimensionless units as dilution of LB medium), see also Table 1. The data presented in this figure can be found in Figure 4—source data 1.
-
Figure 4—source data 1
Bacterial growth on soft agar plates (tab Figure 4A) and bacterial growth in LB medium of various dilutions (tab Figure 4B).
- https://doi.org/10.7554/eLife.32035.009
Figure 5
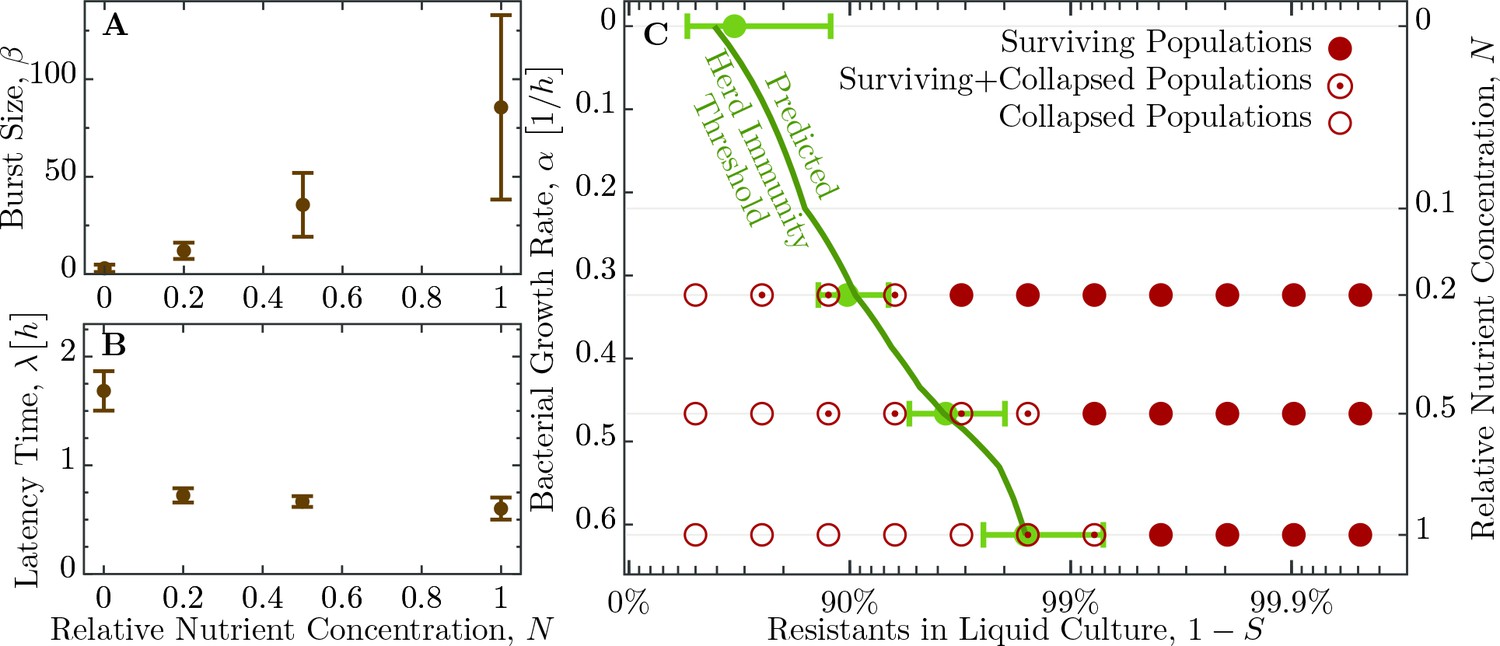
Herd immunity threshold in liquid culture as a function of bacterial growth.
(A) Phage burst size () change as a function of nutrient concentrations. (B) Latent period () increase across the range of nutrient concentrations. Values for and are given in Table 2. (C) Population survival analysis upon phage challenge as a function of the fraction of resistant cells and the intrinsic growth rate (nutrient availability, ). Bacteria survive the phage infection (full circles), collapse (empty circles), or exhibit both outcomes (circled dots) in the to replicates, done in independent batches. Light green errorbars at investigated dilutions of LB show the expected value and its standard deviation of , Equation 5, with standard error propagation of the measured , and . In order to interpolate herd immunity to dilutions not probed in experiments (dark green line), we use a second order polynomial in to fit the data for both and , which excellently matches the average measurements (a naive linear fit displays non-negligible deviations and non-sensical negative values). In addition, the dependence is obtained by numerically inverting the Monod growth rate dependence, see Equation 9. The data presented in this figure can be found in Figure 5—source data 1 and Figure 5—source data 2.
-
Figure 5—source data 1
Figure 5A B source data: Phage burst sizes and latent period in different dilutions of the growth medium.
- https://doi.org/10.7554/eLife.32035.011
-
Figure 5—source data 2
Figure 5C: Fraction of surviving populations in different dilutions of the growth medium.
- https://doi.org/10.7554/eLife.32035.012
Figure 6

Properties of expanding phage epidemics on bacterial lawns.
(A) Example of plaque morphology and size change over hours for populations with 50% resistant cells (top) and a control with 100% susceptible cells (bottom). (B) Mean plaque size area through time. Colors indicate the different fraction of resistant individuals (color coding as in panel C). Note the distinct two phases of plaque growth – initially, phage grow fast with exponentially growing bacteria but slow once the nutrients are depleted (10 hr). The plaque radius is reduced, relative to 100% susceptible population, even when only a small fraction of resistant individuals are in the population. (C) Final plaque radius at 48 . Green line shows the prediction from the model for the plaque radius . Grey numbers indicate the number of plaques measured. Error bars indicate the standard deviations. The data presented in this figure can be found in Figure 6—source data 1.
-
Figure 6—source data 1
Plaque radii for all population compositions and time points.
- https://doi.org/10.7554/eLife.32035.015
Figure 7
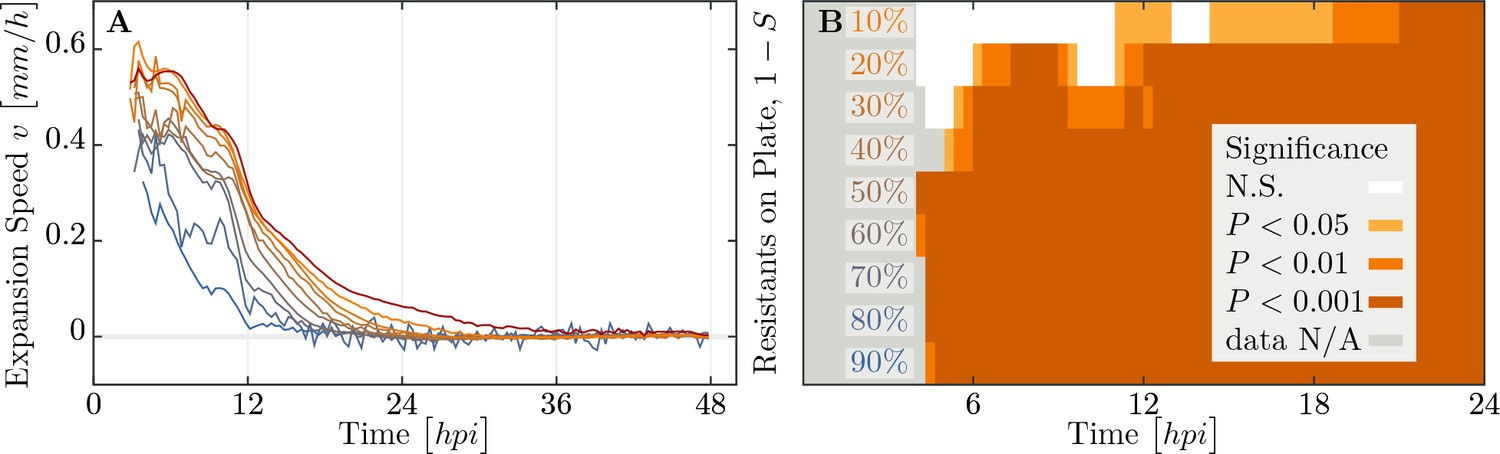
Speed of phage epidemic expansion on bacterial lawns.
(A) Speed of expanding phage epidemics for all population compositions is initially high, before it drops once nutrients are depleted at around (hours post infection). (B) Plaque speed significance. Comparing speeds of plaque spread with the 100% susceptible control. Linear regression of a sliding window spanning 4 hours of the radius sizes was calculated for all individual plaques and all compositions of the populations between and . Slopes of the linear regressions for all compositions of the populations were compared using a two-sided heteroscedastic t-test against the 100% susceptible dataset. The data presented in this figure can be found in Figure 7—source data 1.
-
Figure 7—source data 1
Speed of plaque expansion in populations consisting of varying proportions of resistant to susceptible bacteria.
- https://doi.org/10.7554/eLife.32035.017
Figure 8
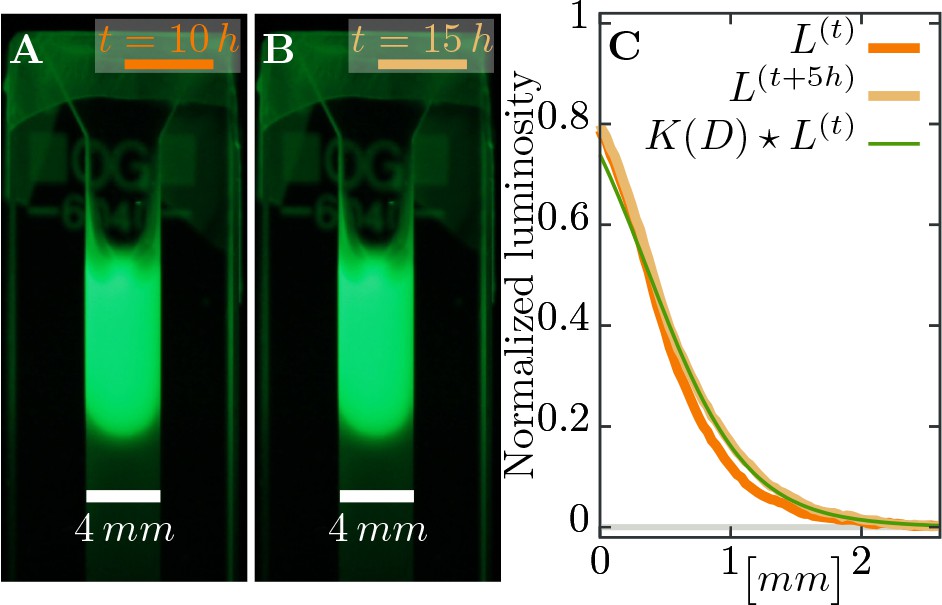
Estimating diffusion constant of phages.
(A), (B) Phage are slowly expanding on agar which can be observed via their fluorescence. Pictures are taken apart. (C) The diffusion constant can be estimated as best-fit parameter in a heat kernel propagates the fluorescence profile at time forward (via a convolution to “smear” out the signal) to the profile at the next measured time point. The difference between the expected change and the actual profile is quantified as total squared deviation, see Equation 10, which we minimize to obtain . Consequently, we can estimate the diffusion constant as . The green line uses this estimated parameter and shows the change between the profile at (orange line) and the profile at (light brown line), assuming diffusive spread of phages. See Materials and methods for more information.
Appendix 1—figure 1
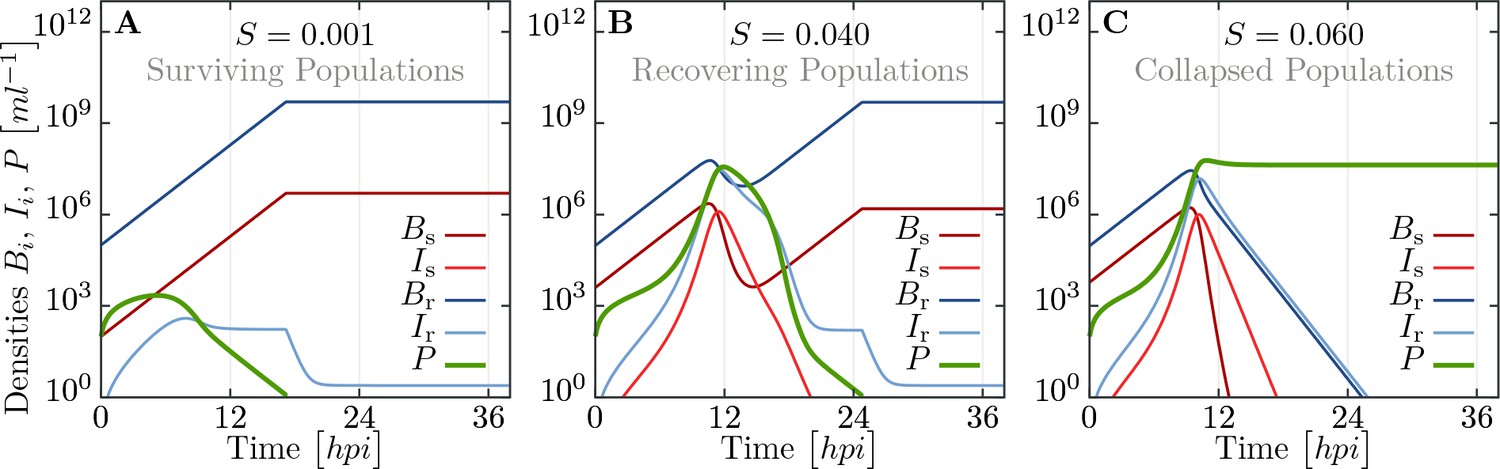
Simulated trajectories for all populations in liquid culture for the extended model, including infected and recovering bacteria.
Trajectories are obtained by numerically integrating equations Equation 12, using parameters listed in Appendix 1—table 1 and additionally , , and . (A) For population compositions with a large majority of resistant cells (), phages get wiped out fast. (B) For intermediate (close to parameters where we observe both, collapsed and surviving, populations, see Figure 3), the populations exhibit a complex, non-monotonic trajectory. After fast initial growth of phages, bacterial populations decay but ultimately can recover. (C) If the fraction of susceptibles is too large (), the whole bacterial population is infected and succumbs to the overwhelming phage infection. See supporting text for more detailed information.
Appendix 2—figure 1
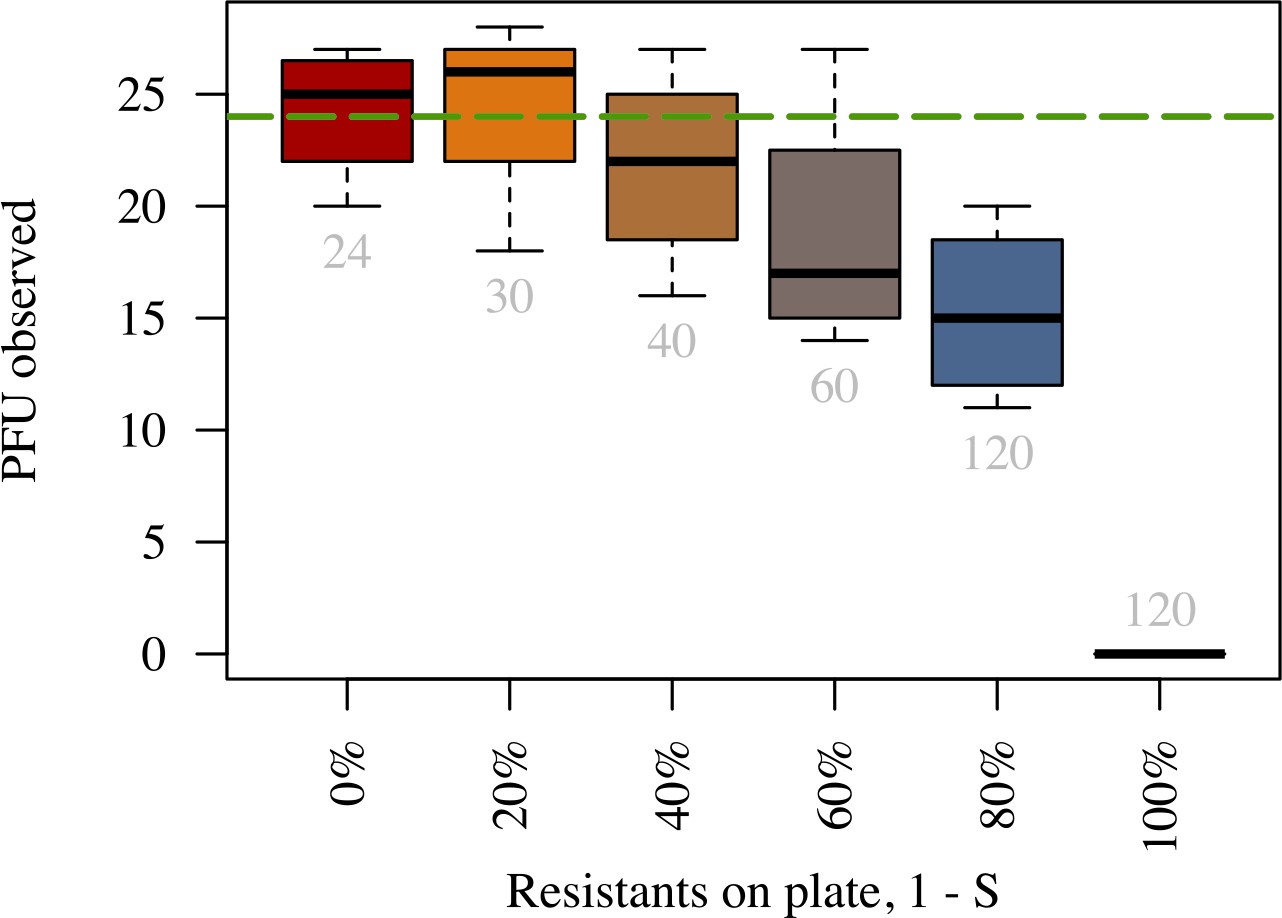
Number of plaques declines faster than proportionally to the fraction of resistant bacteria.
Number of plaque forming units observed on a plate (y-axis) for different proportions of resistant bacteria (x-axis). Grey numbers below each boxplot indicate the average number of phages inoculated in the respective treatment. The numbers of phages inoculated were chosen to retain the expected number of plaques on the plate (green dashed line) as in the 0% resistant treatment (red boxplot). Plates were prepared using identical procedure as in Time-lapse imaging of plaque growth (see Materials and methods). The data presented in this figure can be found in Appendix 2—figure 1—source data 1.
-
Appendix 2—figure 1—source data 1
Measurements of plaque numbers in populations consisting of varying proportions of resistant to susceptible bacteria.
- https://doi.org/10.7554/eLife.32035.027
Appendix 3—figure 1
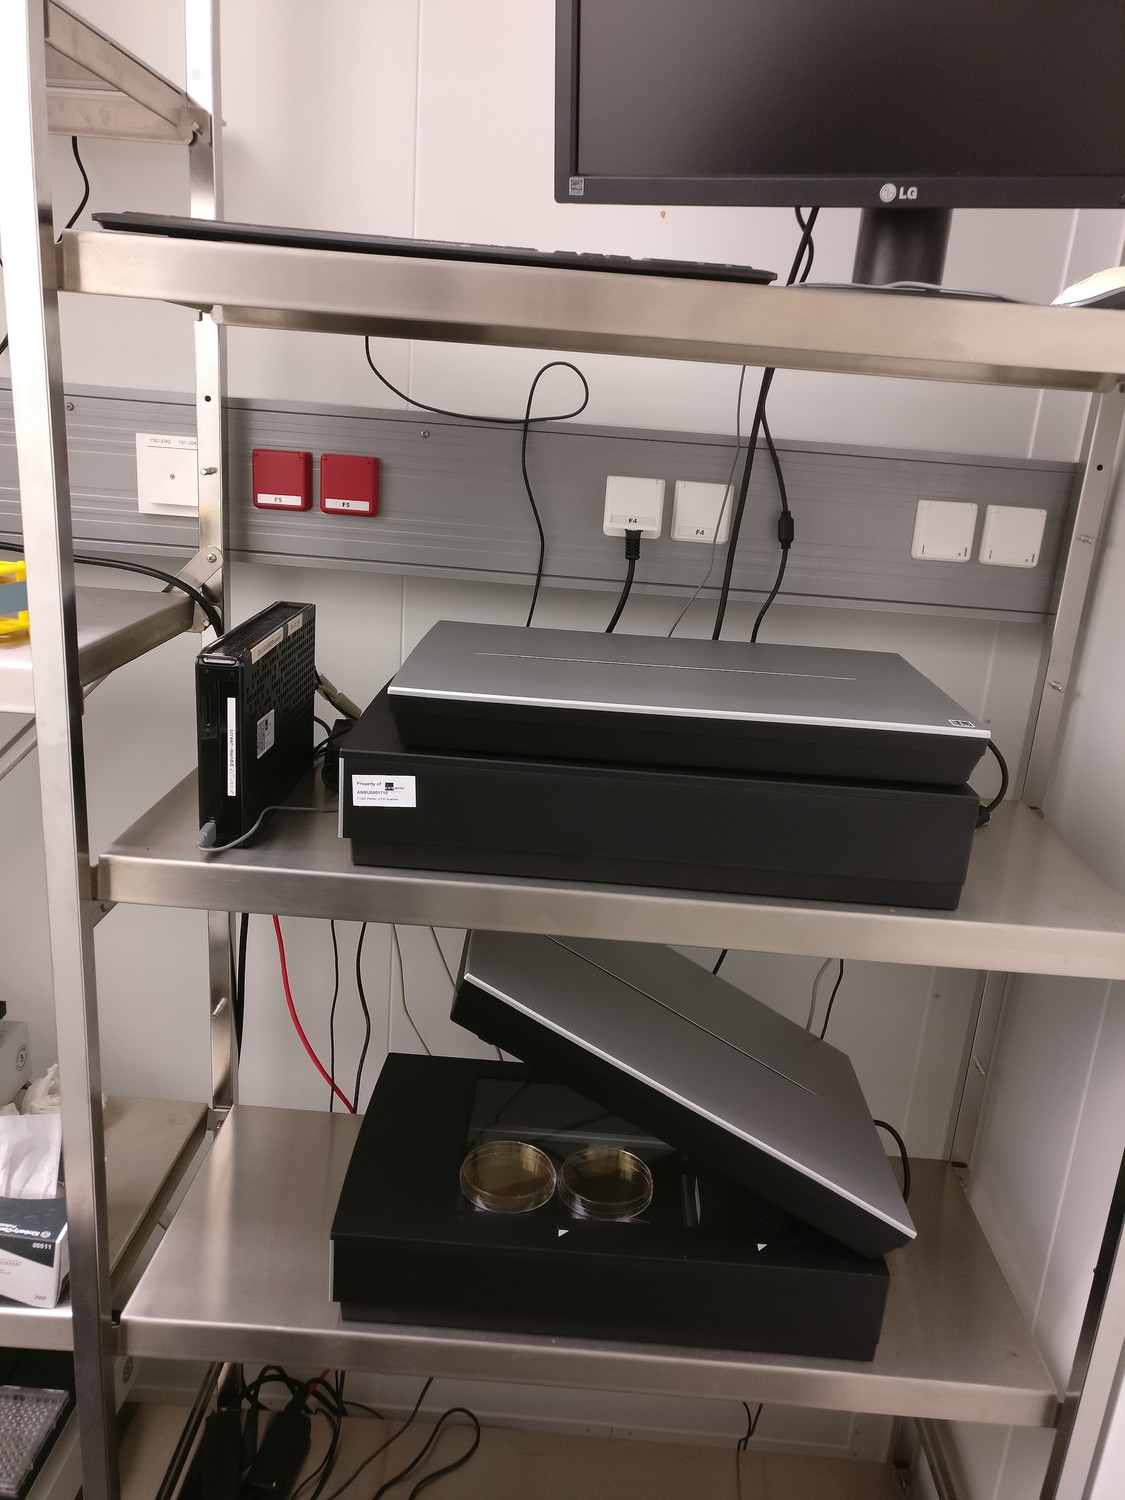
Image of the scanner system.
Photograph of the scanner system used for time-lapse imaging of phage spread in spatially structured bacterial populations. Three scanners (Epson Perfection V600 Photo Scanner) simultaneously scanned 12 plates in total every 20 min in for 48 hr per experiment.
Tables
Table 1
Estimated parameters for bacterial growth using Monod kinetics.
Undiluted LB medium () is assumed to have nutrients ( Tryptone, yeast extract). The full dataset is shown in Figure 4.
| Estimate | Units | |
|---|---|---|
| Dilution of LB |
Table 2
Estimated parameters for phage growth.
See also Figure 5A,B.
| Medium | Dilution | Latent period | Burst size | Burst size/hour |
|---|---|---|---|---|
| LB 0 | ||||
| LB 20 | ||||
| LB 50 | ||||
| LB 100 |
Key resources table
Table of key strains, reagents and software used in this study.
https://doi.org/10.7554/eLife.32035.020| Reagent type (species) or resource | Designation | Source or reference | Identifiers | Additional information |
|---|---|---|---|---|
| gene (Streptococcus pyogenes SF370) | cas9 | National Center for Biotechnology Information | NCBI:NC_002737.2; gene_ID:901176; RRID:SCR_006472 | Gene symbol SPy_1046 |
| strain, strain background (Escherichia coli) | E. coli K12 MG1655 | Own collection | NA | |
| strain, strain background (Bacteriophage T7) | E. coli bacteriophage T7 | ATCC Collection | ATCC:BAA-1025-B2; RRID:SCR_001672 | |
| recombinant DNA reagent | pCas9 | Addgene Vector Database | Addgene:42876; RRID:SCR_005907 | pCas9 plasmid was a gift from Luciano Marraffini |
| recombinant DNA reagent | pCas9T7resistant | this paper | NA | Plasmid derived from pCas9 |
| commercial assay or kit | PureYield Plasmid Miniprep System | Promega | Promega:A1223; RRID:SCR_006724 | |
| chemical compound, drug | Chloramphenicol | Sigma-Aldrich | Sigma-Aldrich:C0378-5G; RRID:SCR_008988 | |
| software, algorithm | PerkinElmer Volocity v6.3 | RRID:SCR_002668 | Volocity 3D Image Analysis Software | |
| software, algorithm | Fiji v1.0 | doi: 10.1038/nmeth.2019 | RRID:SCR_002285 | Image processing package of ImageJ |
| software, algorithm | RStudio 1.0.153 | RRID:SCR_000432 | Software for the R statistical computing | |
| software, algorithm | Python 3.6.3 | RRID:SCR_008394 | Python programming language | |
| software, algorithm | Model source code | doi: 10.5281/zenodo.1038582 | RRID:SCR_004129 | Zenodo repository |
Appendix 1—table 1
Parameters used in simulations shown in Appendix 1—figure 1.
https://doi.org/10.7554/eLife.32035.024Additional files
-
Transparent reporting form
- https://doi.org/10.7554/eLife.32035.021
-
Appendix 2—figure 1—source data 1
Measurements of plaque numbers in populations consisting of varying proportions of resistant to susceptible bacteria.
- https://doi.org/10.7554/eLife.32035.027
Download links
A two-part list of links to download the article, or parts of the article, in various formats.
Downloads (link to download the article as PDF)
Open citations (links to open the citations from this article in various online reference manager services)
Cite this article (links to download the citations from this article in formats compatible with various reference manager tools)
CRISPR-based herd immunity can limit phage epidemics in bacterial populations
eLife 7:e32035.
https://doi.org/10.7554/eLife.32035


