Neuronal activity determines distinct gliotransmitter release from a single astrocyte
- University of Minnesota, United States
Figures
Figure 1
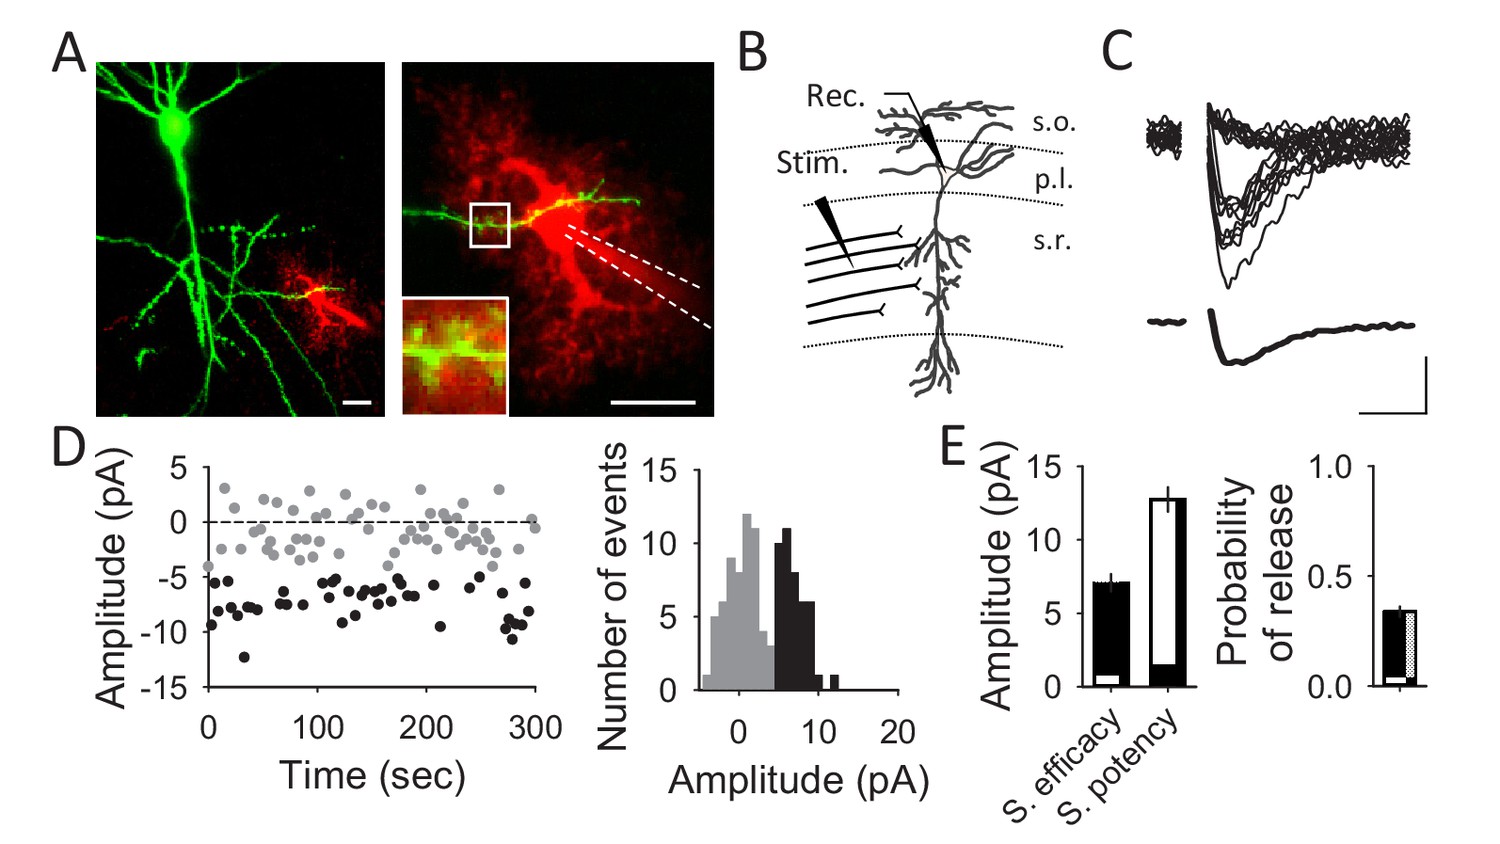
Unitary CA3-CA1 synapse recordings from hippocampal pyramidal neurons.
(A) Fluorescent images showing a pyramidal cell expressing GFP (green) and an astrocyte loaded with Texas Red (red) through the recording pipette. Scale bars: 20 µm. (B) Schematic drawing depicting a recorded CA1 pyramidal neuron and the stimulating electrode. (C) Representative EPSC traces obtained with the minimal stimulation technique showing successes and failures in neurotransmitter release (n = 20; upper panel) and the average trace acquired from those traces (synaptic efficacy; lower panel). Scale bars: 5 pA, 10 ms. (D) EPSC amplitudes of a representative synapse that showed failures (grey) and successes (black) in neurotransmitter release (left panel) and its corresponding histogram (right). (E) Synaptic parameters (synaptic efficacy, synaptic potency and probability of release) obtained from representative recordings (n = 40 synapses).
Figure 2 with 2 supplements
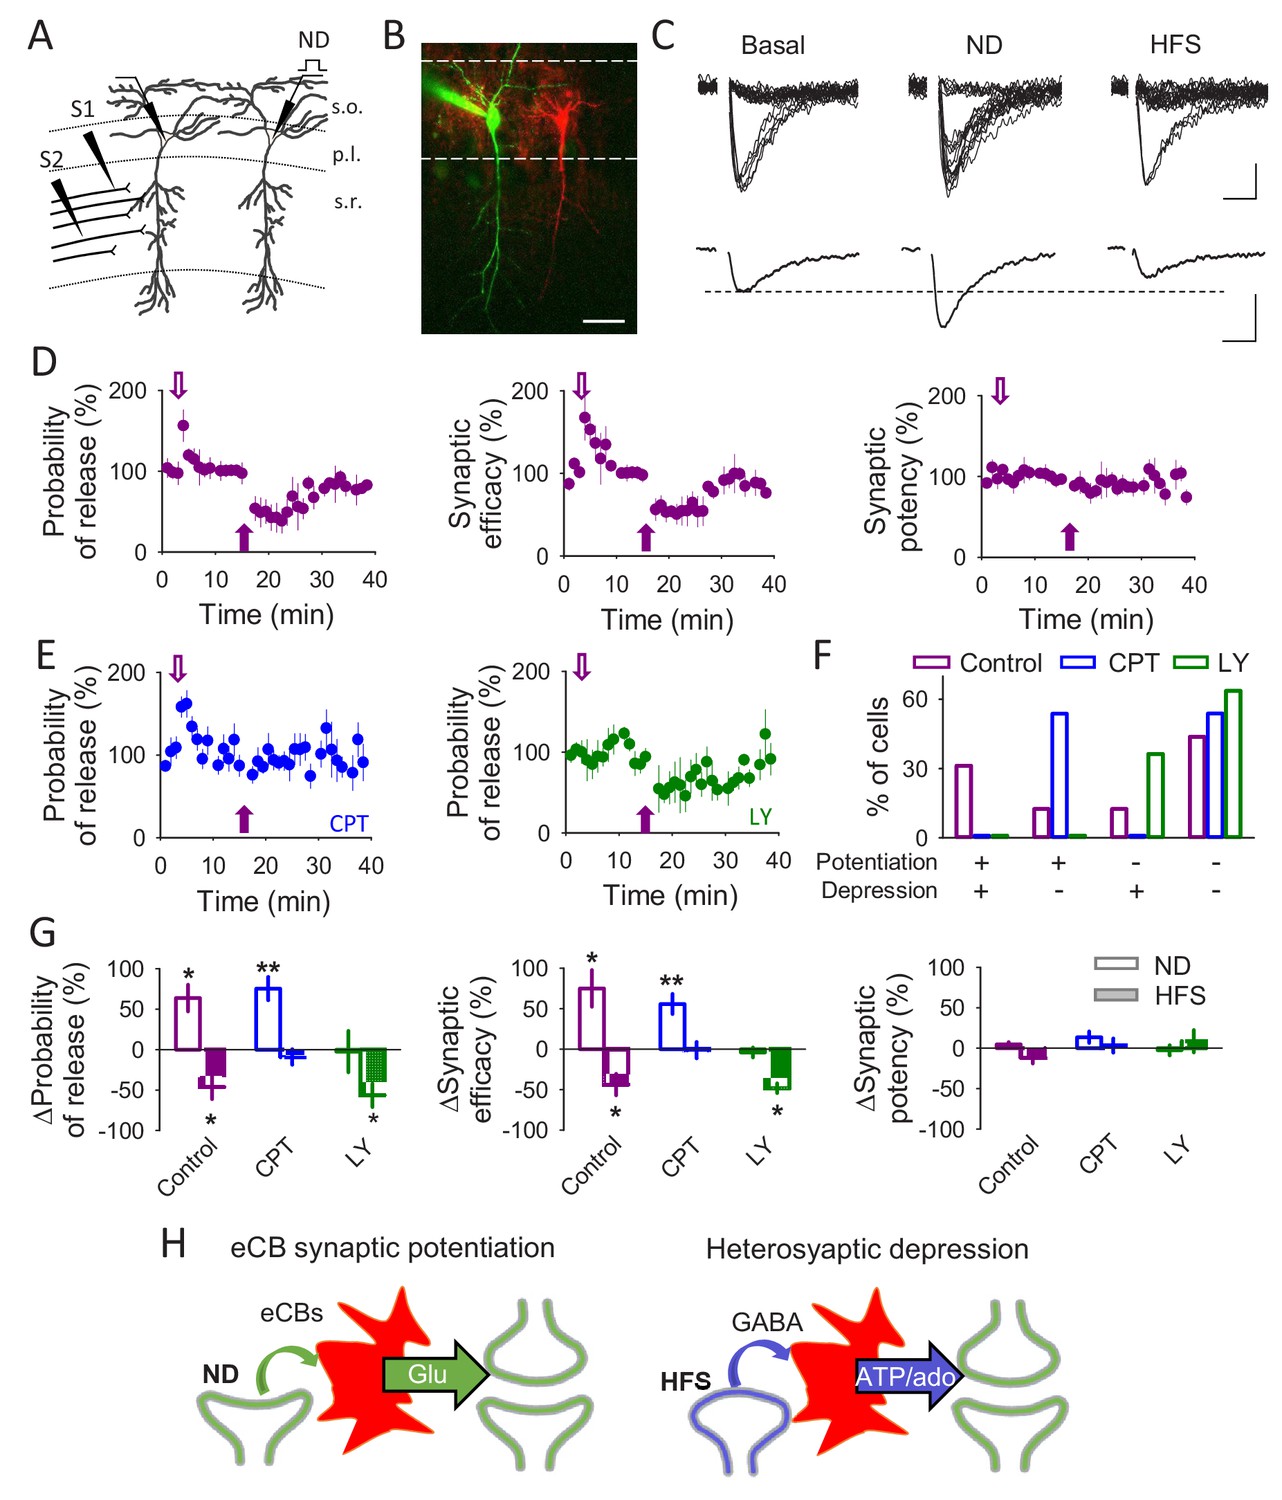
A single synapse can be modulated by different gliotransmitters.
(A) Schematic drawing depicting paired recordings from CA1 pyramidal neurons and the stimulating electrodes (S1 and S2). (B) Fluorescent image showing two pyramidal cells, one loaded with Texas Red (red) and the other one with Alexa 488 (green). Scale bar: 40 µm. (C) Representative EPSC traces (n = 20) and their average traces during basal conditions, after a neuronal depolarization (ND) and after a HFS. Scale bars: 5 pA, 10 ms. (D) Synaptic parameters vs time in control conditions. Open and filled arrows indicate ND and HFS, respectively. (E) Probability of release vs time in the presence of CPT (2 µM) or LY367385 (100 µM). Open and filled arrows indicate ND and HFS, respectively. (F) Percentage of cells that underwent synaptic potentiation, depression, both or no change in the different conditions. (G) Relative changes in synaptic parameters after ND and HFS in control conditions (n = 5) and in the presence of CPT (2 µM; n = 6) or LY367385 (100 µM; n = 4). (H) Schematic summary depicting the signaling pathways leading to eCB-mediated synaptic potentiation or heterosynaptic depression. Data are represented as mean ± s.e.m., *p<0.05, **p<0.01.
Figure 2—figure supplement 1
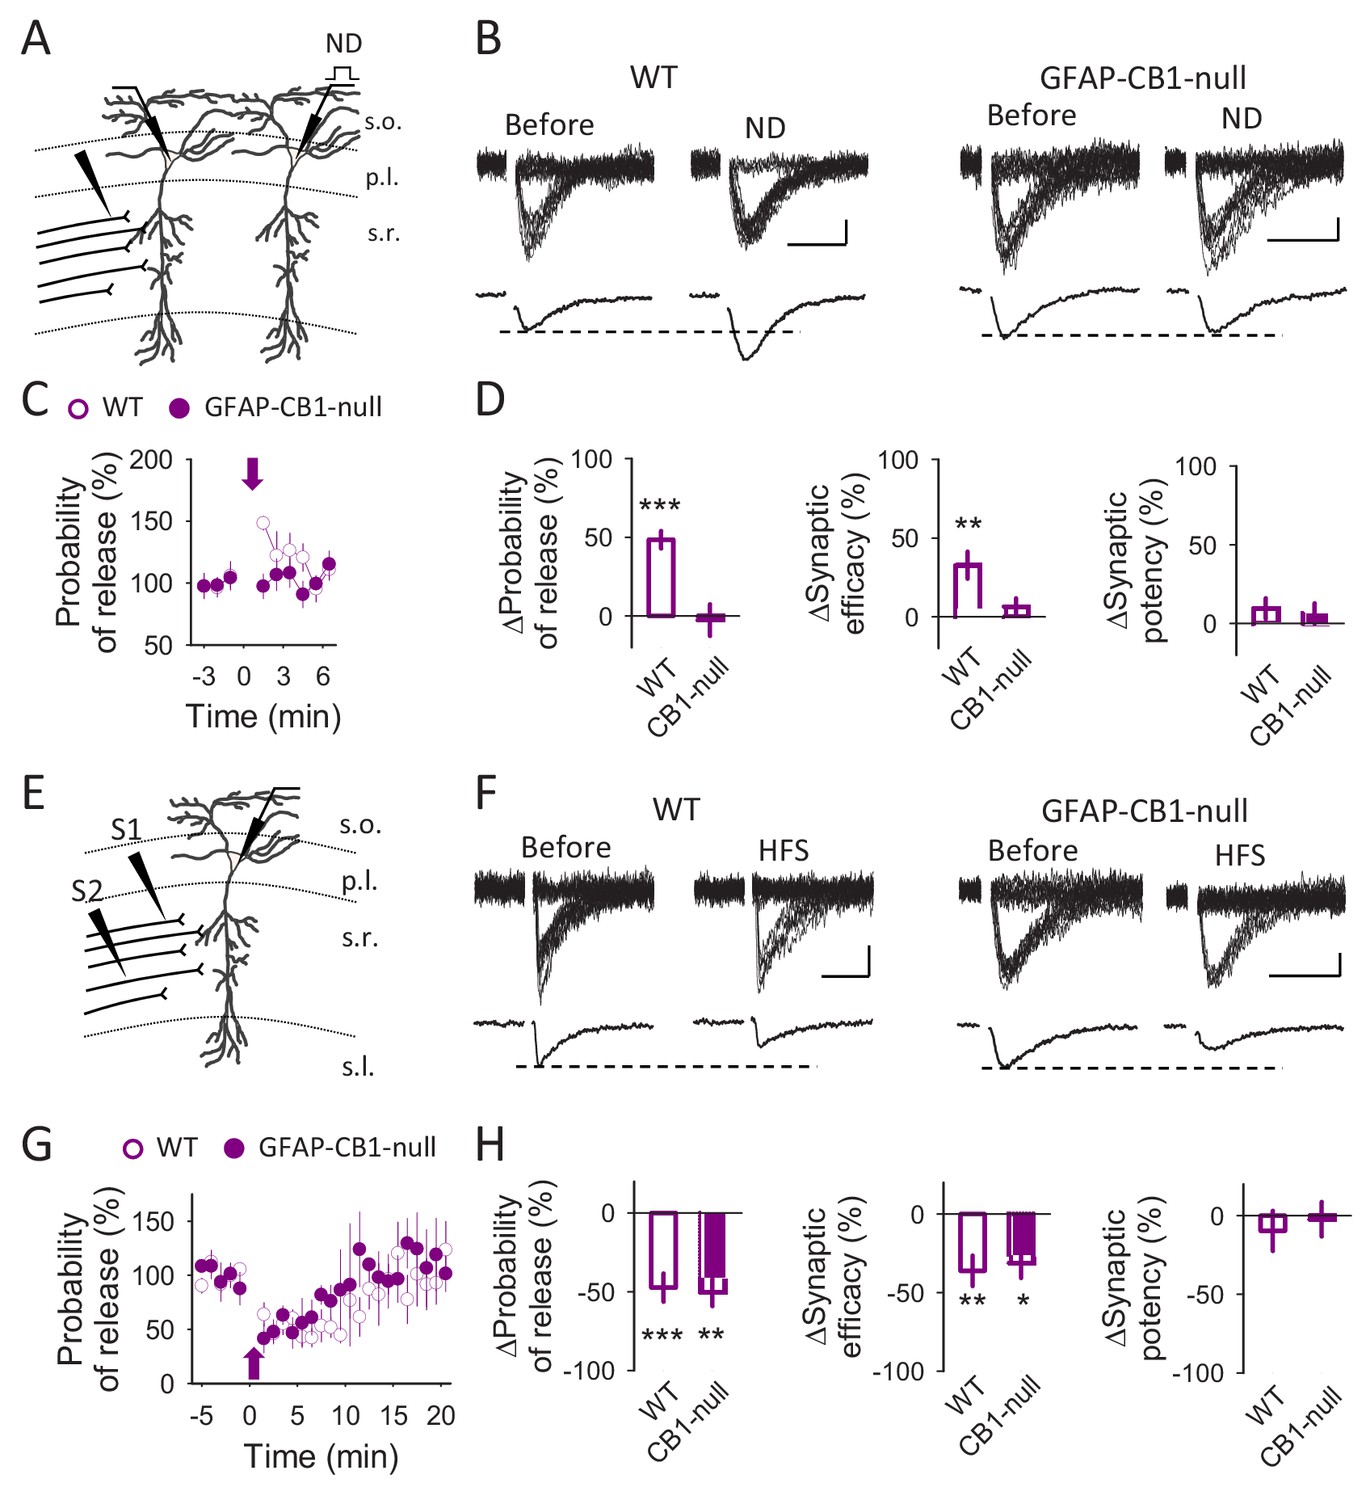
eCBs mediate glutamate-induced synaptic potentiation but not heterosynaptic depression.
(A) Schematic drawing depicting paired recordings from two CA1 pyramidal neurons and the stimulating electrode. (B) Representative EPSC traces before and after neuronal depolarization (ND) recorded from WT and GFAP-CB1-null mice. Scale bars: 5 pA, 20 ms. (C) Probability of release vs time. Zero time correspond with ND (arrow). (D) Relative changes in synaptic parameters after ND in WT (n = 8) and GFAP-CB1-null (n = 10) mice. (E) Schematic drawing depicting CA1 pyramidal neuron recording and the two stimulating electrodes. (F) Representative EPSC traces before and after neuronal high frequency stimulation (HFS) recorded from WT and GFAP-CB1-null mice. Scale bars: 5 pA, 20 ms. (G) Probability of release vs time. Zero time correspond with HFS (arrow). (H) Relative changes in synaptic parameters after HFS in WT (n = 9) and GFAP-CB1-null (n = 5) mice. Data are represented as mean ± s.e.m., *p<0.05, **p<0.01, ***p<0.001.
Figure 2—figure supplement 2
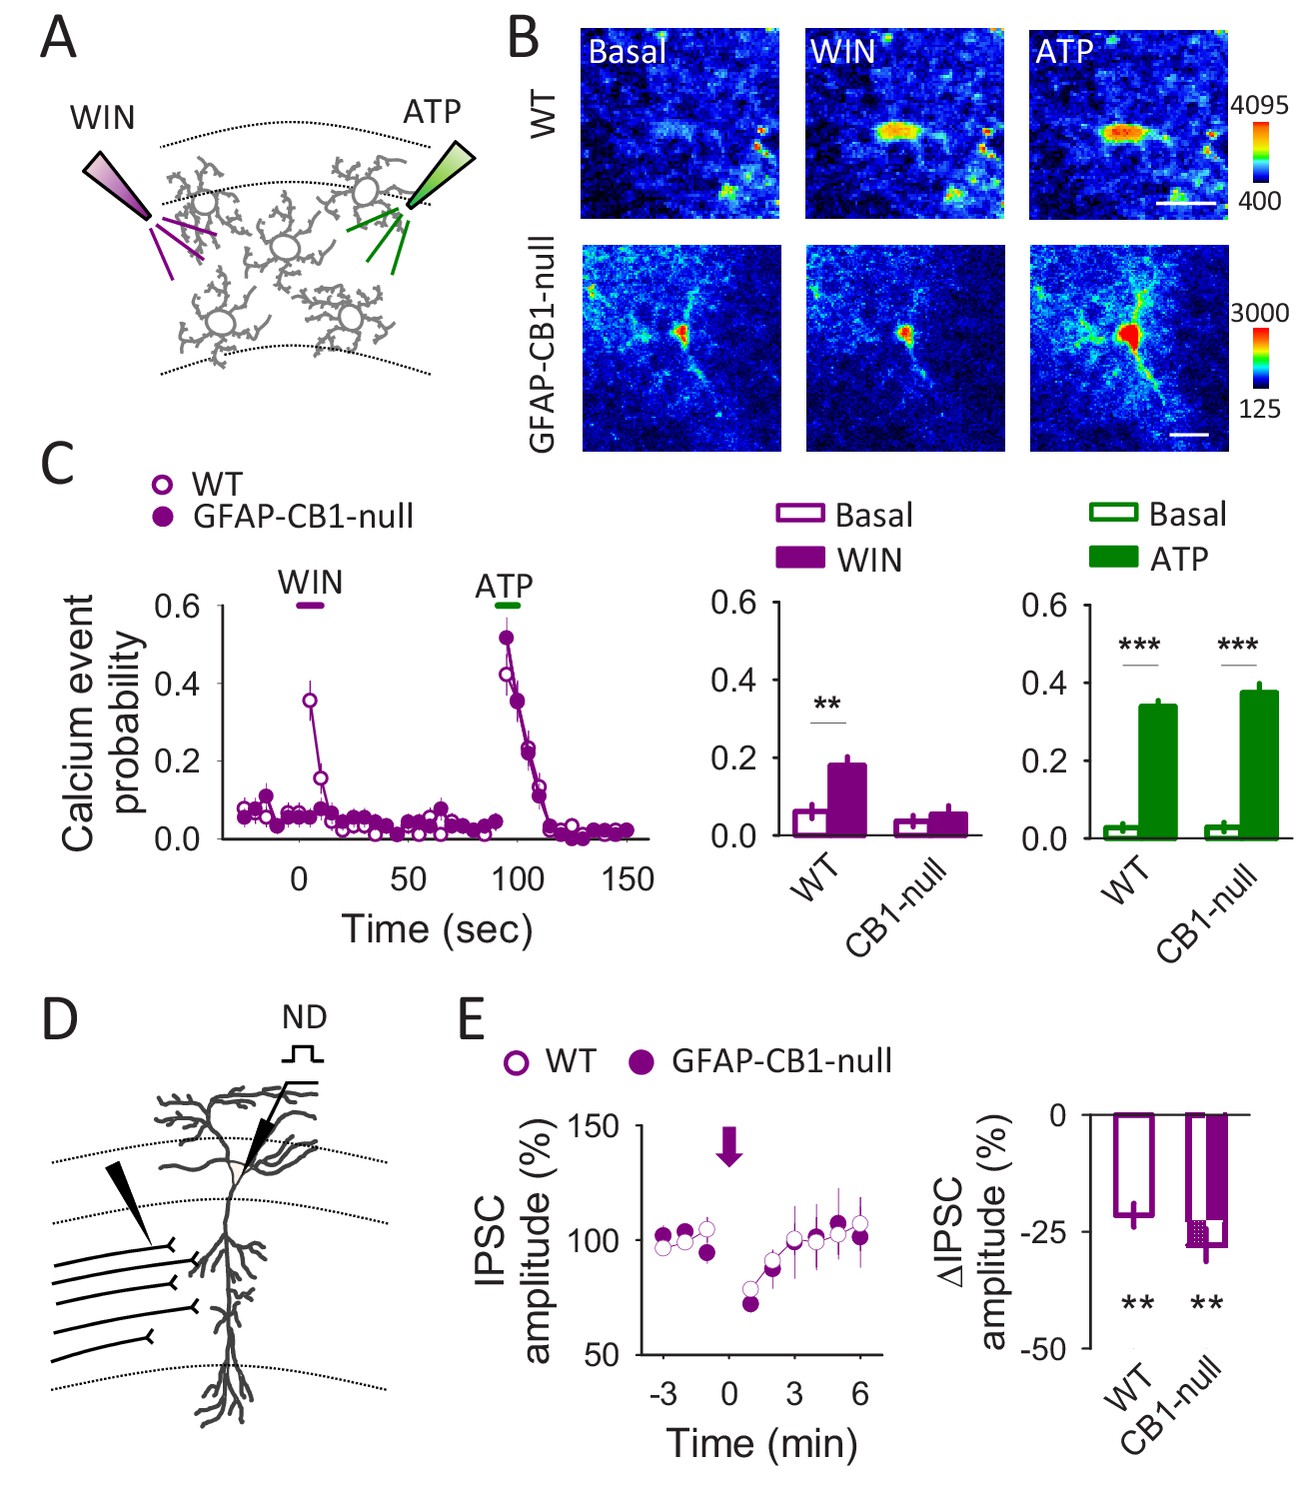
Astroglial specific GFAP-CB1-null mice shows impairments in astrocytic responsiveness to CB1 receptor agonists but not in the neuronal CB1 receptor dependent depolarization-induced suppression of inhibition (DSI).
(A) Scheme depicting local application of WIN55,212–2 (500 µM) and ATP (2 mM) through glass pipettes. (B) Pseudocolor images showing the fluorescence intensities of Fluo4-AM of 2 astrocytes recorded from WT and GFAP-CB1-null mice before (basal) and after WIN55,212–2 or ATP application. Scale bars: 15 µm. (C) Calcium event probability in response to WIN55,212–2 and ATP recorded from WT (n = 90 astrocytes) and GFAP-CB1-null mice (n = 91 astrocytes). Note that astrocytes from GFAP-CB1-null mice still respond to ATP but not to WIN55,212–2. (D) Scheme depicting the recorded CA1 pyramidal neuron and the SC stimulating electrode. (E) IPSC amplitude vs time (left panel) and normalized IPSC change in response to neuronal depolarization (right panel) in WT (n = 5) and GFAP-CB1-null mice (n = 5). Zero time corresponds with the neuronal depolarization (arrow).
Figure 3 with 3 supplements
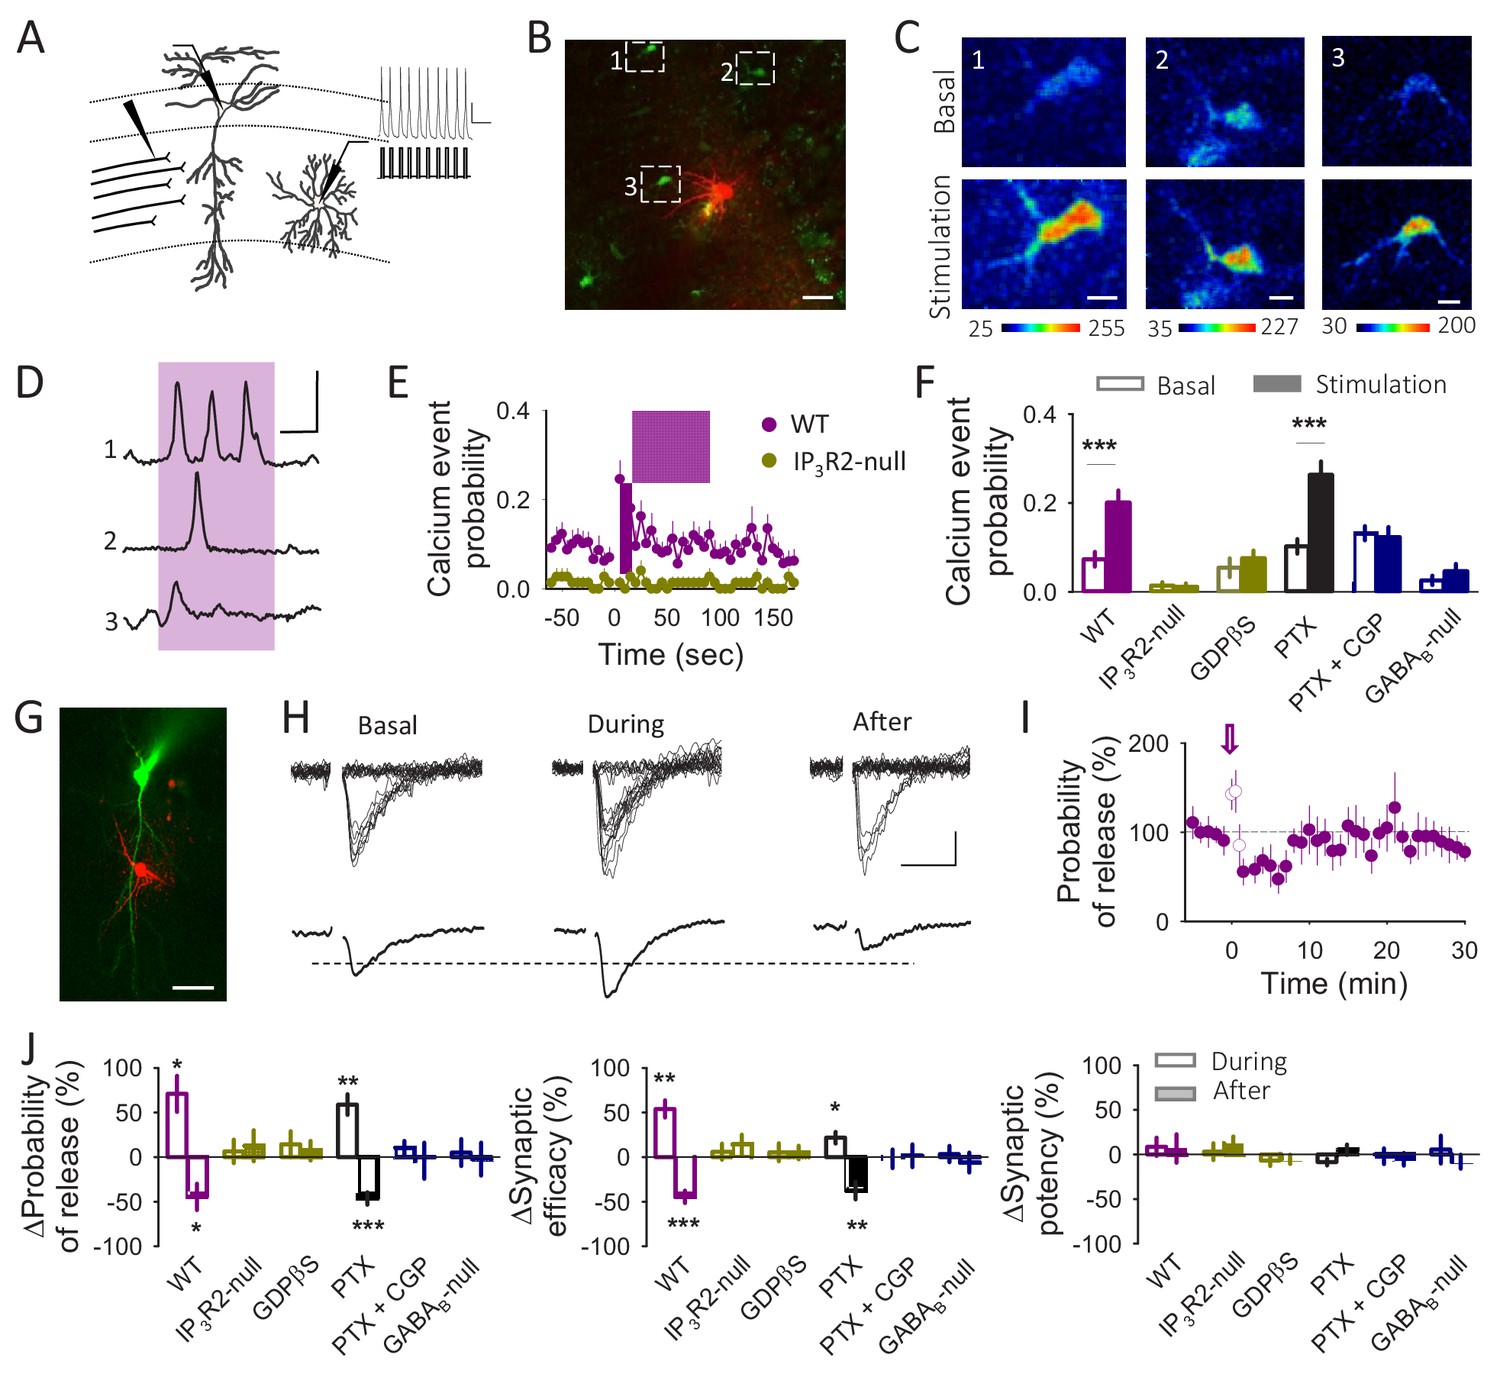
Astrocytes differentially modulate synaptic transmission in response to neuronal activity.
(A) Schematic drawing depicting paired recordings from a CA1 pyramidal neuron and a S. R. interneuron and the stimulating electrode. Representative traces showing the interneuron depolarization train are displayed as insets. (B) Fluorescence image showing an interneuron loaded with Texas Red (Red) and astrocytes loaded with Fluo4-AM (Green). Scale bar: 40 µm. (C) Pseudocolor images showing the fluorescence intensities of Fluo4-AM of the 3 astrocytes marked in panel B before (basal) and during the interneuron stimulation. Scale bars: 10 µm. (D) Representative calcium traces obtained from the 3 astrocytes marked in panel B. The pink area represents the stimulus duration (interneuron depolarization, 20 Hz during 90 s). Scale bar: 40%, 30 s. (E) Calcium event probability vs time in the WT and in the IP3R2-null mice. The pink area corresponds with the duration of the stimulus. (F) Changes in the calcium event probability 15 s before (Basal) and 15 s after the stimulation started (stimulation) in control conditions (n = 143 astrocytes), in the IP3R2-null mice (n = 74 astrocytes), in slices loaded with GDPßS (10 mM; n = 60 astroyctes), in the presence of picrotoxin (PTX, 50 µM; n = 157 astrocytes) or CGP54626 (1 µM; n = 85 astrocytes) and in the astroglial GABAB-null (n = 53 astrocytes). (G) Fluorescence image of a CA1 pyramidal cell loaded with Alexa 488 (Green) and an interneuron loaded with Texas Red (Red). Scale bar: 50 µm. (H) Representative EPSC traces (n = 20) and their average traces before (basal), during and after the interneuron depolarization train. Scale bars: 5 pA, 20 ms. (I) Synaptic parameters vs time in control conditions. Zero time corresponds with the beginning of the IN depolarization train (arrow). The open circles represent the synaptic parameters measured during the IN depolarization train. (J) Relative changes in synaptic parameters during and after the IN depolarization train in control conditions (n = 5), in the IP3R2-null mice (n = 9), in slices loaded with GDPßS (n = 7), in the presence of Picrotoxin (PTX, 50 µM; n = 6), CGP54626 (1 µM; n = 9) and in the astroglial GABAB-null (n = 9). Data are represented as mean ± s.e.m., *p<0.05, **p<0.01, ***p<0.001.
Figure 3—figure supplement 1
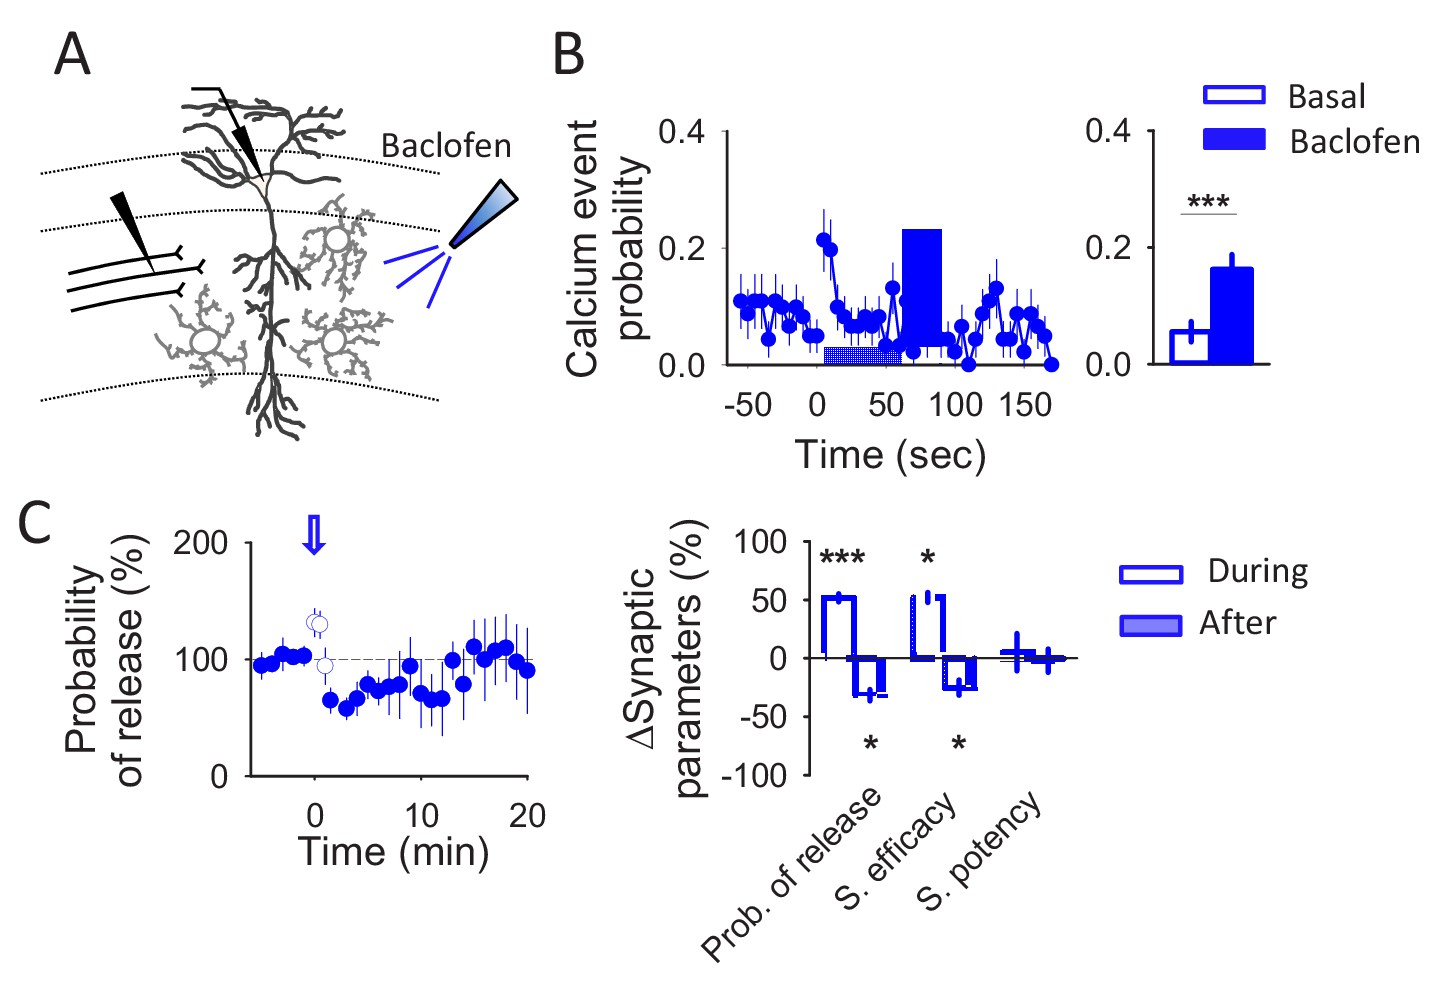
Baclofen application mimics interneuron depolarization.
(A) Scheme depicting the recorded CA1 pyramidal neuron, the SC stimulating electrode and the local application of baclofen (200 µM). (B) Calcium event probability in response to baclofen (n = 46 astrocytes). Zero time and blue area indicate baclofen application. (C) Probability of release vs time (left panel) and relative synaptic changes (right panel) in response to baclofen (n = 6). Zero time indicate baclofen application (arrow). Data are represented as mean ± s.e.m., *p<0.05, ***p<0.001.
Figure 3—figure supplement 2
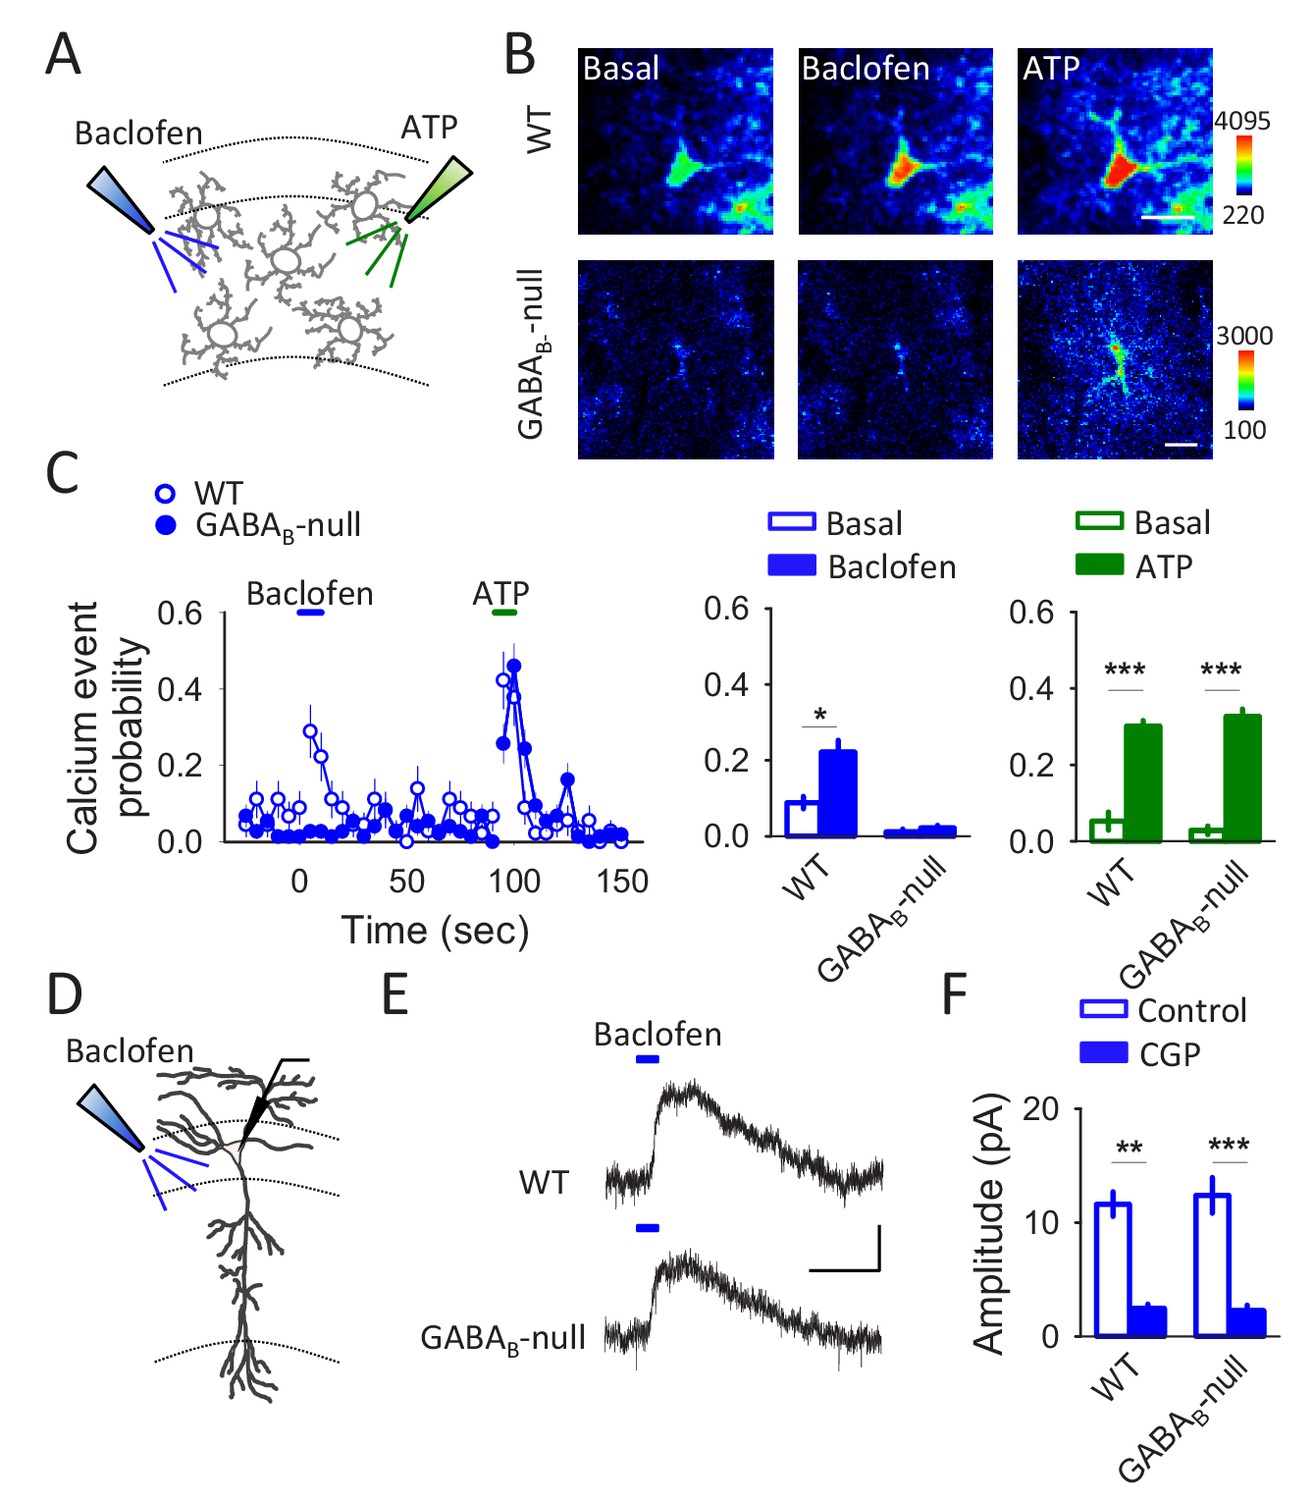
Astroglial specific GLAST-GABAB-null shows impairments in astrocytic responsiveness to GABAB receptor agonists but not in the neuronal responsiveness.
(A) Scheme depicting local application of baclofen (200 µM) and ATP (2 mM) through glass pipettes. (B) Pseudocolor images showing the fluorescence intensities of Fluo4-AM of 2 astrocytes recorded from WT and GABAB-null mice before (basal) and after baclofen or ATP application. Scale bars: 15 µm. (C) Calcium event probability in response to baclofen and ATP recorded from WT (n = 45 astrocytes) and GABAB-null mice (n = 74 astrocytes). Note that astrocytes from GABAB-null mice still respond to ATP but not to baclofen. (D) Scheme depicting the recorded CA1 pyramidal neuron and local application of baclofen (200 µM). (E) Representative traces of a GABAB-mediated current obtained from WT and GABAB-null mice. Scale bars: 10 pA, 15 s. (F) GABAB-mediated current amplitudes obtained from WT (n = 6) and GABAB-null mice (n = 5) in control conditions and in the presence of CGP54626.
Figure 3—figure supplement 3
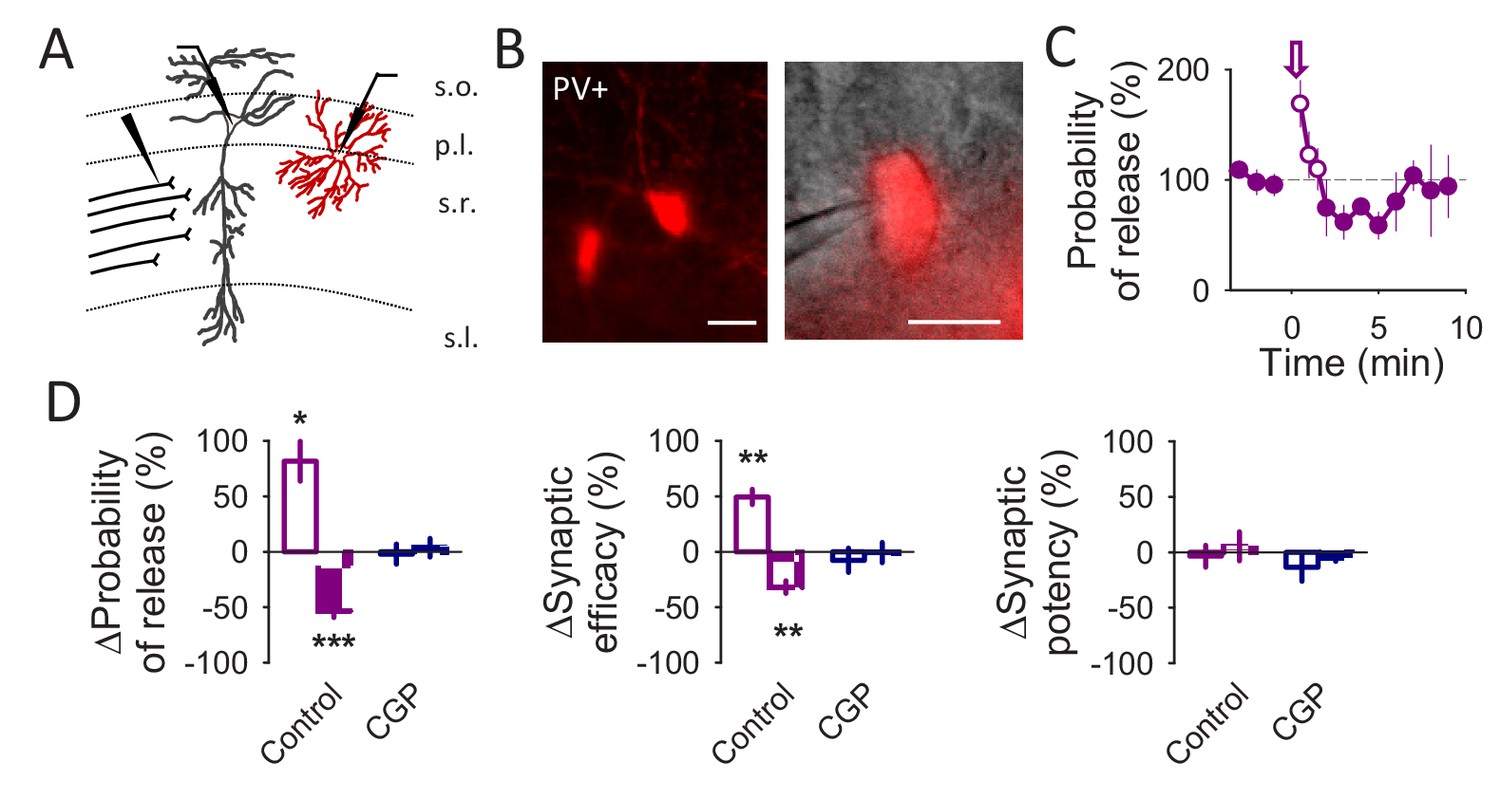
The biphasic synaptic regulation is not cell type specific.
(A) Schematic drawing depicting paired recordings from a CA1 pyramidal neuron and a PV+ interneuron (red) and the stimulating electrode. (B) Fluorescence image showing PV+ interneurons in the CA1 region (left panel) and a fluorescence and DIC merge image of a recorded PV+ interneuron (right panel). Scale bars: 15 µm. (C) Probability of release vs time. Zero time correspond with the beginning of the IN depolarization train (arrow). The open circles show the probability of release measured during the IN depolarization train. (D) Relative changes in synaptic parameters during and after the IN depolarization train in control conditions (n = 5) and in the presence of CGP54626 (1 µM; n = 5). Data are represented as mean ± s.e.m., *p<0.05, **p<0.01, ***p<0.001.
Figure 4 with 1 supplement
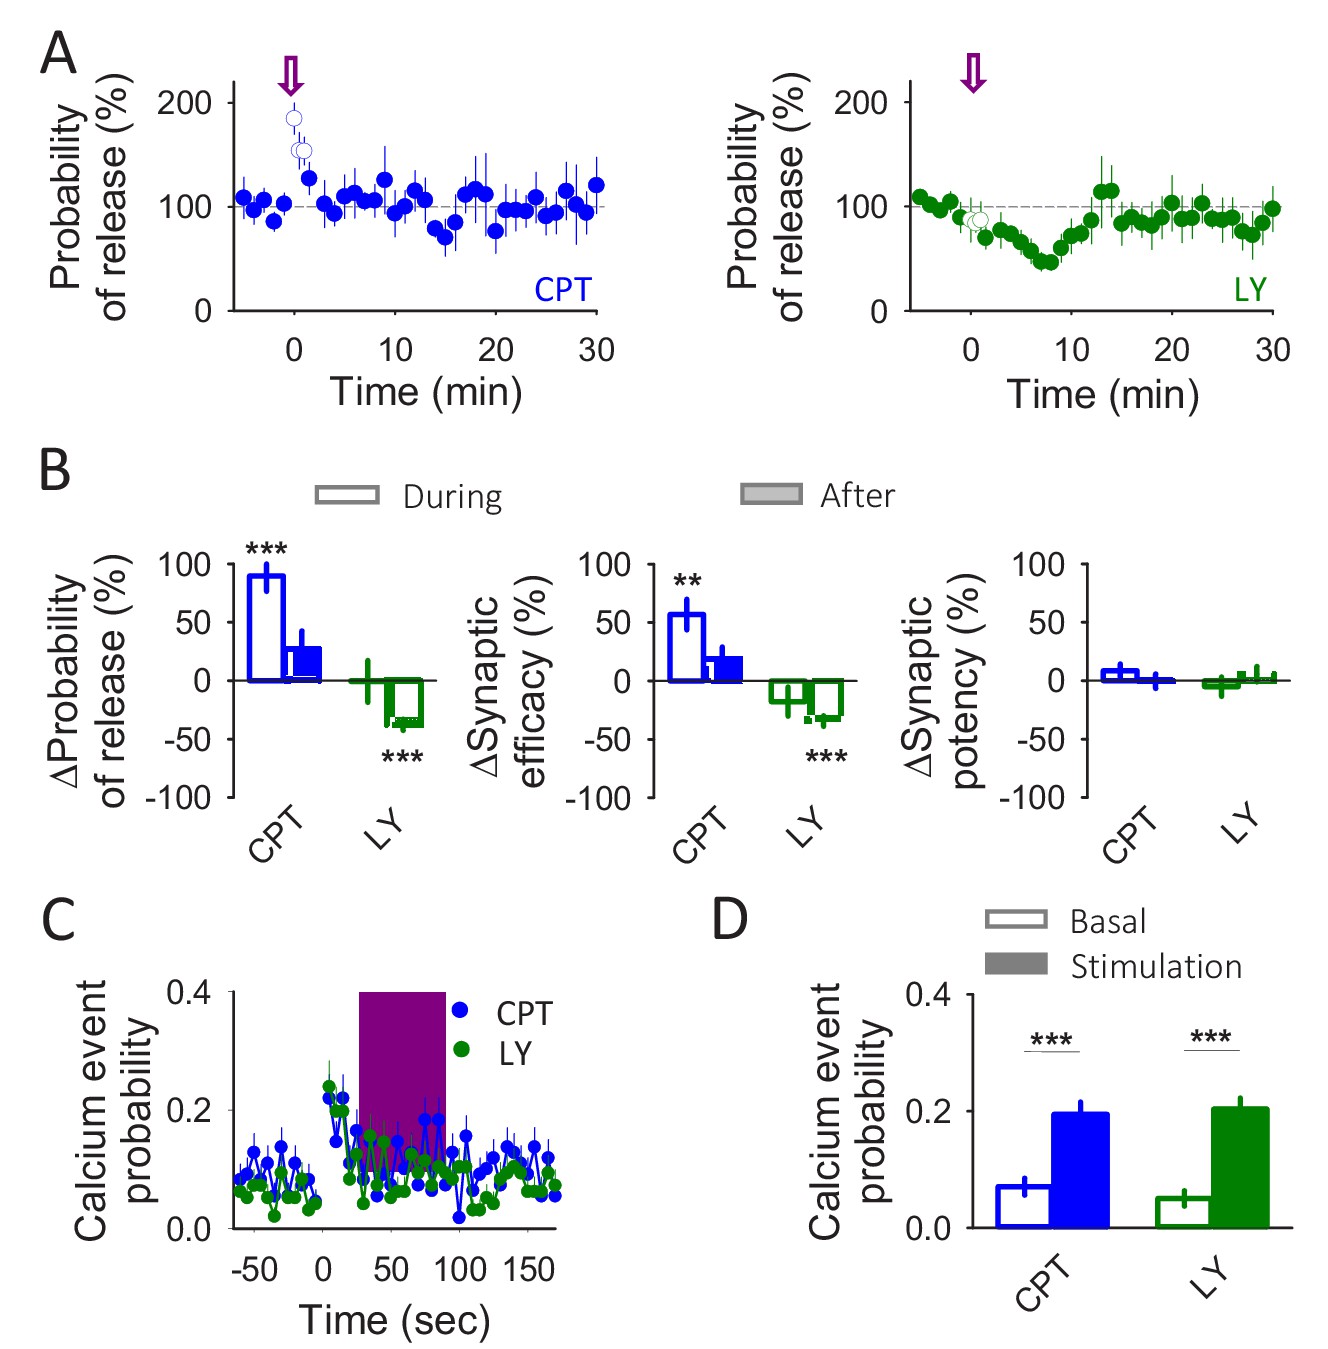
Astrocytes release glutamate and ATP/adenosine in response to neuronal activity.
(A) Synaptic parameters vs time in the presence of CPT (2 µM) or LY367385 (100 µM). Zero time correspond with the beginning of the IN depolarization train (arrow). The open circles show the synaptic parameters measured during the IN depolarization train. (B) Relative changes in synaptic parameters during and after the IN depolarization train in the presence of CPT (2 µM; n = 7) or LY367385 (100 µM; n = 4). (C) Calcium event probability vs time in the presence of CPT (2 µM) or LY367385 (100 µM). The pink area corresponds with the duration of the stimulus. (D) Changes in the calcium event probability 15 s before (basal) and 15 s after the stimulation started in the presence of CPT (2 µM; n = 109 astrocytes) or LY367385 (100 µM; n = 96 astrocytes). Data are represented as mean ± s.e.m., *p<0.05, **p<0.01, ***p<0.001.
Figure 4—figure supplement 1
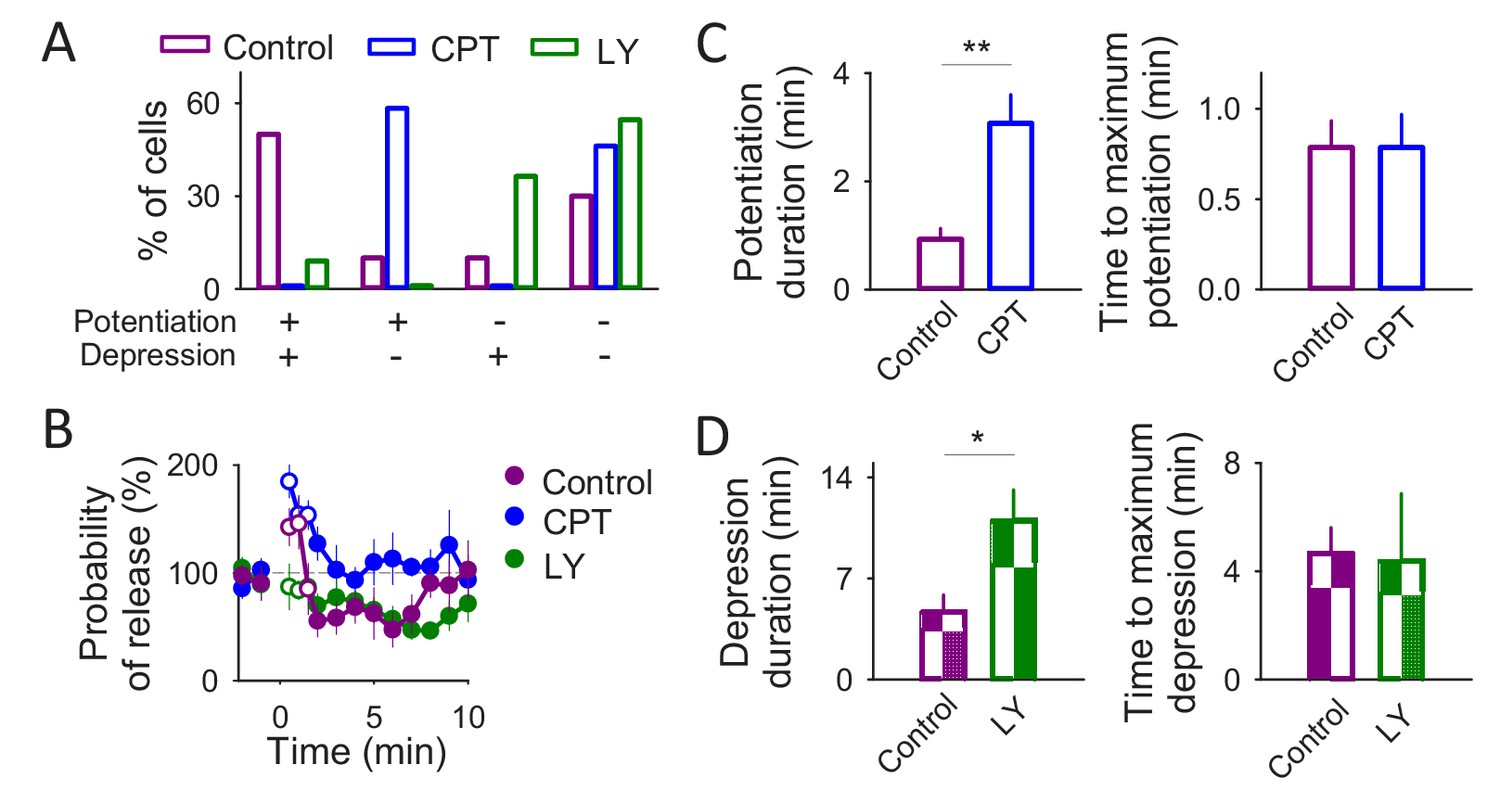
Astrocytes co-release glutamate and ATP.
(A) Number of cells that underwent synaptic potentiation, depression, both or no change after IN depolarization. (B) Synaptic parameters vs time in control conditions (n = 5) and in the presence of CPT (2 µM; n = 7) or LY367385 (100 µM; n = 4). Zero time corresponds with the beginning of the IN depolarization train. Open circles show the synaptic parameters measured during the IN depolarization train. (C) Potentiation duration and time to maximum potentiation in control conditions and in the presence of CPT (2 µM). (D) Depression duration and time to maximum depression in control conditions and in the presence of LY367385 (100 µM). Data are represented as mean ± s.e.m., *p<0.05, **p<0.01.
Figure 5

A single astrocyte regulates single synapses downstream of the GABAergic activity.
(A) Schematic drawing depicting paired recordings from one pyramidal neuron and one astrocyte filled with NP-EGTA, GDPβS filling the astrocytic network, and the stimulating electrode. (B) Fluorescence images of an astrocyte network loaded with biocytin through the patched astrocyte. Scale bars: 50 µm. (C) Pseudocolor images representing fluorescence intensities of a Fluo4 loaded astrocyte before (pre) and after (post) UV light-induced calcium uncaging. Scale bar: 10 µm. (D) Representative calcium traces of NP-EGTA loaded astrocyte (patched; purple trace) and other astrocytes in the field of view loaded with GDPßS (non-patched; black traces). The pink area represents the UV light stimulation. Scale bar: 50%, 30 s. (E) Calcium event probability vs time (left panel) and number of calcium oscillations per minute (right panel) observed in the non-patched astrocytes. (F) Probability of release vs time. Zero time corresponds with the beginning of the calcium uncaging (arrow). The open circles show the probability of release measured during UV light illumination. (G) Relative changes in synaptic parameters during and after UV light stimulation of astrocytes filled with NP-EGTA (5 mM) and GDPßS (10 mM) recoded form WT (n = 9) and IP3R2-null mice (n = 6) and in the absence of NP-EGTA (n = 7). Data are represented as mean ± s.e.m., *p<0.05, **p<0.01, ***p<0.001.
Figure 6
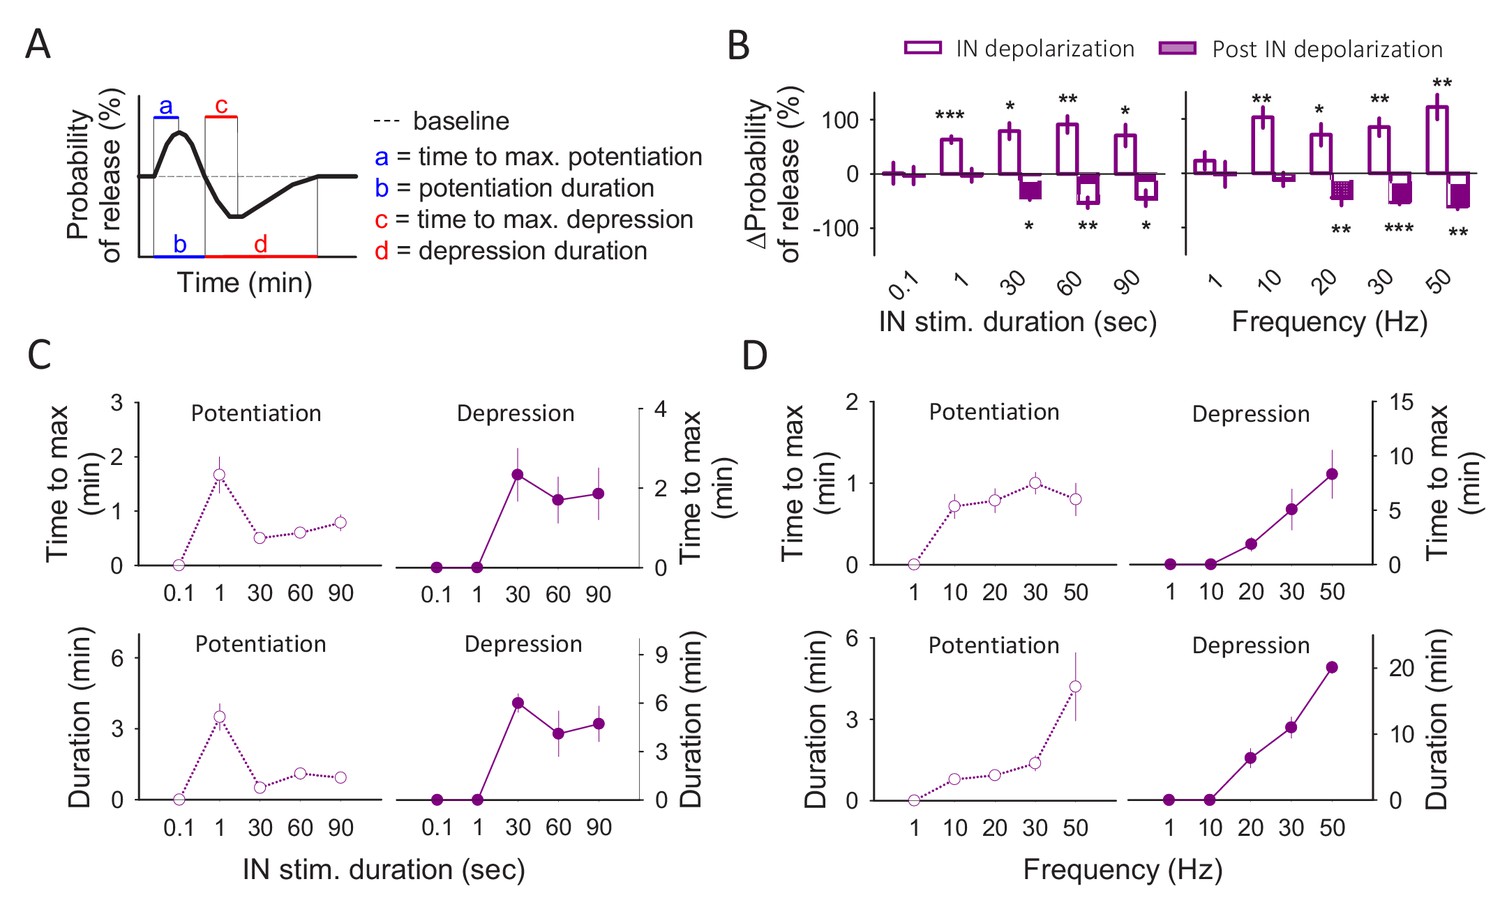
Frequency and stimulus duration dependence of gliotransmitter release.
(A) Schematic illustration of the astrocyte-induced synaptic modulation and the parameters measured. (B) Percentage of effect (potentiation or depression) when the interneurons were depolarized at 20 Hz for different time windows (left panel) and when interneurons were depolarized during 90 s at different frequencies (right panel). (C) Time to maximum effect and effect duration with the different stimulation durations. (D) Time to maximum effect and effect duration with the different stimulation frequencies. Data are represented as mean ± s.e.m., *p<0.05, **p<0.01, ***p<0.001.
Figure 7
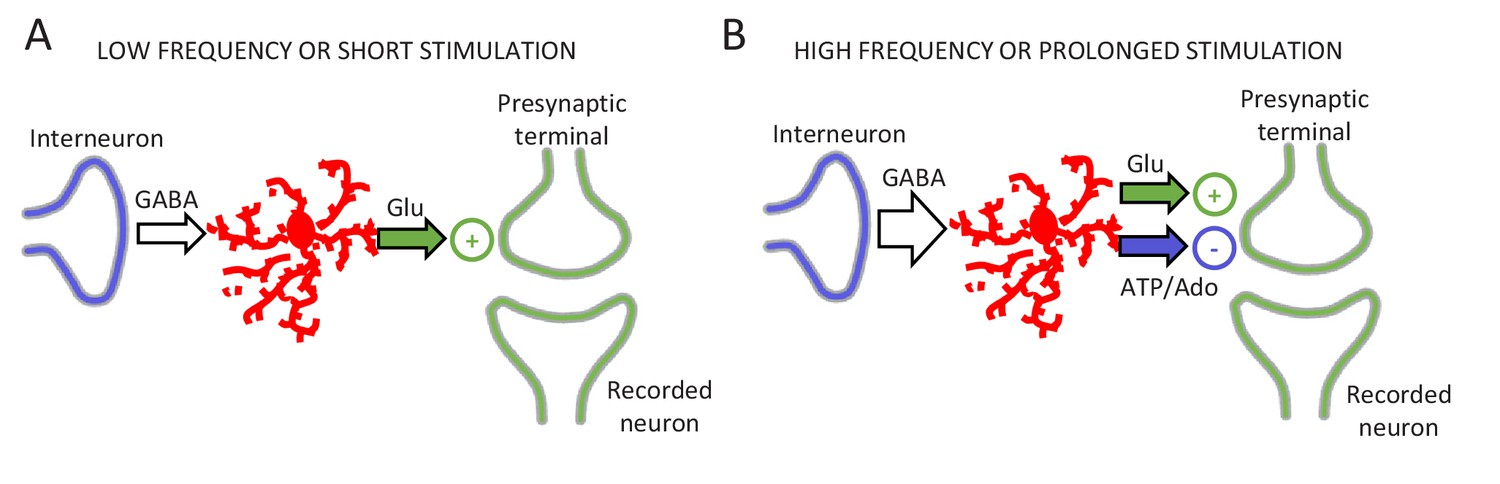
Schematic of the signaling pathways involved in gliotransmitter release.
(A) Low frequency or short interneuron stimulation induces glutamate release from astrocytes leading to a potentiation of neurotransmitter release. (B) High frequency or prolonged interneuron stimulation induces glutamate and ATP/adenosine release from astrocytes leading to a synaptic potentiation followed by a synaptic depression.
Additional files
-
Transparent reporting form
- https://doi.org/10.7554/eLife.32237.015
Download links
A two-part list of links to download the article, or parts of the article, in various formats.
Downloads (link to download the article as PDF)
Open citations (links to open the citations from this article in various online reference manager services)
Cite this article (links to download the citations from this article in formats compatible with various reference manager tools)
Neuronal activity determines distinct gliotransmitter release from a single astrocyte
eLife 7:e32237.
https://doi.org/10.7554/eLife.32237


