The genetic landscape of a physical interaction
- Centre for Genomic Regulation, The Barcelona Institute for Science and Technology, Spain
- Universitat Pompeu Fabra, Spain
- Institució Catalana de Recerca i Estudis Avançats, Spain
Figures
Figure 1 with 1 supplement
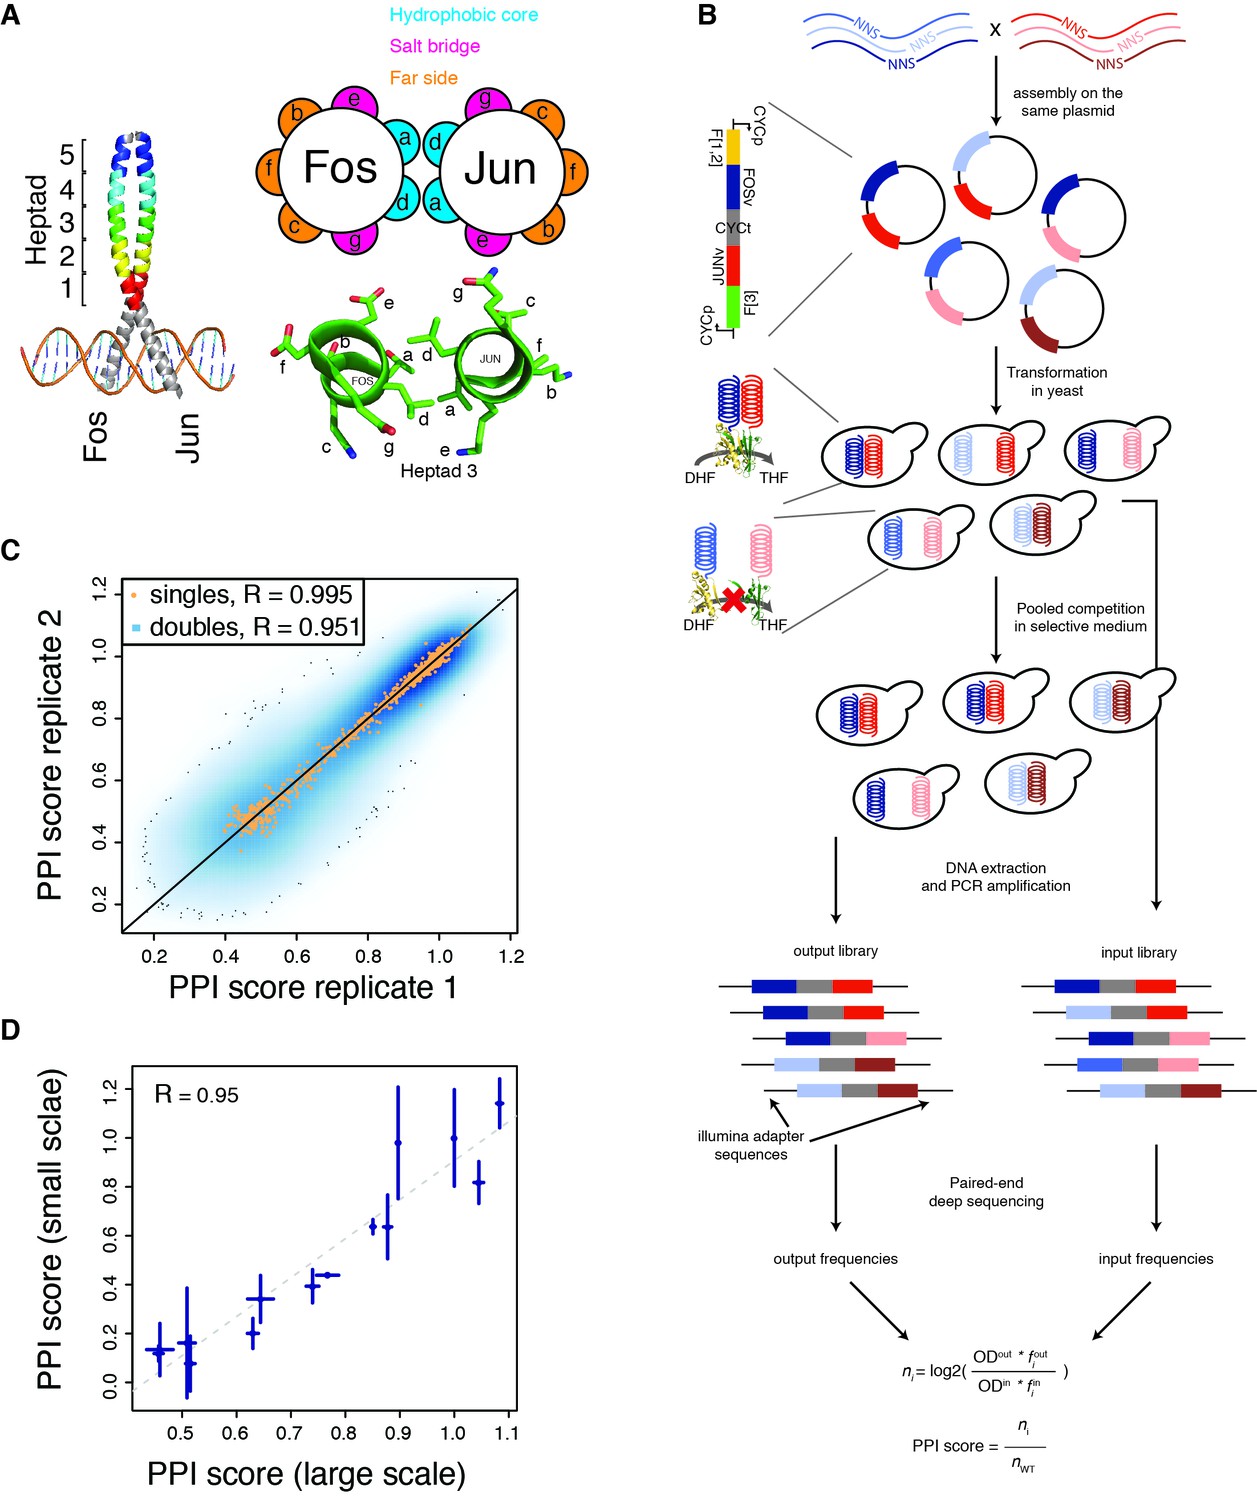
deepPCA.
(A) Leucine zipper domains (colored) and heptad positions of human Fos and Jun. (B) Overview of the assay. Single amino acid variants of Fos and Jun were constructed by overlap-extension PCR using NNS primers and cloned in a head-tail orientation. In PCA, interacting proteins expressed in yeast lead to complementation between their fused DHFR fragments, which is resistant to methotrexate and produces tetrahydrofolate (THF) from dihydrofolate (DHF) to promote growth. Paired-end deep sequencing then allows the frequencies of each variant in the input and output populations to be measured and a PPI score that represents the number of generation of each variant relative to the wild-type interaction to be computed. (C) Scatter plot of PPI scores between biological replicates 1 and 2. (D) Confirmation of single mutants by individual PCA growth assays. Single mutants were reconstructed, sequence confirmed and their PPI scores were derived from their growth curves measured in a plate reader (see Materials and methods). Error bars represent 95% confidence intervals.
Figure 1—figure supplement 1
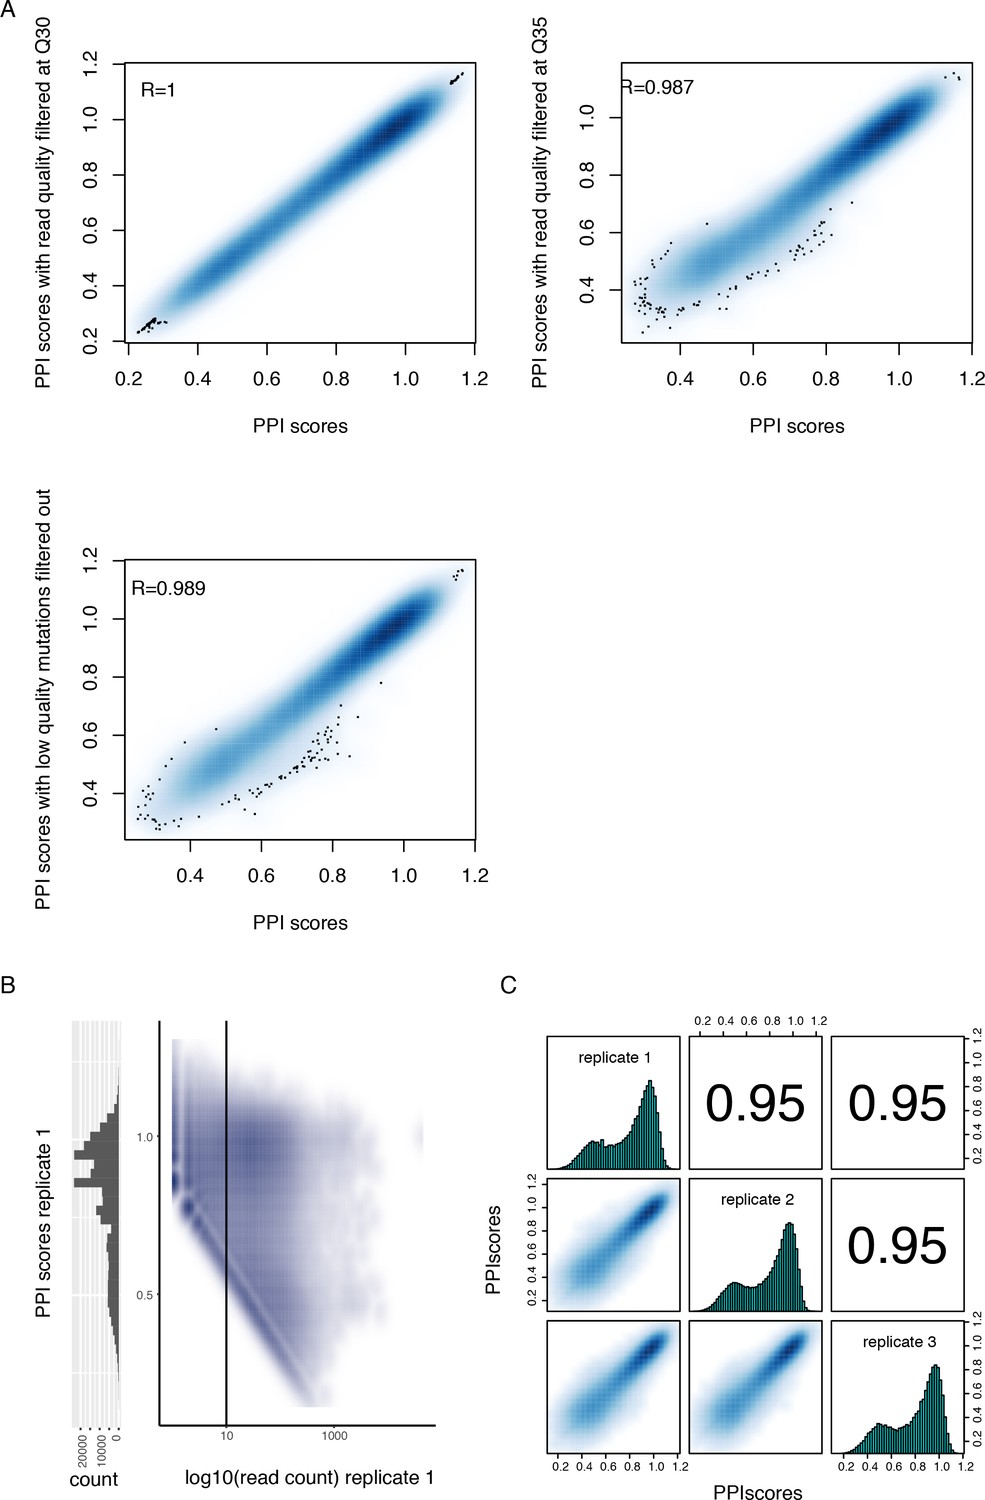
Quality control of the PPI scores measured by deepPCA.
(A) Density plots showing the high correlation between PPI scores calculated from sequencing data filtered at different quality cut-offs. (B) Density plot showing the relationship between PPI scores and input read counts (right) and histogram of PPI scores (left). The data corresponds to replicate 1, including variants with stop codons and prior to filtering based on read count. This plot highlights the PPI score boundary (oblique boundary on the left side of the plot) due to low output read count (see Materials and methods). The vertical line represents the input read count filter. (C) Correlations between deepPCA PPI scores from three biological replicate experiments. Contains both single (n = 1,215) and double mutations (n = 107,625) from the trans Fos and Jun library. Variants with less than 10 UMIs in any of the three replicate input samples or without any UMI in any of the replicate output samples were filtered out.
Figure 2 with 1 supplement
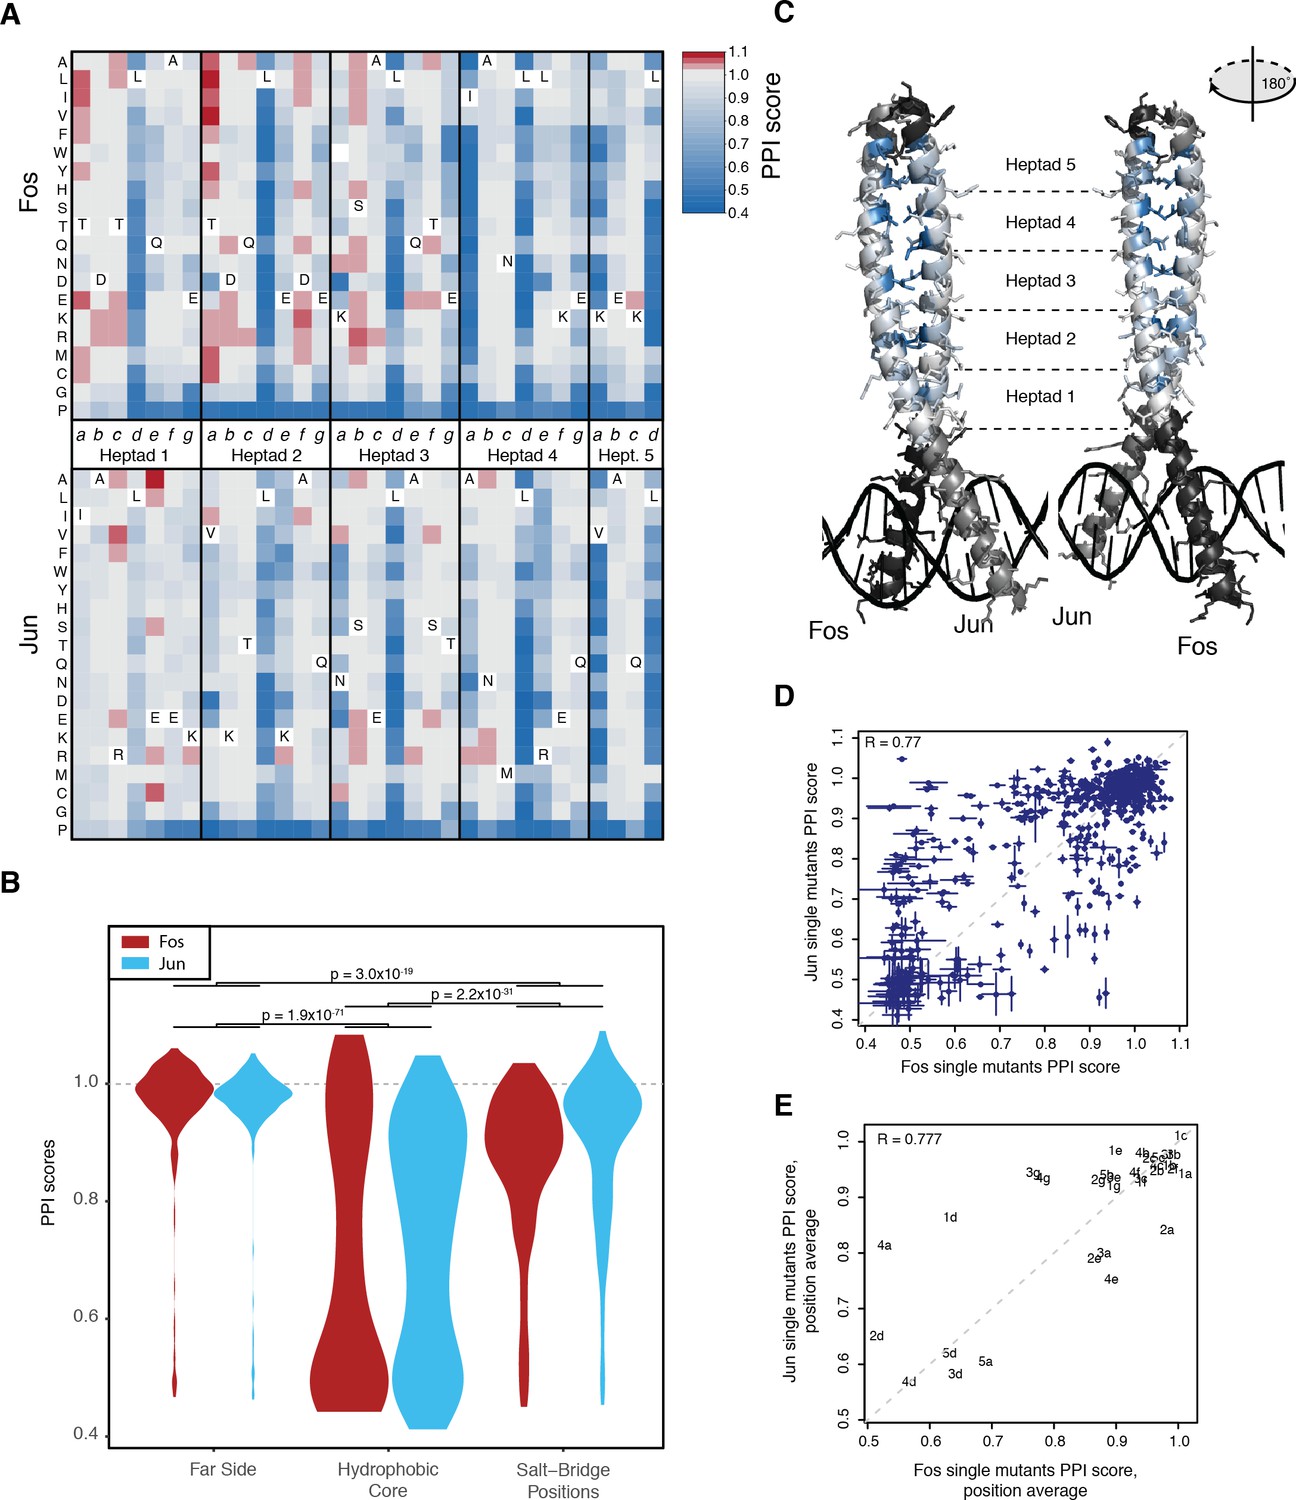
Effects of single mutants.
(A) Heatmap of single mutant PPI scores averaged between the three replicates. Letters inside the heatmap represent the wild-type amino acid. White represents missing data. (B) Distribution of PPI scores per position types. p-Values from Welch t-test. (C) Average PPI score per position overlaid on the crystal structure (pdb: 1fos). Black and gray represent positions not mutated in Fos and Jun, respectively. (D) Scatter plot between PPI scores of corresponding single mutations at the same positions in Fos and Jun. Error bars represent 95% confidence intervals. (E) Scatter plot between average PPI score per corresponding positions in Fos and Jun. The number represents the heptad and the letter the position inside the heptad.
Figure 2—figure supplement 1

Single mutant effects.
(A) Distribution of single mutants effects. (B) Proportion of single mutants that strongly decrease PPI strength (FDR < 0.05, one sample t-test with mu = 1) at different PPI score thresholds. (C) Proportion of single mutants that significantly increase PPI strength (FDR < 0.05, one sample t-test with mu = 1) at different PPI score thresholds. (D) Maximal proportion of variance explained for each residue by a single amino acid feature (see Supplementary file 2 for predictive features).
Figure 3 with 2 supplements
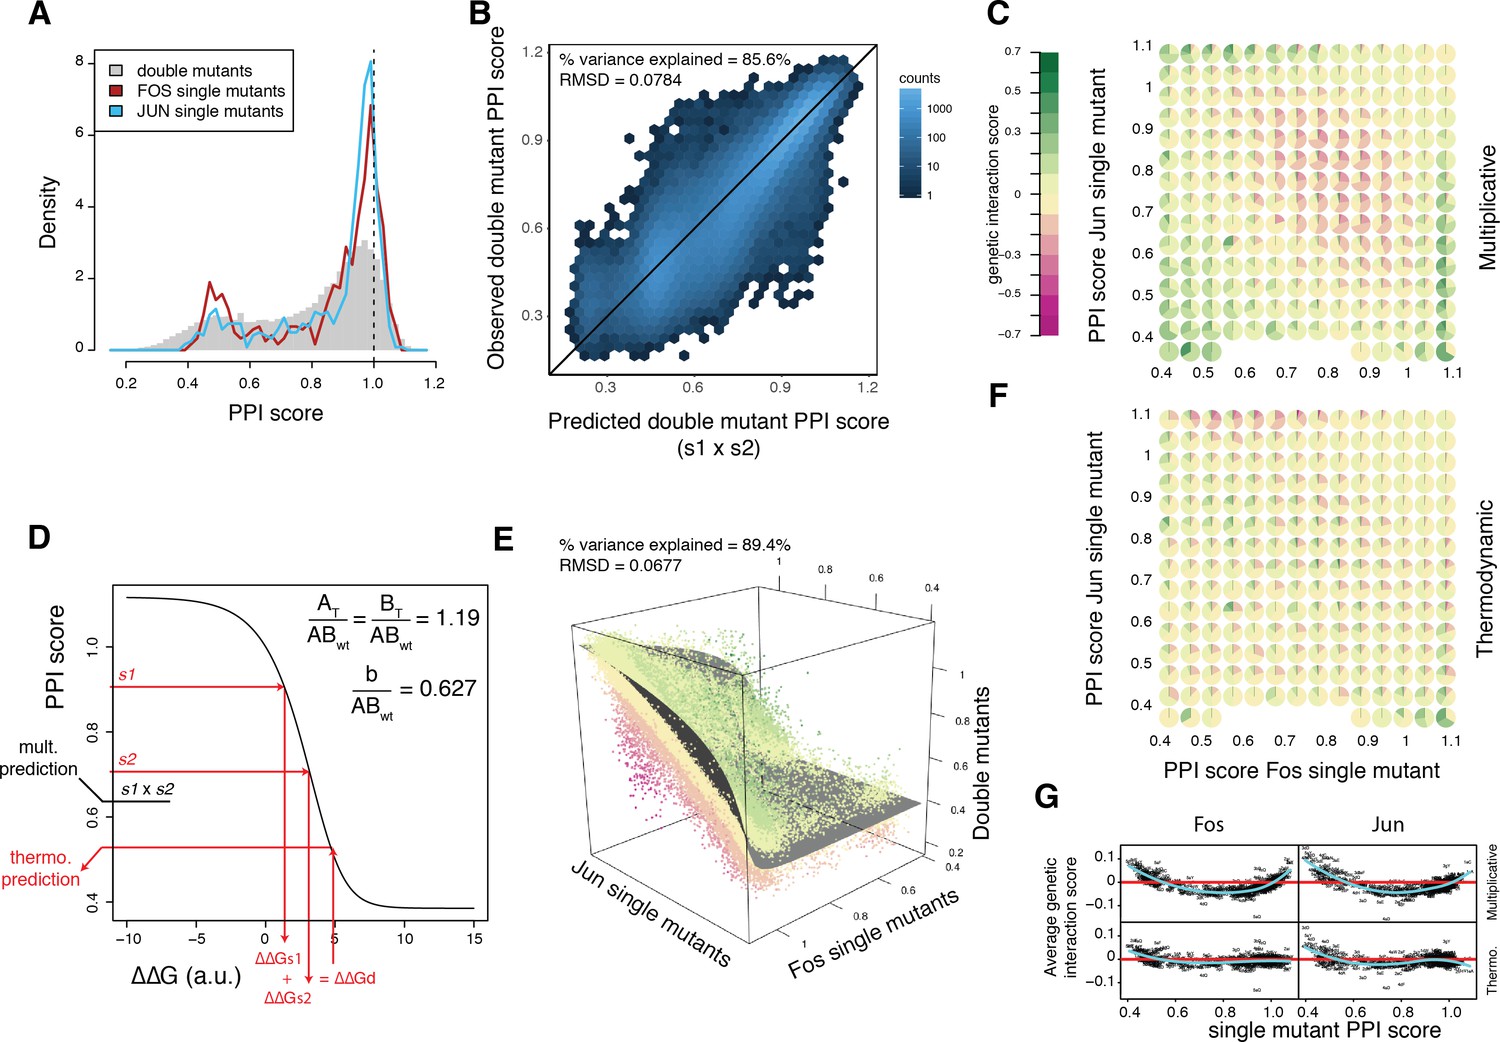
A thermodynamic model predicts double mutant outcomes.
(A) Distribution of double mutants PPI scores compared to Fos and Jun single mutants. (B) Observed double mutants PPI scores against the scores predicted by a multiplicative model. (C) Pie chart array of genetic interaction score bins by Fos (x-axis) and Jun (y-axis) single mutant PPI score bins for genetic interactions calculated from the multiplicative model. (D) Fitted thermodynamic model (see Materials and methods). Red arrows illustrate how the sigmoidal function can lead to a different prediction than the multiplicative model. The three fitted free parameters are shown (AT/ABwt and BT/ABwt represent the total concentration of the two proteins relative to the concentration of the wild-type complex and b/ABwt represents the background growth relative to the concentration of the wild-type complex, see Materials and methods). ΔΔGs1, ΔΔGs2 and ΔΔGd represent the change in free energy relative to the wild-type complex of the two single mutants and the double mutant, repsectively. (E) 3D scatter plot of double mutants PPI scores (z-axis) as a function of the corresponding Fos (x-axis) and Jun (y-axis) single mutants PPI scores with the fitted surface from the thermodynamic model. Dot color represents genetic interaction scores according to the color scale in (C). (F) Pie chart array of genetic interaction score bins by Fos (x-axis) and Jun (y-axis) single mutants PPI score bins for genetic interactions calculated from the thermodynamic model. (G) Average genetic interaction score across all double mutants involving a given Fos (left) or Jun (right) single mutant in function of its PPI score for the multiplicative (top) and thermodynamic (bottom) models. Data in all panels is for replicate 1.
Figure 3—figure supplement 1
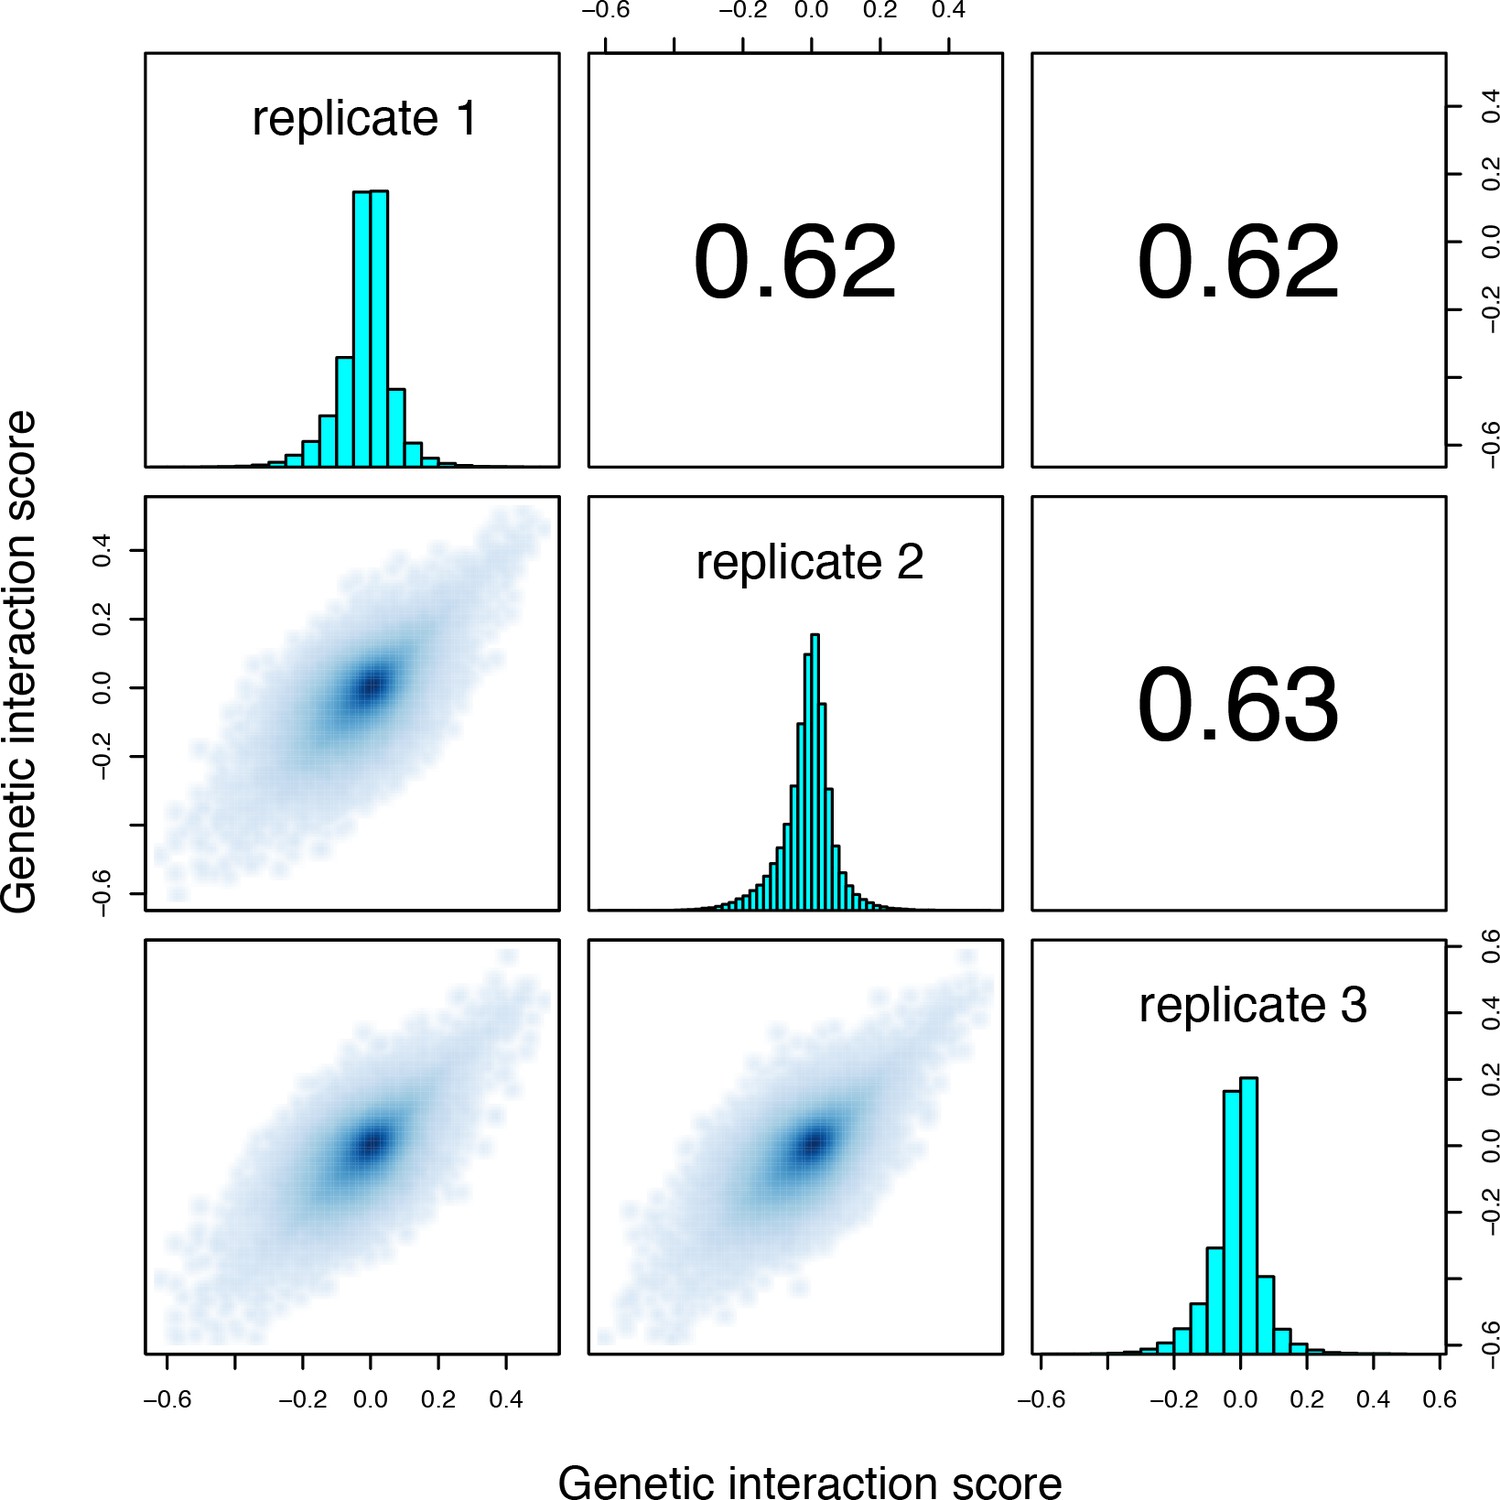
Correlations between genetic interaction scores from the three biological replicates of the trans library selection.
Genetic interactions calculated using the multiplicative model.
Figure 3—figure supplement 2
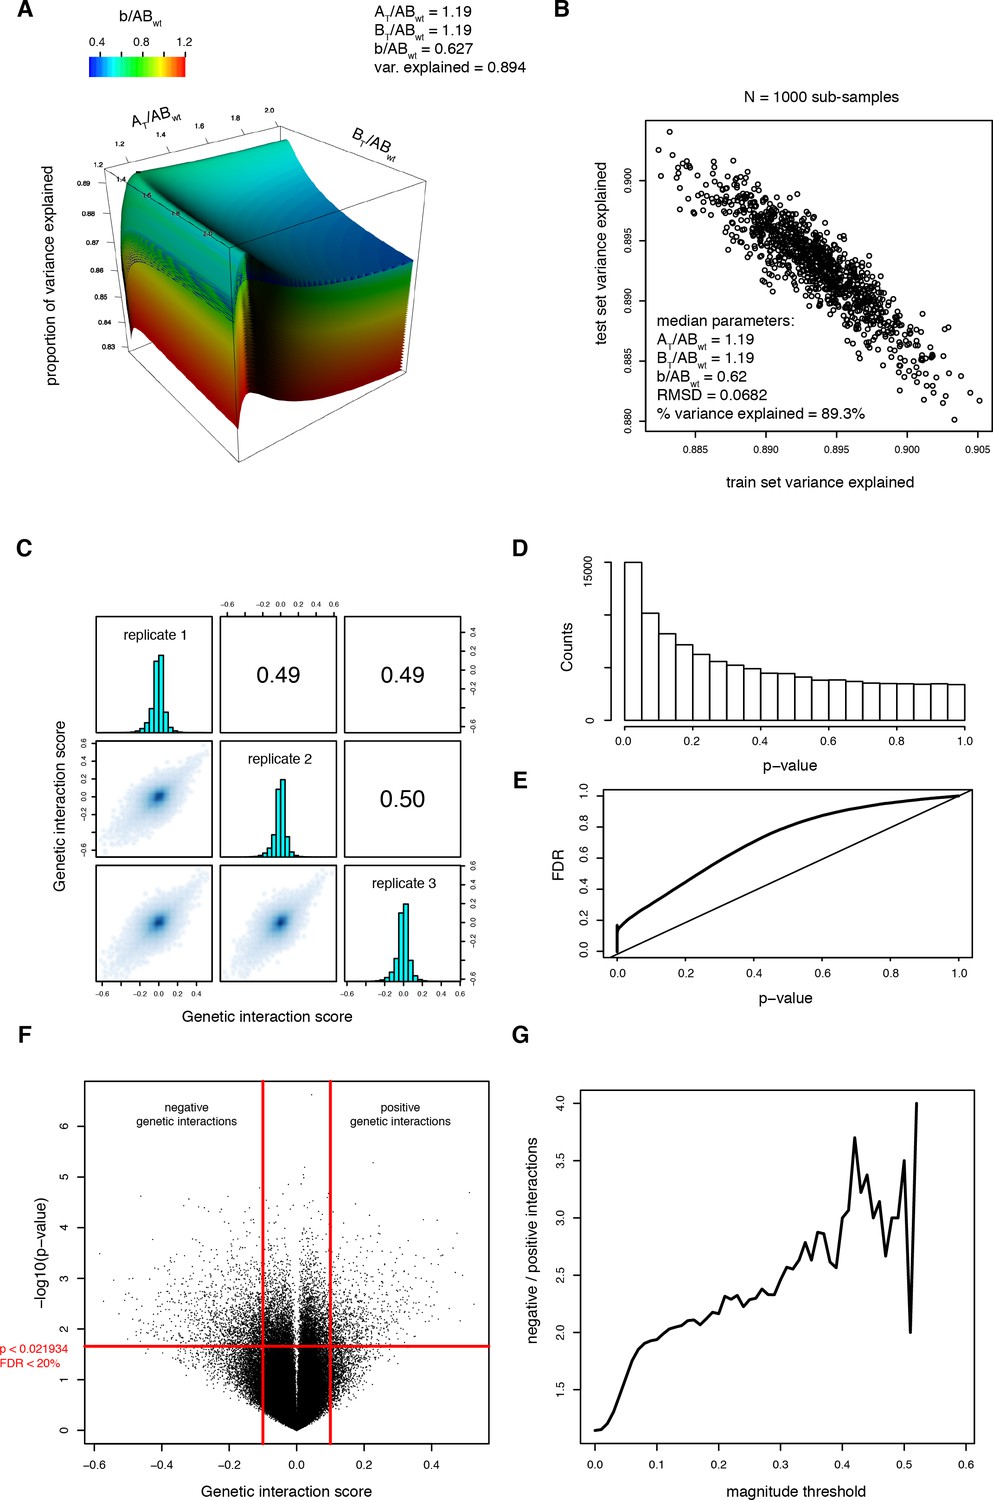
Fitting the thermodynamic model on the trans library data.
(A) Parameter search. Proportion of variance explained as a function of the three parameters of the thermodynamic model. The third parameter (b/ABWT) is represented as surfaces of different colors. The black dot represents the highest percentage of variance explained. (B) Result of Monte-Carlo cross-validation to ensure that the model is not over-fitted. The procedure is described in the Materials and methods section. The median of the free parameters over 1000 sub-samplings is identical, confirming that the model is not over-fitted. (C) Correlations between genetic interaction scores from the three biological replicates calculated from the thermodynamic model. (D) Distribution of the p-values from the one-sample t-tests performed on the genetic interaction scores (i.e. residuals from the thermodynamic model) from three replicates of each double mutant. (E) FDR calculated by permutation of genetic interaction scores (see method) as a function of the p-value threshold. (F) Volcano plot of the p-values of each double mutant as a function of the corresponding average genetic interaction scores. Vertical red lines represent the magnitude threshold used to define strong genetic interactions. The horizontal red line represents the p-value threshold that corresponds to a FDR of 0.2. (G) Ratio of significantly negative to positive genetic interactions at different magnitude thresholds showing that negative genetic interactions are more prevalent than positive genetic interactions.
Figure 4 with 3 supplements
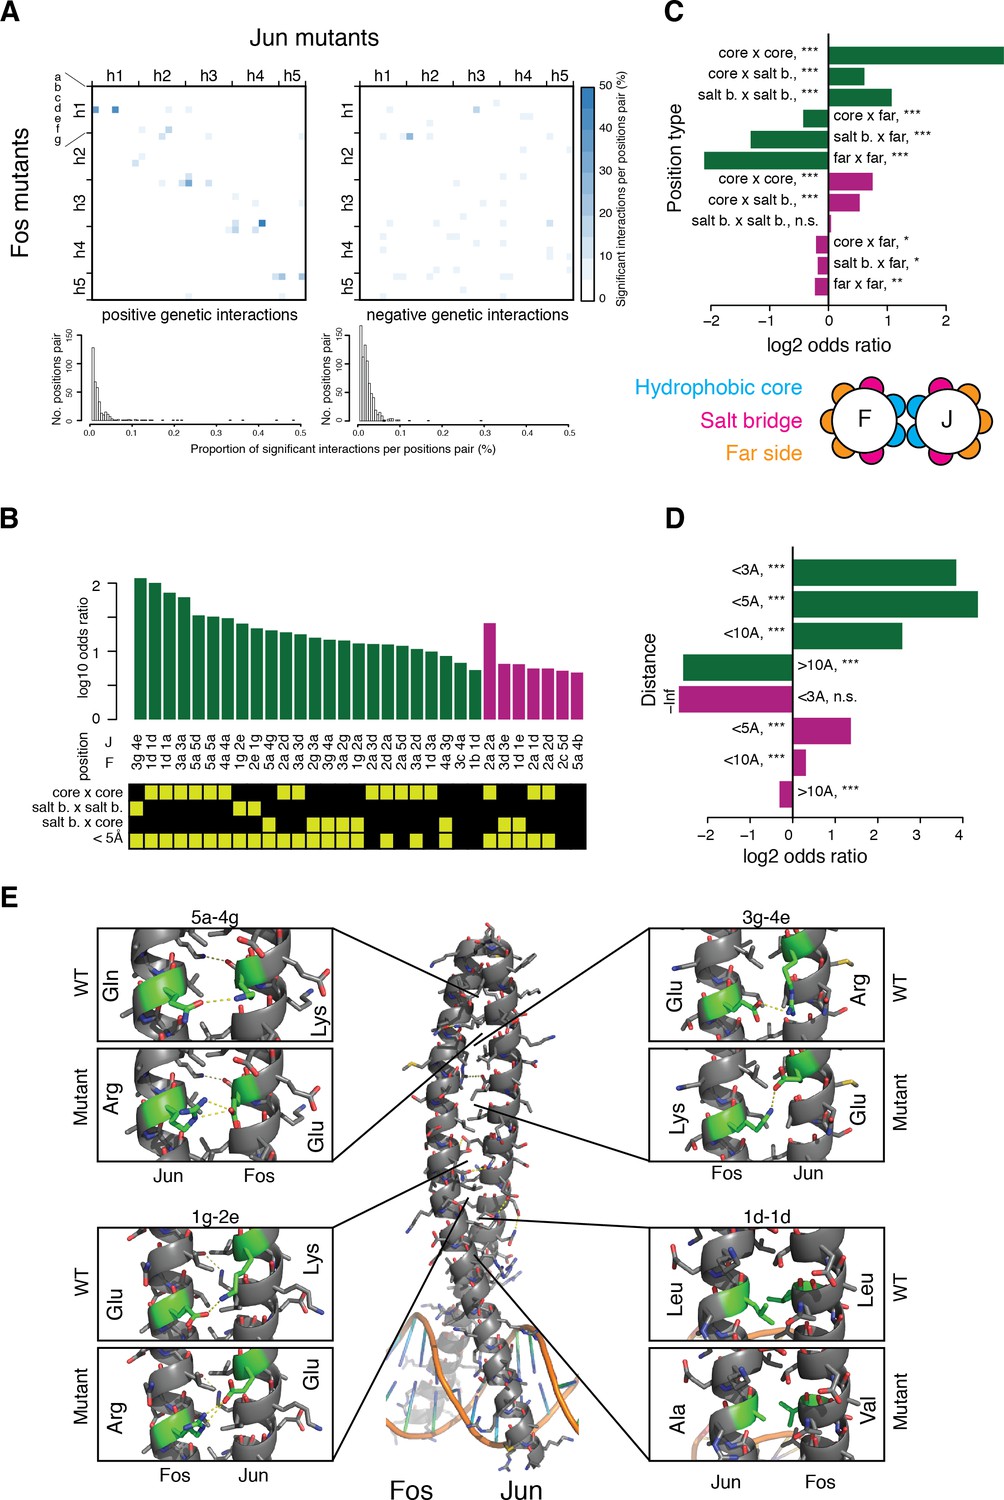
Structural genetic interactions.
(A) Heatmap (top) and distribution (bottom) of percentage of significantly (absolute genetic interaction score > 0.1, FDR < 0.2) positive (left) or negative (right) genetic interactions per pairs of position. Pairs of positions without any significant interactions were excluded from the distribution (bottom). (B) Pairs of position significantly enriched in positive (green) or negative (purple) genetic interactions (Fisher’s exact test, FDR = 10%). Each pair of position was classified according to its heptad position type and the distance between the two position (bottom matrix, yellow cells). (C–D) Enrichment for significantly positive (green) or negative (purple) genetic interactions between different position types (C) and at different distance threshold between the two positions (D). *, FDR < 0.1. **, FDR < 0.01. ***, FDR < 0.001. n.s., non-significant. (E) Example of structural interactions in the Fos-Jun complex (pdb: 1fos). Dashed yellow lines represent polar interactions predicted by pymol and the mutant structures were drawn using the pymol mutagenesis function.
Figure 4—figure supplement 1
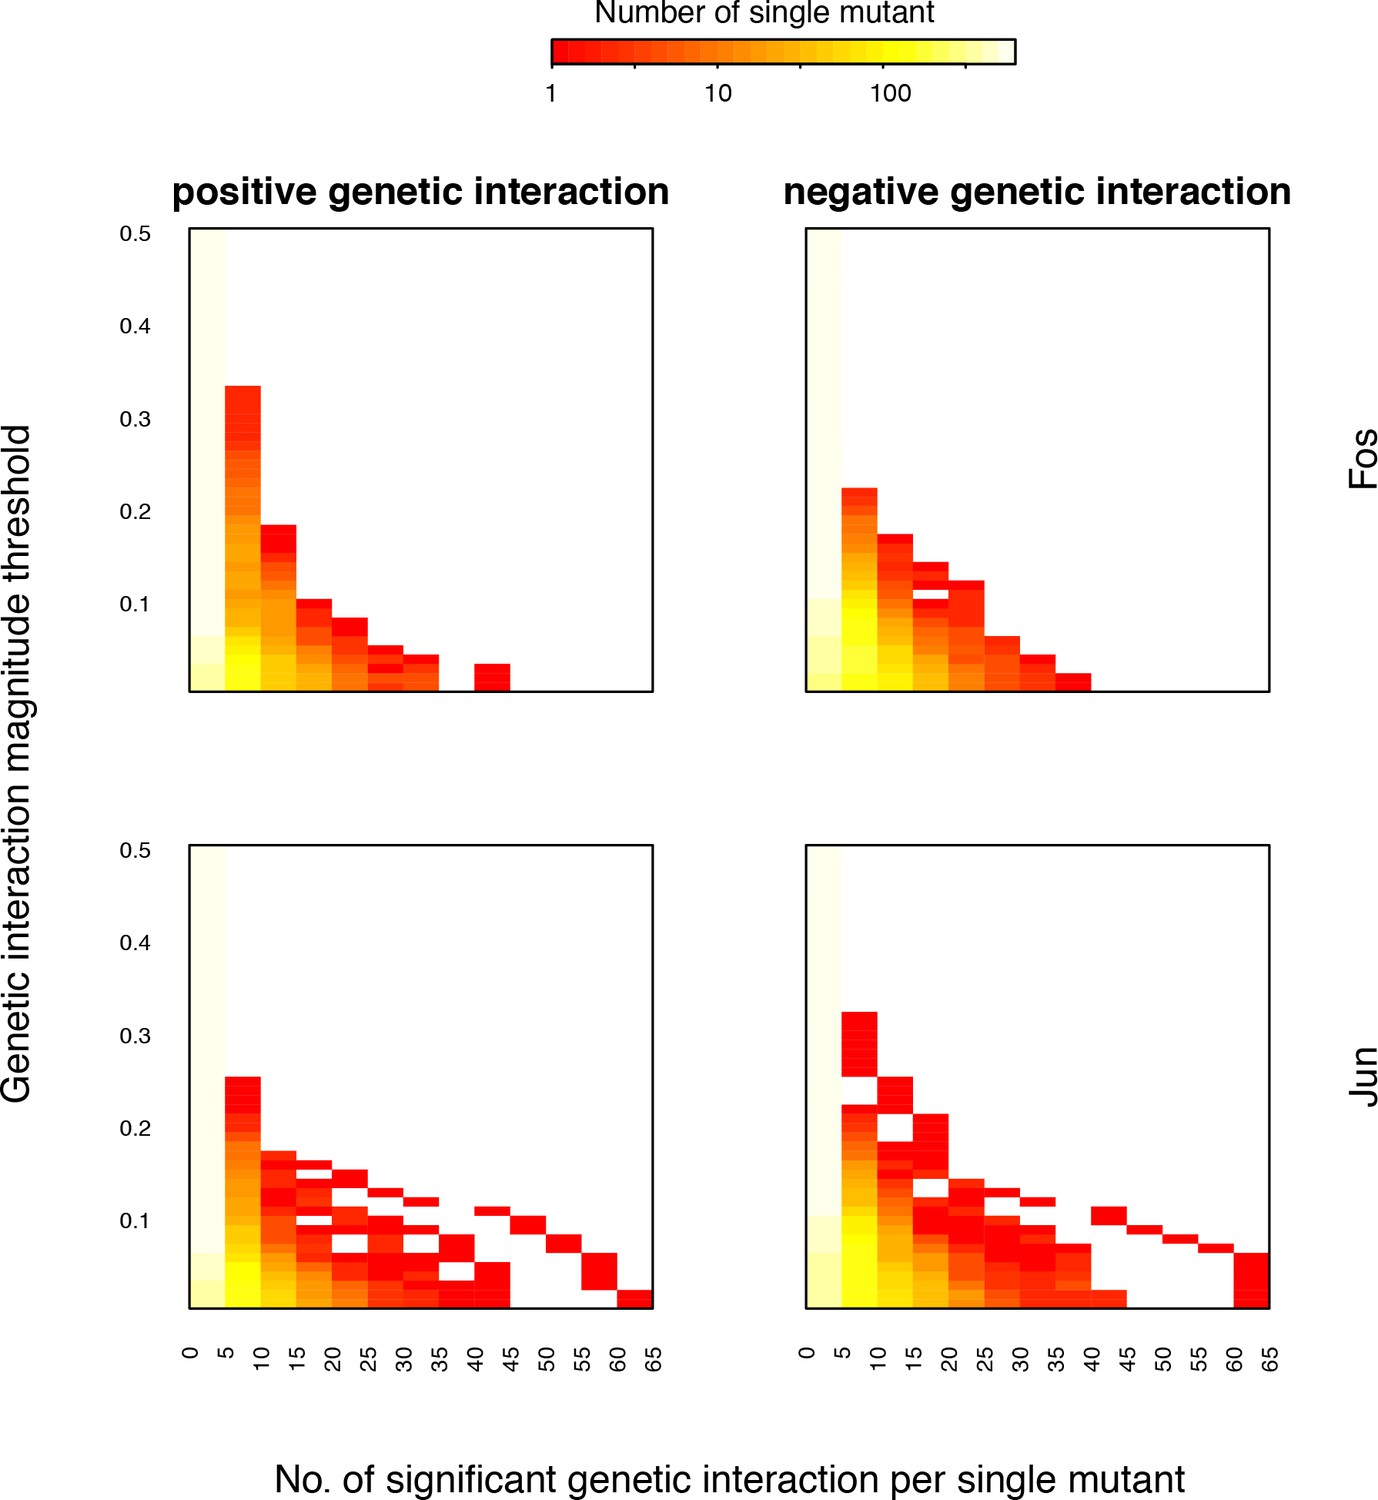
Distribution of number of significant genetic interactions for Fos or Jun single mutants at different magnitude thresholds.
Each row of the heatmap is the distribution of the number of interactions at that magnitude threshold. FDR < 0.2.
Figure 4—figure supplement 2
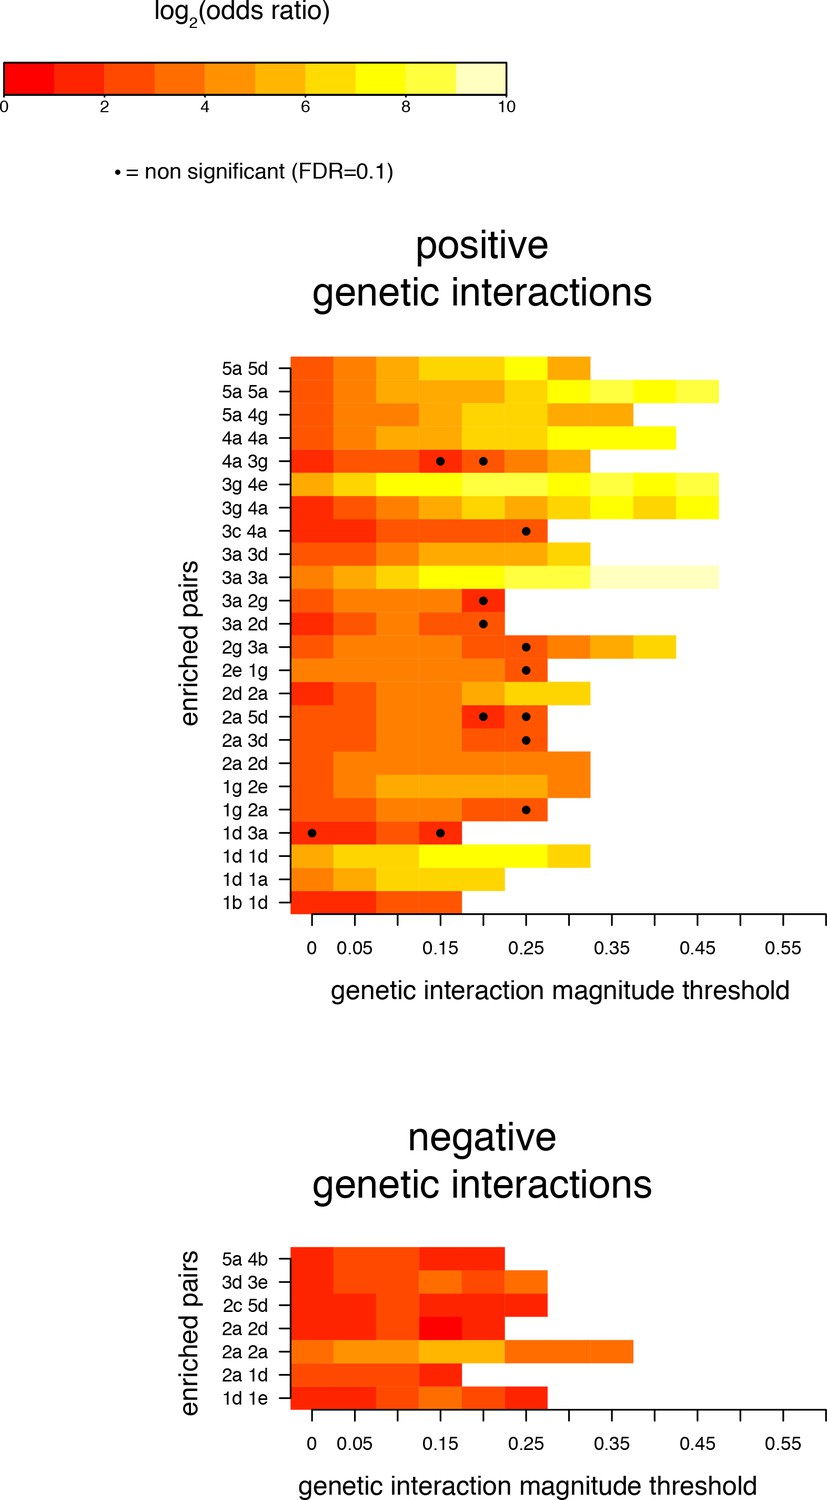
Robustness of enrichments in position pairs for significant (FDR < 0.2) genetic interactions at different magnitude thresholds.
Pairs of positions presented as significantly enriched in Figure 4C (magnitude threshold of 0.1). Enrichments and their corresponding FDRs were calculated at all 1024 pairs of positions, for each magnitude threshold independently.
Figure 4—figure supplement 3
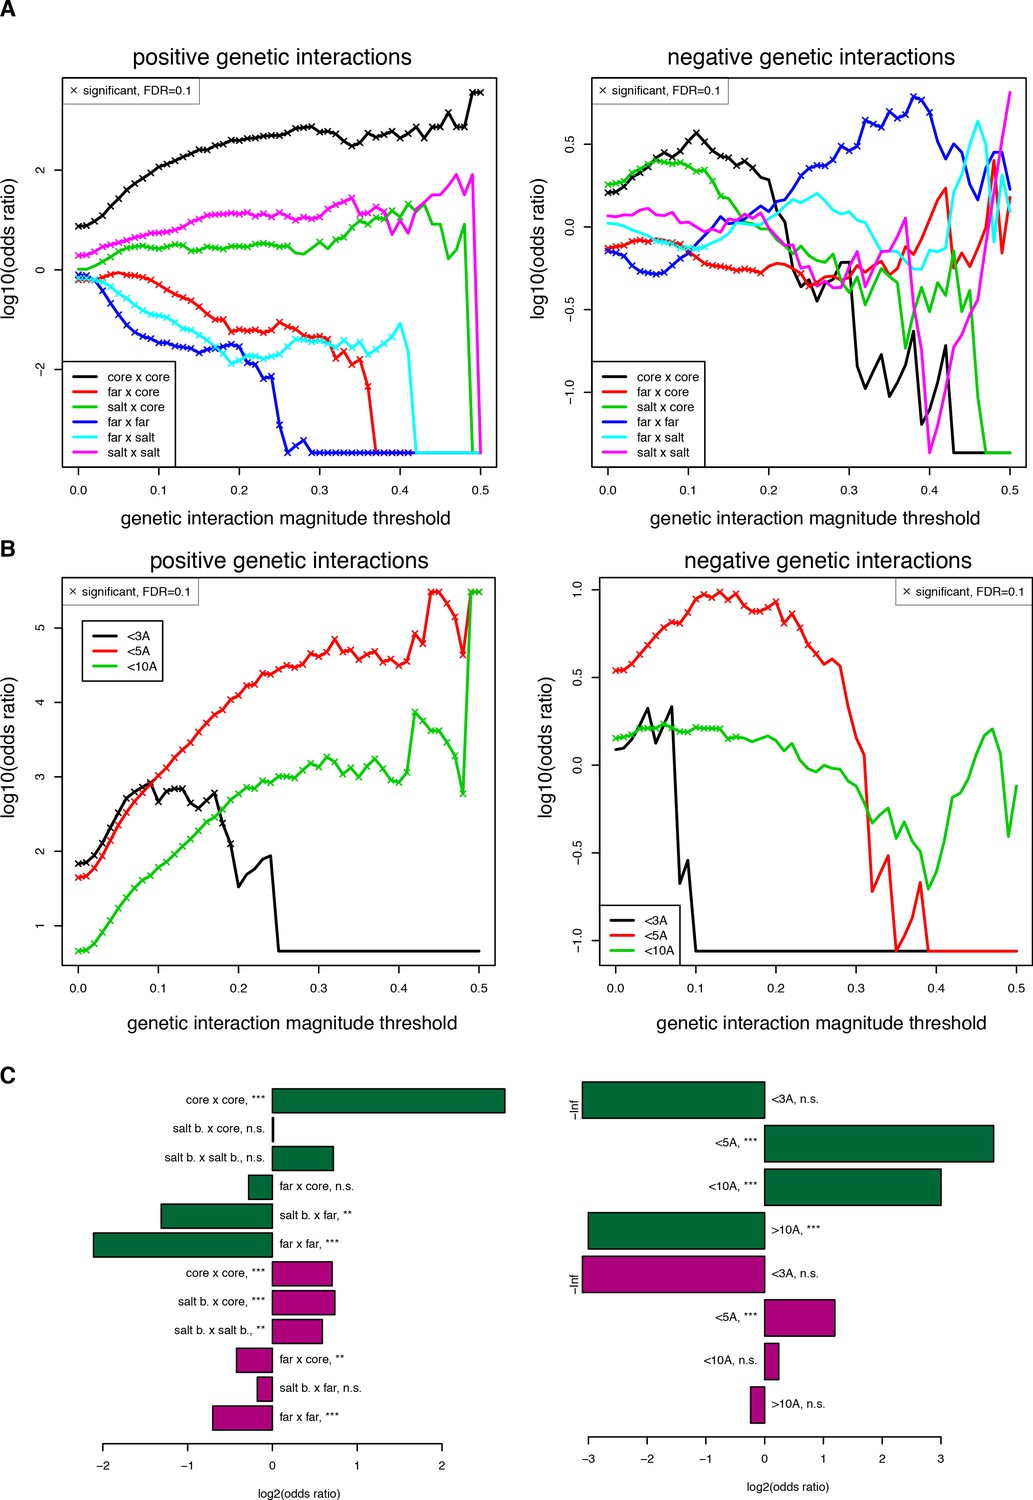
Robustness of enrichments in structural features for significant (FDR < 0.2) genetic interactions at different magnitude thresholds.
(A) Enrichments for different position types. Enrichments and their corresponding FDRs were calculated for each magnitude threshold independently. (B) Enrichments for pairs of mutations at difference distance threshold in the structure (pdb: 1fos). (C) Enrichments for position type (left) and for pairs of mutations at different distance thresholds with a more stringent input read count filter (> 100 input reads in any of three replicates), showing that the trends are the same even though the significance is lower with this stringent filter due to the smaller size of the dataset (n = 17,758 when filtering at 100 input reads compared to 107,618 when filtering at 10 input reads). Enrichments and their corresponding FDRs were calculated for each magnitude threshold independently.
Figure 5 with 9 supplements
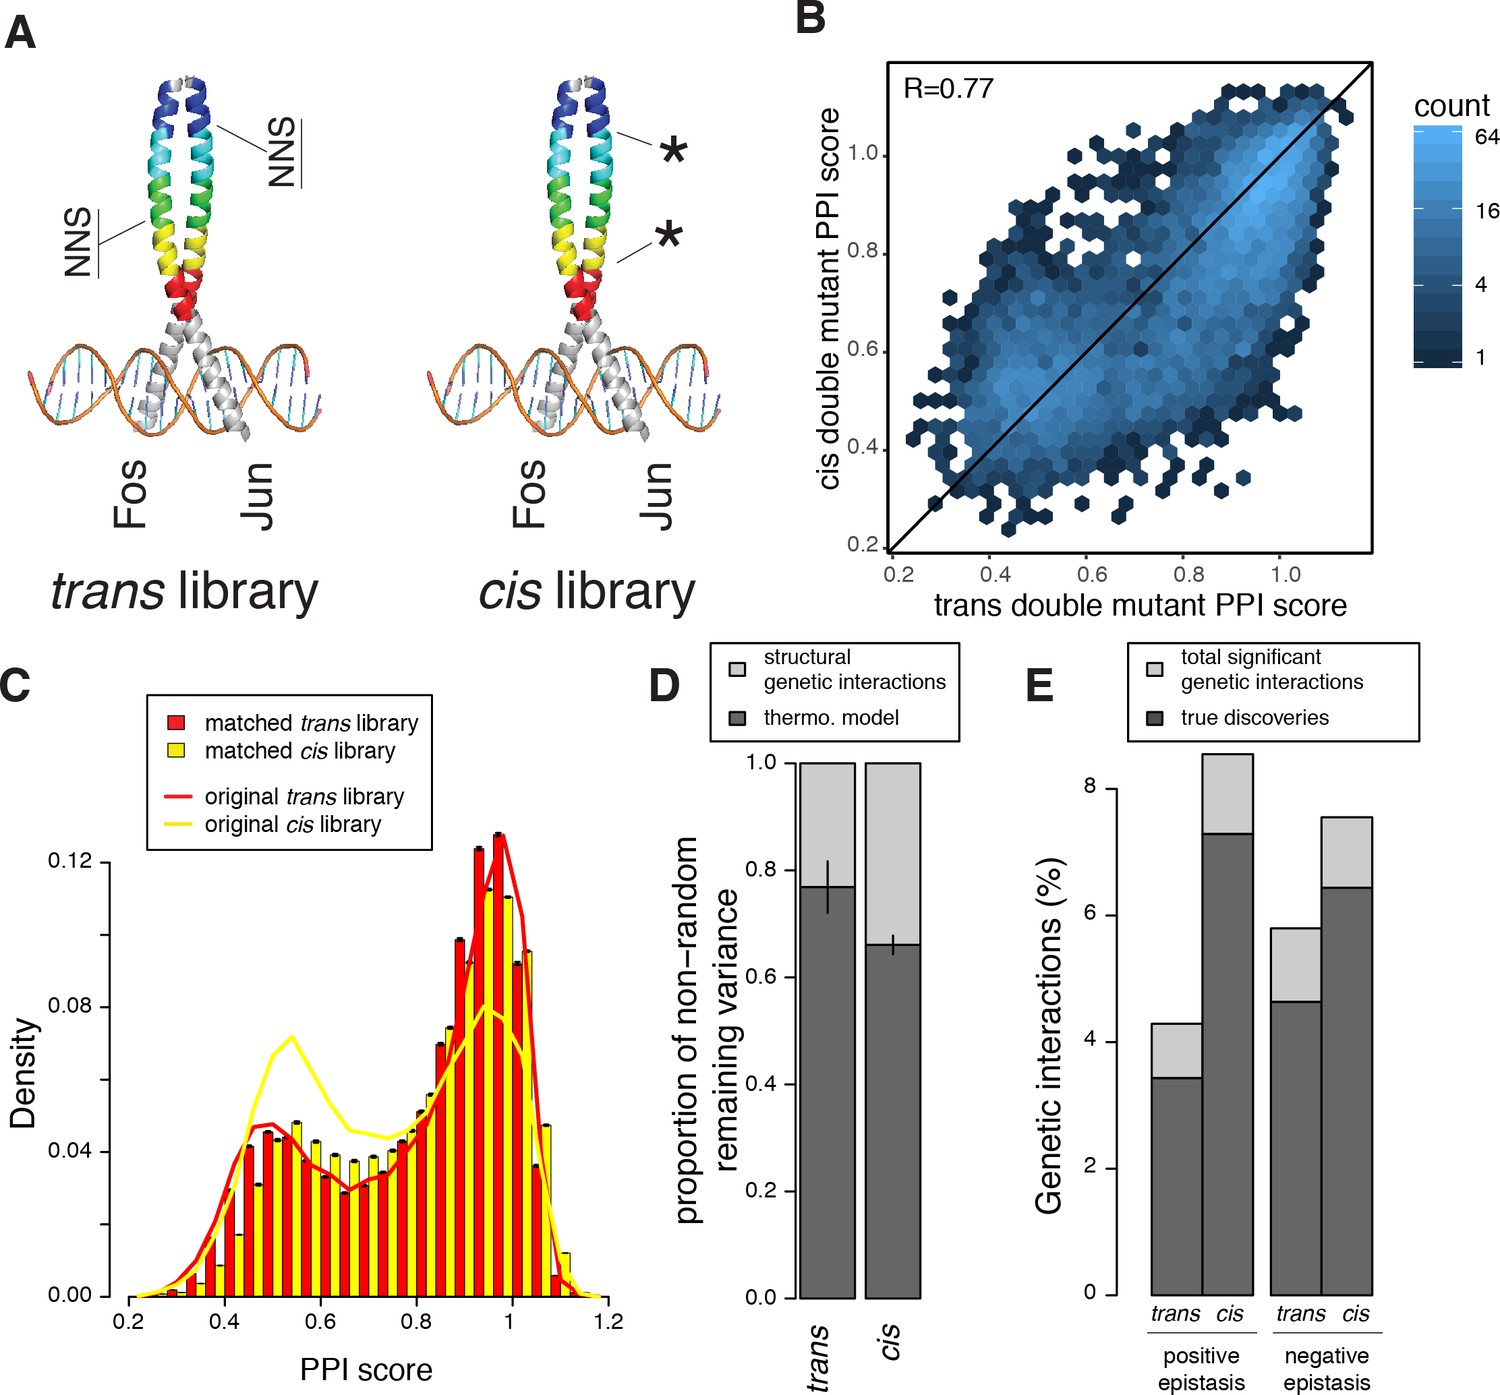
Comparison of double mutant mutation outcome and genetic interactions in cis and trans.
(A) Cartoon illustrating how the cis library differs from the trans one. NNS, whole codon substitution. Asterisk, point mutation. (B) Scatter plot between Average PPI scores of identical pairs of mutations at the same positions in cis and trans. (C) Distribution of double mutants PPI scores in the original cis and trans libraries or after matching their single mutant effects distributions. Error bars represents 95% confidence intervals around the mean of 1000 sub-samplings when matching the two libraries. (D) Stacked bar-plot showing the proportion of the non-random variance in double mutant PPI scores that is not accounted for by the multiplicative model, explained by the thermodynamic model and the residual structural genetic interactions. Error bars represent the standard error of the mean. (E) Proportion of significant positive and negative genetic interactions in the two original libraries. See Figure 5—figure supplements 2, 3, 7 and 9 for sub-sampled libraries with matched single mutant effect distributions.
Figure 5—figure supplement 1
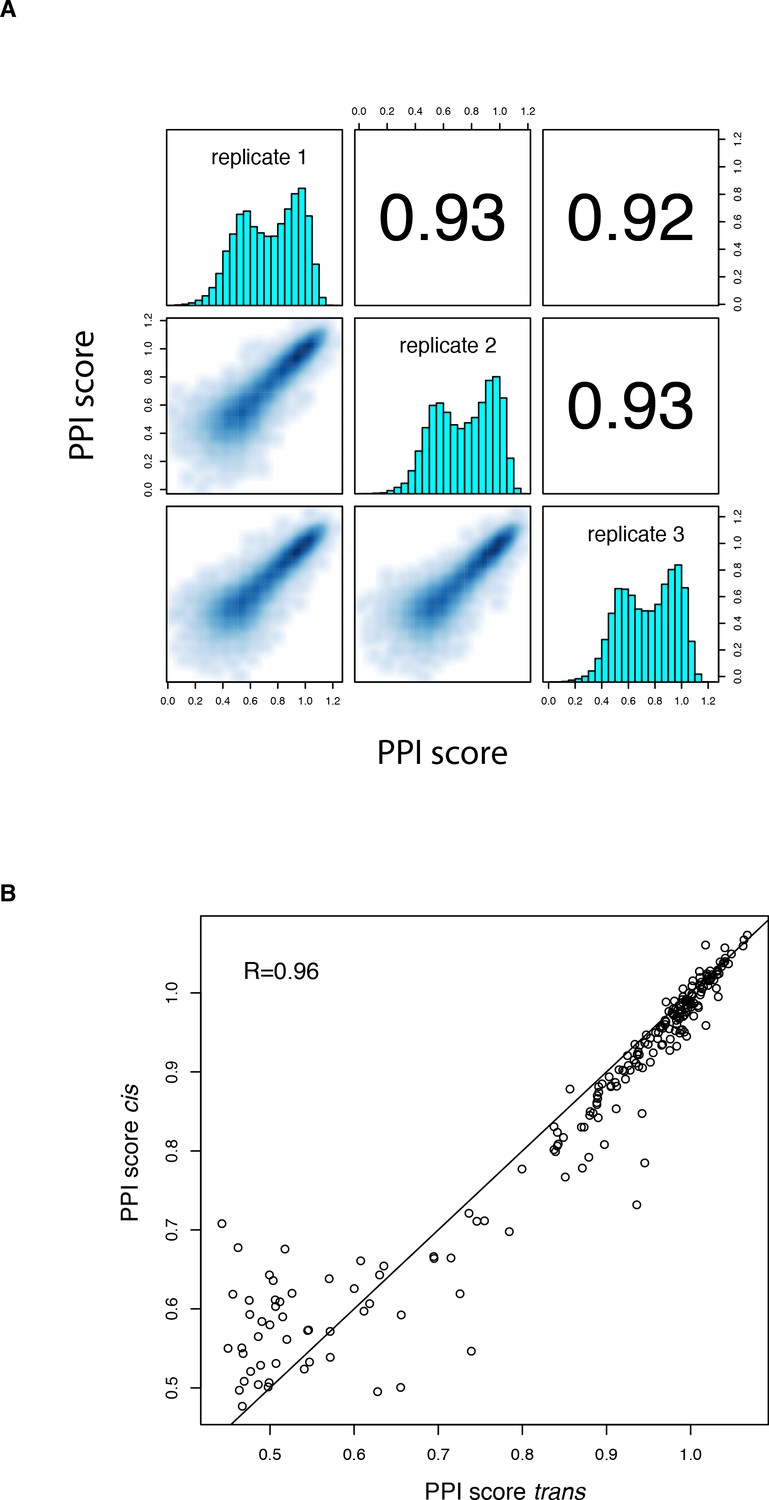
PPI scores for the cis library.
(A) Correlation between PPI scores from the three biological replicates of the cis mutation library selection. Contains both single (n = 190) and double (n = 17,290) mutations. Variants with less than 10 UMIs in any of the three replicate input samples or without any UMI in any of the replicate output samples were filtered out. (B) Correlation between single amino acid change PPI scores in the trans and cis libraries for all mutations reachable through a single nucleotide substitution.
Figure 5—figure supplement 2
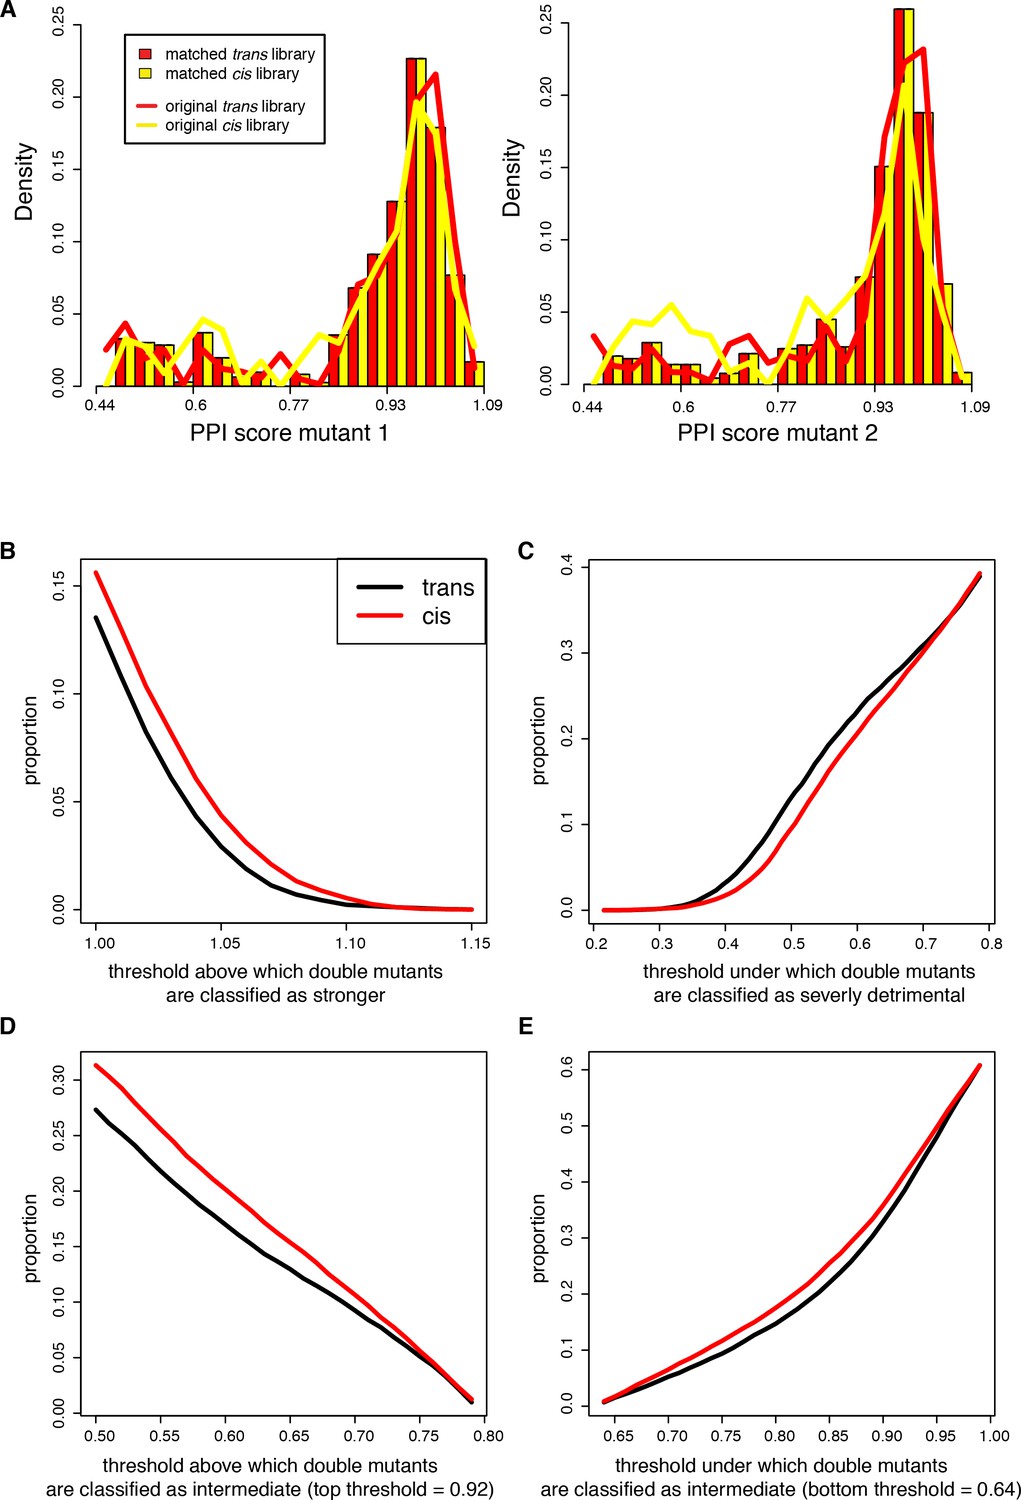
Proportion of cis and trans double mutants classified as strengthening, intermediate effect or severely detrimental using different score thresholds.
The libraries where sub-sampled to match the distribution of the single mutant PPI scores as described in the method section. (A) Distribution of single mutants PPI scores before (solid lines) after (bars) sub-sampling. Mutants 1 and 2 correspond respectively to Fos and Jun in the trans library or to Fos single mutants randomly attributed to mutant 1 or 2 in each sub-sample of the cis library. For the original cis library, the distribution corresponds to pooling mutants 1 and 2 together dividing the counts by 2. (B) Double mutants stronger than WT. (C) Double mutants severely detrimental. (D–E) Double mutants of intermediate effect, varying the lower and upper thresholds, respectively.
Figure 5—figure supplement 3
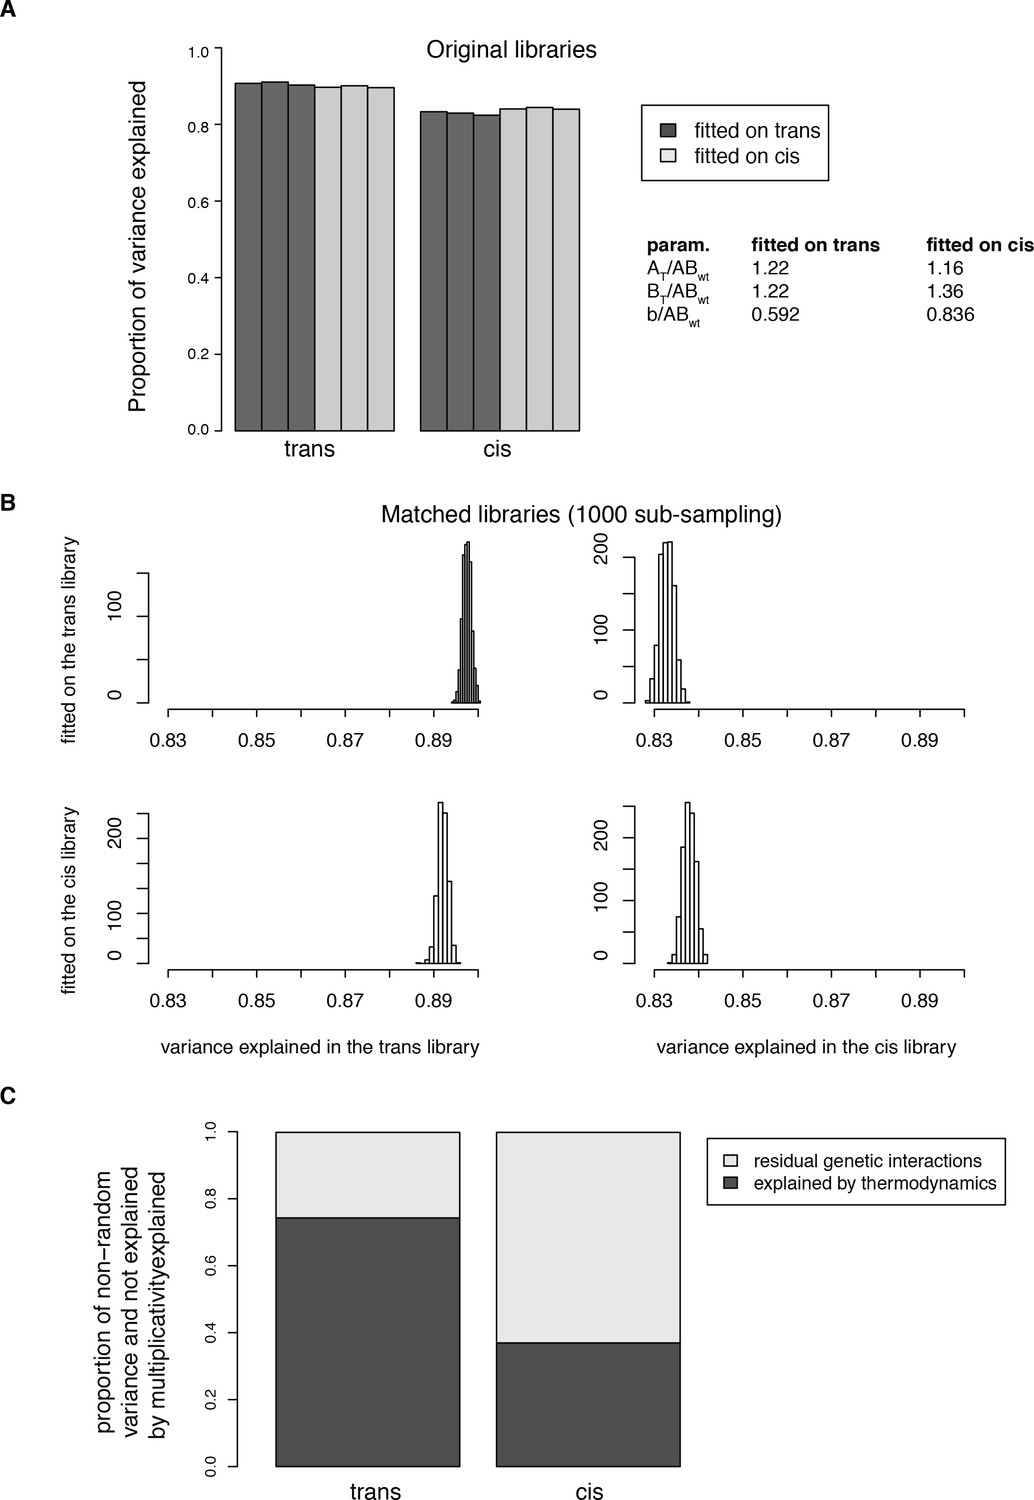
Fitting the thermodynamic model on both the trans and cis data.
(A) Proportion of total variance explained in both datasets when fitting the model on either the trans or the cis data only. The models were fitted on the pooled replicates. Percentage of variance explained were then calculated for each replicate independently. (B) Distributions of the proportion of variance explained in 1000 sub-samplings to match the distribution of single mutant effects between the two libraries, showing that the model fitting does not depend on the differences in effect size distributions between the original libraries. (C) Average proportion of the non-random variance in double mutants PPI scores not accounted for by the multiplicative model and explained by the thermodynamic model in the 1000 sub-sampled libraries. The model was fitted on the two original libraries pooled together. The percentage of variance explained was then calculated for each replicate independently. 95% confidence intervals around the mean of the 1000 sub-samplings were not plotted because they are negligible (0.0028 for trans and 0.00058 for cis).
Figure 5—figure supplement 4
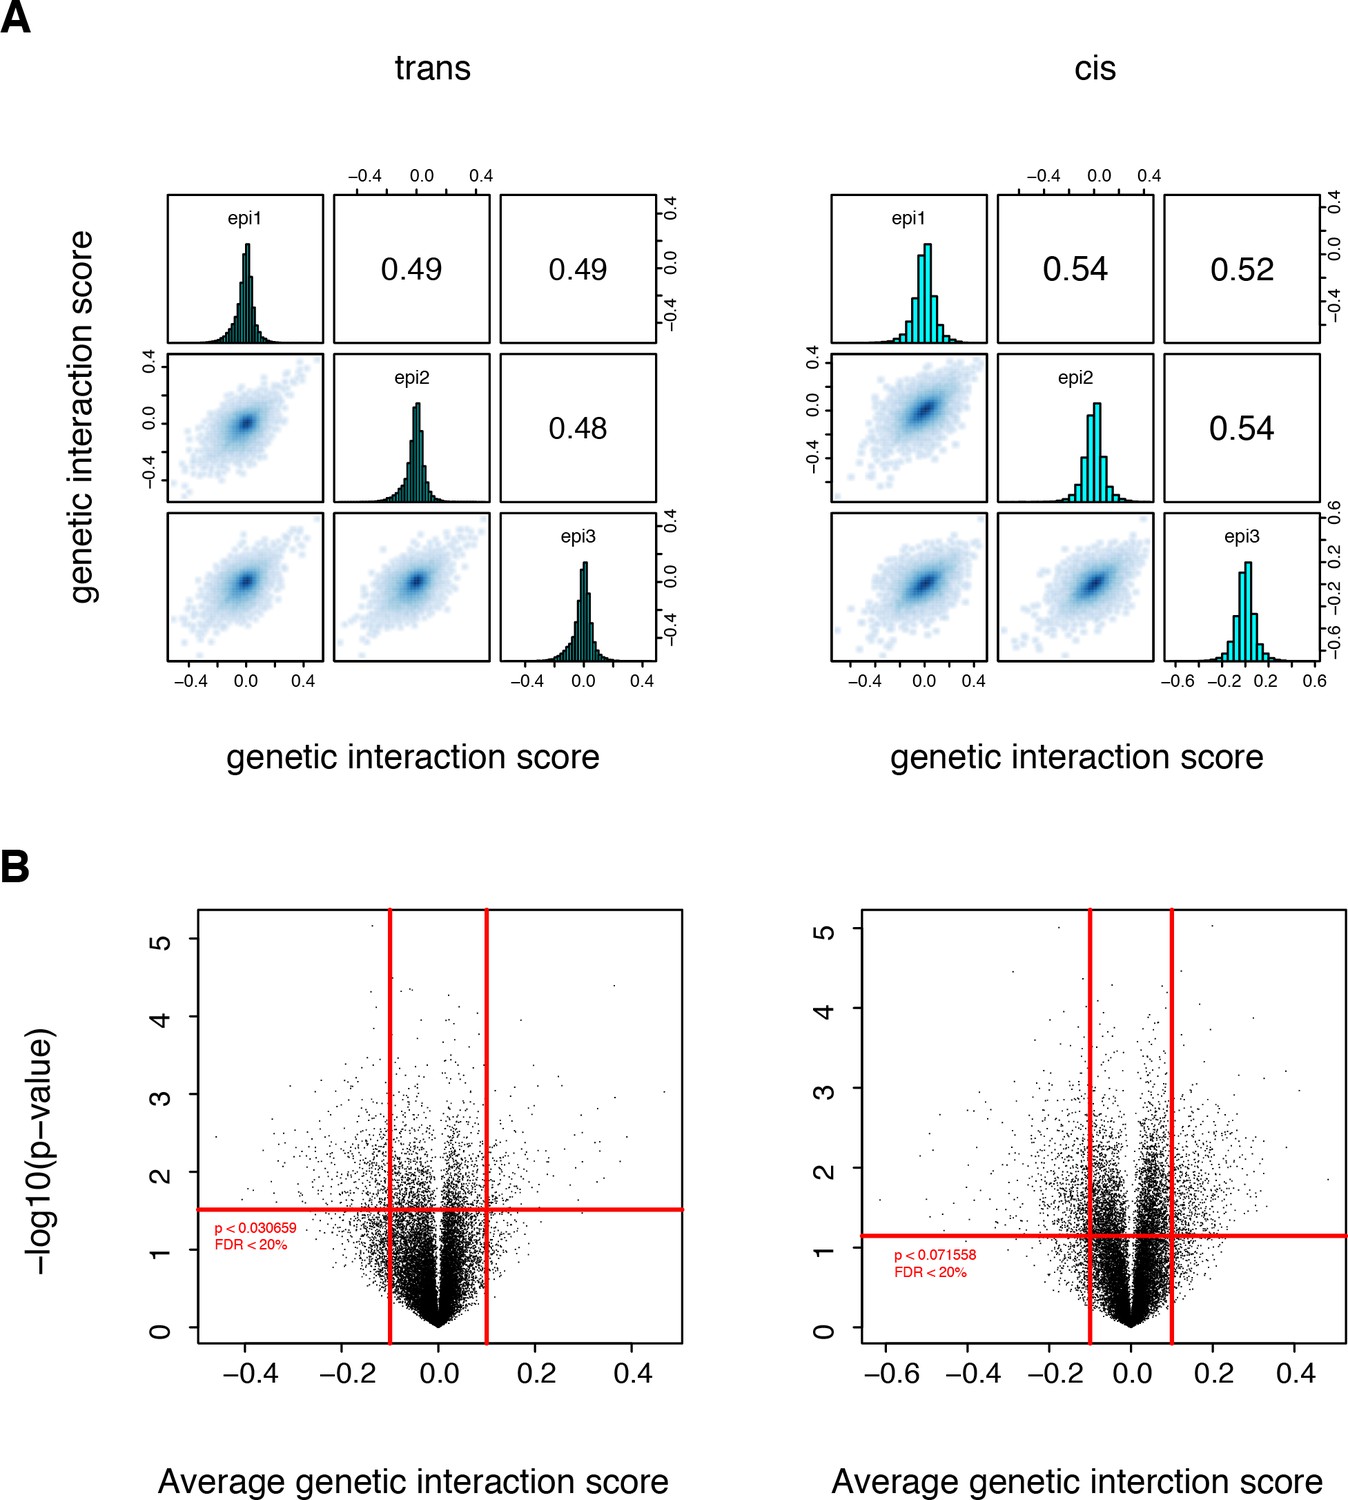
Significant structural genetic interactions in cis and trans.
(A) Correlation of structural genetic interaction scores between the three replicates of each library. Genetic interaction scores are from the thermodynamic model fitted on the two original libraries pooled together. (B) Volcano plot of the p-values of each double mutant as a function of the corresponding average genetic interaction scores. Data from the original libraries (not sub-sampled). Red lines represent the thresholds that were used to define the strong and significant genetic interactions used to compute the enrichment in structural features. Vertical lines, magnitude thresholds. Horizontal line, p-value threshold that corresponds to a FDR of 0.2.
Figure 5—figure supplement 5

Comparisons of the patterns of structural genetic interactions in cis and trans.
(A–B) Enrichment (Fisher’s exact test) for strong positive (green) or negative (purple) genetic interactions at different distance thresholds between the two mutated positions (A) and between different position types (B). These enrichments were also calculated after filtering out variants with 100 or less reads in any of the replicates input (bottom barplots on both panels), showing that the trends are the same even though the significance is lower with the stringent filter due to the smaller size of the dataset, especially for the trans library. The trans data analyzed here is restricted to amino acid substitutions reachable through single nucleotide changes. n = 17,290 and 14,118 for cis and trans, respectively, when filtering at 10 input reads, and 15,198 and 2,807, respectively, when filtering at 100 input reads. *, FDR < 0.1. **, FDR < 0.01. ***, FDR < 0.001. n.s., non significant.
Figure 5—figure supplement 6
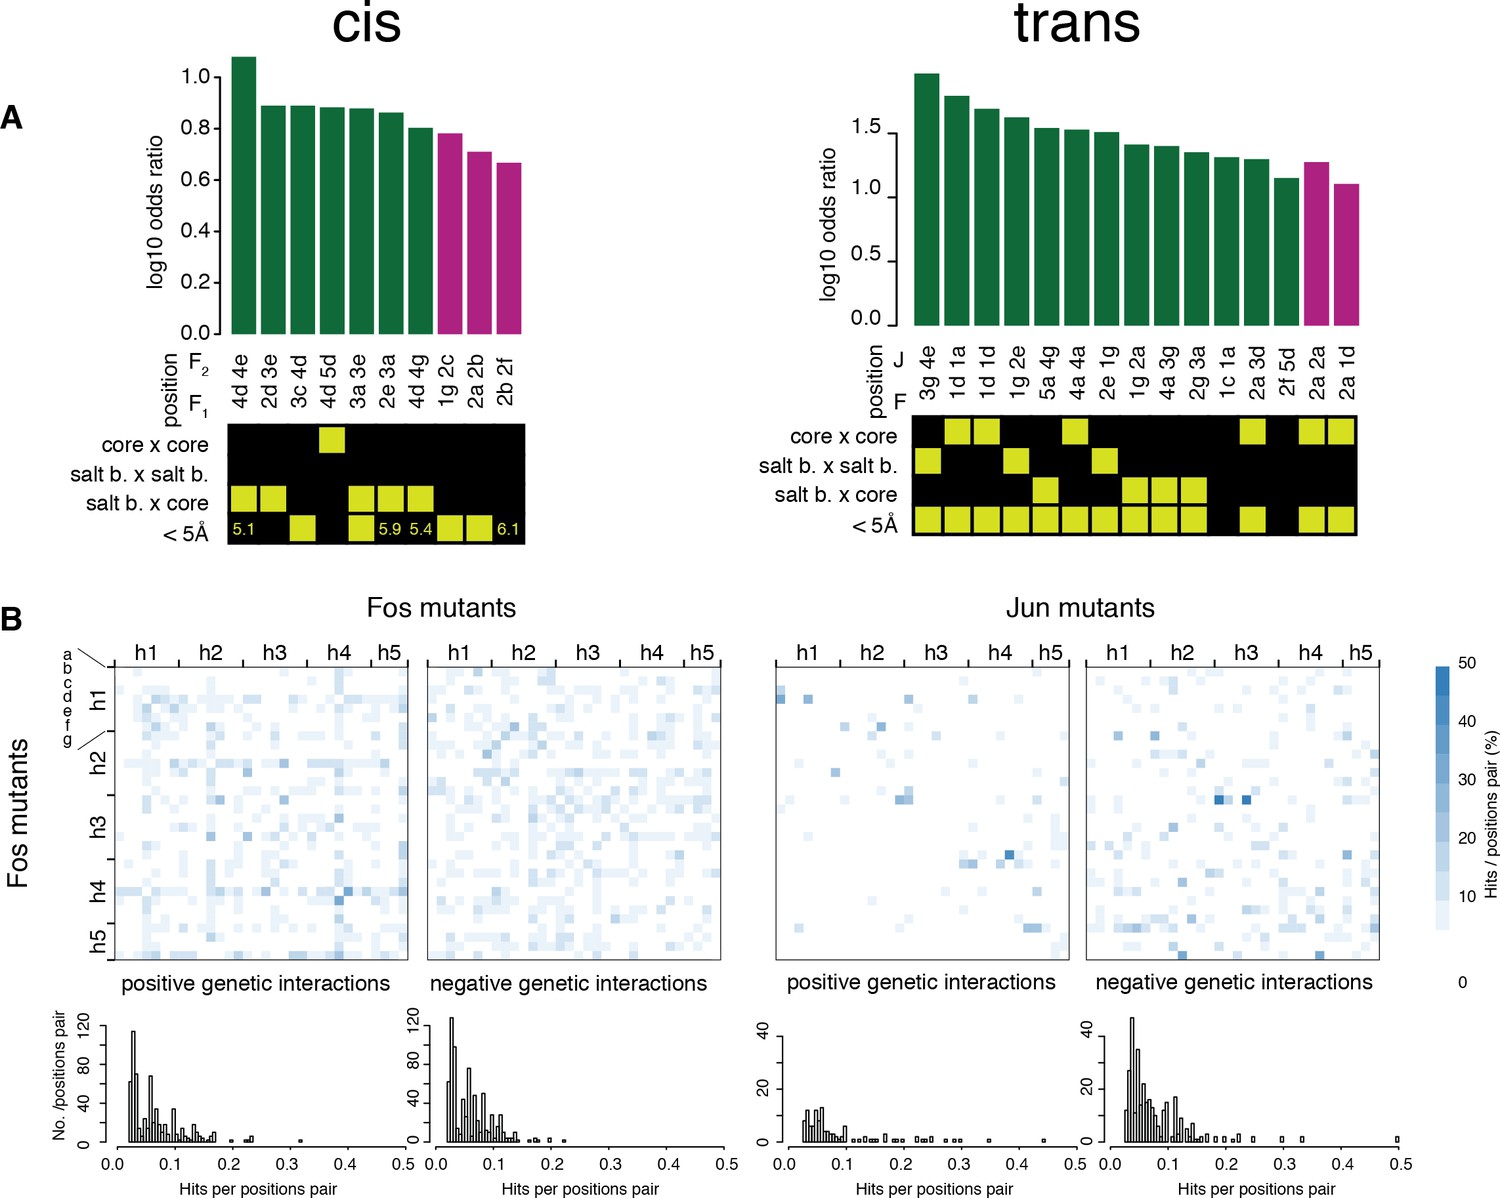
Comparisons of the pairs of positions enriched in cis and trans.
(A) Pairs of positions significantly enriched in positive (green) or negative (purple) genetic interactions (Fisher’s exact test, FDR = 10%). Each pair of positions is also classified according to its heptad position type and the distance between the two positions (bottom matrix, yellow cells). (B) Heatmap (top) and distribution (bottom) of percentage of significantly positive (left) or negative (right) genetic interactions per pairs of position. The trans data analyzed here is restricted to amino acid substitutions reachable through single nucleotide changes.
Figure 5—figure supplement 7

Robustness of the enrichments in structural features when sub-sampling to match single mutant effects.
Enrichments calculated from one of the sub-samples picked randomly. (A–B) Enrichment (Fisher’s exact test) for strong positive (green) or negative (purple) genetic interactions at different distance thresholds between the two mutated positions (A) and between different position types (B). *, FDR < 0.1. **, FDR < 0.01. ***, FDR < 0.001. n.s., non significant.
Figure 5—figure supplement 8

Robustness of enrichments in significant (FDR < 0.2) genetic interactions at different magnitude thresholds in the cis and trans libraries.
(A) Pairs of positions presented as significantly enriched in Figure 5—figure supplement 6A (magnitude threshold of 0.1). Enrichments and their corresponding FDRs were calculated at all 1024 pairs of positions, for each magnitude threshold independently. (B) Enrichments for different position types. Enrichments and their corresponding FDRs were calculated for each magnitude threshold independently. (C) Enrichments for pairs of mutations at difference distance threshold in the structure (pdb: 1fos). Enrichments and their corresponding FDRs were calculated for each magnitude threshold independently.
Figure 5—figure supplement 9
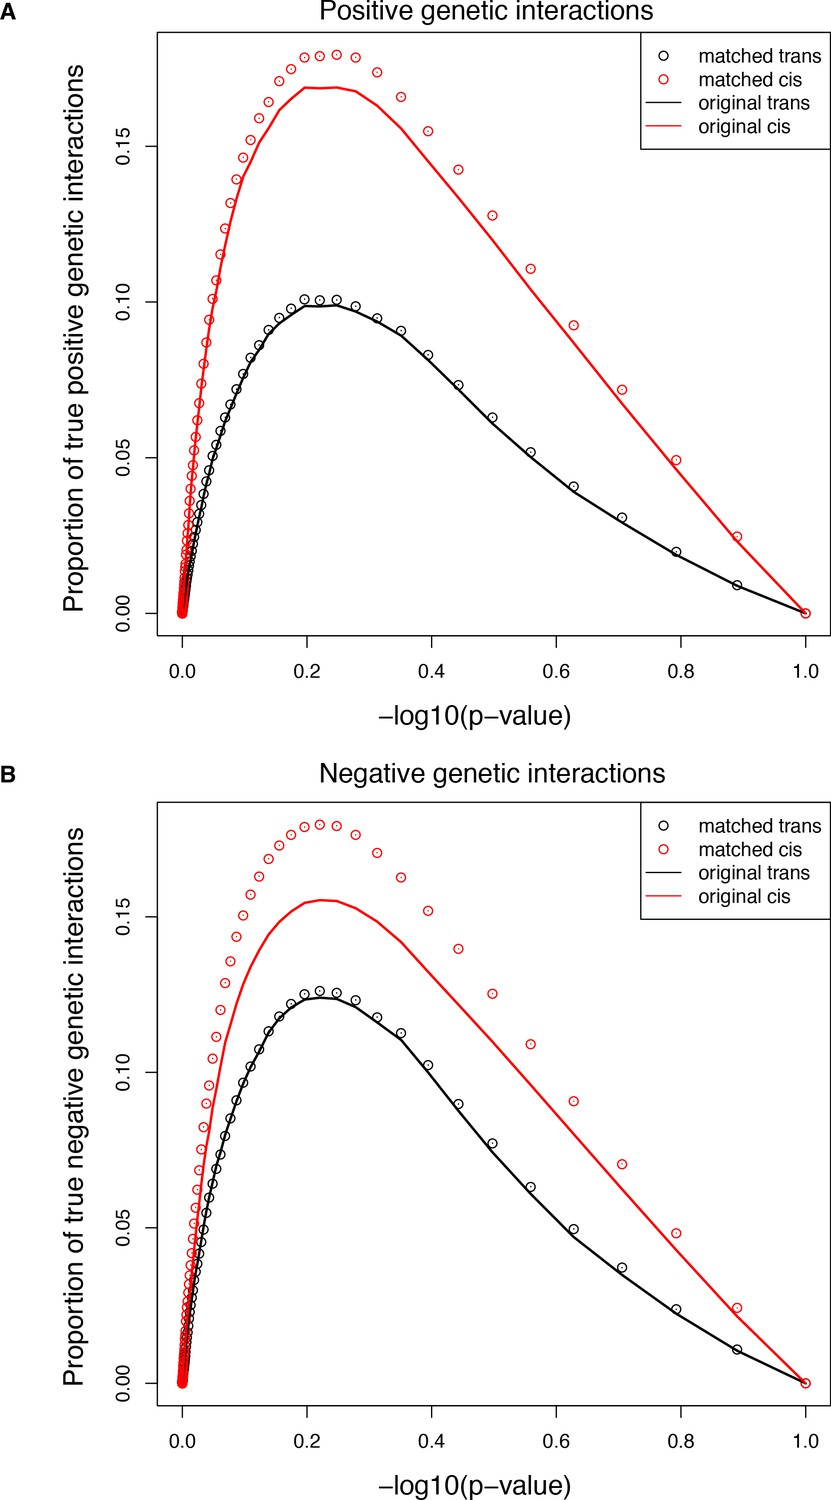
Comparisons of the extent of structural genetic interactions in cis and trans.
(A–B) Proportion of true positive (A) or negative (B) genetic interactions in the original (solid lines) or sub-sampled (open circles) libraries at different p-value cut-offs, showing that the higher prevalence of both positive and negative interactions in the cis library is not the consequence of the different distribution of single mutants effects. Error bars represent 95% confidence intervals around the mean of the 1000 sub-samplings. True interactions are calculated as the total number of interactions called significant at a given p-value threshold multiplied by the true discovery rate (1-FDR) corresponding to that p-value threshold in that library.
Additional files
-
Supplementary file 1
Data from the full trans library.
- https://doi.org/10.7554/eLife.32472.024
-
Supplementary file 2
Variance explained by physico-chemical amino acid features.
- https://doi.org/10.7554/eLife.32472.025
-
Supplementary file 3
Data from the restricted trans library.
- https://doi.org/10.7554/eLife.32472.026
-
Supplementary file 4
Data from the cis library.
- https://doi.org/10.7554/eLife.32472.027
-
Supplementary file 5
Primer sequences
- https://doi.org/10.7554/eLife.32472.028
-
Transparent reporting form
- https://doi.org/10.7554/eLife.32472.029
Download links
A two-part list of links to download the article, or parts of the article, in various formats.
Downloads (link to download the article as PDF)
Open citations (links to open the citations from this article in various online reference manager services)
Cite this article (links to download the citations from this article in formats compatible with various reference manager tools)
The genetic landscape of a physical interaction
eLife 7:e32472.
https://doi.org/10.7554/eLife.32472


